


Atmosphere 2024, 15(5), 527; https://doi.org/10.3390/atmos15050527 (registering DOI) - 26 Apr 2024
Abstract
Evapotranspiration (ET) is a major component of the water budget in Bottomland Hardwood Forests (BHFs) and is driven by a complex intertwined suite of meteorological variables. The understanding of these interdependencies leading to seasonal variations in ET is crucial in better informing water
[...] Read more.
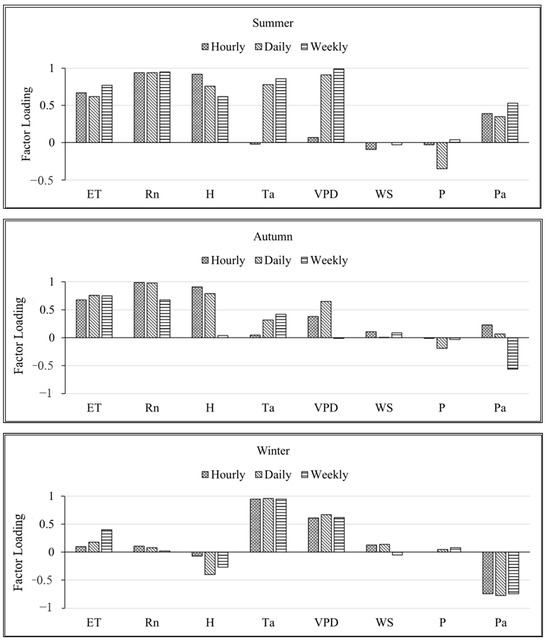
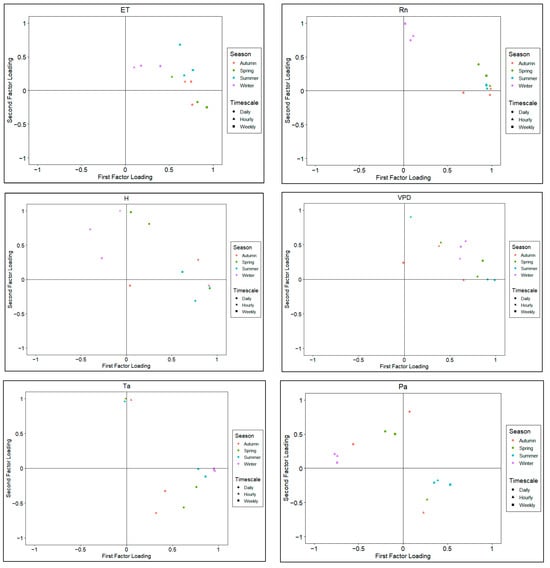
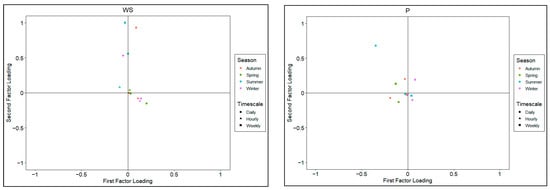
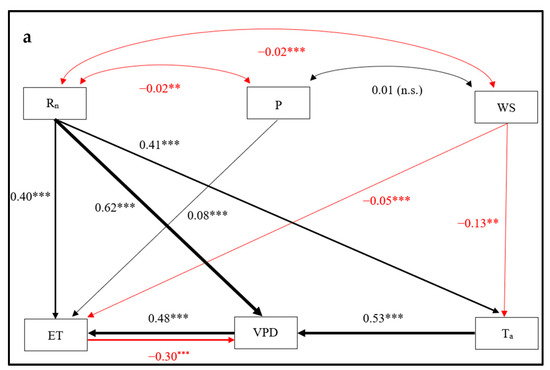
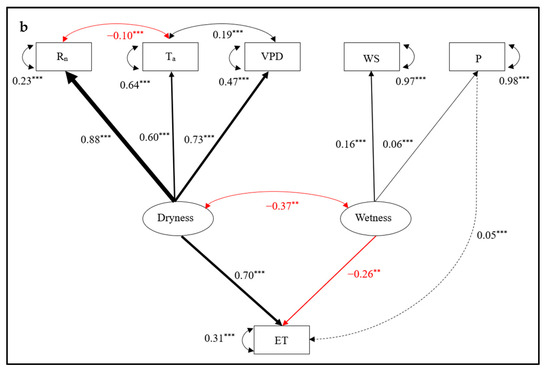
Evapotranspiration (ET) is a major component of the water budget in Bottomland Hardwood Forests (BHFs) and is driven by a complex intertwined suite of meteorological variables. The understanding of these interdependencies leading to seasonal variations in ET is crucial in better informing water resource management in the region. We used structural equation modeling and AIC modeling to analyze drivers of ET using Eddy covariance water flux data collected from a BHF located in the Russel Sage Wildlife Management Area (RSWMA). It consists of mature closed-canopy deciduous hardwood trees with an average canopy height of 27 m. A factor analysis was used to characterize the shared variance among drivers, and a path analysis was used to quantify the independent contributions of individual drivers. In our results, ET and net radiation (Rn) showed similar variability patterns with Vapor Pressure Deficit (VPD) and temperature in the spring, summer, and autumn seasons, while they differed in the winter season. The path analysis showed that Rn has the strongest influence on ET variations via direct and indirect pathways. In deciduous forests like BHFs, our results suggest that ET is more energy dependent during the growing season (spring and summer) and early non-growing season (autumn) and more temperature dependent during the winter season.
Full article
(This article belongs to the Section Meteorology)
►
Show Figures
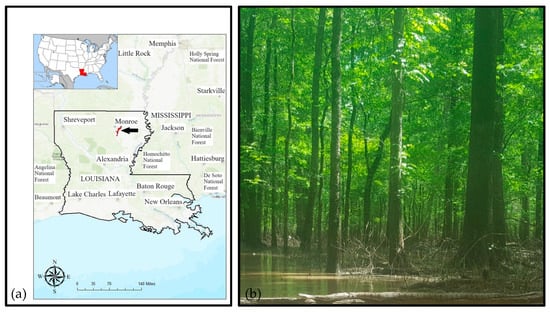
Figure 1


