Article

Monitoring Snow Cover in Typical Forested Areas Using a Multi-Spectral Feature Fusion Approach

1
College of Mining Engineering, Taiyuan University of Technology, Taiyuan 030024, China
2
State Key Laboratory of Grassland Agro-Ecosystems, Lanzhou University, Lanzhou 730000, China
3
College of Atmospheric Sciences, Lanzhou University, Lanzhou 730000, China
*
Author to whom correspondence should be addressed.
Atmosphere 2024, 15(4), 513; https://doi.org/10.3390/atmos15040513
Submission received: 21 March 2024 / Revised: 10 April 2024 / Accepted: 19 April 2024 / Published: 22 April 2024
(This article belongs to the Special Issue Precipitation Monitoring and Databases)

Abstract

:
Accurate snow cover monitoring is greatly significant for research on the hydrology model and regional climate variation, especially in Northeast China where forests cover almost forty percent of the total area. However, effectively monitoring snow cover under the forest canopy is still challenging with either in situ or remote sensing observations. The global SNOWMAP algorithm pertinent to the fixed normalized difference snow index (NDSI) threshold is, therefore, no longer applicable in a typical forested region of Northeast China. In order to achieve the goal of improving the accuracy of monitoring snow cover in areas with forest, utilizing MOD09GA and MOD13A1 products, a new approach of snow mapping was developed in this study, and it exploits the fusion and coupling of spectral features by integrating and analyzing the normalized difference forest snow index (NDFSI), the normalized difference vegetation index (NDVI), and the NDSI index. Then, Landsat 8 OLI images of high resolution were used to evaluate snow cover mapping precision. The experimental results indicated that the NDFSI index combined with the NDVI index showed great potential for extracting the snow cover distribution in forested regions. Compared with the snow distribution obtained from the Landsat 8 images, the average bias and FAR (false alarm ratio) values of snow cover mapping obtained by this algorithm were 1.23 and 13.54%, which were reduced by 1.98 and 29.36%, respectively. The overall accuracy of 81.31% was reached, which is improved by 20.19%. Thus, the snow classification scheme combining multiple spectral features from MODIS data works effectively in improving the precision of automatic snow cover mapping in typical forested areas of Northeast China, which provides essential support and significant perspectives for the next step of establishing a runoff model and rationally regulating forest water resources.

1. Introduction

Seasonal snow cover, as one of the most critical components of the Earth’s chemical, climate, and biological cycling systems, can dominate the global radiation budget balance and general circulation effects of the atmosphere because of its high surface reflectance of solar radiation and low thermal diffusivity. In addition, snow cover has a significant impact on future climate, biogeochemical, and hydrological cycles [1,2]. Meltwater from seasonal snow and permanent glaciers provide the main supplies of fresh water for nearly 20 percent of the total human population on Earth [3]. In particularly, snowmelt accounts for over 70 percent of the runoff supply in alpine forests in desert climate regions of northwest America [4]. Thus, the accurate and timely retrieval of the spatial distribution pattern of seasonal snow cover is of crucial significance to agriculture, hydropower energy production, water resource management, and even human activities [5,6].
Generally, there are two methods to measure snow information. Traditional in situ measurements are based on a limited number of meteorological stations. However, this method cannot provide detailed information about snow cover at a regional scale. Following several decades of development, satellite-based remote sensing technology has shown great efficiency and is a reliable alternative to the near-real-time inspection of seasonal snow cover variation at the global and regional scales. A large number of remote sensing products were developed to estimate snow cover and snow water equivalent (SWE) information in the past few decades, such as products from the scanning multichannel microwave radiometer (SMMR), special sensor microwave/imager (SSM/I), advanced very high-resolution radiometer (AVHRR), advanced microwave scanning radiometer-earth observing system (AMSR-E), Microwave Radiation Imager-FY3B (MWRI), moderate-resolution imaging spectroradiometer (MODIS), interactive multi-sensor snow and ice mapping system (IMS), microwave radiation imager-FY3B (MWRI), and so on [7,8,9,10,11]. Passive microwave remote sensing is limited by its low spatial resolution and can only be applied to global- or hemispherical-scale snow detection. The spatial resolution and misjudgment rate are often a problem in forested regions, especially in mountainous areas—coarser-resolution products can capture less of the environmental variation in a relatively heterogeneous environment. Among the products mentioned above, the MODIS remote sensing product has become one of the main dataset sources for monitoring snow cover at the regional and basin scales because of its high spatial resolution of 500 m, temporal resolution of one day, global coverage, and convenience of use in most snow-covered areas. Numerous studies have demonstrated that MODIS data have good performance in detecting snow and can achieve high overall accuracy around the world [12,13,14].
Snow cover information has been detected through different algorithms, of which the most widely and internationally used one is the threshold method based on NDSI. Snow cover exhibits relatively strong spectral reflectance characteristics in the visible and near-infrared (NIR) bands and weak reflectance characteristics in the shortwave infrared (SWIR) band, while that of vegetation shows a rapid increase from the red band to the near-infrared band [10]. According to the above reflection characteristics of snow, the reflectance of the fourth (0.55–0.57 μm) and sixth band (1.63–1.65 μm) of MODIS data is utilized to calculate the NDSI value to identify snow cover from numerous land surface feature types. It is noteworthy that, when retrieving snow cover mapping through satellite-based optical images, there is always a challenge in vegetation-covered areas, especially in areas with a large proportion of forests. The detection of snow under forest is seriously affected by the canopy, leading to an underestimation of snow cover [15]. When snowfall occurs in forest regions, the vegetation canopy will partially block the radiation signals received by satellite sensors from the land surface, thereby changing the observed reflectivity characteristics. When the snowfall is heavy, it may even completely block the signal [16]. When the snowfall continues to increase, snow falling on the canopy will slide to the ground surface. At this time, surface snow cover information will be obscured by the vegetation canopy, resulting in the sensor receiving a mixed spectral information of snow cover and canopy. Snow detection only using NDSI is, therefore, not accurate enough under the forest canopy [17,18]. Studies have shown that, excluding the influence of terrains, the misjudgment rate of snow cover mapping may approach 1% in areas with a relatively small forest coverage, while it can reach 15% in areas with a relatively large forest coverage [19].
To handle snow-covered areas mixed with forest, a lot of effort has been put into reducing the misjudgment rate of snow cover mapping. Through analyzing snow spectral characteristics under the shadow of the forest canopy, Klein, et al. [20] believed that the NDSI threshold should be decreased to the range between 0.l and 0.4 when identifying snow pixels in areas with higher NDVI values. SAITO and YAMAZAKI [21] proposed the S3 index to reduce the influence of the vegetation canopy on snow pixels by using the reflectance of the red, NIR, and SWIR bands, which estimated snow cover more accurately. In small watersheds covered by dense forests in Norway, a sub-pixel linear spectral mixture model was developed to classify snow pixels, which comprehensively considered the snow interception of the wind and vegetation canopy, as well as the influence of terrain and forest on snow redistribution. However, these input variables that the model needs cannot be obtained by remote sensing technology [22]. Based on the imagery from multi-angle imaging spectroradiometer (MISR) data, Wang, et al. [23] used the difference between the multi-angle information in winter and summer to conduct snow cover mapping in the Tianshan forest area, but the low resolution of MISR data itself makes it difficult to extract high-precision snow cover. The artificial neural network (ANN) method has been used in an attempt to extract fractional snow cover (FSC) from IKONOS multispectral images in alpine-forested areas and achieved very low error values of 0.0002. Nevertheless, the process of machine learning is complicated and there is always an overfitting problem [24]. In alpine regions of the Altai Mountains in China with a large proportion of forests, Wang et al. [25] found that the near-infrared band instead of the visible band is more suitable for snow cover mapping and proposed NDFSI. Recent studies have also shown that optimizing the NDSI threshold can improve the accuracy of snow cover mapping in forested areas in specific regions [26,27]. This algorithm mainly uses empirical observation values to formulate universal rules and is a prior knowledge-driven method [28]. Using the FY-4A remote sensing image from high-altitude forested areas in Xinjiang, Zhang, et al. [29] proposed an FSC estimation method based on a multi-scale feature fusion network, while the model accuracy and generalization ability are not high. Luo, et al. [30] utilized time-lapse photography and machine-learning technology to map under-canopy snow cover with an accuracy of 67%, and the results also indicated that the model performance is highly sensitive to changes in forest coverage and solar conditions.
Here, taking Northeast China as an example, this work primarily aims to reduce the misjudgment rate of snow cover mapping in regions with a large proportion of forests based on the MODIS reflectance product and to validate the method with Landsat 8 OLI images. Section 2 elaborates on the research area and data source description. In Section 3, the specific methodology is explained in detail. The results are reported and discussed in Section 4. Lastly, the main conclusions obtained from this study are outlined in Section 5.

2. Research Area and Data

2.1. Research Area

Seasonal snow cover in Northeast China (from 38°40′ to 53°34′ N and from 115°05′ to 135°02′ E) lasts for a long time and the region has a large annual snowfall in winter. The other two widely distributed stable snow cover areas are located in Xinjiang and the Tibetan Plateau, respectively [31]. A high-latitude location makes it one of the coolest areas in China with a severe and long winter. In northern regions, seasonal snow may cover the ground surface for as long as six months [32], which also increases the possibility of winter snow disasters and spring floods caused by sudden snowmelt runoffs. In addition, there is also a large area of forests distributed in Northeast China (the Northeast, Southwest, and Southern Forest are the three major forest regions in China). The area of forests can account for forty percent of Northeast China, making it the most abundant vegetation type of the land surface in this region [33]. The typical forested areas in Northeast China are mainly located in the Changbai Mountains, the Lesser Khingan Range, and northern areas of the Greater Khingan Range. According to the IGBP classification rules, there are five main forest types in the study area comprising evergreen needle leaf, evergreen broadleaf, deciduous broadleaf, deciduous needle leaf, and mixed forest. The distribution of snow in forest has typical regional characteristics, which makes Northeast China an ideal research area for developing snow monitoring algorithms in regions with a large proportion of forests.

2.2. Data

2.2.1. Landsat 8 OLI Data

Four Landsat 8 images of 30 m spatial resolution were downloaded in this research. All downloaded Landsat data are level 1-TP and are in UTM/WGS84 projection. The cloud cover information of each image is shown in Table 1. The five scene images selected in this study are mainly distributed in a typical forested area of Northeast, China (Figure 1). Of these five images, one (S2) was used for the development of the snow monitoring algorithm in the forested area, and the other four (S1, S3, S4, and S5) were used to validate and compare it with cloud-free snow products.

2.2.2. MODIS Products

The MODIS MOD09GA surface reflectance product from the same period and area as the Landsat OLI data was collected. The MOD13A1 data from the closest period of Landsat 8 OLI data were also selected as the MOD13A1 vegetation index product has a 16-day temporal resolution. In addition, the MOD10A1/MYD10A1 snow products were applied in the generation of the cloud-free snow cover product for a comparison with the results of this study. It is worth noting that version 006 MOD10A1/MYD10A1 products have changed significantly compared with version 005 products. In version 006 products, only NDSI is available. This update gives the product greater operability, as users can generate a binary snow product through NDSI values according to specific needs. The specific coding information of MOD10A1/MYD10A1 products has been provided in the user guide [34]. All four products (Version 006) of 500 m spatial resolution were obtained from a NASA website (https://earthdata.nasa.gov/, accessed on 6 October 2022). The MOD09GA was used to extract the daily surface reflectance of various bands of MODIS for computing NDSI and NDFSI. And the MOD13A1 product was used to extract NDVI values.

2.2.3. IGBP Land Cover Type Data

The MCD12Q1 data provide the annual global distribution of land cover types with a resolution of 500 m. The International Geosphere-Biosphere Program (IGBP) is one of eight land cover classification schemes (https://earthdata.nasa.gov/, accessed on 12 June 2022). The data are obtained through the supervised classification of reflectance data from MODIS’s Terra and Aqua satellites, and further optimized for specific categories through post-processing and auxiliary data. This product divides global land cover into 17 types consisting of 11 natural vegetation types, 3 developed and anthropogenic types, and 3 non-vegetation types [35]. In this study, the MCD12Q1 data from 2018 were reclassified into the four major categories of forested areas, non-forested areas, water, and permanent snow and ice.

3. Methodology

3.1. Landsat OLI Snow Cover Mapping

The Landsat 8 OLI data were used to produce a binary snow cover map. First, we processed the OLI images by using the radiation calibration and FLAASH atmospheric correction model in ENVI 5.5 software. Then, the third (green band) and sixth (shortwave-infrared band) bands of the OLI images were utilized to calculate NDSI based on the SNOWMAP algorithm [36]. Based on the reflection characteristics of water bodies in the visible light and SWIR bands, the classification rule of an NDSI value no less than 0.4 and a fifth band higher than 11% can effectively extract snow pixels and reduce the impact of water body pixels. Last, NDFSI was introduced to improve the identification accuracy of snow in forested areas [25]. Thereby, a binary Landsat snow image with a spatial resolution of 30 m, which can represent the true distribution of snow cover on the surface, was generated and then upscaled to a grid size of 500 m in ENVI 5.5. Only when the output pixel value is greater than 0.5 will this pixel be defined as snow.

3.2. Snow Cover Mapping Based on Multi-Spectral Feature Fusion and Coupling

There are still various limitations in using remote sensing technology to map snow cover in areas with a large proportion of forests, mainly as it is driven by a high vegetation canopy and climatic conditions. Passive microwave sensors can penetrate clouds and obtain ground snow information without being affected by adverse weather conditions. And the spatial resolution and misjudgment rate are often a problem in forested regions. Exploring a multi-spectral feature fusion and coupling approach using optical satellite spaceborne data instead of a microwave-based one demonstrates enormous potential for mapping snow cover in areas with a large proportion of forests [25].
When using optical remote sensing satellite technology, the forest occlusion effect has always been one of the main factors affecting snow recognition. In forested areas in winter, the canopy may intercept the falling snow due to the blocking effect of the branches and leaves of the trees [37]. At this time, the sensor receives a mixed spectral information of snow cover and canopy in the snow-covered forest. Meanwhile, the intercepted snow on the canopy increases albedo, resulting in larger NDSI values and smaller NDVI values [38]. Thereby, it is worth noting that the sensitivity of NDVI to snow distribution still supports it as a suitable canopy index despite the existence of many other vegetation indices [39]. In addition, it has been proven that the near-infrared band can more effectively detect snow distribution in forest areas than the visible light band [25]. In order to obtain a more accurate distribution pattern of snow cover in areas with a large proportion of forest, the green band was replaced with the near-infrared band, and NDFSI values were calculated for snow cover mapping in forest regions [25]. Furthermore, NDVI was also introduced to eliminate interference from vegetation.
In this study, the reclassified MCD12Q1 product was first applied to distinguish the forest areas and areas without forests in Northeast China. Then, the Landsat OLI image S2 was chosen to develop snow-mapping algorithms in forest areas. Zones L1 and L2 were used to extract the spectral band ratio (NDFSI and NDVI) in typical forest areas with snow and forest areas without snow, respectively (Figure 1). Feature information of Green, SWIR, and NIR was extracted for the further establishment of the algorithm scheme, coupled with the determination of the existence of large-scale snow cover in forested regions, which assists in reducing the interference of noise data. Multi-spectral feature bands are fused and coupled with snow cover where a qualitative relationship exists between the feature bands and snow cover. A specific correlation intensity can be determined empirically and semi-analytically to some extent, and, thus, the obtained information from multiple feature bands is integrated to determine the snow cover, reducing the computational cost and averting a complex model architecture design. Therefore, snow pixels in forest areas were recognized based on the threshold value of NDFSI and NDVI. In areas without forests, the NDSI threshold value was selected to be 0.4 to identify snow. NDSI [19], NDFSI [25], and NDVI [40] were calculated as suggested by previous papers, as follows:
N D S I = G r e e n S W I R G r e e n + S W I R
N D F S I = N I R S W I R N I R + S W I R
N D V I = N I R R e d N I R + R e d
where NIR, SWIR, Green, and Red are all or part of the atmospheric corrected surface reflectance in the near-infrared band, shortwave-infrared band, green, and red visible band, respectively.

3.3. Cloud-Free Snow Cover Product Development

The cloud-free snow cover product is used for a comparative analysis with the mapping results obtained in this study. This product is created by the first author of this article [13] and has been proven to be of great application value in the field of snow remote sensing [41,42]. Due to the fact that the 006 version of the product only includes NDSI values and does not have a binary snow cover, the MOD10A1 and MYD10A1 first need to be converted into binary products based on the NDSI value. The traditional NDSI critical value of 0.4 was selected to develop the binary snow data [19]. When the NDSI of a pixel is between 40% and 100%, this pixel is identified as snow; otherwise, this pixel is identified as snow-free. Lastly, according to the cloud removal algorithm, binary snow cover distribution images (500 m spatial resolution) were generated and compared with the mapping results obtained in this study.

3.4. Accuracy Assessment

Landsat 8 images with a high resolution were selected as the surface observation truth to measure the accuracy and precision of snow cover mapping based on the multi-spectral feature fusion and coupling approach in forest areas, and the cloud-free snow cover product was compared with the results in this research. Three kinds of evaluations were generally used in previous research, including overall accuracy (OA), bias (BIAS), and false alarm ratio (FAR) [26,43,44]. OA represents the overall detection precision, which is the proportion of pixels that are completely correctly identified (snow to snow and snow-free to snow-free). BIAS means the ratio between the quantity of snow pixels detected in this study and the quantity of snow pixels detected in the Landsat reference images, which can represent the underestimation of the tested images for snow (BIAS value < 1), overestimation (BIAS value > 1), and no deviation (BIAS value = 1). FAR is defined as the fraction of false snow pixels recognized as snow by tested images, but not actually covered by snow in the Landsat OLI images. The higher the FAR value, the greater the serious misjudgment rate. Below are the calculation formulae for the OA [43], BIAS [44], and FAR [26] metrics as suggested by previous papers, and the confusion matrix is shown in Table 2.
O A = a + d a + b + c + d
B I A S = a + c a + d
F A R = c c + d

4. Results

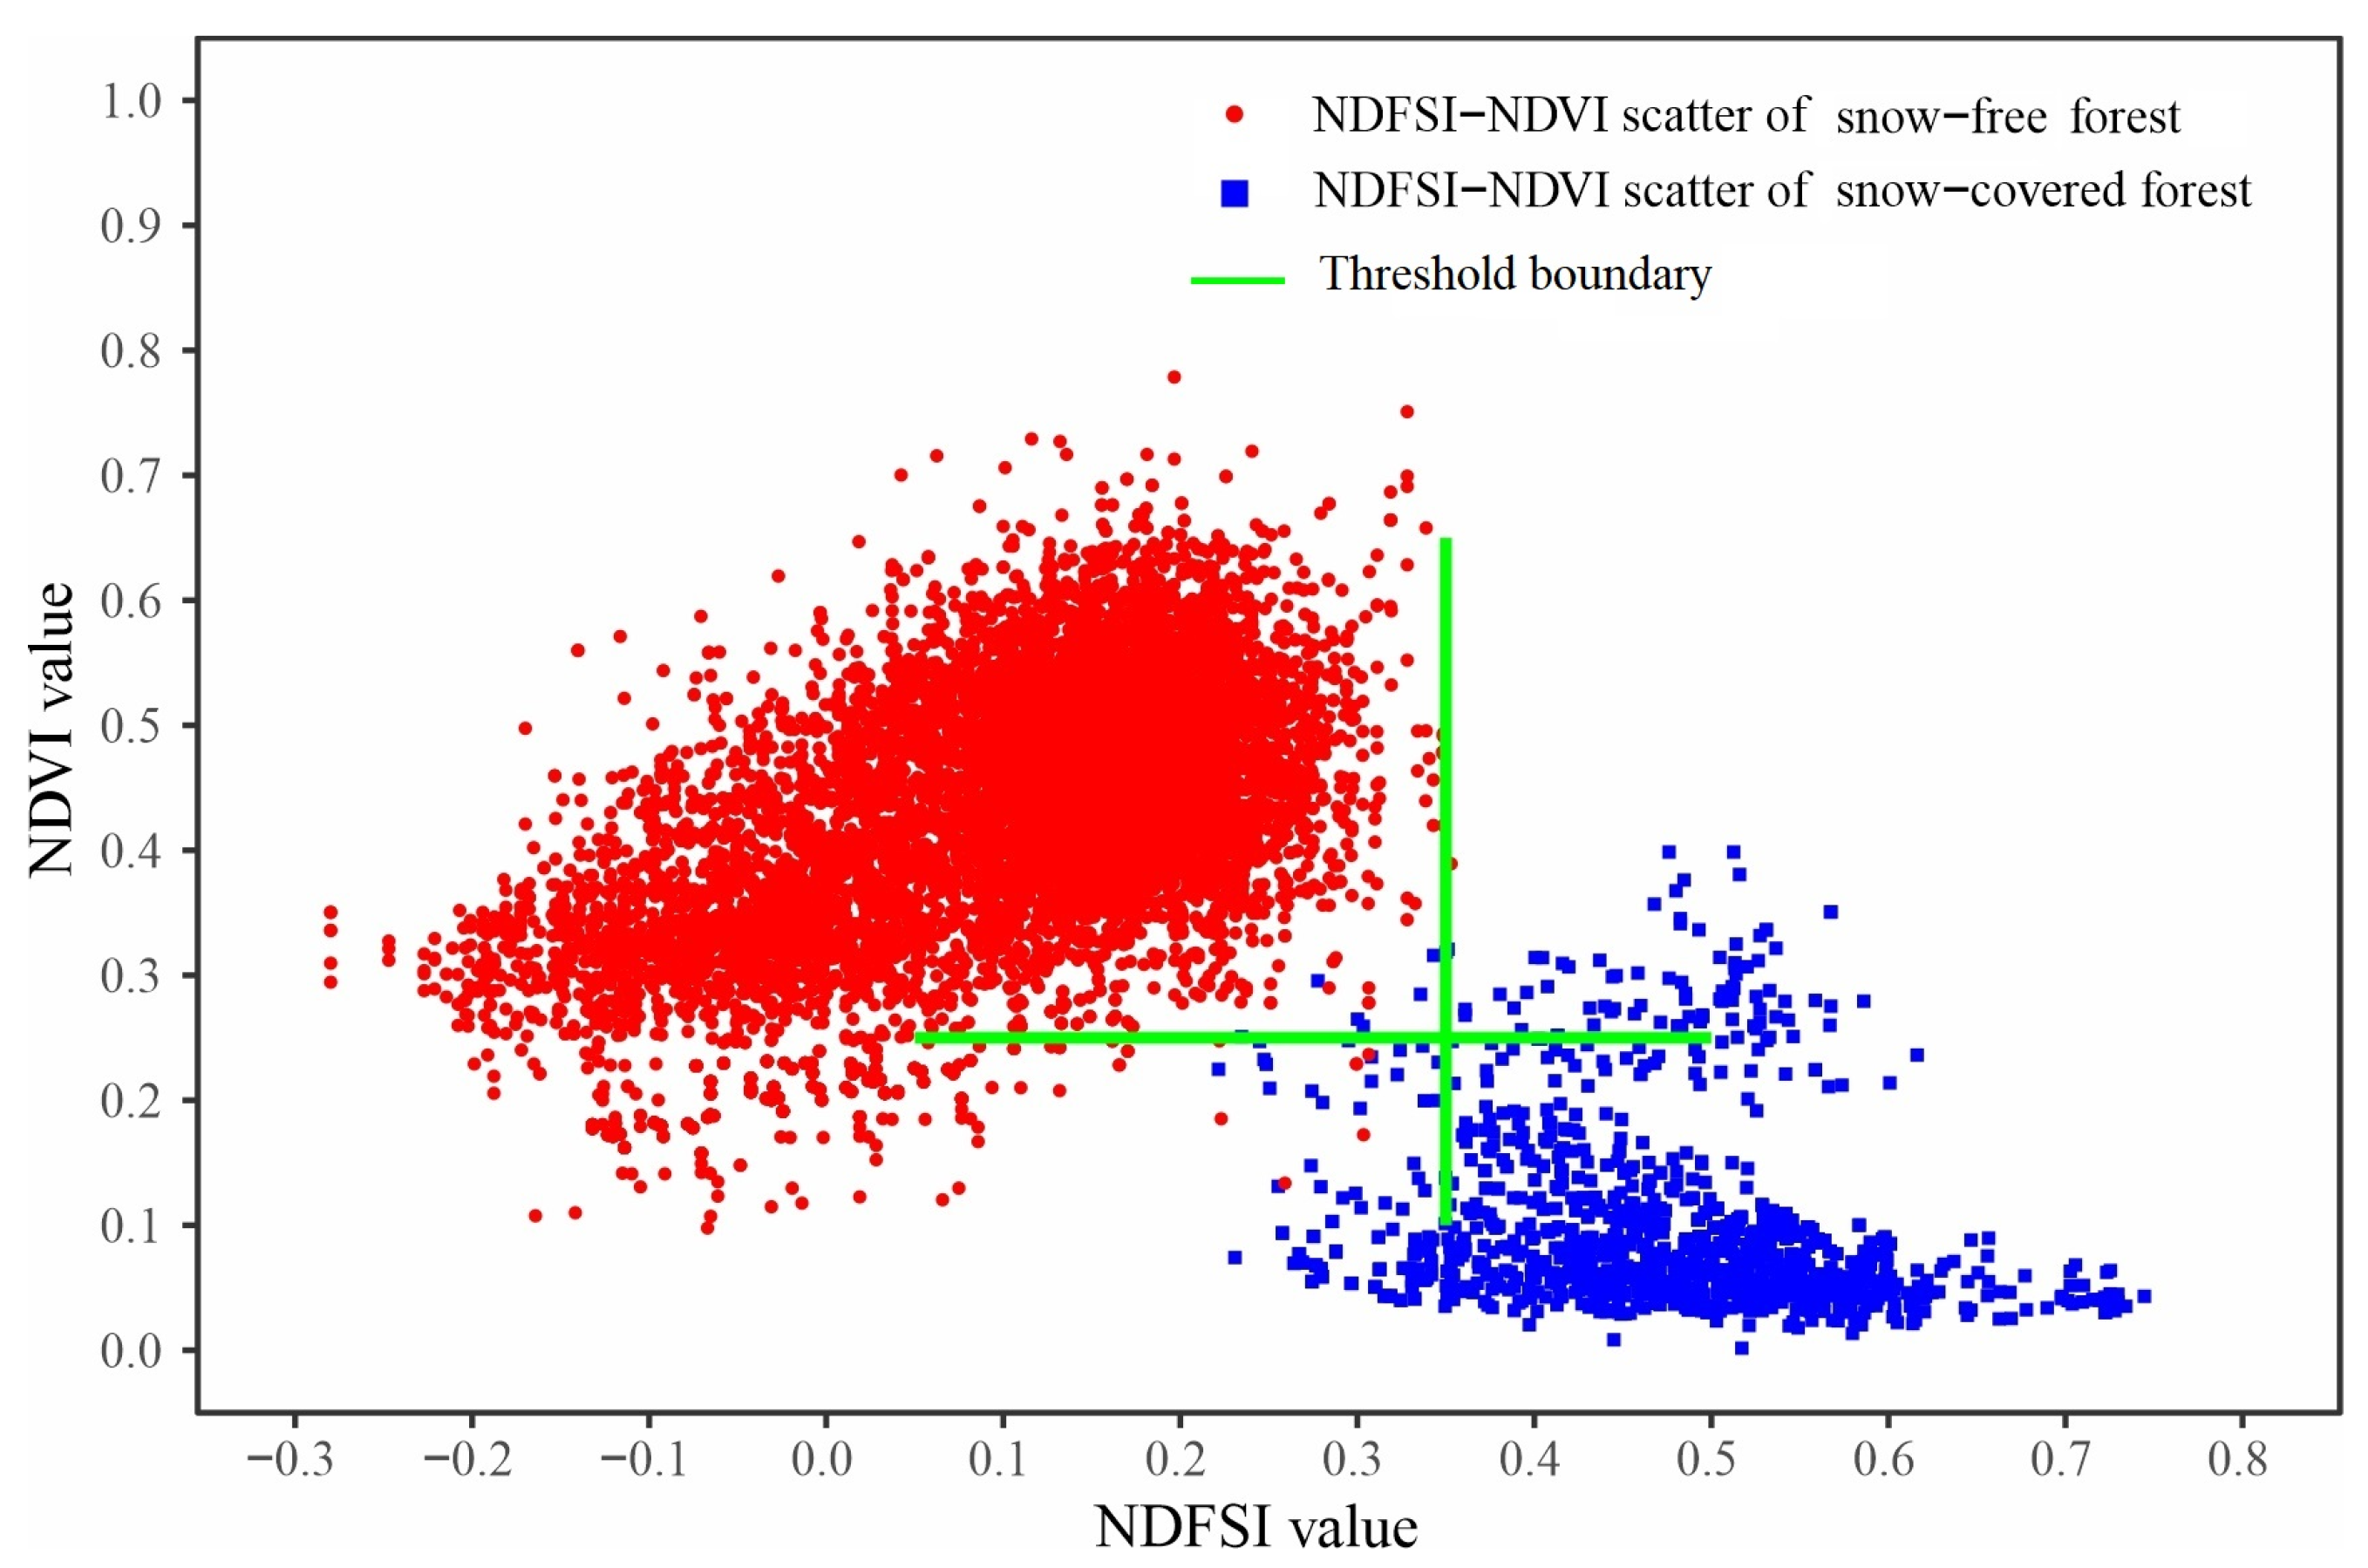
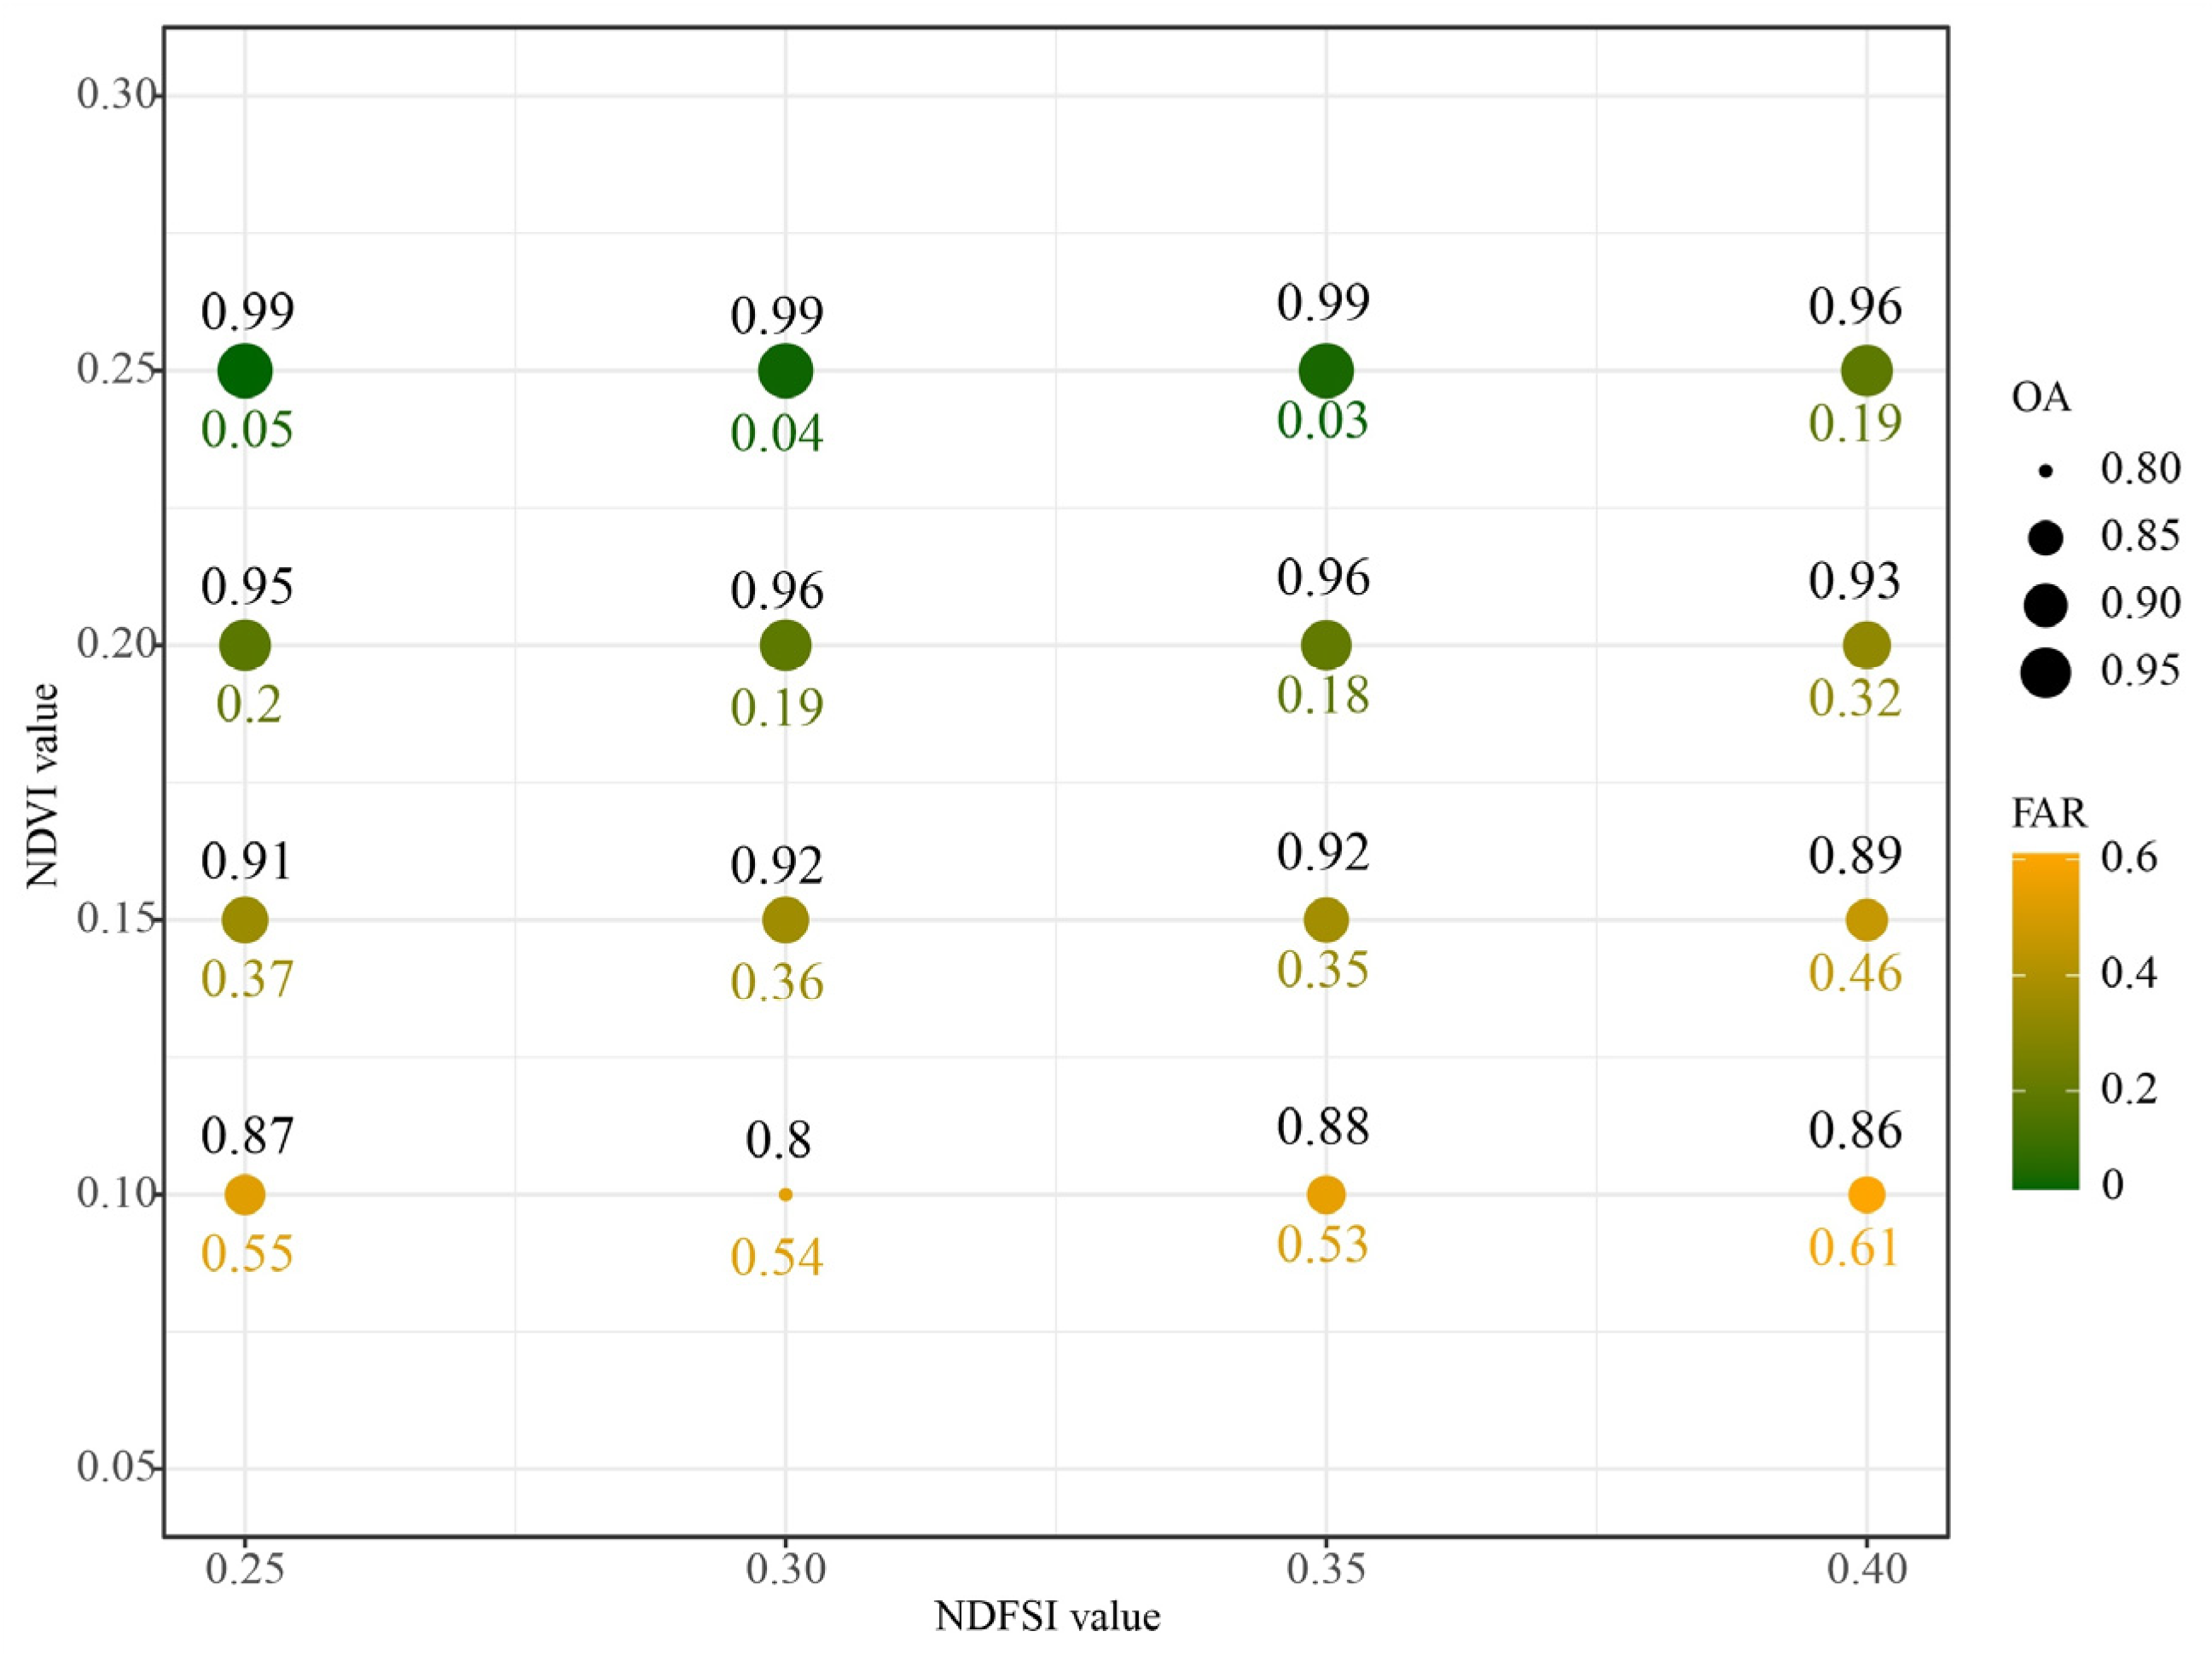
4.1. Snow Cover Detection Based on NDFSI, NDVI, and NDSI

Based on the MCD12Q1 product and Landsat S2 (Zone L1 and L2) images, the experimental statistical results of the NDFSI-NDVI value in forest areas without snow and forest areas with snow are shown in Figure 2. Compared with the traditional NDSI for detecting snow, NDFSI has more distinguishable spectral characteristics between forest areas with snow and forest areas without snow. As can be seen from the scatter plot, the NDFSI values of the pixels in forest areas with snow are significantly higher than those in forest areas without snow, while NDVI is completely different. The pixels of forest areas with snow have lower NDVI values compared with those of forest areas without snow. As shown in Figure 2, dots of the same color are clustered while dots of different colors are separated, whereby the featuring information of NDFSI and NDVI can be combined to distinguish forest areas without snow and forest areas with snow. The green line in Figure 2 can approximately locate the thresholds of NDFSI and NDVI, which are around 0.35 and 0.25, respectively.
According to the scatter plot distribution of the NDFSI-NDVI value, it is found that, when NDFSI is between 0.25 and 0.4 and NDVI is between 0.1 and 0.25, there is a significant difference between snow-free and snow-covered forest areas. Therefore, when the NDFSI is greater than 0.25–0.4 and the NDVI is less than 0.1–0.25, the area is classified as a snow-covered forest, and vice versa—the reverse condition is classified as a snow-free forest. In order to further determine the thresholds more objectively and scientifically, the NDFSI values from 0.25 to 0.4 were divided into four intervals with a step size of 0.05, and the NDVI values from 0.1 to 0.25 were divided into four intervals with a step size of 0.05. This can generate 16 corresponding combinations. For example, when NDFSI > 0.25 and NDVI < 0.1, it is determined that there is a snow-covered forest area; when NDFSI < 0.25 and NDVI > 0.1, it is determined that there is a snow-free forest area; and the combination is carried out in sequence. Finally, the OA and FAR values corresponding to the 16 combinations were obtained. When the OA value is close to 1 and the FAR value is close to 0, the corresponding NDFSI and NDVI are the optimal thresholds. From Figure 3, it can be seen that the OA and FAR values corresponding to the optimal threshold are 0.99 and 0.03, respectively. Therefore, the thresholds of NDFSI and NDVI are eventually selected to be 0.35 and 0.25, respectively.
In this study, the integrated multi-spectral feature information from the three indices, NDFSI, NDVI, and NDSI, were used to detect snow cover information in Northeast China. The specific snow classification scheme is as follows: (1) for areas without forests, if the NDSI value > 0.4 and NIR > 0.11, this pixel will be recognized as snow; (2) for areas with forests, if the NDFSI value > 0.35 and the NDVI value < 0.25, this pixel will be recognized as snow in forest; and (3) if none of the above conditions are met, this pixel will be recognized as no snow.

4.2. Results of Snow Detection

In order to verify the effectiveness of snow extraction, this new approach is applied to four different regions, S1, S3, S4, and S5 in Figure 1. These four areas are all located in typical forested regions of Northeast China. The Landsat OLI binary snow cover images are shown in Figure 4a–d. Figure 4e–h are the corresponding cloud-free snow cover distribution. The results of snow detection through our proposed classification scheme in Section 4.1 are shown in Figure 4i–l. From the perspective of visual effects, the cloud-free snow-cover images seriously overestimate the actual snow coverage. However, the maps of snow detection estimated based on NDFSI, NDVI, and NDSI are more consistent with the corresponding snow distribution on the Landsat 8 OLI images, and capture more detailed snow variation information in the forest areas. Although there are some overestimations in the snow map estimated using the multi-spectral feature fusion and coupling approach, the snow cover in forest areas can be well-detected using this algorithm. As shown in Figure 4, the yellow parts represent the snow in forest areas.

4.3. Accuracy Assessment

To quantitatively show the snow detection ability in a typical forested area of Northeast China, the three indices of OA, BIAS, and FAR were adopted to estimate the accuracy of the snow distribution obtained from multi-spectral feature fusion and coupling. Meanwhile, the cloud-free snow cover product was used for a comparative analysis with the mapping results obtained by means of this algorithm. Table 3 provides the pixel statistics of the confusion matrix. And the accuracy statistics of these two types of snow cover products in the verification areas are presented in Table 4.
According to Table 3 and Table 4, many snow-free pixels in the cloud-free snow cover product are incorrectly identified as snow, resulting in an average FAR of 42.90% in the four verification areas of S1, S3, S4, and S5. The overall larger BIAS value (far greater than 1) also indicates that the snow distribution extracted using cloud-free snow cover products is higher than the actual situation, and the average OA value is only 61.12%. However, based on NDFSI, NDVI, and NDSI, the proposed snow-cover-mapping method identifies the snow pixels in forested areas more accurately, with a lower average FAR of 13.54%. And the average BIAS value of 1.23 is also closer to 1, which is much lower than that of the cloud-free snow cover product. This is because using NDSI alone makes it difficult to map the snow distribution of forest areas affected by a vegetation canopy. As is well known, the sensitivity of NDVI to the distribution of snow makes it an effective canopy index. After introducing a vegetation-based index, the accuracy of snow extraction in forest areas can be significantly improved. Research has shown that multi-band spectral feature fusion and coupling methods are reliable for snow cover mapping in forest areas. In this work, taking the forested areas of Northeast China as a typical research area, the average OA value reaches 81.31% and more snow pixels can be correctly classified using the fusion of featuring information from NDFSI, NDVI, and NDSI in the proposed algorithm.

5. Discussion

In the field of snow monitoring through optical remote sensing, a great challenge exists involving forest because a tall vegetation canopy can overlap with snow cover on the land surface. Therefore, using only a single and fixed NDSI for detecting snow distribution areas is no longer applicable in forest areas, as the effects of the forest are not embedded in NDSI itself. Some researchers believed that more snow pixels can be identified through reducing the NDSI threshold in areas with higher NDVI values, but the overall accuracy is still not satisfactory [20]. While Vikhamar and Solberg [22] applied the sub-pixel spectral mixture model to extract the snow cover distribution in areas with forest, the fact that the variables required by the model can only be obtained through on-site measurement makes it very difficult for large-area snow cover mapping. In recent years, more and more methods and data are used to develop a snow-mapping algorithm in forested-type areas, such as SCAmod [16], a machine-learning method [24], and a multi-index method [25]. However, the spatial resolution of data cannot meet the needs of regional water resource management in Northeast China.
In this study, based on the characteristics of complex surface cover types and high forest coverage, the northeast region of China is divided into forested and non-forested areas, which serve as the research area for the development of snow-cover-mapping algorithms in forested areas. According to the actual condition that the reflectance of the green band in forest areas with snow is usually much lower than pure snow, NDSI is, therefore, low and not applied in the forested area [45]. We investigated the multi-spectral reflectivity characteristics in typical forest areas with snow and forest areas without snow based on the MOD09GA product, because MODIS-retrieved snow cover mapping is one of the best data sources in forest areas at various scales with long-term and continuous records. This provides the possibility for long-term and large-scale snow detection in forest areas, and supports the next steps of forest water resource assessment, atmospheric circulation, and climate evolution analysis.
As can be seen from Figure 2, NDFSI has good statistical characteristics to extract snow pixels in forested areas. Moreover, in order to eliminate the interference of high NDFSI values that may be caused by the high reflectivity effect of forests in the near infrared band, NDVI is also introduced. Then, a new approach of snow cover mapping, combining NDFSI, NDVI, and NDSI, is presented in this study. Compared with the snow-cover-mapping algorithm mentioned above, the algorithm of this study has the characteristics of simplicity and computational frugality. Although the proposed multi-spectral feature fusion and coupling approach has shown good snow detection performance in forested areas, there are still some inadequacies that need improvement. Factors such as the slope, aspect, and surface temperature have varying degrees of influence on the accumulation and melting of snow. However, in the northeastern region with a high forest coverage, the forest canopy has the greatest impact on snow cover mapping. Therefore, in this study, the forest occlusion effect is considered the most important factor affecting snow cover mapping, without considering terrain and temperature factors. Perhaps, better snow cover mapping can be achieved by incorporating new terrain-derived factors (such as slope, aspect, and elevation) and surface temperature data in the near future.
Additionally, cloud contamination for snow cover mapping using MODIS and other optical images in the forested region is another large problem. In this study, only Landsat OLI images where land cloud cover is less than 6% were collected, which means that the MODIS images are also close to cloudless on the same day. In fact, most optical remote sensing is easily influenced by clouds because clouds prevent optical sensors from receiving land surface information. This limitation once again demonstrates the difficulty of accurately mapping snow cover distribution in areas with forest. In recently years, research on cloud removal algorithms based on optical remote sensing products such as MODIS data have matured, including the multi-day composited algorithm [46], the Snow Line (SNOWL) algorithm [47], and multi-source remote sensing fusion algorithms [13,48]. Further work is needed to combine the cloud removal algorithm and the snow-mapping algorithm in forests to identify snow-covered areas in forested regions automatically and in a larger-scale manner.

6. Conclusions

Seasonal snow melt water is one of the most vital sources of freshwater in Northeast China. The runoff generated by spring snowmelt can account for 10–15% of the total river runoff throughout the year. However, due to the significant proportion of forests in the seasonal snow-covered areas of Northeast China, monitoring snow cover distribution in areas with forest through remote sensing technology is facing great challenges.
This study integrates and couples multi-spectral feature information commonly obtained by optical remote sensing sensors to investigate the potential of snow detection in areas with forest. Based on MODIS data, a semi-analytical approach of snow cover mapping in forest areas with the integration of feature information from NDFSI, NDVI, and NDSI is presented. Landsat 8 OLI data with a high resolution are used to validate the snow cover mapping results. The following conclusions are obtained in this research:
(1)
NDFSI has good potential to detect snow cover in areas with forest combined with NDVI. The threshold value of NDFSI and NDVI is selected to be 0.35 and 0.25, respectively.
(2)
Compared with the snow cover measured by Landsat 8 OLI images, the average BIAS and FAR values of these results are 1.23 and 13.54%, which are reduced by 1.98 and 29.36%, respectively. An overall accuracy of 81.31% is reached, which is improved by 20.19%.
(3)
Snow monitoring based on the multi-spectral feature fusion and coupling approach has shown good snow detection performance and can effectively reduce the misjudgment rate of snow recognition in areas with forest. The snow classification scheme combining NDFSI, NDVI, and NDSI based on MODIS data used in this work is simple and very efficient in improving automatic snow cover mapping in typical forested areas of Northeast China. This makes large-scale snow detection in forested areas possible and provides support for the next step of establishing a runoff model and rationally regulating forest water resources.

Author Contributions

Conceptualization, Y.W.; data curation, Y.W.; formal analysis, Y.W.; funding acquisition, Y.W.; investigation, Y.W. and J.W.; methodology, Y.W.; project administration, Y.W. and J.W.; resources, Y.W.; software, Y.W.; supervision, Y.W. and J.W.; validation, Y.W.; visualization, Y.W.; writing—original draft, Y.W.; writing—review and editing, Y.W. and J.W. All authors have read and agreed to the published version of the manuscript.

Funding

This work is supported by the Fundamental Research Program of Shanxi Province (Grant No. 202203021212247).

Institutional Review Board Statement

Not applicable.

Informed Consent Statement

Not applicable.

Data Availability Statement

The data presented in this study are available on request from the corresponding author. The data are not publicly available due to privacy.

Acknowledgments

We extend our thanks to the Landsat 8 and MODIS team for sharing the data with the research community.

Conflicts of Interest

The authors have no conflicts of interest to declare.

References

  1. Hall, D.K.; Riggs, G.A. Accuracy assessment of the MODIS snow products. Hydrol. Process. 2007, 21, 1534–1547. [Google Scholar] [CrossRef]
  2. Song, Y.; Li, Z.; Zhou, Y.; Bi, X.; Sun, B.; Xiao, T.; Suo, L.; Zhang, W.; Xiao, Z.; Wang, C. The Influence of Solar Activity on Snow Cover over the Qinghai–Tibet Plateau and Its Mechanism Analysis. Atmosphere 2022, 13, 1499. [Google Scholar] [CrossRef]
  3. Barnett, T.P.; Adam, J.C.; Lettenmaier, D.P. Potential impacts of a warming climate on water availability in snow-dominated regions. Nature 2005, 438, 303–309. [Google Scholar] [CrossRef] [PubMed]
  4. Li, D.; Wrzesien, M.L.; Durand, M.; Adam, J.; Lettenmaier, D.P. How much runoff originates as snow in the western United States, and how will that change in the future? Geophys. Res. Lett. 2017, 44, 6163–6172. [Google Scholar] [CrossRef]
  5. Bormann, K.J.; Brown, R.D.; Derksen, C.; Painter, T.H. Estimating snow-cover trends from space. Nature Clim. Chang. 2018, 8, 924–928. [Google Scholar] [CrossRef]
  6. Qin, Y.; Abatzoglou, J.T.; Siebert, S.; Huning, L.S.; AghaKouchak, A.; Mankin, J.S.; Hong, C.; Tong, D.; Davis, S.J.; Mueller, N.D. Agricultural risks from changing snowmelt. Nature Clim. Chang. 2020, 10, 459–465. [Google Scholar] [CrossRef]
  7. Foster, J.; Hall, D.; Kelly, R.; Chiu, L. Seasonal snow extent and snow mass in South America using SMMR and SSM/I passive microwave data (1979–2006). Remote Sens. Environ. 2009, 113, 291–305. [Google Scholar] [CrossRef]
  8. Simpson, J.; Stitt, J.; Sienko, M. Improved estimates of the areal extent of snow cover from AVHRR data. J. Hydrol. 1998, 204, 1–23. [Google Scholar] [CrossRef]
  9. Chang, A.; Rango, A. Algorithm Theoretical Basis Document for the AMSR-E Snow Water Equivalent Algorithm, Version 3.1; NASA Goddard Space Flight Center: Prince George’s County, MR, USA, 2000. [Google Scholar]
  10. Hall, D.K.; Riggs, G.A.; Salomonson, V.V.; DiGirolamo, N.E.; Bayr, K.J. MODIS snow-cover products. Remote Sens. Environ. 2002, 83, 181–194. [Google Scholar] [CrossRef]
  11. Jiang, L.; Wang, P.; Zhang, L.; Yang, H.; Yang, J. Improvement of snow depth retrieval for FY3B-MWRI in China. Sci. China Earth Sci. 2014, 57, 1278–1292. [Google Scholar] [CrossRef]
  12. Huang, X.; Deng, J.; Ma, X.; Wang, Y.; Feng, Q.; Hao, X.; Liang, T. Spatiotemporal dynamics of snow cover based on multi-source remote sensing data in China. Cryosphere 2016, 10, 2453–2463. [Google Scholar] [CrossRef]
  13. Wang, Y.; Huang, X.; Liang, H.; Sun, Y.; Feng, Q.; Liang, T. Tracking snow variations in the Northern Hemisphere using multi-source remote sensing data (2000–2015). Remote Sens. 2018, 10, 136. [Google Scholar] [CrossRef]
  14. Gunnarsson, A.; Garðarsson, S.M.; Sveinsson, Ó.G. Icelandic snow cover characteristics derived from a gap-filled MODIS daily snow cover product. Hydrol. Earth Syst. Sci. 2019, 23, 3021–3036. [Google Scholar] [CrossRef]
  15. Rittger, K.; Raleigh, M.S.; Dozier, J.; Hill, A.F.; Lutz, J.A.; Painter, T.H. Canopy adjustment and improved cloud detection for remotely sensed snow cover mapping. Water Resour. Res. 2020, 56, e2019WR024914. [Google Scholar] [CrossRef]
  16. Metsämäki, S.J.; Anttila, S.T.; Markus, H.J.; Vepsäläinen, J.M. A feasible method for fractional snow cover mapping in boreal zone based on a reflectance model. Remote Sens. Environ. 2005, 95, 77–95. [Google Scholar] [CrossRef]
  17. Parajka, J.; Holko, L.; Kostka, Z.; Blöschl, G. MODIS snow cover mapping accuracy in a small mountain catchment–comparison between open and forest sites. Hydrol. Earth Syst. Sci. 2012, 16, 2365–2377. [Google Scholar] [CrossRef]
  18. Rittger, K.; Painter, T.H.; Dozier, J. Assessment of methods for mapping snow cover from MODIS. Adv. Water Resour. 2013, 51, 367–380. [Google Scholar] [CrossRef]
  19. Hall, D.K.; Foster, J.L.; Salomonson, V.V.; Klein, A.G.; Chien, J. Development of a technique to assess snow-cover mapping errors from space. IEEE Trans. Geosci. Remote Sens. 2001, 39, 432–438. [Google Scholar] [CrossRef]
  20. Klein, A.G.; Hall, D.K.; Riggs, G.A. Improving snow cover mapping in forests through the use of a canopy reflectance model. Hydrol. Process. 1998, 12, 1723–1744. [Google Scholar] [CrossRef]
  21. SAITO, A.; YAMAZAKI, T. Characteristics of spectral reflectance for vegetation ground surfaces with snow-cover; Vegetation indices and snow indices. J. Japan Soc. Hydrol. Water Resour. 1999, 12, 28–38. [Google Scholar] [CrossRef]
  22. Vikhamar, D.; Solberg, R. Subpixel mapping of snow cover in forests by optical remote sensing. Remote Sens. Environ. 2003, 84, 69–82. [Google Scholar] [CrossRef]
  23. Wang, L.; Xiao, P.; Feng, X. Retrieving snow information in typical forest zone of Tianshan mountains from multi-angle imaging spetroradiometer data. J. Remote Sens. 2012, 16, 1035–1053. [Google Scholar]
  24. Czyzowska-Wisniewski, E.H.; van Leeuwen, W.J.; Hirschboeck, K.K.; Marsh, S.E.; Wisniewski, W.T. Fractional snow cover estimation in complex alpine-forested environments using an artificial neural network. Remote Sens. Environ. 2015, 156, 403–417. [Google Scholar] [CrossRef]
  25. Wang, X.; Wang, J.; Li, H.; Hao, X. Combination of NDSI and NDFSI for snow cover mapping in a mountainous and forested region. J. Remote Sens. 2017, 21, 310–317. [Google Scholar] [CrossRef]
  26. Zhang, H.; Zhang, F.; Zhang, G.; Che, T.; Yan, W.; Ye, M.; Ma, N. Ground-based evaluation of MODIS snow cover product V6 across China: Implications for the selection of NDSI threshold. Sci. Total Environ. 2019, 651, 2712–2726. [Google Scholar] [CrossRef]
  27. Zhang, H.; Zhang, F.; Zhang, G.; Yan, W.; Li, S. Enhanced scaling effects significantly lower the ability of MODIS normalized difference snow index to estimate fractional and binary snow cover on the Tibetan plateau. J. Hydrol. 2021, 592, 125795. [Google Scholar] [CrossRef]
  28. Wu, Y.; Duguay, C.R.; Xu, L. Assessment of machine learning classifiers for global lake ice cover mapping from MODIS TOA reflectance data. Remote Sens. Environ. 2021, 253, 112206. [Google Scholar] [CrossRef]
  29. Zhang, Y.; Xu, F.; Kan, X.; Cao, H. Xinjiang fractional snow cover estimation based on multi-scale feature fusion network. Comput. Eng. 2022, 48, 288–295. [Google Scholar]
  30. Luo, J.; Dong, C.; Lin, K.; Chen, X.; Zhao, L.; Menzel, L. Mapping snow cover in forests using optical remote sensing, machine learning and time-lapse photography. Remote Sens. Environ. 2022, 275, 113017. [Google Scholar] [CrossRef]
  31. Li, X.; Cheng, G.; Jin, H.; Kang, E.; Che, T.; Jin, R.; Wu, L.; Nan, Z.; Wang, J.; Shen, Y. Cryospheric change in China. Glob. Planet. Chang. 2008, 62, 210–218. [Google Scholar] [CrossRef]
  32. Liang, L.; Li, L.; Liu, Q. Precipitation variability in Northeast China from 1961 to 2008. J. Hydrol. 2011, 404, 67–76. [Google Scholar] [CrossRef]
  33. Che, T.; Dai, L.; Zheng, X.; Li, X.; Zhao, K. Estimation of snow depth from passive microwave brightness temperature data in forest regions of northeast China. Remote Sens. Environ. 2016, 183, 334–349. [Google Scholar] [CrossRef]
  34. Hall, D.; Riggs, G.; Solomonson, V.; SIPS, N. MODIS/Terra Snow Cover Daily L3 Global 500 m SIN Grid; NASA National Snow and Ice Data Center Distributed Active Archive Center: Boulder, CO, USA, 2016. [Google Scholar]
  35. He, Y.; Bo, Y. A consistency analysis of MODIS MCD12Q1 and MERIS Globcover land cover datasets over China. In Proceedings of the 2011 19th International Conference on Geoinformatics, Shanghai, China, 24–26 June 2011; pp. 1–6. [Google Scholar]
  36. Dozier, J. Spectral signature of alpine snow cover from the Landsat Thematic Mapper. Remote Sens. Environ. 1989, 28, 9–22. [Google Scholar] [CrossRef]
  37. Musselman, K.; Molotch, N.P.; Brooks, P.D. Effects of vegetation on snow accumulation and ablation in a mid-latitude sub-alpine forest. Hydrol. Process. 2008, 22, 2767–2776. [Google Scholar] [CrossRef]
  38. Lv, Z.; Pomeroy, J.W. Detecting intercepted snow on mountain needleleaf forest canopies using satellite remote sensing. Remote Sens. Environ. 2019, 231, 111222. [Google Scholar] [CrossRef]
  39. John, A.; Cannistra, A.F.; Yang, K.; Tan, A.; Shean, D.; Hille Ris Lambers, J.; Cristea, N. High-Resolution Snow-Covered Area Mapping in Forested Mountain Ecosystems Using PlanetScope Imagery. Remote Sens. 2022, 14, 3409. [Google Scholar] [CrossRef]
  40. Karnieli, A.; Agam, N.; Pinker, R.T.; Anderson, M.; Imhoff, M.L.; Gutman, G.G.; Natalya, P.; Alexander, G. Use of NDVI and land surface temperature for drought assessment: Merits and limitations. J. Clim. 2010, 23, 618–633. [Google Scholar] [CrossRef]
  41. Wang, Y.; Huang, X.; Wang, J.; Zhou, M.; Liang, T. AMSR2 snow depth downscaling algorithm based on a multifactor approach over the Tibetan Plateau, China. Remote Sens. Environ. 2019, 231, 111268. [Google Scholar] [CrossRef]
  42. Wang, J.; Huang, X.; Wang, Y.; Liang, T. Retrieving Snow Depth Information From AMSR2 Data for Qinghai–Tibet Plateau. IEEE J. Sel. Top. Appl. Earth Obs. Remote Sen. 2020, 13, 752–768. [Google Scholar] [CrossRef]
  43. Dong, J.; Ek, M.; Hall, D.; Peters-Lidard, C.; Cosgrove, B.; Miller, J.; Riggs, G.; Xia, Y. Using air temperature to quantitatively predict the MODIS fractional snow cover retrieval errors over the continental United States. J. Hydrometeorol. 2014, 15, 551–562. [Google Scholar] [CrossRef]
  44. Piazzi, G.; Tanis, C.M.; Kuter, S.; Simsek, B.; Puca, S.; Toniazzo, A.; Takala, M.; Akyürek, Z.; Gabellani, S.; Arslan, A.N. Cross-country assessment of H-SAF snow products by Sentinel-2 imagery validated against in-situ observations and webcam photography. Geosciences 2019, 9, 129. [Google Scholar] [CrossRef]
  45. Dickerson-Lange, S.E.; Lutz, J.A.; Martin, K.A.; Raleigh, M.S.; Gersonde, R.; Lundquist, J.D. Evaluating observational methods to quantify snow duration under diverse forest canopies. Water Resour. Res. 2015, 51, 1203–1224. [Google Scholar] [CrossRef]
  46. Hall, D.K.; Riggs, G.A.; Foster, J.L.; Kumar, S.V. Development and evaluation of a cloud-gap-filled MODIS daily snow-cover product. Remote Sens. Environ. 2010, 114, 496–503. [Google Scholar] [CrossRef]
  47. Parajka, J.; Pepe, M.; Rampini, A.; Rossi, S.; Blöschl, G. A regional snow-line method for estimating snow cover from MODIS during cloud cover. J. Hydrol. 2010, 381, 203–212. [Google Scholar] [CrossRef]
  48. Huang, X.; Hao, X.; Feng, Q.; Wang, W.; Liang, T. A new MODIS daily cloud free snow cover mapping algorithm on the Tibetan Plateau. Sci. Cold Arid Reg. 2014, 6, 0116–0123. [Google Scholar]
Figure 1. Land cover type distribution in Northeast China through Landsat 8 OLI images.
Atmosphere 15 00513 g001
Figure 2. The distribution of NDFSI-NDVI scatter plots in the snow-free and snow-covered forest areas.
Atmosphere 15 00513 g002
Figure 3. The optimal threshold distribution for distinguishing between snow-free and snow-covered forest areas.
Atmosphere 15 00513 g003
Figure 4. Comparison of snow cover estimated based on the Landsat 8 OLI (ad), cloud-free snow cover distribution (eh), and the algorithm in this study (il).
Atmosphere 15 00513 g004
Table 1. The information of Landsat 8 OLI data.
NumberPathRowAcquisition DateCloud Cover (%)
S11222416 March 20180.55
S21172728 October 20145.17
S31163016 March 20161.61
S41183112 January 20173.68
S51162822 March 20183.98
Table 2. Confusion matrix for binary snow cover obtained in this study versus Landsat 8 OLI images.
Tested Image: SnowTested Image: Snow-Free
Landsat 8 OLI: snowab
Landsat 8 OLI: snow-freecd
Note: a, b, c, and d represent numbers of pixels. For example, a represents the number of pixels that are detected as snow in this study and Landsat OLI images; b represents the number of pixels that the tested images classified as snow-free while Landsat indicates them as snow; c represents the number of pixels that the tested images classified as snow while Landsat indicates them as snow-free; and d means the numbers of pixels that both the tested images and Landsat indicate as snow-free.
Table 3. Pixel statistics of confusion matrix.
Cloud-Free Snow Cover ProductAlgorithm for This Study
Landsat 8 OLISnowSnow-FreeSnowSnow-Free
S1Snow188433799884113801
Snow-free548557265512670114840
S3Snow1894723301087610401
Snow-free66612461801314699646
S4Snow210213820176777176
Snow-free46266636532355886349
S5Snow10903498682049987
Snow-free342539066813635108984
Table 4. Accuracy statistics of different snow cover products in the verification area.
Cloud-Free Snow Cover Product/Algorithm for This Study
OA (%)BIASFAR (%)
S161.94/82.373.25/0.9543.02/9.94
S348.58/82.444.02/1.1259.06/11.66
S462.83/77.192.71/1.6642.10/21.43
S572.13/83.222.84/1.2027.42/11.12
Disclaimer/Publisher’s Note: The statements, opinions and data contained in all publications are solely those of the individual author(s) and contributor(s) and not of MDPI and/or the editor(s). MDPI and/or the editor(s) disclaim responsibility for any injury to people or property resulting from any ideas, methods, instructions or products referred to in the content.

