Topic Editors

GFZ German Research Centre for Geosciences, 14473 Potsdam, Germany
School of Earth Sciences and Engineering, Hohai University, Nanjing 211100, China
Prof. Dr. Balaji Devaraju
Department of Civil Engineering, Indian Institute of Technology Kanpur, Kanpur 208016, India
College of Geomatics and Geoinformation, Guilin University of Technology, Guilin, 541004, China

Applications of Geodesy in Meteorological, Hydrological and Climatic Environments

Abstract submission deadline
closed (31 March 2024)
Manuscript submission deadline
31 May 2024
Viewed by
20359

Topic Information

Dear Colleagues,

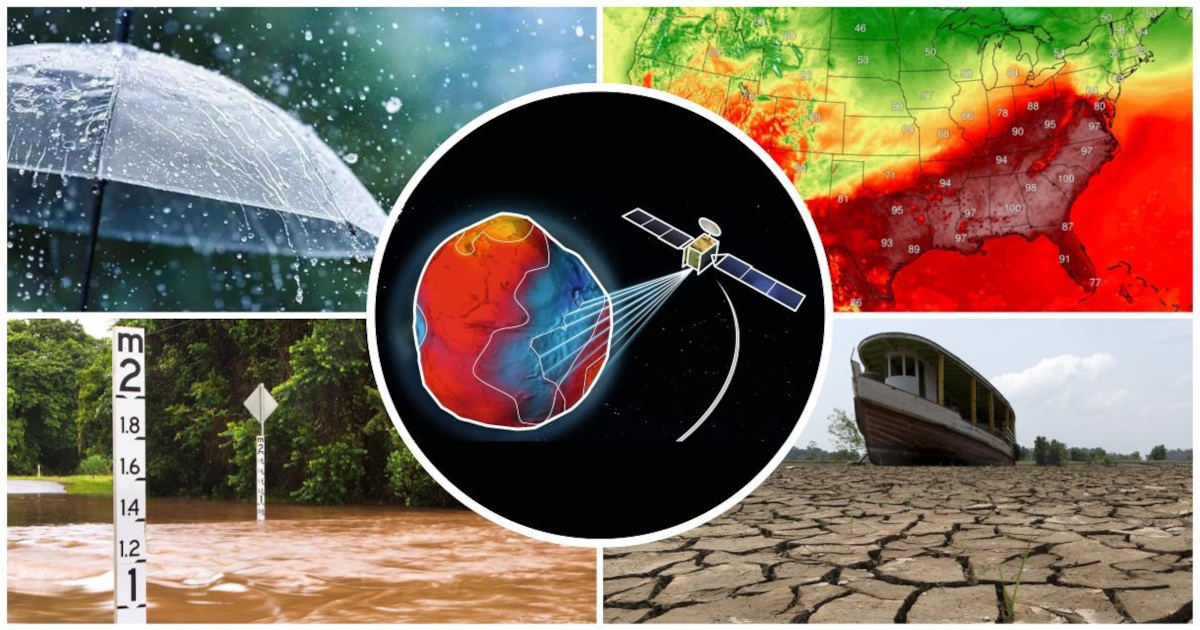
Extreme weather and climate events have been increasingly frequent and intense in recent years under global climate change. For instance, in the austral summer of 2019–2020, Australia experienced unprecedented bushfires due to unusually hot and dry weather conditions. By contrast, heavy rainfalls in Western Europe and central China triggered hundreds of casualties and billions in economic losses in summer 2021. Geodesy, composed of various observation techniques of the Earth’s shape, rotation, and gravity field (and their respective temporal variations), has been playing an important role in sensing meteorological, climatological, and hydrological events. For example, the Global Navigation Satellite Systems (GNSS) serve as a useful hydrometeorological sensor for atmospheric water vapor, soil moisture, and terrestrial water storage variations. Satellite gravimetry, represented by the Gravity Recovery and Climate Experiment (GRACE) and its follow-up mission (GRACE-FO), has been a unique sensor to monitor the distribution and redistribution of the mass transport within the Earth system and sub-systems (e.g., hydrosphere).

Although geodetic observation techniques have been introduced into the remote sensing of various atmospheric, climatological, and hydrological phenomena, further studies are urgently needed to expand its benefits and applications. Therefore, this topic aims to enhance the geodetic observation techniques and methods for understanding, modeling, and predicting these phenomena.

In this Topic, novel algorithms, methods, and datasets to enhance the capabilities of geodetic techniques in sensing atmospheric, climatological, and hydrological phenomena are welcome. Studies dealing with new perspectives, applications, and insights of geodetic observations to monitor and investigate related phenomena such as extreme events, climate change, and water cycle are also welcome.

Dr. Peng Yuan
Prof. Dr. Vagner Ferreira
Prof. Dr. Balaji Devaraju
Dr. Liangke Huang
Topic Editors

Keywords

  • extreme events
  • weather
  • meteorology
  • climatology
  • hydrology
  • water
  • geodesy
  • GNSS
  • GRACE
  • remote sensing

Participating Journals

Journal Name Impact Factor CiteScore Launched Year First Decision (median) APC
Atmosphere
atmosphere
2.9 4.1 2010 17.7 Days CHF 2400 Submit
Climate
climate
3.7 5.2 2013 19.7 Days CHF 1800 Submit
Remote Sensing
remotesensing
5.0 7.9 2009 23 Days CHF 2700 Submit
Sensors
sensors
3.9 6.8 2001 17 Days CHF 2600 Submit
Water
water
3.4 5.5 2009 16.5 Days CHF 2600 Submit

Preprints.org is a multidiscipline platform providing preprint service that is dedicated to sharing your research from the start and empowering your research journey.

MDPI Topics is cooperating with Preprints.org and has built a direct connection between MDPI journals and Preprints.org. Authors are encouraged to enjoy the benefits by posting a preprint at Preprints.org prior to publication:

  1. Immediately share your ideas ahead of publication and establish your research priority;
  2. Protect your idea from being stolen with this time-stamped preprint article;
  3. Enhance the exposure and impact of your research;
  4. Receive feedback from your peers in advance;
  5. Have it indexed in Web of Science (Preprint Citation Index), Google Scholar, Crossref, SHARE, PrePubMed, Scilit and Europe PMC.

Published Papers (12 papers)

Order results
Result details
Journals
Select all
Export citation of selected articles as:
20 pages, 10187 KiB  
Article
Improved Drought Characteristics in the Pearl River Basin Based on Reconstructed GRACE Solution with Enhanced Temporal Resolution
by Linju Wang, Menglin Zhang, Wenjie Yin, Yi Li, Litang Hu and Linlin Fan
Remote Sens. 2023, 15(19), 4849; https://doi.org/10.3390/rs15194849 - 07 Oct 2023
Viewed by 773
Abstract
As global warming intensifies, the damage caused by drought cannot be disregarded. Traditional drought monitoring is often carried out with monthly resolution, which fails to monitor the sub-monthly climatic event. The GRACE-based drought severity index (DSI) is a drought index based on terrestrial [...] Read more.
As global warming intensifies, the damage caused by drought cannot be disregarded. Traditional drought monitoring is often carried out with monthly resolution, which fails to monitor the sub-monthly climatic event. The GRACE-based drought severity index (DSI) is a drought index based on terrestrial water storage anomalies (TWSA) observed by the gravity recovery and climate experiment (GRACE) satellite. DSI has the ability to monitor drought effectively, and it is in good consistency with other drought monitoring methods. However, the temporal resolution of DSI is limited by that of GRACE observations, so it is necessary to obtain TWSA with a higher temporal resolution to calculate DSI. We use a statistical method to reconstruct the TWSA, which adopts precipitation and temperature to obtain TWSA on a daily resolution. This statistical method needs to be combined with the time series decomposition method, and then the parameters are simulated by the Markov chain Monte Carlo (MCMC) procedure. In this study, we use this TWSA reconstruction method to obtain high-quality TWSA at daily time resolution. The correlation coefficient between CSR–TWSA and the reconstructed TWSA is 0.97, the Nash–Sutcliffe efficiency is 0.93, and the root mean square error is 16.57. The quality of the reconstructed daily TWSA is evaluated, and the DSI on a daily resolution is calculated to analyze the drought phenomenon in the Pearl River basin (PRB). The results show that the TWSA reconstructed by this method has high consistency with other daily publicly available TWSA products and TWSA provided by the Center for Space Research (CSR), which proves the feasibility of this method. The correlation between DSI based on reconstructed daily TWSA, SPI, and SPEI is greater than 0.65, which is feasible for drought monitoring. From 2003 to 2021, the DSI recorded six drought events in the PRB, and the recorded drought is more consistent with SPI-6 and SPEI-6. There was a drought event from 27 May 2011 to 12 October 2011, and this drought event had the lowest DSI minimum (minimum DSI = −1.76) recorded among the six drought events. The drought monitored by the DSI is in line with government announcements. This study provides a method to analyze drought events at a higher temporal resolution, and this method is also applicable in other areas. Full article
Show Figures

Graphical abstract

30 pages, 11681 KiB  
Article
Two Decades of Terrestrial Water Storage Changes in the Tibetan Plateau and Its Surroundings Revealed through GRACE/GRACE-FO
by Longwei Xiang, Hansheng Wang, Holger Steffen, Liming Jiang, Qiang Shen, Lulu Jia, Zhenfeng Su, Wenliang Wang, Fan Deng, Baojin Qiao, Haifu Cui and Peng Gao
Remote Sens. 2023, 15(14), 3505; https://doi.org/10.3390/rs15143505 - 12 Jul 2023
Cited by 2 | Viewed by 1096
Abstract
The Tibetan Plateau (TP) has the largest number of high-altitude glaciers on Earth. As a source of major rivers in Asia, this region provides fresh water to more than one billion people. Any terrestrial water storage (TWS) changes there have major societal effects [...] Read more.
The Tibetan Plateau (TP) has the largest number of high-altitude glaciers on Earth. As a source of major rivers in Asia, this region provides fresh water to more than one billion people. Any terrestrial water storage (TWS) changes there have major societal effects in large parts of the continent. Due to the recent acceleration in global warming, part of the water environment in TP has become drastically unbalanced, with an increased risk of water disasters. We quantified secular and monthly glacier-mass-balance and TWS changes in water basins from April 2002 to December 2021 through the Gravity Recovery and Climate Experiment and its Follow-on satellite mission (GRACE/GRACE-FO). Adequate data postprocessing with destriping filters and gap filling and two regularization methods implemented in the spectral and space domain were applied. The largest glacier-mass losses were found in the Nyainqentanglha Mountains and Eastern Himalayas, with rates of −4.92 ± 1.38 Gt a−1 and −4.34 ± 1.48 Gt a−1, respectively. The Tien Shan region showed strong losses in its eastern and central parts. Furthermore, we found small glacier-mass increases in the Karakoram and West Kunlun. Most of the glacier mass change can be explained by snowfall changes and, in some areas, by summer rainfall created by the Indian monsoon. Major water basins in the north and south of the TP exhibited partly significant negative TWS changes. In turn, the endorheic region and the Qaidam basin in the TP, as well as the near Three Rivers source region, showed distinctly positive TWS signals related to net precipitation increase. However, the Salween River source region and the Yarlung Zangbo River basin showed decreasing trends. We suggest that our new and improved TWS-change results can be used for the maintenance of water resources and the prevention of water disasters not only in the TP, but also in surrounding Asian countries. They may also help in global change studies. Full article
Show Figures

Graphical abstract

19 pages, 3281 KiB  
Article
Evaluation of DEM Accuracy Improvement Methods Based on Multi-Source Data Fusion in Typical Gully Areas of Loess Plateau
by Jin Huang, Lan Wei, Tao Chen, Mingliang Luo, Hui Yang and Yunyun Sang
Sensors 2023, 23(8), 3878; https://doi.org/10.3390/s23083878 - 11 Apr 2023
Cited by 2 | Viewed by 1158
Abstract
Improving the accuracy of DEMs is a critical goal in digital terrain analysis. The combination of multi-source data can be used to increase DEM accuracy. Five typical geomorphic study areas in the Loess Plateau in Shaanxi were selected for a case study and [...] Read more.
Improving the accuracy of DEMs is a critical goal in digital terrain analysis. The combination of multi-source data can be used to increase DEM accuracy. Five typical geomorphic study areas in the Loess Plateau in Shaanxi were selected for a case study and a 5 m DEM unit was used as the basic data input. Data from three open-source databases of DEM images, the ALOS, SRTM and ASTER, were obtained and processed uniformly through a previously geographical registration process. Three methods, Gram–Schmidt pan sharpening (GS), weighted fusion and feature-point-embedding fusion, were used for mutual enhancement of the three kinds of data. We combined the effect of these three fusion methods in the five sample areas and compared the eigenvalues taken before and after the fusion. The main conclusions are as follows: (1) The GS fusion method is convenient and simple, and the three combined fusion methods can be improved. Generally speaking, the fusion of ALOS and SRTM data led to the best performance, but was greatly affected by the original data. (2) By embedding feature points into three publicly available types of DEM data, the errors and extreme error value of the data obtained through fusion were significantly improved. Overall, ALOS fusion resulted in the best performance because it had the best raw data quality. The original eigenvalues of the ASTER were all inferior and the improvement in the error and the error extreme value after fusion was evident. (3) By dividing the sample area into different areas and fusing them separately according to the weights of each area, the accuracy of the data obtained was significantly improved. In comparing the improvement in accuracy in each region, it was observed that the fusion of ALOS and SRTM data relies on a gentle area. A high accuracy of these two data will lead to a better fusion. Merging ALOS and ASTER data led to the greatest increase in accuracy, especially in the areas with a steep slope. Additionally, when SRTM and ASTER data were merged, the observed improvement was relatively stable with little difference. Full article
Show Figures

Figure 1

18 pages, 11929 KiB  
Article
Evaluation of GPM-IMERG Precipitation Product at Multiple Spatial and Sub-Daily Temporal Scales over Mainland China
by Zehui Zhou, Dekai Lu, Bin Yong, Zhehui Shen, Hao Wu and Lei Yu
Remote Sens. 2023, 15(5), 1237; https://doi.org/10.3390/rs15051237 - 23 Feb 2023
Cited by 2 | Viewed by 1292
Abstract
The Integrated Multi-satellitE Retrievals for the Global Precipitation Measurement (IMERG) provides new-generation satellite precipitation datasets with high spatio-temporal resolution and accuracy, which is widely applied in hydrology and meteorology. However, most examinations of the IMERG were conducted on daily, monthly, and annual scales, [...] Read more.
The Integrated Multi-satellitE Retrievals for the Global Precipitation Measurement (IMERG) provides new-generation satellite precipitation datasets with high spatio-temporal resolution and accuracy, which is widely applied in hydrology and meteorology. However, most examinations of the IMERG were conducted on daily, monthly, and annual scales, and inadequate research focused on the sub-daily scale. Thus, this study set up four sub-daily scales (1 h, 3 h, 12 h, and 24 h at 0.1° spatial resolution) and four spatial scales (0.1°, 0.25°, 0.5°, and 1° at 1 h temporal resolution) to finely evaluate the performance of IMERG products in the summer seasons from 2014 to 2019 over mainland China. The precipitation amount (PA), frequency (PF), and intensity (PI) were adopted to assess the performance of the IMERG referenced by the ground-based precipitation product of the China Meteorological Administration (CMA). The results show that the IMERG can capture the spatial patterns of precipitation characters over mainland China, but the PA and PI are overestimated and the PF is underestimated, and the evaluation results are highly sensitive to the different temporal and spatial resolutions. Compared with fine spatio-temporal scales, the performance of the IMERG is significantly improved when scaled up to coarser scales. Moreover, the IMERG shows a better performance of PA and PI in larger regions and during longer periods. This study provided a reference for the application of IMERG products in different spatial and temporal scales. Full article
Show Figures

Graphical abstract

22 pages, 4980 KiB  
Article
Exploiting the Combined GRACE/GRACE-FO Solutions to Determine Gravimetric Excitations of Polar Motion
by Justyna Śliwińska, Małgorzata Wińska and Jolanta Nastula
Remote Sens. 2022, 14(24), 6292; https://doi.org/10.3390/rs14246292 - 12 Dec 2022
Cited by 3 | Viewed by 1306
Abstract
Observations from the Gravity Recovery and Climate Experiment (GRACE) and GRACE Follow-On (GRACE-FO) missions can be used to estimate gravimetric excitation of polar motion (PM), which reflects the contribution of mass changes in continental hydrosphere and cryosphere to PM variation. Many solutions for [...] Read more.
Observations from the Gravity Recovery and Climate Experiment (GRACE) and GRACE Follow-On (GRACE-FO) missions can be used to estimate gravimetric excitation of polar motion (PM), which reflects the contribution of mass changes in continental hydrosphere and cryosphere to PM variation. Many solutions for Earth’s gravity field variations have been developed by institutes around the world based on GRACE/GRACE-FO data; however, it remains inconclusive which of them is the most reliable for the determination of PM excitation. In this study, we present a combined series of GRACE/GRACE-FO-based gravimetric excitation of PM computed using the three-cornered-hat (TCH) method, wherein the internal noise level in a combined solution is reduced to a minimum. We compare the combined series with results obtained from the combined GRACE/GRACE-FO solution provided by COST-G (International Combination Service for Time-variable Gravity Fields) and from the single solution elaborated by the Center for Space Research (CSR). All the gravimetric excitation series are evaluated by comparison with the sum of hydrological and cryospheric signals in geodetically observed PM excitation (called GAO). The results show that by minimizing the internal noise level in the combined excitation series using the TCH method, we can receive higher consistency with GAO than in the case of COST-G and CSR solutions, especially for the non-seasonal oscillations. For this spectral band, we obtained correlations between GAO and the best-combined series as high as 0.65 and 0.72 for the χ1 and χ2 equatorial components of PM excitation, respectively. The corresponding values for seasonal oscillation were 0.91 for χ1 and 0.89 for χ2. The combined series developed in this study explain up to 68% and 60% of overall GAO variability for χ1 and χ2, respectively. Full article
Show Figures

Graphical abstract

22 pages, 11092 KiB  
Article
An Investigation of the Lower Stratospheric Gravity Wave Activity in Tibetan Plateau Based on Multi-GNSS RO Dry Temperature Observations
by Zhiping Chen, Yu Gao, Li Li, Xiaoxing He, Weifeng Yang, Haowen Luo, Xunqiang Gong and Kaiyun Lv
Remote Sens. 2022, 14(22), 5671; https://doi.org/10.3390/rs14225671 - 10 Nov 2022
Cited by 1 | Viewed by 1730
Abstract
To understand the activity of gravity waves (GWs) over the Tibetan Plateau (TP) is of great significance for improving global climate models. Considering that the lower stratosphere is the main level of GWs activity, this paper first established a 14-year 2° × 2° [...] Read more.
To understand the activity of gravity waves (GWs) over the Tibetan Plateau (TP) is of great significance for improving global climate models. Considering that the lower stratosphere is the main level of GWs activity, this paper first established a 14-year 2° × 2° longitude–latitude monthly mean GWs model in the lower stratosphere (18~20 km) of the TP by combining post-processed dry temperature profiles provided by the multi-Global Navigation Satellite System (GNSS) radio occultation (RO) missions: The Constellation Observing System for Meteorology, Ionosphere, and Climate (COSMIC) and the Meteorological Operational (METOP) series polar-orbiting meteorological satellites (METOP-A, METOP-B, and METOP-C) from August 2006 to September 2020. Based on this model, this paper analyzed the characteristics of GWs activity around TP and the effects of topography, background wind, and zonal wind on GWs activity and summarized the general process of topographic wave excitation and upward propagation around TP. The spatial distribution of the lower stratospheric GW Ep is highly correlated with the spatial distribution of background wind and the topography of TP during GWs excitation. The GW Ep is obviously filtered by the zero-speed wind. The change in GW Ep is strongly correlated with the change in topography. These phenomena indicate that the GWs of TP are mainly topographic waves. Moreover, the lower stratospheric GW Ep of TP shows that periodic changes are mainly affected by the periodic background wind, and the GW Ep value is larger in February and smaller in August. The large GW Ep in the lower stratosphere of TP is not only related to the GWs strongly generated by the interaction between the strong background wind and the large elevation or large topographic changes but also related to the strong zonal westerly winds that promote the propagation of GWs upward. Multivariable linear regression models were used to reconstruct the lower stratospheric GW Ep over TP based on the background wind and the zonal wind and a goodness of fit of 81.1% was achieved. It indicates that the GW Ep is dominated by the topographic wave over TP in the lower stratosphere and the background wind has a greater influence on the GWs than the zonal wind. Full article
Show Figures

Figure 1

21 pages, 12906 KiB  
Article
Coastal High-Temporal Sea-Surface Altimetry Using the Posterior Error Estimations of Ionosphere-Free PPP and Information Fusion for Multi-GNSS Retrievals
by Wei Zhou, Shaofeng Bian, Yi Liu, Liangke Huang, Lilong Liu, Cheng Chen, Houpu Li and Guojun Zhai
Remote Sens. 2022, 14(21), 5599; https://doi.org/10.3390/rs14215599 - 06 Nov 2022
Cited by 2 | Viewed by 1194
Abstract
Ocean tidal variation is a key parameter for ensuring coastal safety, monitoring marine climate, and maintaining elevation datum. Recently, the ground-based global navigation satellite system reflectometry (GNSS-R) technique has been applied for regional tidal measurements, which is somewhat restricted in terms of temporal [...] Read more.
Ocean tidal variation is a key parameter for ensuring coastal safety, monitoring marine climate, and maintaining elevation datum. Recently, the ground-based global navigation satellite system reflectometry (GNSS-R) technique has been applied for regional tidal measurements, which is somewhat restricted in terms of temporal and spatial resolutions. A convenient method to improve temporal resolution of measurements is to combine multi-GNSS observations. This paper proposes a new sea-surface altimetry method using the posterior errors (PE) of dual-frequency carrier-phase signals derived from the ionosphere-free Precise Point Positioning (IF-PPP). Considering that the number of initial retrievals is obviously unsuitable for minute-level tidal measurements, both the time sliding window based on the Lomb–Scargle periodogram and a weighted cubic spline smoothing function are significant processing steps for estimating the reflector heights between the sea surface and antenna center. Measurements from two coastal GNSS stations with different tidal amplitudes are used to test the proposed method and compare it with the tide gauge and the signal-to-noise ratio (SNR) methods, respectively. The experimental results show that the multi-GNSS PE combination method can be used to estimate a minute-level sea level time series, and its root-mean-squared errors (RMSE) are about 12.5 cm. In terms of correlation, for all results, the corresponding coefficients exceed 0.97. Moreover, this combined PE method demonstrates a significant advantage in increasing temporal resolution, which is beneficial for application on high-frequency sea-level monitoring. Full article
Show Figures

Figure 1

20 pages, 4603 KiB  
Article
Testing of Homogeneity of Coordinates of Various Permanent GNSS Reference Stations Networks of the Republic of Serbia According to the Common Requirements for Proving Competence
by Jelena Gučević, Olivera Vasović Šimšić, Siniša Delčev and Miroslav Kuburić
Sensors 2022, 22(20), 7867; https://doi.org/10.3390/s22207867 - 16 Oct 2022
Cited by 1 | Viewed by 1529
Abstract
The validity of the results obtained within different permanent GNSS reference station networks (GNSS Network) must be periodically controlled using criteria that are generally known from statistical analyzes or prescribed by International Standards. Procedures for evaluating the uncertainty of measurements are defined in [...] Read more.
The validity of the results obtained within different permanent GNSS reference station networks (GNSS Network) must be periodically controlled using criteria that are generally known from statistical analyzes or prescribed by International Standards. Procedures for evaluating the uncertainty of measurements are defined in accordance with the purpose of the GNSS Network. The authors of this paper want to point out the need to establish requirements for periodical and systematical control of GNSS coordinates within the same permanent GNSS Network and control of GNSS coordinates between different permanent GNSS Networks measured on the same/unique point on the ground. This paper presents control procedures for three permanent GNSS reference station Networks established and operating in the Republic of Serbia. Special attention is on the analysis of data consistency within one permanent GNSS Network and the mutual consistency of GNSS data between different networks. The paper aims to promote reliance on the different GNSS Networks and contains suggestions on how GNSS Networks may prove that they are performing competently and that they can provide valid results for field measurements. Particularly highlighted is the need to plan and implement measures related to increasing the effectiveness of the GNSS system, achieving improved results, and preventing negative effects while performing field measurements. The paper presents the results for comparison, selected according to the rules for creating a Digital Cadastral Map features, i.e., points, lines, and polygon. The results for comparing point features are the GNSS coordinates. The results for comparing line features are the lengths of the line, i.e., distances, and the results for comparing polygon features are the areas of the polygons. Full article
Show Figures

Figure 1

22 pages, 9611 KiB  
Article
Monitoring of Hydrological Resources in Surface Water Change by Satellite Altimetry
by Wei Li, Xukang Xie, Wanqiu Li, Mark van der Meijde, Haowen Yan, Yutong Huang, Xiaotong Li and Qianwen Wang
Remote Sens. 2022, 14(19), 4904; https://doi.org/10.3390/rs14194904 - 30 Sep 2022
Cited by 3 | Viewed by 2385
Abstract
Satellite altimetry technology has unparalleled advantages in the monitoring of hydrological resources. After decades of development, satellite altimetry technology has achieved a perfect integration from the geometric research of geodesy to the natural resource monitoring research. Satellite altimetry technology has shown great potential, [...] Read more.
Satellite altimetry technology has unparalleled advantages in the monitoring of hydrological resources. After decades of development, satellite altimetry technology has achieved a perfect integration from the geometric research of geodesy to the natural resource monitoring research. Satellite altimetry technology has shown great potential, whether solid or liquid. In general, this paper systematically reviews the development of satellite altimetry technology, especially in terms of data availability and program practicability, and proposes a multi-source altimetry data fusion method based on deep learning. Secondly, in view of the development prospects of satellite altimetry technology, the challenges and opportunities in the monitoring application and expansion of surface water changes are sorted out. Among them, the limitations of the data and the redundancy of the program are emphasized. Finally, the fusion scheme of altimetry technology and deep learning proposed in this paper is presented. It is hoped that it can provide effective technical support for the monitoring and application research of hydrological resources. Full article
Show Figures

Graphical abstract

18 pages, 6907 KiB  
Article
Spatio-Temporal Assessment of Satellite Estimates and Gauge-Based Rainfall Products in Northern Part of Egypt
by Mahmoud Roushdi
Climate 2022, 10(9), 134; https://doi.org/10.3390/cli10090134 - 19 Sep 2022
Cited by 3 | Viewed by 2050
Abstract
Egypt’s climate is generally dry all over the country except for the Northern Mediterranean Coast. The Egyptian Meteorological Authority (EMA) uses few meteorological stations to monitor weather events in the entire country within the area of one million square kilometers, which makes it [...] Read more.
Egypt’s climate is generally dry all over the country except for the Northern Mediterranean Coast. The Egyptian Meteorological Authority (EMA) uses few meteorological stations to monitor weather events in the entire country within the area of one million square kilometers, which makes it scarce with respect to spatial distribution. The EMA data are relatively expensive to obtain. Open access rainfall products (RP) are commonly used to monitor rainfall as good alternatives, especially for data-scarce countries such as Egypt. This paper aims to evaluate the performance of 12 open access rainfall products for 8 locations in the northern part of Egypt, in order to map the rainfall spatial distribution over the northern part of Egypt based on the best RP. The evaluation process is conducted for the period 2000–2018 for seven locations (Marsa-Matrouh, Abu-Qeir, Rasheed, Port-Said, Tanta, Mansoura, and Cairo-Airport), while it is conducted for the period 1996–2008 for the Damanhour location. The selected open access rainfall products are compared with the ground stations data using annual and monthly timescales. The point-to-pixel approach is applied using four statistical indices (Pearson correlation coefficient (r), Nash–Sutcliffe efficiency (NSE), root mean square error (RMSE) and bias ratio (Pbias)). Overall, the results indicate that both the African Rainfall Estimation Algorithm (RFE) product and the Climate Prediction Center (CPC) product could be the best rainfall data sources for the Marsa-Matrouh location, with relatively higher r (0.99–0.93 for RFE and 0.99–0.89 for CPC) and NSE (0.98–0.79 for RFE and 0.98–0.75 for CPC), in addition to lower RMSE (0.94–7.78 for RFE and 0.92–12.01 for CPC) and Pbias (0.01–11.95% for RFE and −2.22–−12.15% for CPC) for annual and monthly timescales. In addition, the Global Precipitation Climatology Centre (GPCC) and CPC give the best rainfall products for the Abu-Qier and Port-Said locations. GPCC is more suitable for the Rasheed location. The most appropriate rainfall product for the Tanta location is CHIRPS. The current research confirms the benefits of using rainfall products after conducting the recommended performance assessment for each location. Full article
Show Figures

Figure 1

15 pages, 944 KiB  
Article
(Near) Real-Time Snow Water Equivalent Observation Using GNSS Refractometry and RTKLIB
by Ladina Steiner, Géraldine Studemann, David Eugen Grimm, Christoph Marty and Silvan Leinss
Sensors 2022, 22(18), 6918; https://doi.org/10.3390/s22186918 - 13 Sep 2022
Cited by 2 | Viewed by 1661
Abstract
Global navigation satellite system (GNSS) refractometry enables automated and continuous in situ snow water equivalent (SWE) observations. Such accurate and reliable in situ data are needed for calibration and validation of remote sensing data and could enhance snow hydrological monitoring and modeling. In [...] Read more.
Global navigation satellite system (GNSS) refractometry enables automated and continuous in situ snow water equivalent (SWE) observations. Such accurate and reliable in situ data are needed for calibration and validation of remote sensing data and could enhance snow hydrological monitoring and modeling. In contrast to previous studies which relied on post-processing with the highly sophisticated Bernese GNSS processing software, the feasibility of in situ SWE determination in post-processing and (near) real time using the open-source GNSS processing software RTKLIB and GNSS refractometry based on the biased coordinate Up component is investigated here. Available GNSS observations from a fixed, high-end GNSS refractometry snow monitoring setup in the Swiss Alps are reprocessed for the season 2016/17 to investigate the applicability of RTKLIB in post-processing. A fixed, low-cost setup provides continuous SWE estimates in near real time at a low cost for the complete 2021/22 season. Additionally, a mobile, (near) real-time and low-cost setup was designed and evaluated in March 2020. The fixed and mobile multi-frequency GNSS setups demonstrate the feasibility of (near) real-time SWE estimation using GNSS refractometry. Compared to state-of-the-art manual SWE observations, a mean relative bias below 5% is achieved for (near) real-time and post-processed SWE estimation using RTKLIB. Full article
Show Figures

Figure 1

16 pages, 2762 KiB  
Article
Development of a ZTD Vertical Profile Model Considering the Spatiotemporal Variation of Height Scale Factor with Different Reanalysis Products in China
by Xin Wang, Ge Zhu, Liangke Huang, Haoyu Wang, Yunzhen Yang, Junyu Li, Ling Huang, Lv Zhou and Lilong Liu
Atmosphere 2022, 13(9), 1469; https://doi.org/10.3390/atmos13091469 - 09 Sep 2022
Cited by 2 | Viewed by 1432
Abstract
Tropospheric delay is one of the key factors that may affect high-precision satellite navigation and positioning and water vapor retrieval performance. Its variation in the vertical direction is much greater than that in the horizontal direction. Therefore, the vertical profile model of zenith [...] Read more.
Tropospheric delay is one of the key factors that may affect high-precision satellite navigation and positioning and water vapor retrieval performance. Its variation in the vertical direction is much greater than that in the horizontal direction. Therefore, the vertical profile model of zenith total delay (ZTD) is important for the spatial interpolation of high-precision ZTD products and the development of ZTD models. However, in China, low spatial and temporal resolutions remain persistent in ZTD vertical profile models and limit their application. In this study, ZTD vertical profile grid models (CZTD-H model: CZTD-HM and CZTD-HE models) were developed by considering the time-varying height scale factor for China and employing ZTD layered profile information with high temporal-spatial resolution calculated using MERRA-2 data and ERA5 data based on the integration method during 2012–2016. The CZTD-H model accuracy was verified using the global navigation satellite system (GNSS) data acquired from the Crustal Movement Observation Network of China (CMONOC) and radiosonde data as reference and was compared with the canonical GPT3 model accuracy. The applicability of CZTD-HM and CZTD-HE models was discussed. The results showed that: (1) CZTD-HM and CZTD-HE models exhibited excellent performance for ZTD layered vertical interpolation in northwestern and southeastern China, respectively. Among ZTD layered profiles from 84 radiosonde stations, the RMSE of ZTD data interpolated using CZTD-HM and CZTD-HE models improved by 12.9/16.23% and 13.8/17.16% compared with GPT3-1 and GPT3-5 models, respectively. (2) The CZTD-H model maintained high performance for the spatial interpolation of GGOS grid ZTD data. Validation with ZTD data from 249 GNSS stations showed that the RMSEs of both CZTD-HM and CZTD-HE models improved by 2.8 mm (19.7%) and 2.6 mm (18.6%) compared with those of the GPT3-1 and GPT3-5 models, respectively. The CZTD-HE model showed excellent performance in summer among all the models. Only the location and day of the year were required for the application of the CZTD-H model, which showed excellent ZTD vertical correction performance in China. With the different performances of the CZTD-HE and CZTD-HM models in China, the ERA5 model can be recommended for practical applications. Therefore, these results can provide a reference for the data source selection of ZTD vertical profile model construction on the basis of high-precision reanalysis data, GNSS real-time high-precision positioning, and GNSS meteorology in China. Full article
Show Figures

Figure 1

Back to TopTop