Next Issue
Volume 12, May
Previous Issue
Volume 12, March


ISPRS Int. J. Geo-Inf., Volume 12, Issue 4 (April 2023) – 44 articles

Cover Story (view full-size image): 
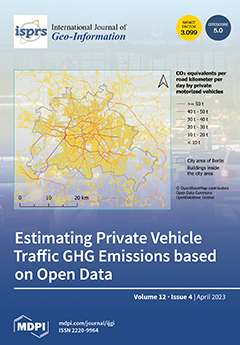
Policy decisions aiming to reduce greenhouse gas (GHG) emissions in the transportation sector require traffic emission assessments. However, estimations of traffic emissions are complex and often lack transferability in time and space as they rely on huge amounts of traffic data whose availability is limited. An approach entirely based on open data offers an alternative. GHG emissions from individual motor traffic are thereby based on a combination of the estimated traffic volume with respective emission factors. The approach captured the traffic pattern of Berlin quite well and can be transferred to other study areas within Germany with little additional effort. View this paper
  • Issues are regarded as officially published after their release is announced to the table of contents alert mailing list.
  • You may sign up for e-mail alerts to receive table of contents of newly released issues.
  • PDF is the official format for papers published in both, html and pdf forms. To view the papers in pdf format, click on the "PDF Full-text" link, and use the free Adobe Reader to open them.
Order results
Result details
Select all
Export citation of selected articles as:
23 pages, 25609 KiB  
Article
Querying Similar Multi-Dimensional Time Series with a Spatial Database
by Zheren Liu, Chaogui Kang and Xiaoyue Xing
ISPRS Int. J. Geo-Inf. 2023, 12(4), 179; https://doi.org/10.3390/ijgi12040179 - 21 Apr 2023
Cited by 2 | Viewed by 1857
Abstract
Similar time series search is one of the most important time series mining tasks in our daily life. As recent advances in sensor technologies accumulate abundant multi-dimensional time series data associated with multivariate quantities, it becomes a privilege to adapt similar time series [...] Read more.
Similar time series search is one of the most important time series mining tasks in our daily life. As recent advances in sensor technologies accumulate abundant multi-dimensional time series data associated with multivariate quantities, it becomes a privilege to adapt similar time series searches for large-scale and multi-dimensional time series data. However, traditional similar time series search methods are mainly designed for one-dimensional time series, while advanced methods applicable for multi-dimensional time series data are largely immature and, more importantly, are not friendly to users from the domain of geography. As an alternative, we propose a novel method to search similar multi-dimensional time series with spatial databases. Compared with traditional methods that often conduct the similarity search based on features of the raw time series data sequence, the proposed method stores multi-dimensional time series as spatial objects in a spatial database, and then searches similar time series based on their spatial features. To demonstrate the validity of the proposed method, we analyzed the correlation between temporal features of the raw time series and spatial features of their corresponding spatial objects theoretically and empirically. Results indicate that the proposed method can not only support similar multi-dimensional time series searches but also markedly improve its efficiency under many specific scenarios. We believe that such a new paradigm will shed further light on the similarity search in large-scale multi-dimensional time series data, and will lower the barrier for users familiar with spatial databases to conduct complex time series mining tasks. Full article
Show Figures

Figure 1

28 pages, 6888 KiB  
Article
Predicting Earthquake-Induced Landslides by Using a Stochastic Modeling Approach: A Case Study of the 2001 El Salvador Coseismic Landslides
by Claudio Mercurio, Laura Paola Calderón-Cucunuba, Abel Alexei Argueta-Platero, Grazia Azzara, Chiara Cappadonia, Chiara Martinello, Edoardo Rotigliano and Christian Conoscenti
ISPRS Int. J. Geo-Inf. 2023, 12(4), 178; https://doi.org/10.3390/ijgi12040178 - 21 Apr 2023
Cited by 4 | Viewed by 2197
Abstract
In January and February 2001, El Salvador was hit by two strong earthquakes that triggered thousands of landslides, causing 1259 fatalities and extensive damage. The analysis of aerial and SPOT-4 satellite images allowed us to map 6491 coseismic landslides, mainly debris slides and [...] Read more.
In January and February 2001, El Salvador was hit by two strong earthquakes that triggered thousands of landslides, causing 1259 fatalities and extensive damage. The analysis of aerial and SPOT-4 satellite images allowed us to map 6491 coseismic landslides, mainly debris slides and flows that occurred in volcanic epiclastites and pyroclastites. Four different multivariate adaptive regression splines (MARS) models were produced using different predictors and landslide inventories which contain slope failures triggered by an extreme rainfall event in 2009 and those induced by the earthquakes of 2001. In a predictive analysis, three validation scenarios were employed: the first and the second included 25% and 95% of the landslides, respectively, while the third was based on a k-fold spatial cross-validation. The results of our analysis revealed that: (i) the MARS algorithm provides reliable predictions of coseismic landslides; (ii) a better ability to predict coseismic slope failures was observed when including susceptibility to rainfall-triggered landslides as an independent variable; (iii) the best accuracy is achieved by models trained with both preparatory and trigger variables; (iv) an incomplete inventory of coseismic slope failures built just after the earthquake event can be used to identify potential locations of yet unreported landslides. Full article
(This article belongs to the Topic Geotechnics for Hazard Mitigation)
Show Figures

Figure 1

11 pages, 7371 KiB  
Article
Micro Transit Simulation of On-Demand Shuttles Based on Transit Data for First- and Last-Mile Connection
by Cristian Poliziani, Gary Hsueh, David Czerwinski, Tom Wenzel, Zachary Needell, Haitam Laarabi, Joerg Schweizer and Federico Rupi
ISPRS Int. J. Geo-Inf. 2023, 12(4), 177; https://doi.org/10.3390/ijgi12040177 - 21 Apr 2023
Cited by 1 | Viewed by 1620
Abstract
We simulate the introduction of shared, automated, and electric vehicles (SAEVs) providing on-demand shuttles service in a large-scale transport digital twin of the San Francisco Bay Area region (California, USA) based on transit supply and demand data, and using the mesoscopic agent-based Behavior, [...] Read more.
We simulate the introduction of shared, automated, and electric vehicles (SAEVs) providing on-demand shuttles service in a large-scale transport digital twin of the San Francisco Bay Area region (California, USA) based on transit supply and demand data, and using the mesoscopic agent-based Behavior, Energy, Autonomy, and Mobility beta software (BEAM) developed at the Lawrence Berkeley National Laboratory (LBNL). The main goal of this study is to test the operations of this novel mobility service integrated with existing fixed-route public transportation service in a mesoscopic simulation of a real case scenario, while testing the BEAM beta software capabilities. In particular, we test the introduction of fleets of on-demand vehicles bound to operate within circular catchment areas centered on high-frequency transit stops, with the purpose of extending the reach of fixed-route transit by providing an alternative first- and last-mile connection at high-frequency public transport stations. Results show that on-demand automated shuttles represent the best solution for some users, increasing the overall transit ridership by 3%, and replacing mostly ride-hail trips, especially those connecting to transit stops, but also some walking trips. This type of service has the potential to reduce overall vehicle miles traveled (VMT), increase transit accessibility, and save energy, but future research is needed to optimize this type of service and make it more attractive to travelers. Full article
Show Figures

Figure 1

14 pages, 4100 KiB  
Article
Interaction of Crime Risk across Crime Types in Hotspot Areas
by Hong Zhang, Yongping Gao, Dizhao Yao and Jie Zhang
ISPRS Int. J. Geo-Inf. 2023, 12(4), 176; https://doi.org/10.3390/ijgi12040176 - 21 Apr 2023
Cited by 1 | Viewed by 1861
Abstract
Repeat and near-repeat victimization are important concepts in the study of crime. The incidence of repeat offenses within a single type of crime has been confirmed. However, the study of the circumstances existing across crime types requires further investigation. This article investigates whether [...] Read more.
Repeat and near-repeat victimization are important concepts in the study of crime. The incidence of repeat offenses within a single type of crime has been confirmed. However, the study of the circumstances existing across crime types requires further investigation. This article investigates whether the phenomenon of near-repeat crime exists in different types of crime by studying the spread of crime risk within different crime types. Taking Suzhou City as the research area, a DBSCAN-based algorithm is proposed, which can detect a large number of important and stable hotspots through the multi-density self-adaptation of algorithm parameters. Pearson correlation is used to analyze the risk correlation between different types of crime. In different crime hotspots, the types of crime and the spread of crime risk among different types is also different. After a crime occurs, identifying the risk can aid crime prevention. Full article
Show Figures

Figure 1

26 pages, 9432 KiB  
Article
The Unseen—An Investigative Analysis of Thematic and Spatial Coverage of News on the Ongoing Refugee Crisis in West Africa
by Hansi Senaratne, Martin Mühlbauer, Ralph Kiefl, Andrea Cárdenas, Lallu Prathapan, Torsten Riedlinger, Carolin Biewer and Hannes Taubenböck
ISPRS Int. J. Geo-Inf. 2023, 12(4), 175; https://doi.org/10.3390/ijgi12040175 - 21 Apr 2023
Cited by 1 | Viewed by 2212
Abstract
The fastest growing regional crisis is happening in West Africa today, with over 8 million people considered persons of concern. A culmination of identity politics, climate-driven disasters, and extreme poverty has led to this humanitarian crisis in the region and is exacerbated by [...] Read more.
The fastest growing regional crisis is happening in West Africa today, with over 8 million people considered persons of concern. A culmination of identity politics, climate-driven disasters, and extreme poverty has led to this humanitarian crisis in the region and is exacerbated by a lack of political will and misplaced media attention. The current state of the art does not present sufficient investigations of the thematic and spatial coverage of news media of this crisis in this region. This paper studies the spatial coverage of this crisis as reported in the media, and the themes associated with those locations, based on a curated dataset. For the time frame 12 March to 15 September 2021, 2017 news articles related to the refugee crisis in West Africa were examined and manually coded based on (1) the geographical locations mentioned in each article; (2) the themes found in the articles in reference to a location (e.g., Relocation of people in Abuja). The dataset introduces a thematic dimension, as never achieved before, to the conflict-ridden areas in West Africa. A comparative analysis with UNHCR (United Nations High Commissioner for Refugees) data showed that 96.8% of refugee-related locations in West Africa were not covered by news during the considered time frame. Contrastingly, 80.4% of locations mentioned in the news do not appear in the UNHCR repository. Most news articles published during this time frame reported on Development aid or Political statements. Linear multiple regression analysis showed GDP per capita and political stability to be among the most influential determinants of news coverage. Full article
Show Figures

Figure 1

25 pages, 8710 KiB  
Review
Development Process, Quantitative Models, and Future Directions in Driving Analysis of Urban Expansion
by Xuefeng Guan, Jingbo Li, Changlan Yang and Weiran Xing
ISPRS Int. J. Geo-Inf. 2023, 12(4), 174; https://doi.org/10.3390/ijgi12040174 - 20 Apr 2023
Cited by 3 | Viewed by 1938
Abstract
Driving analysis of urban expansion (DAUE) is usually implemented to identify the driving factors and their corresponding driving effects/mechanisms for the expansion processes of urban land, aiming to provide scientific guidance for urban planning and management. Based on a thorough analysis and summarization [...] Read more.
Driving analysis of urban expansion (DAUE) is usually implemented to identify the driving factors and their corresponding driving effects/mechanisms for the expansion processes of urban land, aiming to provide scientific guidance for urban planning and management. Based on a thorough analysis and summarization of the development process and quantitative models, four major limitations in existing DAUE studies have been uncovered: (1) the interactions in hierarchical urban systems have not been fully explored; (2) the employed data cannot fully depict urban dynamic through finer social perspectives; (3) the employed models cannot deal with high-level feature correlations; and (4) the simulation and analysis models are still not intrinsically integrated. Four future directions are thus proposed: (1) to pay attention to the hierarchical characteristics of urban systems and conduct multi-scale research on the complex interactions within them to capture dynamic features; (2) to leverage remote sensing data so as to obtain diverse urban expansion data and assimilate multi-source spatiotemporal big data to supplement novel socio-economic driving factors; (3) to integrate with interpretable data-driven machine learning techniques to bolster the performance and reliability of DAUE models; and (4) to construct mechanism-coupled urban simulation to achieve a complementary enhancement and facilitate theory development and testing for urban land systems. Full article
Show Figures

Figure 1

26 pages, 36367 KiB  
Article
Investigating Geomorphic Change Using a Structure from Motion Elevation Model Created from Historical Aerial Imagery: A Case Study in Northern Lake Michigan, USA
by Jessica D. DeWitt and Francis X. Ashland
ISPRS Int. J. Geo-Inf. 2023, 12(4), 173; https://doi.org/10.3390/ijgi12040173 - 20 Apr 2023
Cited by 1 | Viewed by 1632
Abstract
South Manitou Island, part of Sleeping Bear Dunes National Lakeshore in northern Lake Michigan, is a post-glacial lacustrine landscape with substantial geomorphic changes including landslides, shoreline and bluff retreat, and sand dune movement. These changes involve interrelated processes, and are influenced to different [...] Read more.
South Manitou Island, part of Sleeping Bear Dunes National Lakeshore in northern Lake Michigan, is a post-glacial lacustrine landscape with substantial geomorphic changes including landslides, shoreline and bluff retreat, and sand dune movement. These changes involve interrelated processes, and are influenced to different extents by lake level, climate change, and land use patterns, among other factors. The utility of DEM of Difference (DoD) and other terrain analyses were investigated as a means of understanding interrelated geomorphologic changes and processes across multiple decades and at multiple scales. A 1m DEM was developed from 1955 historical aerial imagery using Structure from Motion Multi-View Stereo (SfM-MVS) and compared to a 2016 lidar-based DEM to quantify change. Landslides, shoreline erosion, bluff retreat, and sand dune movement were investigated throughout South Manitou Island. While the DoD indicates net loss or gain, interpretation of change must take into consideration the SfM-MVS source of the historical DEM. In the case of landslides, where additional understanding may be gleaned through review of the timing of lake high- and lowstands together with DoD values. Landscape-scale findings quantified cumulative feedbacks between interrelated processes. These findings could be upscaled to assess changes across the entire park, informing future change investigations and land management decisions. Full article
Show Figures

Figure 1

23 pages, 5903 KiB  
Article
Efficient Algorithm for Constructing Order K Voronoi Diagrams in Road Networks
by Bi Yu Chen, Huihuang Huang, Hui-Ping Chen, Wenxuan Liu, Xuan-Yan Chen and Tao Jia
ISPRS Int. J. Geo-Inf. 2023, 12(4), 172; https://doi.org/10.3390/ijgi12040172 - 19 Apr 2023
Viewed by 1512
Abstract
The order k Voronoi diagram (OkVD) is an effective geometric construction to partition the geographical space into a set of Voronoi regions such that all locations within a Voronoi region share the same k nearest points of interest (POIs). Despite the broad applications [...] Read more.
The order k Voronoi diagram (OkVD) is an effective geometric construction to partition the geographical space into a set of Voronoi regions such that all locations within a Voronoi region share the same k nearest points of interest (POIs). Despite the broad applications of OkVD in various geographical analysis, few efficient algorithms have been proposed to construct OkVD in real road networks. This study proposes a novel algorithm consisting of two stages. In the first stage, a new one-to-all k shortest path finding procedure is proposed to efficiently determine the shortest paths to k nearest POIs for each node. In the second stage, a new recursive procedure is introduced to effectively divide boundary links within different Voronoi regions using the hierarchical tessellation property of the OkVD. To demonstrate the applicability of the proposed OkVD construction algorithm, a case study of place-based accessibility evaluation is carried out. Computational experiments are also conducted on five real road networks with different sizes, and results show that the proposed OkVD algorithm performed significantly better than state-of-the-art algorithms. Full article
Show Figures

Figure 1

24 pages, 4144 KiB  
Article
SLBRIN: A Spatial Learned Index Based on BRIN
by Lijun Wang, Linshu Hu, Chenhua Fu, Yuhan Yu, Peng Tang, Feng Zhang and Renyi Liu
ISPRS Int. J. Geo-Inf. 2023, 12(4), 171; https://doi.org/10.3390/ijgi12040171 - 15 Apr 2023
Viewed by 1733
Abstract
The spatial learned index constructs a spatial index by learning the spatial distribution, which performs a lower cost of storage and query than the spatial indices. The current update strategies of spatial learned indices can only solve limited updates at the cost of [...] Read more.
The spatial learned index constructs a spatial index by learning the spatial distribution, which performs a lower cost of storage and query than the spatial indices. The current update strategies of spatial learned indices can only solve limited updates at the cost of query performance. We propose a novel spatial learned index structure based on a Block Range Index (SLBRIN for short). Its core idea is to cooperate history range and current range to satisfy a fast spatial query and efficient index update simultaneously. SLBRIN deconstructs the update transaction into three parallel operations and optimizes them based on the temporal proximity of spatial distribution. SLBRIN also provides the spatial query strategy with the spatial learned index and spatial location code, including point query, range query and kNN query. Experiments on synthetic and real datasets demonstrate that SLBRIN clearly outperforms traditional spatial indices and state-of-the-art spatial learned indices in the cost of storage and query. Moreover, in the simulated real-time update scenario, SLBRIN has the faster and more stable query performance while satisfying efficient updates. Full article
Show Figures

Figure 1

17 pages, 3998 KiB  
Article
Monitoring the Impacts of Human Activities on Urban Ecosystems Based on the Enhanced UCCLN (EUCCLN) Model
by Nadia Abbaszadeh Tehrani, Farinaz Farhanj and Milad Janalipour
ISPRS Int. J. Geo-Inf. 2023, 12(4), 170; https://doi.org/10.3390/ijgi12040170 - 15 Apr 2023
Cited by 2 | Viewed by 1370
Abstract
To have a sustainable city, human pressures on urban ecosystems should not exceed certain thresholds, which are defined by the urban carrying capacity concept. The main goal of this research was to monitor environmental pressures caused by the impacts of human activities on [...] Read more.
To have a sustainable city, human pressures on urban ecosystems should not exceed certain thresholds, which are defined by the urban carrying capacity concept. The main goal of this research was to monitor environmental pressures caused by the impacts of human activities on the ecosystem of Tehran city using spatial indicators. According to the enhanced Urban Carrying Capacity Load Number (EUCCLN) model, first, the most related indicators were collected from the open access databases, including satellite products, air quality monitoring stations, municipality statistical yearbook, and a related article. Then, the indicators were classified into air, traffic, and waste groups. Afterwards, the importance coefficients of all indicators were specified using the analytical hierarchy process. Their degree of carrying capacity tables were determined, and finally, load numbers were calculated. The results showed that 100%, 4.55%, and 40.91% of all districts had very high-to-critical degrees in terms of air, traffic, and waste indicators, respectively. The final human-induced pressure degrees were very high-to-critical in Districts 1, 3, 6, 7, 8, 12, and 14 (31.82% out of 22 districts) and high-to-very high in the rest of them. Therefore, the overall pressure in all 22 districts of Tehran had reached or exceeded its maximum threshold degree. Full article
Show Figures

Figure 1

15 pages, 27174 KiB  
Article
Image Retrieval Method Based on Visual Map Pre-Sampling Construction in Indoor Positioning
by Jianan Bai, Danyang Qin, Ping Zheng and Lin Ma
ISPRS Int. J. Geo-Inf. 2023, 12(4), 169; https://doi.org/10.3390/ijgi12040169 - 14 Apr 2023
Viewed by 1254
Abstract
In visual indoor positioning systems, the method of constructing a visual map by point-by-point sampling is widely used due to its characteristics of clear static images and simple coordinate calculation. However, too small a sampling interval will cause image redundancy, while too large [...] Read more.
In visual indoor positioning systems, the method of constructing a visual map by point-by-point sampling is widely used due to its characteristics of clear static images and simple coordinate calculation. However, too small a sampling interval will cause image redundancy, while too large a sampling interval will lead to the absence of any scene images, which will result in worse positioning efficiency and inferior positioning accuracy. As a result, this paper proposed a visual map construction method based on pre-sampled image features matching, according to the epipolar geometry of adjacent position images, to determine the optimal sampling spacing within the constraints and effectively control the database size while ensuring the integrity of the image information. In addition, in order to realize the rapid retrieval of the visual map and reduce the positioning error caused by the time overhead, an image retrieval method based on deep hashing was also designed in this paper. This method used a convolutional neural network to extract image features to construct the semantic similarity structure to guide the generation of hash code. Based on the log-cosh function, this paper proposed a loss function whose function curve was smooth and not affected by outliers, and then integrated it into the deep network to optimize parameters, for fast and accurate image retrieval. Experiments on the FLICKR25K dataset and the visual map proved that the method proposed in this paper could achieve sub-second image retrieval with guaranteed accuracy, thereby demonstrating its promising performance. Full article
(This article belongs to the Topic Artificial Intelligence in Navigation)
Show Figures

Figure 1

17 pages, 7282 KiB  
Article
Quality Assessment of Global Ocean Island Datasets
by Yijun Chen, Shenxin Zhao, Lihua Zhang and Qi Zhou
ISPRS Int. J. Geo-Inf. 2023, 12(4), 168; https://doi.org/10.3390/ijgi12040168 - 13 Apr 2023
Cited by 1 | Viewed by 1618
Abstract
Ocean Island data are essential to the conservation and management of islands and coastal ecosystems, and have also been adopted by the United Nations as a sustainable development goal (SDG 14). Currently, two categories of island datasets, i.e., global shoreline vector (GSV) and [...] Read more.
Ocean Island data are essential to the conservation and management of islands and coastal ecosystems, and have also been adopted by the United Nations as a sustainable development goal (SDG 14). Currently, two categories of island datasets, i.e., global shoreline vector (GSV) and OpenStreetMap (OSM), are freely available on a global scale. However, few studies have focused on accessing and comparing the data quality of these two datasets, which is the main purpose of our study. Specifically, these two datasets were accessed using four 100 × 100 (km2) study areas, in terms of three aspects of measures, i.e., accuracy (including overall accuracy (OA), precision, recall and F1), completeness (including area completeness and count completeness) and shape complexity. The results showed that: (1) Both the two datasets perform well in terms of the OA (98% or above) and F1 (0.9 or above); the OSM dataset performs better in terms of precision, but the GSV dataset performs better in terms of recall. (2) The area completeness is almost 100%, but the count completeness is much higher than 100%, indicating the total areas of the two datasets are almost the same, but there are many more islands in the OSM dataset. (3) In most cases, the fractal dimension of the OSM dataset is relatively larger than the GSV dataset in terms of the shape complexity, indicating that the OSM dataset has more detail in terms of the island boundary or coastline. We concluded that both of the datasets (GSV and OSM) are effective for island mapping, but the OSM dataset can identify more small islands and has more detail. Full article
Show Figures

Figure 1

45 pages, 61635 KiB  
Article
A Semi-Automatic Semantic-Model-Based Comparison Workflow for Archaeological Features on Roman Ceramics
by Florian Thiery, Jonas Veller, Laura Raddatz, Louise Rokohl, Frank Boochs and Allard W. Mees
ISPRS Int. J. Geo-Inf. 2023, 12(4), 167; https://doi.org/10.3390/ijgi12040167 - 13 Apr 2023
Cited by 1 | Viewed by 2440
Abstract
In this paper, we introduce applications of Artificial Intelligence techniques, such as Decision Trees and Semantic Reasoning, for semi-automatic and semantic-model-based decision-making for archaeological feature comparisons. This paper uses the example of Roman African Red Slip Ware (ARS) and the collection of ARS [...] Read more.
In this paper, we introduce applications of Artificial Intelligence techniques, such as Decision Trees and Semantic Reasoning, for semi-automatic and semantic-model-based decision-making for archaeological feature comparisons. This paper uses the example of Roman African Red Slip Ware (ARS) and the collection of ARS at the LEIZA archaeological research institute. The main challenge is to create a Digital Twin of the ARS objects and artefacts using geometric capturing and semantic modelling of archaeological information. Moreover, the individualisation and comparison of features (appliqués), along with their visualisation, extraction, and rectification, results in a strategy and application for comparison of these features using both geometrical and archaeological aspects with a comprehensible rule set. This method of a semi-automatic semantic model-based comparison workflow for archaeological features on Roman ceramics is showcased, discussed, and concluded in three use cases: woman and boy, human–horse hybrid, and bears with local twists and shifts. Full article
Show Figures

Figure 1

21 pages, 13411 KiB  
Article
Identification and Spatiotemporal Analysis of Bikesharing-Metro Integration Cycling
by Hao Wu, Yanhui Wang, Yuqing Sun, Duoduo Yin, Zhanxing Li and Xiaoyue Luo
ISPRS Int. J. Geo-Inf. 2023, 12(4), 166; https://doi.org/10.3390/ijgi12040166 - 13 Apr 2023
Cited by 2 | Viewed by 1397
Abstract
An essential function of dockless bikesharing (DBs) is to serve as a feeder mode to the metro. Optimizing the integration between DBs and the metro is of great significance for improving metro travel efficiency. However, the research on DBs–Metro Integration Cycling (DBsMIC) faces [...] Read more.
An essential function of dockless bikesharing (DBs) is to serve as a feeder mode to the metro. Optimizing the integration between DBs and the metro is of great significance for improving metro travel efficiency. However, the research on DBs–Metro Integration Cycling (DBsMIC) faces challenges such as insufficient methods for identification and low identification accuracy. In this study, we improve the enhanced two-step floating catchment area and incorporate Bayes’ rule to propose a method to identify DBsMIC by considering the parameters of time, distance, environmental competition ratio, and POI service power index. Furthermore, an empirical study is conducted in Shenzhen to verify the higher accuracy of the proposed method. Their spatiotemporal behavior pattern is also explored with the help of the kernel density estimation method. The research results will help managers improve the effective redistribution of bicycles, promote the coupling efficiency between transportation modes, and achieve sustainable development of urban transportation. Full article
Show Figures

Figure 1

23 pages, 7231 KiB  
Article
Assessment of Ecosystem Service Value in Response to LULC Changes Using Geospatial Techniques: A Case Study in the Merbil Wetland of the Brahmaputra Valley, Assam, India
by Durlov Lahon, Dhrubajyoti Sahariah, Jatan Debnath, Nityaranjan Nath, Gowhar Meraj, Pankaj Kumar, Shizuka Hashimoto and Majid Farooq
ISPRS Int. J. Geo-Inf. 2023, 12(4), 165; https://doi.org/10.3390/ijgi12040165 - 12 Apr 2023
Cited by 12 | Viewed by 2348
Abstract
The alteration of land use and land cover caused by human activities on a global scale has had a notable impact on ecosystem services at regional and global levels, which are crucial for the survival and welfare of human beings. Merbil, a small [...] Read more.
The alteration of land use and land cover caused by human activities on a global scale has had a notable impact on ecosystem services at regional and global levels, which are crucial for the survival and welfare of human beings. Merbil, a small freshwater wetland located in the Brahmaputra basin in Assam, India, is not exempt from this phenomenon. In the present study, we have estimated and shown a spatio-temporal variation of ecosystem service values in response to land use and land cover alteration for the years 1990, 2000, 2010, and 2021, and predicted the same for 2030 and 2040. Supervised classification and the CA-Markov model were used in this study for land-use and land-cover classification and future projection, respectively. The result showed a significant increase in built-up areas, agricultural land, and aquatic plants and a decrease in open water and vegetation during 1990–2040. The study area experienced a substantial rise in ecosystem service values during the observed period (1990–2021) due to the rapid expansion of built-up areas and agricultural and aquatic land. Although the rise of built-up and agricultural land is economically profitable and has increased the study site’s overall ecosystem service values, decreasing the area under open water and vegetation cover may have led to an ecological imbalance in the study site. Hence, we suggest that protecting the natural ecosystem should be a priority in future land-use planning. The study will aid in developing natural resource sustainability management plans and provide useful guidelines for preserving the local ecological balance in small wetlands over the short to medium term. Full article
Show Figures

Figure 1

20 pages, 8467 KiB  
Article
Visual Perception of Property Rights in 3D
by Kornelia Grzelka, Agnieszka Bieda, Jarosław Bydłosz and Anna Kondak
ISPRS Int. J. Geo-Inf. 2023, 12(4), 164; https://doi.org/10.3390/ijgi12040164 - 12 Apr 2023
Cited by 2 | Viewed by 2459
Abstract
Despite the already advanced work on the construction of jurisdictional 3D cadastre models in many parts of the world and the technical feasibility of building very detailed 3D models of cities, relatively few specialists have focused on the aspects of visualizing property rights [...] Read more.
Despite the already advanced work on the construction of jurisdictional 3D cadastre models in many parts of the world and the technical feasibility of building very detailed 3D models of cities, relatively few specialists have focused on the aspects of visualizing property rights in three dimensions. Therefore, to complement the analyses carried out so far in this area, this research aims to investigate the perception of the visualization of multidimensional real estate data using different visual variables and by different audiences. The main contribution of the conducted research to the development of 3D cadastre visualizations is to start a discussion on the differences in their perception among real estate professionals and those who have no experience in this area and may have to use multidimensional property data. The research was conducted using a questionnaire-based survey method with the computer-assisted web interview (CAWI) technique. The questionnaire was completed by students of a course related to real estate law (geodetic science) and those who do not have regular contact with it (environmental engineering, medicine, sports, mechanics, and management). As a result of the survey, it emerged that the group studying geodetic science performed better on average than students in other fields of study. Additionally, the conducted survey confirmed the existing knowledge of the perception of the visualization of property rights in three dimensions. According to it, visualizations of property rights in 3D should use color. The use of transparency helps in visualisations made in grayscale but interferes with more complex colorful objects. Full article
Show Figures

Figure 1

23 pages, 9430 KiB  
Article
Driving Factors and Scale Effects of Residents’ Willingness to Pay for Environmental Protection under the Impact of COVID-19
by Hongkun Zhao, Yaofeng Yang, Yajuan Chen, Huyang Yu, Zhuo Chen and Zhenwei Yang
ISPRS Int. J. Geo-Inf. 2023, 12(4), 163; https://doi.org/10.3390/ijgi12040163 - 11 Apr 2023
Viewed by 1301
Abstract
In recent years, environmental degradation and the COVID-19 pandemic have seriously affected economic development and social stability. Addressing the impact of major public health events on residents’ willingness to pay for environmental protection (WTPEP) and analyzing the drivers are necessary for improving human [...] Read more.
In recent years, environmental degradation and the COVID-19 pandemic have seriously affected economic development and social stability. Addressing the impact of major public health events on residents’ willingness to pay for environmental protection (WTPEP) and analyzing the drivers are necessary for improving human well-being and environmental sustainability. We designed a questionnaire to analyze the change in residents’ WTPEP before and during COVID-19 and an established ordinary least squares (OLS), spatial lag model (SLM), spatial error model (SEM), geographically weighted regression (GWR), and multiscale GWR to explore driver factors and scale effects of WTPEP based on the theory of environment Kuznets curve (EKC). The results show that (1) WTPEP is 0–20,000 yuan before COVID-19 and 0–50,000 yuan during COVID-19. Residents’ WTPEP improved during COVID-19, which indicates that residents’ demand for an ecological environment is increasing; (2) The shapes and inflection points of the relationships between income and WTPEP are spatially heterogeneous before and during COVID-19, but the northern WTPEP is larger than southern, which indicates that there is a spatial imbalance in WTPEP; (3) Environmental degradation, health, environmental quality, and education are WTPEP’s significant macro-drivers, whereas income, age, and gender are significant micro-drivers. Those factors can help policymakers better understand which factors are more suitable for macro or micro environmental policy-making and what targeted measures could be taken to solve the contradiction between the growing ecological environment demand of residents and the spatial imbalance of WTPEP in the future. Full article
(This article belongs to the Collection Spatial Components of COVID-19 Pandemic)
Show Figures

Figure 1

26 pages, 11133 KiB  
Article
Modelling & Analysis of High Impact Terrorist Attacks in India & Its Neighbors
by Prabal Pratap Singh and Deepu Philip
ISPRS Int. J. Geo-Inf. 2023, 12(4), 162; https://doi.org/10.3390/ijgi12040162 - 11 Apr 2023
Cited by 2 | Viewed by 2451
Abstract
Terrorism perpetrated in any country by either internal or external actors jeopardizes the country’s security, economic growth, societal peace, and harmony. Hence, accurate modelling of terrorism has become a necessary component of the national security mission of most nations. This research extracted and [...] Read more.
Terrorism perpetrated in any country by either internal or external actors jeopardizes the country’s security, economic growth, societal peace, and harmony. Hence, accurate modelling of terrorism has become a necessary component of the national security mission of most nations. This research extracted and analyzed high impact attacks (HIAs) perpetrated by terrorists in India and its neighboring countries since 1970 using the Global Terrorism Database (GTD). We evaluated the extraction efficacy of the Global Terrorism Index Impact Score (GTI-IS) against the GTD measure “nkill” using the iterative outlier analysis (IOA) heuristic. The heuristic identified 6117 common HIAs using nkill or GTI-IS attributes. GTI-IS extracted 1718 exclusive HIAs that nkill missed, while nkill extracted 2233 exclusive HIAs. We further classified the extracted HIAs into lethal and non-lethal attacks. Next, we conducted a rigorous spatiotemporal exploratory analysis of countries that reported the most HIAs. Though Afghanistan, India, and Sri Lanka exhibited global spatial autocorrelation, Pakistan did not. Ripley’s G function suggested the recurrence of lethal attacks near other similar events. This analysis showed that lethal and non-lethal attacks in those countries follow different statistical distributions, which can aid in focused counterterrorism tactics. Full article
Show Figures

Figure 1

17 pages, 4257 KiB  
Article
Spatiotemporal Evolution Analysis of the Chinese Railway Network Structure Based on Self-Organizing Maps
by Lingzhi Yin and Yafei Wang
ISPRS Int. J. Geo-Inf. 2023, 12(4), 161; https://doi.org/10.3390/ijgi12040161 - 10 Apr 2023
Viewed by 1372
Abstract
Delving into the spatiotemporal evolution of the railway network in different periods can provide guidance and reference for the planning and layout of the railway network. However, most of the existing studies tended to model the railway data separately and compare the network [...] Read more.
Delving into the spatiotemporal evolution of the railway network in different periods can provide guidance and reference for the planning and layout of the railway network. However, most of the existing studies tended to model the railway data separately and compare the network indices of adjacent periods based on the railway data of different periods, thus failing to integrate the railway network in different periods into a unified framework for evolution analysis. Therefore, this paper used the railway data from 2008, 2010, 2015, and 2019, and analyzed the spatiotemporal integration of the railway network evolution based on the complex network theory and the self-organizing maps (SOM) method. Firstly, this study constructed the geographical railway network in the four years and probed into how the network feature indices changed. Then, it used the SOM method to capture the spatiotemporal integration of the railway network evolution in multi-time series. Finally, it clustered the change trajectory of each city node and unveiled the relationship between the evolution of city nodes and the hierarchy of urban systems. The results show that from 2008 to 2019, the railway network feature indices showed an upward trend and that the expansion pattern of the railway network could be divided into the core–peripheral pattern, belt expansion pattern, strings of beads pattern, and multi-center network pattern. The evolution of the change trajectory of the city nodes was highly related to the hierarchical structure of the urban system. This study helps to understand the evolution process of the railway network in China, and provides decision-making reference for improving and optimizing China’s railway network. Full article
Show Figures

Figure 1

15 pages, 5932 KiB  
Article
Evacuation Simulation Implemented by ABM-BIM of Unity in Students’ Dormitory Based on Delay Time
by Yonghua Huang, Zhongyang Guo, Hao Chu and Raja Sengupta
ISPRS Int. J. Geo-Inf. 2023, 12(4), 160; https://doi.org/10.3390/ijgi12040160 - 08 Apr 2023
Cited by 2 | Viewed by 2235
Abstract
China’s university dormitories have high population densities, which can result in a large number of casualties because of crowding and stampedes during emergency evacuations. It is therefore important to plan properly for evacuations by mitigating the effect of choke points that create backlogs [...] Read more.
China’s university dormitories have high population densities, which can result in a large number of casualties because of crowding and stampedes during emergency evacuations. It is therefore important to plan properly for evacuations by mitigating the effect of choke points that create backlogs ahead of time. Accurate computer representations of the structure of a building and behavior of the evacuees are two important factors to obtain accurate evacuation time. In this paper, Agent-Based Modeling (ABM) and Building Information Modeling (BIM) are, respectively, implemented using the Unity platform to simulate the evacuation process. As a case study, the layout of a student dormitory building at Shanghai Normal University Xuhui District, Shanghai, China, is utilized along with the A* algorithm in Unity to explore the impact of evacuation speed and delays in creating choke points. Compared with previous research, the innovation of this study lies in: (1) using Unity software to make simulation of the physical environment both realistic and easy to implement, demonstrating Unity can be a well-developed platform to implement ABM-BIM research that focuses on crowd evacuation. (2) Using these simulations to evaluate different degrees of congestion caused by varying evacuation speeds, thus providing information about possible issues relating to evacuation efforts. Using the results, several recommended measures can be generated to help improve evacuation efficiency. Full article
Show Figures

Figure 1

20 pages, 5322 KiB  
Article
SAM-GAN: Supervised Learning-Based Aerial Image-to-Map Translation via Generative Adversarial Networks
by Jian Xu, Xiaowen Zhou, Chaolin Han, Bing Dong and Hongwei Li
ISPRS Int. J. Geo-Inf. 2023, 12(4), 159; https://doi.org/10.3390/ijgi12040159 - 07 Apr 2023
Cited by 3 | Viewed by 2318
Abstract
Accurate translation of aerial imagery to maps is a direction of great value and challenge in mapping, a method of generating maps that does not require using vector data as traditional mapping methods do. The tremendous progress made in recent years in image [...] Read more.
Accurate translation of aerial imagery to maps is a direction of great value and challenge in mapping, a method of generating maps that does not require using vector data as traditional mapping methods do. The tremendous progress made in recent years in image translation based on generative adversarial networks has led to rapid progress in aerial image-to-map translation. Still, the generated results could be better regarding quality, accuracy, and visual impact. This paper proposes a supervised model (SAM-GAN) based on generative adversarial networks (GAN) to improve the performance of aerial image-to-map translation. In the model, we introduce a new generator and multi-scale discriminator. The generator is a conditional GAN model that extracts the content and style space from aerial images and maps and learns to generalize the patterns of aerial image-to-map style transformation. We introduce image style loss and topological consistency loss to improve the model’s pixel-level accuracy and topological performance. Furthermore, using the Maps dataset, a comprehensive qualitative and quantitative comparison is made between the SAM-GAN model and previous methods used for aerial image-to-map translation in combination with excellent evaluation metrics. Experiments showed that SAM-GAN outperformed existing methods in both quantitative and qualitative results. Full article
Show Figures

Figure 1

16 pages, 1281 KiB  
Article
A Tale of Two Cities: COVID-19 Vaccine Hesitancy as a Result of Racial, Socioeconomic, Digital, and Partisan Divides
by Rui Li, Daniel Erickson, Mareyam Belcaid, Madu Franklin Chinedu and Oluwabukola Olufunke Akanbi
ISPRS Int. J. Geo-Inf. 2023, 12(4), 158; https://doi.org/10.3390/ijgi12040158 - 07 Apr 2023
Viewed by 1454
Abstract
The unprecedented COVID-19 pandemic has drawn great attention to the issue of vaccine hesitancy, as the acceptance of the innovative RNA vaccine is relatively low. Studies have addressed multiple factors, such as socioeconomic, political, and racial backgrounds. These studies, however, rely on survey [...] Read more.
The unprecedented COVID-19 pandemic has drawn great attention to the issue of vaccine hesitancy, as the acceptance of the innovative RNA vaccine is relatively low. Studies have addressed multiple factors, such as socioeconomic, political, and racial backgrounds. These studies, however, rely on survey data from participants as part of the population. This study utilizes the actual data from the U.S. Census Bureau as well as actual 2020 U.S. presidential election results to generate four major category of factors that divide the population: socioeconomic status, race and ethnicity, access to technology, and political identification. This study then selects a region in a traditionally democratic state (Capital Region in New York) and a region in a traditionally republican state (Houston metropolitan area in Texas). Statistical analyses such as correlation and geographically weighted regression reveal that factors such as political identification, education attainment, and non-White Hispanic ethnicity in both regions all impact vaccine acceptance significantly. Other factors, such as poverty and particular minority races, have different influences in each region. These results also highlight the necessity of addressing additional factors to further shed light on vaccine hesitancy and potential solutions according to identified factors. Full article
Show Figures

Figure 1

15 pages, 8156 KiB  
Article
Walk Score from 2D to 3D—Walkability for the Elderly in Two Medium-Sized Cities in Germany
by Markus Schaffert, Konstantin Geist, Jonathan Albrecht, Dorothea Enners and Hartmut Müller
ISPRS Int. J. Geo-Inf. 2023, 12(4), 157; https://doi.org/10.3390/ijgi12040157 - 06 Apr 2023
Cited by 1 | Viewed by 1929
Abstract
In this article, we describe the design of a method for measuring walkability and its application in two medium-sized cities in Germany. The method modifies the established Walk Score with regard to the needs of older people. While the original Walk Score takes [...] Read more.
In this article, we describe the design of a method for measuring walkability and its application in two medium-sized cities in Germany. The method modifies the established Walk Score with regard to the needs of older people. While the original Walk Score takes a 2D approach by calculating the reachability of service facilities on a flat road network, we include 3D information by taking into account slopes and stairs. We also pay attention to the longer walking times of the elderly and adjust the selection and weighting of supply facilities according to their relevance for elderly people. The implementation results in a concentric walkability pattern, with a high Walk Score in the inner-city area that is decreasing towards the periphery, but with many anomalies resulting from local inhomogeneity in population and facility distribution and topography. The study shows that it is possible to refine the Walk Score to meet the needs of older people, as well as to implement the methodology in Germany using a combination of voluntary geographic information and high-quality official datasets. We see our research as a step forward on the way to more realistic walkability metrics for senior-sensitive urban planning. Full article
Show Figures

Figure 1

20 pages, 18283 KiB  
Article
Evaluation of Supply–Demand Matching of Public Health Resources Based on Ga2SFCA: A Case Study of the Central Urban Area of Tianjin
by Xiaoyu Guo, Suiping Zeng, Aihemaiti Namaiti and Jian Zeng
ISPRS Int. J. Geo-Inf. 2023, 12(4), 156; https://doi.org/10.3390/ijgi12040156 - 06 Apr 2023
Cited by 1 | Viewed by 1658
Abstract
Determining whether the supply–demand matching (SDM) of urban public health resources is reasonable involves important issues such as health security and the rational use of resources. Using the central urban area of Tianjin as the research area, this paper used the Gaussian-based 2-step [...] Read more.
Determining whether the supply–demand matching (SDM) of urban public health resources is reasonable involves important issues such as health security and the rational use of resources. Using the central urban area of Tianjin as the research area, this paper used the Gaussian-based 2-step floating catchment area method (Ga2SFCA), combined with multi-source data, and comprehensively considered public medical, natural, and physical resources to evaluate the SDM of single-category and integrated public health resources in the research area. The results showed the following: (1) there was a good fit between supply and demand for public medical and natural health resources in Tianjin’s central urban area. For public physical health resources, there was a poor fit between supply and demand; the population in the supply insufficient and scarce areas for 82.78% of the total and was mainly distributed in the marginal areas of the four districts around the city and the six districts of the inner city. (2) For integrated public health resources, the degree of SDM was generally good. It had a circular structure that gradually shrank from the core to the edge. In order to promote the supply–demand balance of urban public health resources, this paper proposed three strategies involving three aspects: the supply, accessibility, and demand of urban public health resources. These strategies involve the service supply level, urban traffic network and slow traffic, development intensity, and population scale. Full article
Show Figures

Figure 1

22 pages, 8792 KiB  
Article
Impact of Environmental Exposure on Chronic Diseases in China and Assessment of Population Health Vulnerability
by Zhibin Huang, Chunxiang Cao, Min Xu and Xinwei Yang
ISPRS Int. J. Geo-Inf. 2023, 12(4), 155; https://doi.org/10.3390/ijgi12040155 - 06 Apr 2023
Cited by 1 | Viewed by 1968
Abstract
Although numerous epidemiological studies have demonstrated a relationship between environmental factors and chronic diseases, there is a lack of comprehensive population health vulnerability assessment studies from the perspective of environmental exposure, population sensitivity and adaptation on a regional scale. To address this gap, [...] Read more.
Although numerous epidemiological studies have demonstrated a relationship between environmental factors and chronic diseases, there is a lack of comprehensive population health vulnerability assessment studies from the perspective of environmental exposure, population sensitivity and adaptation on a regional scale. To address this gap, this study focused on six high-mortality chronic diseases in China and constructed an exposure–sensitivity–adaptability framework-based index system using multivariate data. The constructed system effectively estimated health vulnerability for the chronic diseases. The R-square between vulnerability and mortality rates for respiratory diseases and malignant tumors exceeded 0.7 and was around 0.6 for the other four chronic diseases. In 2020, Chongqing exhibited the highest vulnerability to respiratory diseases. For heart diseases, vulnerability values exceeding 0.5 were observed mainly in northern and northeastern provinces. Vulnerability values above 0.5 were observed in Jiangsu, Shanghai, Tianjin, Shandong and Liaoning for cerebrovascular diseases and malignant tumors. Shanghai had the highest vulnerability to endogenous metabolic diseases, and Tibet exhibited the highest vulnerability to digestive system diseases. The main related factor analysis results show that high temperature and humidity, severe temperature fluctuations, serious air pollution, high proportion of middle-aged and elderly population, as well as high consumption of aquatic products, red meat and eggs increased health vulnerability, while increasing per capita educational resources helped reduce vulnerability. Full article
Show Figures

Figure 1

20 pages, 6169 KiB  
Article
Identify Important Cities in the Belt and Road Comprehensive Traffic Network
by Fengjie Xie, Xiao Wang and Cuiping Ren
ISPRS Int. J. Geo-Inf. 2023, 12(4), 154; https://doi.org/10.3390/ijgi12040154 - 05 Apr 2023
Cited by 1 | Viewed by 1264
Abstract
The Belt and Road has developed rapidly in recent years. Constructing a comprehensive traffic network is conducive to promoting the development of the the Belt and Road. To optimize the layout of the Belt and Road comprehensive traffic network, this paper identifies important [...] Read more.
The Belt and Road has developed rapidly in recent years. Constructing a comprehensive traffic network is conducive to promoting the development of the the Belt and Road. To optimize the layout of the Belt and Road comprehensive traffic network, this paper identifies important cities. First, a weighted super adjacency matrix is defined, which includes sea, air, railway transportation and trans-shipment transportation between these transportation modes. With this matrix, the Belt and Road comprehensive traffic network (B&RCTN) is constructed. To identify important node cities, this paper proposes a method to calculate multi-layer centrality which considers inter-layer relationships. With the results of the above four centrality indexes, the Entropy Weight TOPSIS is used to synthesize the evaluation of the four indexes. Finally, the multi-layer comprehensive centrality rank of node cities is obtained. Result shows that there are 72 important cities in B&RCTN. These important cities are mainly distributed in the east and west of Eurasia. Eastern cities are located in East Asia and Southeast Asia, including 36 cities such as Singapore, Shanghai, Guangzhou, Shenzhen and Hong Kong. Western cities are concentrated in West Asia, Western Europe and North Africa along the Mediterranean coast, including 31 cities such as Istanbul, Dubai, Vienna, Trieste and Koper. There are few important cities in central Eurasia, except Almaty in Central Asia and Colombo in South Asia. In addition, important cities also include Moscow in Eastern Europe, Lagos and Lome in West Africa. Finally, based on the distribution of important cities, this paper puts forward some suggestions on the development of the Belt and Road comprehensive transportation. Full article
Show Figures

Figure 1

19 pages, 10532 KiB  
Article
A Spherical Volume-Rendering Method of Ocean Scalar Data Based on Adaptive Ray Casting
by Weijie Li, Changxia Liang, Fan Yang, Bo Ai, Qingtong Shi and Guannan Lv
ISPRS Int. J. Geo-Inf. 2023, 12(4), 153; https://doi.org/10.3390/ijgi12040153 - 05 Apr 2023
Cited by 1 | Viewed by 1472
Abstract
There are some limitations in traditional ocean scalar field visualization methods, such as inaccurate expression and low efficiency in the three-dimensional digital Earth environment. This paper presents a spherical volume-rendering method based on adaptive ray casting to express ocean scalar field. Specifically, the [...] Read more.
There are some limitations in traditional ocean scalar field visualization methods, such as inaccurate expression and low efficiency in the three-dimensional digital Earth environment. This paper presents a spherical volume-rendering method based on adaptive ray casting to express ocean scalar field. Specifically, the minimum bounding volume based on spherical mosaic is constructed as the proxy geometry, and the depth texture of the seabed terrain is applied to determine the position of sampling points in the spatial interpolation process, which realizes the fusion of ocean scalar field and seabed terrain. Then, we propose an adaptive sampling step algorithm according to the heterogeneous depth distribution and data change rate of the ocean scalar field dataset to improve the efficiency of the ray-casting algorithm. In addition, this paper proposes a nonlinear color-mapping enhancement scheme based on the skewness characteristics of the datasets to optimize the expression effect of volume rendering, and the transparency transfer function is designed to realize volume rendering and local feature structure extraction of ocean scalar field data in the study area. Full article
Show Figures

Figure 1

19 pages, 7299 KiB  
Article
Location Scheme of Routine Nucleic Acid Testing Sites Based on Location-Allocation Models: A Case Study of Shenzhen City
by Siwaner Wang, Qian Sun, Pengfei Chen, Hui Qiu and Yang Chen
ISPRS Int. J. Geo-Inf. 2023, 12(4), 152; https://doi.org/10.3390/ijgi12040152 - 05 Apr 2023
Cited by 1 | Viewed by 1652
Abstract
Since late 2019, the explosive outbreak of Coronavirus Disease 19 (COVID-19) has emerged as a global threat, necessitating a worldwide overhaul of public health systems. One critical strategy to prevent virus transmission and safeguard public health, involves deploying Nucleic Acid Testing (NAT) sites. [...] Read more.
Since late 2019, the explosive outbreak of Coronavirus Disease 19 (COVID-19) has emerged as a global threat, necessitating a worldwide overhaul of public health systems. One critical strategy to prevent virus transmission and safeguard public health, involves deploying Nucleic Acid Testing (NAT) sites. Nevertheless, determining the optimal locations for public NAT sites presents a significant challenge, due to the varying number of sites required in different regions, and the substantial influences of population, the population heterogeneity, and daily dynamics, on the effectiveness of fixed location schemes. To address this issue, this study proposes a data-driven framework based on classical location-allocation models and bi-objective optimization models. The framework optimizes the number and location of NAT sites, while balancing various cost constraints and adapting to population dynamics during different periods of the day. The bi-objective optimization process utilizes the Knee point identification (KPI) algorithm, which is computationally efficient and does not require prior knowledge. A case study conducted in Shenzhen, China, demonstrates that the proposed framework provides a broader service coverage area and better accommodates residents’ demands during different periods, compared to the actual layout of NAT sites in the city. The study’s findings can facilitate the rapid planning of primary healthcare facilities, and promote the development of sustainable healthy cities. Full article
Show Figures

Figure 1

23 pages, 7228 KiB  
Article
Land Cover Impacts on Surface Temperatures: Evaluation and Application of a Novel Spatiotemporal Weighted Regression Approach
by Chao Fan, Xiang Que, Zhe Wang and Xiaogang Ma
ISPRS Int. J. Geo-Inf. 2023, 12(4), 151; https://doi.org/10.3390/ijgi12040151 - 03 Apr 2023
Cited by 3 | Viewed by 1786
Abstract
The urban heat island (UHI) effect is an important topic for many cities across the globe. Previous studies, however, have mostly focused on UHI changes along either the spatial or temporal dimension. A simultaneous evaluation of the spatial and temporal variations is essential [...] Read more.
The urban heat island (UHI) effect is an important topic for many cities across the globe. Previous studies, however, have mostly focused on UHI changes along either the spatial or temporal dimension. A simultaneous evaluation of the spatial and temporal variations is essential for understanding the long-term impacts of land cover on the UHI. This study presents the first evaluation and application of a newly developed spatiotemporal weighted regression framework (STWR), the performance of which was tested against conventional models including the ordinary least squares (OLS) and the geographically weighted regression (GWR) models. We conducted a series of simulation tests followed by an empirical study over central Phoenix, AZ. The results show that the STWR model achieves better parameter estimation and response prediction results with significantly smaller errors than the OLS and GWR models. This finding holds true when the regression coefficients are constant, spatially heterogeneous, and spatiotemporally heterogeneous. The empirical study reveals that the STWR model provides better model fit than the OLS and GWR models. The LST has a negative relationship with GNDVI and LNDVI and a positive relationship with GNDBI for the three years studied. Over the last 20 years, the cooling effect from green vegetation has weakened and the warming effect from built-up features has intensified. We suggest the wide adoption of the STWR model for spatiotemporal studies, as it uses past observations to reduce uncertainty and improve estimation and prediction results. Full article
Show Figures

Figure 1

15 pages, 1842 KiB  
Article
Joint Deep Learning and Information Propagation for Fast 3D City Modeling
by Yang Dong, Jiaxuan Song, Dazhao Fan, Song Ji and Rong Lei
ISPRS Int. J. Geo-Inf. 2023, 12(4), 150; https://doi.org/10.3390/ijgi12040150 - 02 Apr 2023
Viewed by 1299
Abstract
In the field of geoinformation science, multiview, image-based 3D city modeling has developed rapidly, and image depth estimation is an important step in it. To address the problems of the poor adaptability of training models of existing neural network methods and the long [...] Read more.
In the field of geoinformation science, multiview, image-based 3D city modeling has developed rapidly, and image depth estimation is an important step in it. To address the problems of the poor adaptability of training models of existing neural network methods and the long reconstruction time of traditional geometric methods, we propose a general depth estimation method for fast 3D city modeling that combines prior knowledge and information propagation. First, the original image is downsampled and input into the neural network to predict the initial depth value. Then, depth plane fitting and joint optimization are combined with the superpixel information and the superpixel optimized depth value is upsampled to the original resolution. Finally, the depth information propagation is checked pixel-by-pixel to obtain the final depth estimate. Experiments were conducted using multiple image datasets taken from actual indoor and outdoor scenes. Our method was compared and analyzed with a variety of existing widely used methods. The experimental results show that our method maintains high reconstruction accuracy and a fast reconstruction speed, and it achieves better performance. This paper offers a framework to integrate neural networks and traditional geometric methods, which provide a new approach for obtaining geographic information and fast 3D city modeling. Full article
Show Figures

Figure 1

Previous Issue
Next Issue
Back to TopTop