1. Introduction
An analysis of the literature shows that 3D city models are increasingly being used to manage space [
1]. A possibility of their application is the registration of property rights in three dimensions, which definitely facilitates insight into the complex legal situations that can be observed in multi-story buildings [
2,
3,
4,
5,
6,
7] and under the ground [
8,
9,
10,
11,
12,
13]. Based on this, the land administration has a chance to build a properly functioning 3D cadastre [
14]. As a result, work on prototype solutions is increasingly being carried out around the world [
15,
16,
17].
However, despite the already advanced work on building national 3D cadastre models in many parts of the world and the possibility of building very detailed 3D models of cities, relatively few specialists have focused on the aspects of visualizing property rights in three dimensions. This does not mean that the problem has gone unnoticed. In contrast, it was raised more extensively for the first time at an international scientific forum during the 5th International FIG Workshop on 3D Cadastres in 2016 [
18]. In order to synthesize the knowledge at the time and identify directions for research in this area, the workshop participants identified three issues that should be analyzed and then taken into account when creating visualizations of 3D cadastre data. These were: (i) user needs [
19]; (ii) visualized data [
20,
21,
22,
23]; and (iii) visualization platforms [
24].
Obviously, images depicting property rights in three dimensions will be perceived subjectively by users. This perception will depend not only on the individual needs of the user but also on the characteristics of the image shown to the user (e.g., type of view, contrast, color saturation, etc.) and the visual variables used to represent the objects in it (e.g., color, transparency, texture, etc.). A major challenge will undoubtedly be to take into account the often-overlooked fact that more than a dozen types of color recognition disorders exist in humans [
25]. Preparing visualizations that are readable by all will therefore not be a simple task. Therefore, to identify the most comprehensible visualization methods for potential viewers, it seems necessary to study the perception of images representing 3D cadastre data. However, such analyses are most often carried out from the perspective of real estate experts [
26,
27,
28,
29,
30,
31].
Additionally, to complement the research carried out so far on the visualization of property rights in three dimensions, the authors decided to test whether the perception of such images could be influenced by a lack of familiarity with real estate cadastral issues. Thus, the research group consisted not only of experts (in this case, surveyors), but above all, representatives of other professions. Thus, the research aims to investigate the perception of the visualization of multidimensional real estate data using different visual variables and by different audiences.
2. State of the Art
The visualization of cadastral data is not a new concept. Techniques for representing land on maps began to develop in ancient times [
32] and are being upgraded all the time [
33]. Nowadays, the physical and legal complexity of the urban environment prompts the registration of properties using the latest methods. As a result, work is underway in many parts of the world to transform the cadastre from two to three dimensions [
34,
35]. There are, of course, various difficulties and challenges associated with these efforts. These undoubtedly include the visualization of property rights defined in 3D. It should be done in such a way that it is clear and thus useful to all its potential recipients.
As a result of the need to develop good practices for the visualization of 3D cadastre data, a worldwide scientific discussion has been initiated, at the core of which is the work on the general theory of signs. As early as 1967, Jacques Bertin, a French geographer and cartographer, graphic theorist, and founder of graphic semiology, created a theoretical basis for the depiction of information [
36], in which he presented a comprehensive theory of the use of graphic symbols and models of graphic presentation and introduced the concept of visual variables. The types of symbols he proposed that make up a cartographic representation are point, line, area, surface (i.e., an area in 3D space that has no theoretical thickness), and volume. In turn, the variables he identified that affect visualizations are: shape, size, clarity, granularity, tone, and orientation.
Over time, in the visualization aspect of three-dimensional models, transparency has also proved important as a technique for visual enhancement. It was introduced because of its increasing use and research indicating its usefulness [
37,
38]. The comprehensive research on 3D cadastral visualization in the context of understanding users’ requirements was performed by Shojaei [
39]. The specific case—the visualization of underground objects—is discussed by Saeidian et al. [
40].
Despite the popularity of the multidimensional cadastre issue, few experts have focused on the semiology of visualizing its data. However, some experts have tried to investigate which visual variables and visual enhancement techniques are most suitable for such an application. Fortunately, 3D cadastre researchers agree that its potential users should take an active part in its creation, as evidenced by the studies conducted on the perception of the visualization of its data [
26,
27,
28,
29,
30,
31]. Analyzing the results of these studies, it can be concluded that researchers mainly consider representatives of real estate-related sectors, that is, surveyors, notaries, and officials involved in real estate management, as well as architects, construction engineers, real estate agents, and developers, as potential users of the 3D cadastre.
Thus, in face-to-face interviews with users, Pouliot and Wang investigated the need to include 3D cadastre descriptive data on the visualisation and evaluation of the location relative to the visualised objects [
26]. According to the respondents taking part in this experiment, placing the information outside the object is not useful. This conclusion agrees with Ware’s assumption that the proximity principle can help the viewer associate a text label with a symbol [
41].
In the same year, Pouliot et al. [
27] published a much more extensive study on the visualisation of 3D cadastre data, in which they tested the usefulness of visual variables (hue, saturation, value, and texture) and visual enhancement techniques (adding labels, moving elements, and transparency) to perform specific notational tasks. The research was conducted in the form of interviews with notaries using various off-the-shelf 3D models. Their results indicate that a colorful model is preferred by users over the use of textures. Furthermore, the use of transparency is only helpful in a few cases.
Therefore, this study focused exclusively on transparency [
29]. During the experiment, the researchers applied three different levels of transparency and showed that it is a technique that nevertheless makes it much easier for users to determine the extent of rights, but only in certain cases. The effectiveness is noticeable in the case of the visualization of objects with one story, while in the case of multiple stories it becomes ineffective and is not preferred by users. This empirical research was conducted in the form of an online survey. The respondents were students of notary law and geodetic science.
The work of the team, which includes Pouliot and Wang, resulted in a dissertation [
28], whose author summarized the research conducted and ultimately noted that:
Color and texture are effective and preferred in 3D cadastre data visualizations. If the texture is similar to the real one, the perception of the visualization can be more intuitive.
The orientation is not effective in the visualization of 3D cadastre data. A perspective view makes its perception ambiguous.
Brightness in the visualization of 3D cadastre data is not preferred by users. It is negatively affected by other visual variables and visual enhancement techniques [
42].
Transparency is not always effective. It interferes with the visualization of complex objects.
Detaching parts of an object (e.g., the ceiling) is preferred by users, who can then see elements that were previously invisible to them.
Labels should be placed inside or as close as possible to the symbol they describe.
Object outlines distract users’ attention from labels.
A team of authors from Belgium and Canada set out to demonstrate that there is at least one optimal 3D viewpoint for visualizing 3D objects [
30]. The research was conducted using an online form that was sent to experts (surveyors, architects, and building engineers). However, the results obtained were inconclusive and did not help in identifying the most optimal model viewpoint.
Interviews with officials using property information were carried out by Seipel et al. [
31]. They provided information on the perception of rendering attributes such as color and transparency. The project itself was based on presenting pre-prepared visual 3D representations of RRR (rights, restrictions, and responsibilities) objects. It was noted that a significant problem with the use of colors is that they change due to lighting or shading, making it impossible to directly assign one unique color to specific objects. Additionally, the use of too much transparency was found to be a problem, with the result that the objects’ initially different base colors started to resemble each other.
In summary, there is no such selection of visual variables that could be called standard and be recommended for use by all 3D cadastre developers. However, they should be selected in such a way to reduce, as much as possible, the risk that the user may make a mistake when reading the visualized data.
3. Materials and Methods
The research was conducted using a survey method applying the computer-assisted web interview (CAWI) technique [
43]. The questionnaire presented visualizations showing the extent of property rights, which were defined in three dimensions. The respondents were students at Krakow (Poland) universities who were about to enter the job market as real estate professionals or become potential property buyers. The results of the questionnaires were processed quantitatively. The results of the surveys were compiled in a quantitative manner. A diagram of the surveys carried out is shown in
Figure 1.
3.1. Visualization of Real Property Rights Defined in 3D
Visualizations of property rights defined in 3D were created in the SketchUp program [
44]. They depict typical, simple, albeit unreal situations. They show: (i) the property right; (ii) the right of perpetual usufruct; and (iii) the cooperative ownership right to premises, which is one of the limited real rights [
45].
The ownership right is a legal category that does not need to be explained. However, it should be emphasized that the ownership rights to the common parts of the building, such as the staircase, and the right to the land on which the building on which the premises are located is associated with the ownership rights to the premises [
46]. In contrast, the other visualized rights to real estate are specific to the Polish legal system. Thus, the right of perpetual usufruct is the lease of land owned by the State Treasury, region, county, or commune (or an association of those entities) to a natural or legal person for a specified time (40–99 years) and for a specified purpose [
45]. Alternatively, the cooperative ownership right to premises is a form of use of premises belonging to a housing cooperative. It involves the possibility of using the premises and disposing of the right to the use of the premises, including the possibility of renting it out or giving it away for free use in accordance with its purpose. Since 31 July 2007, it has not been possible to create new rights of this type, but they are still available to persons in whose favor they were established before that date [
47].
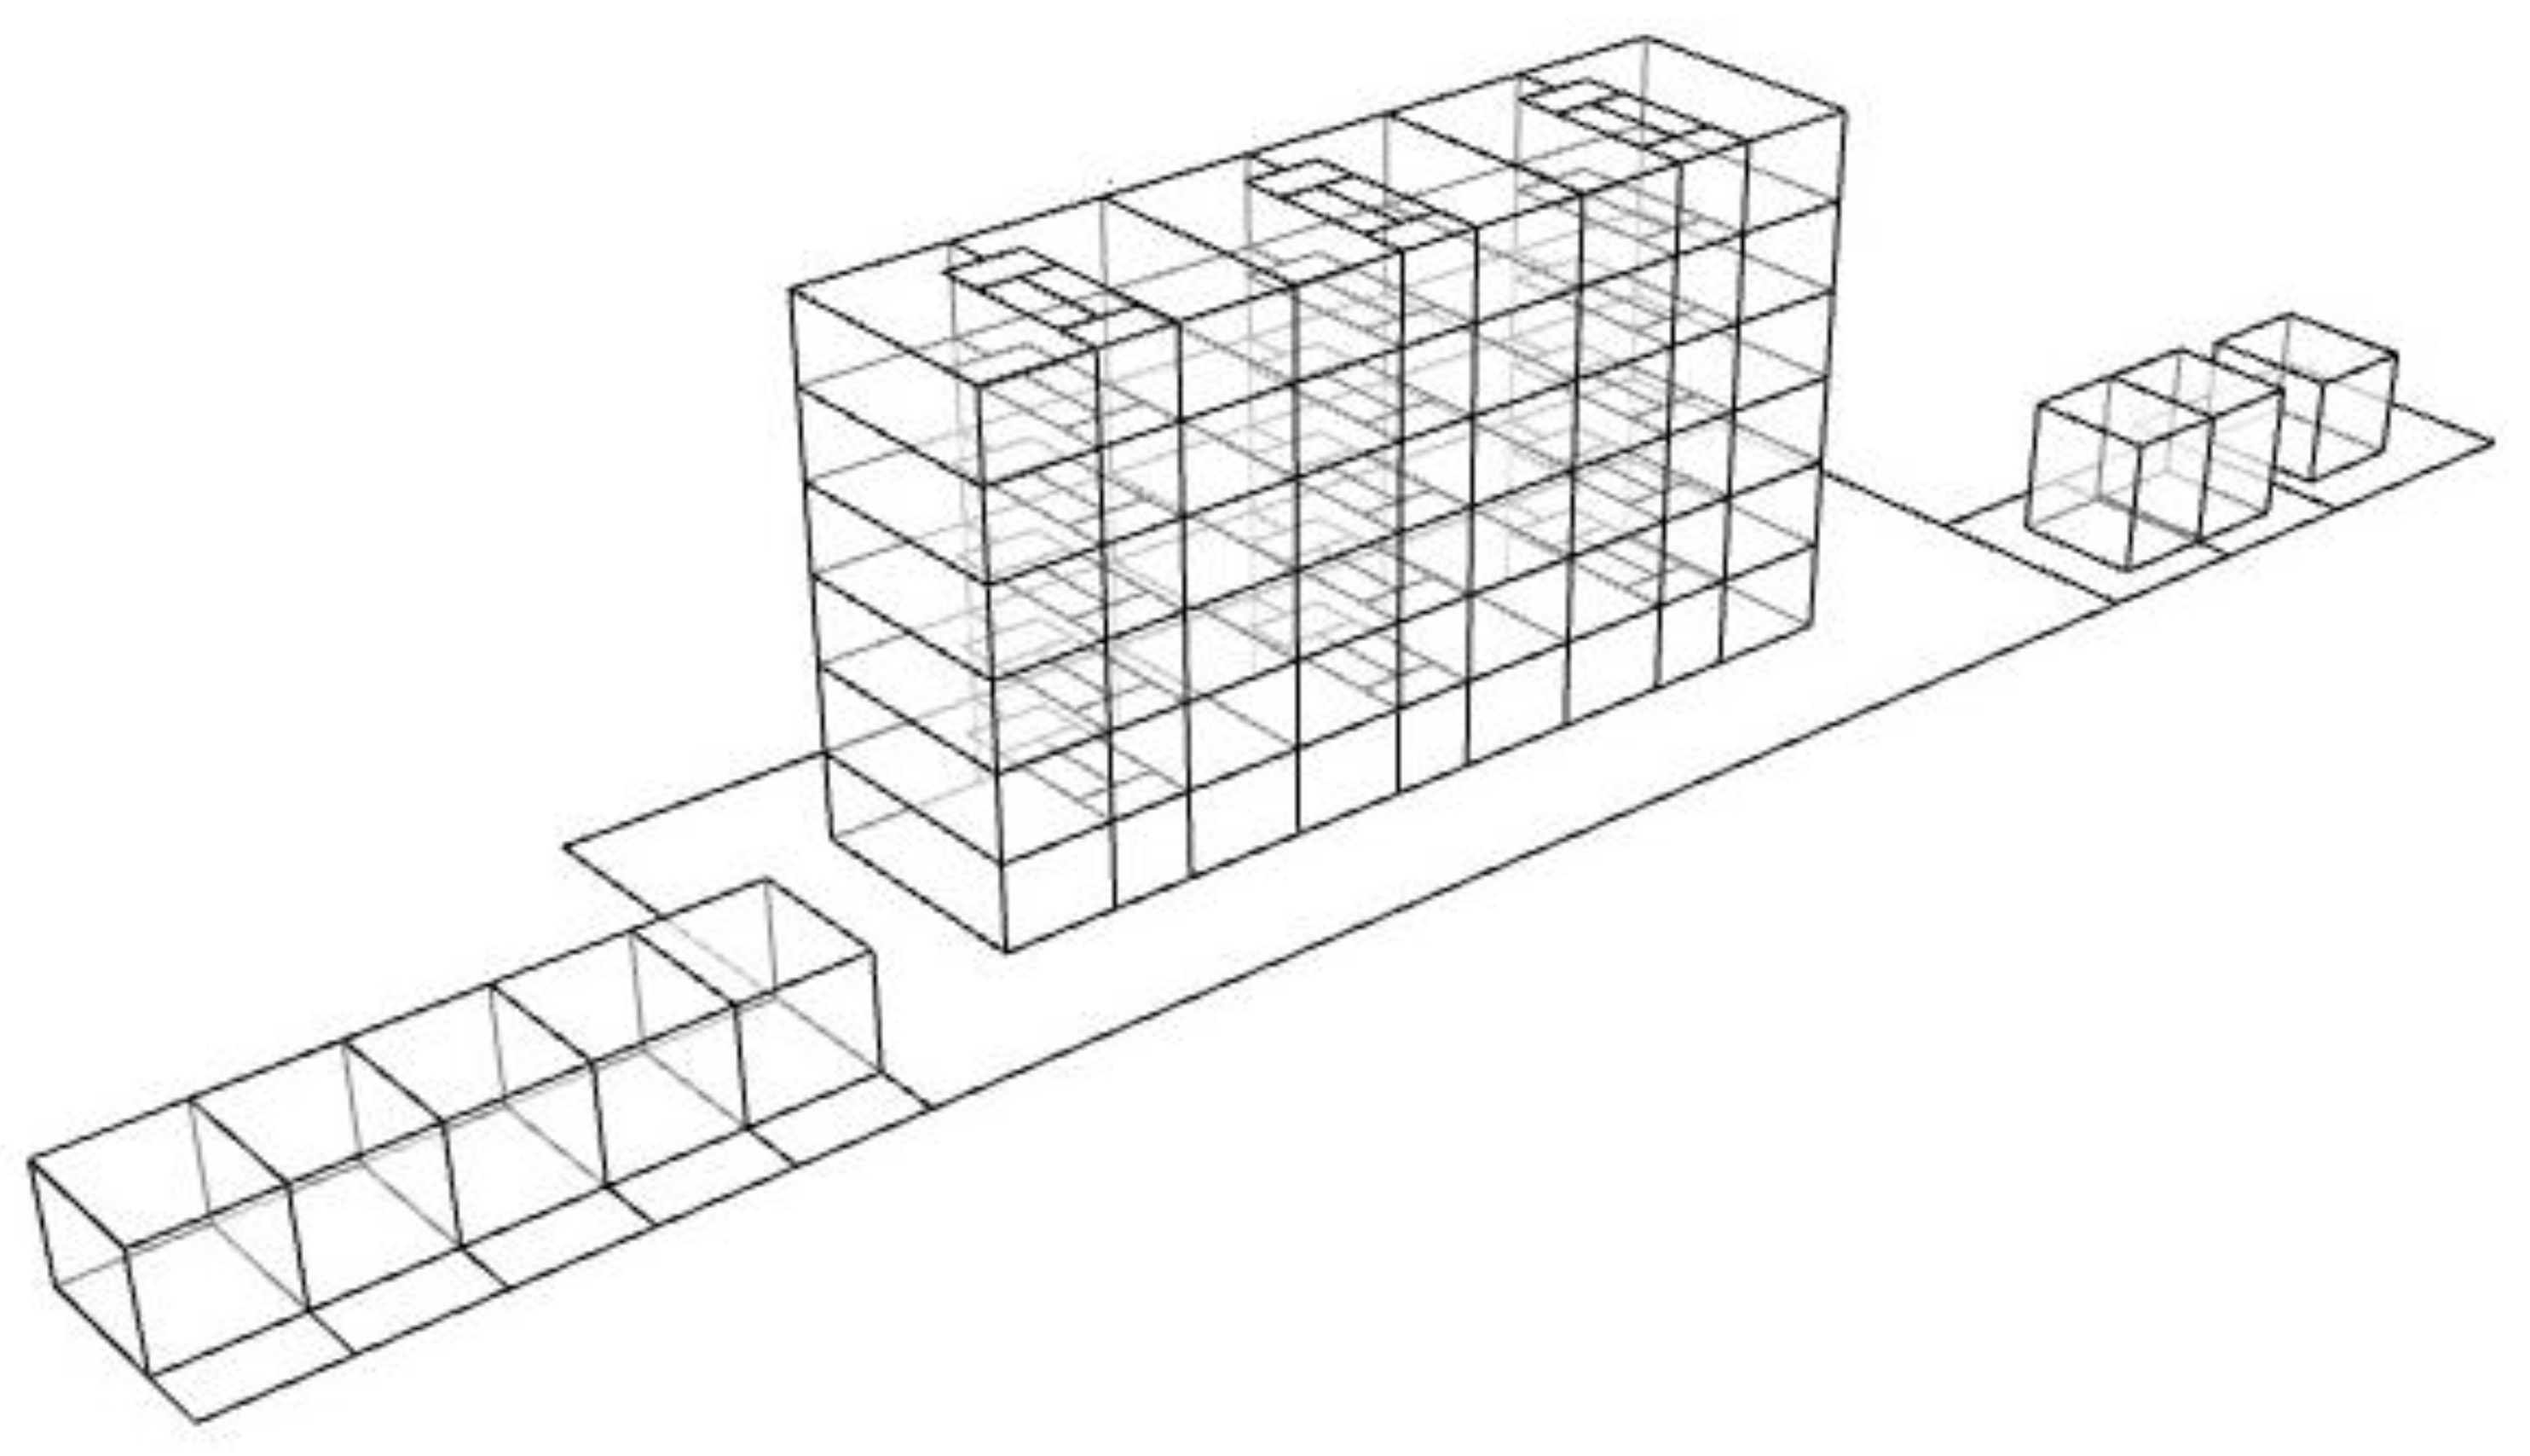
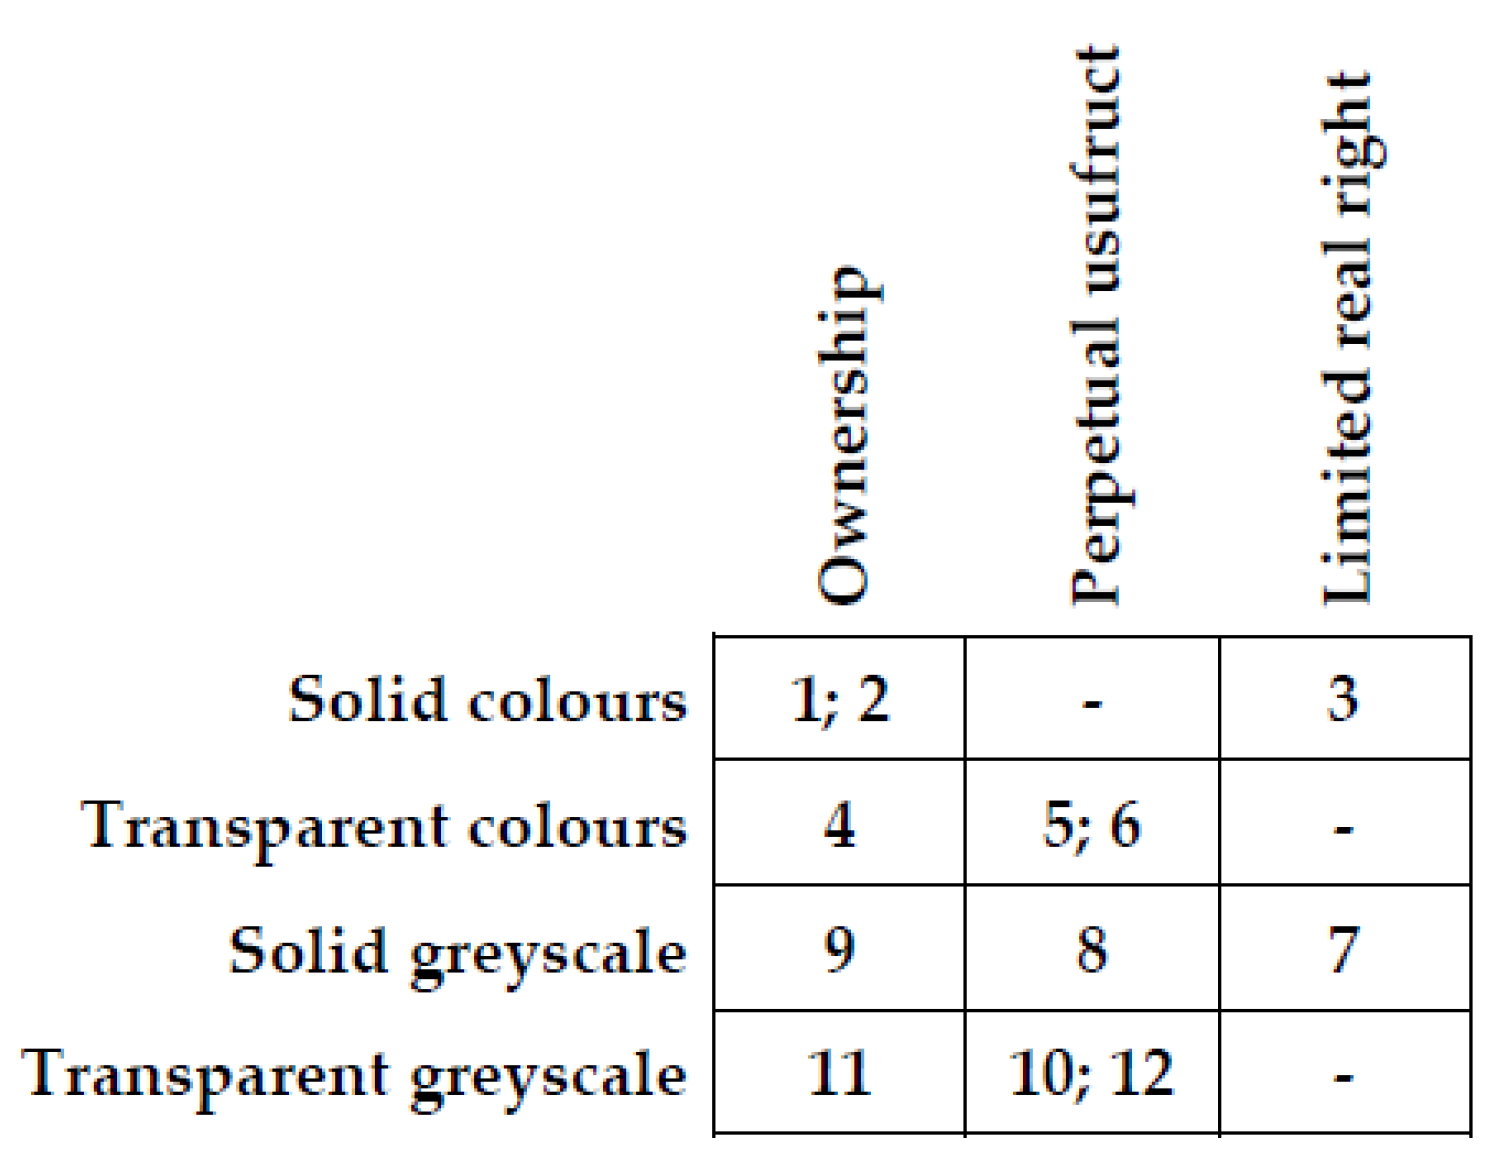
A skeleton model (
Figure 2) has been drawn up to visualize the extent of these rights, showing (from left): (i) terraced buildings; (ii) a multi-family building with separate residential units and common parts; (iii) semi-detached single-family buildings; (iv) a detached single-family building.
The model has a very simple geometry, as the authors of the questionnaire wanted respondents to pay attention to the visual variables (color and transparency) and not to the varying shapes of the objects. However, for this reason, the model was presented in the survey in two color schemes (
Table 1): (i) colorful and (ii) grayscale. Additionally, each of the applied color schemes was also used to create visualizations with the transparent fill option set to 50% and without it.
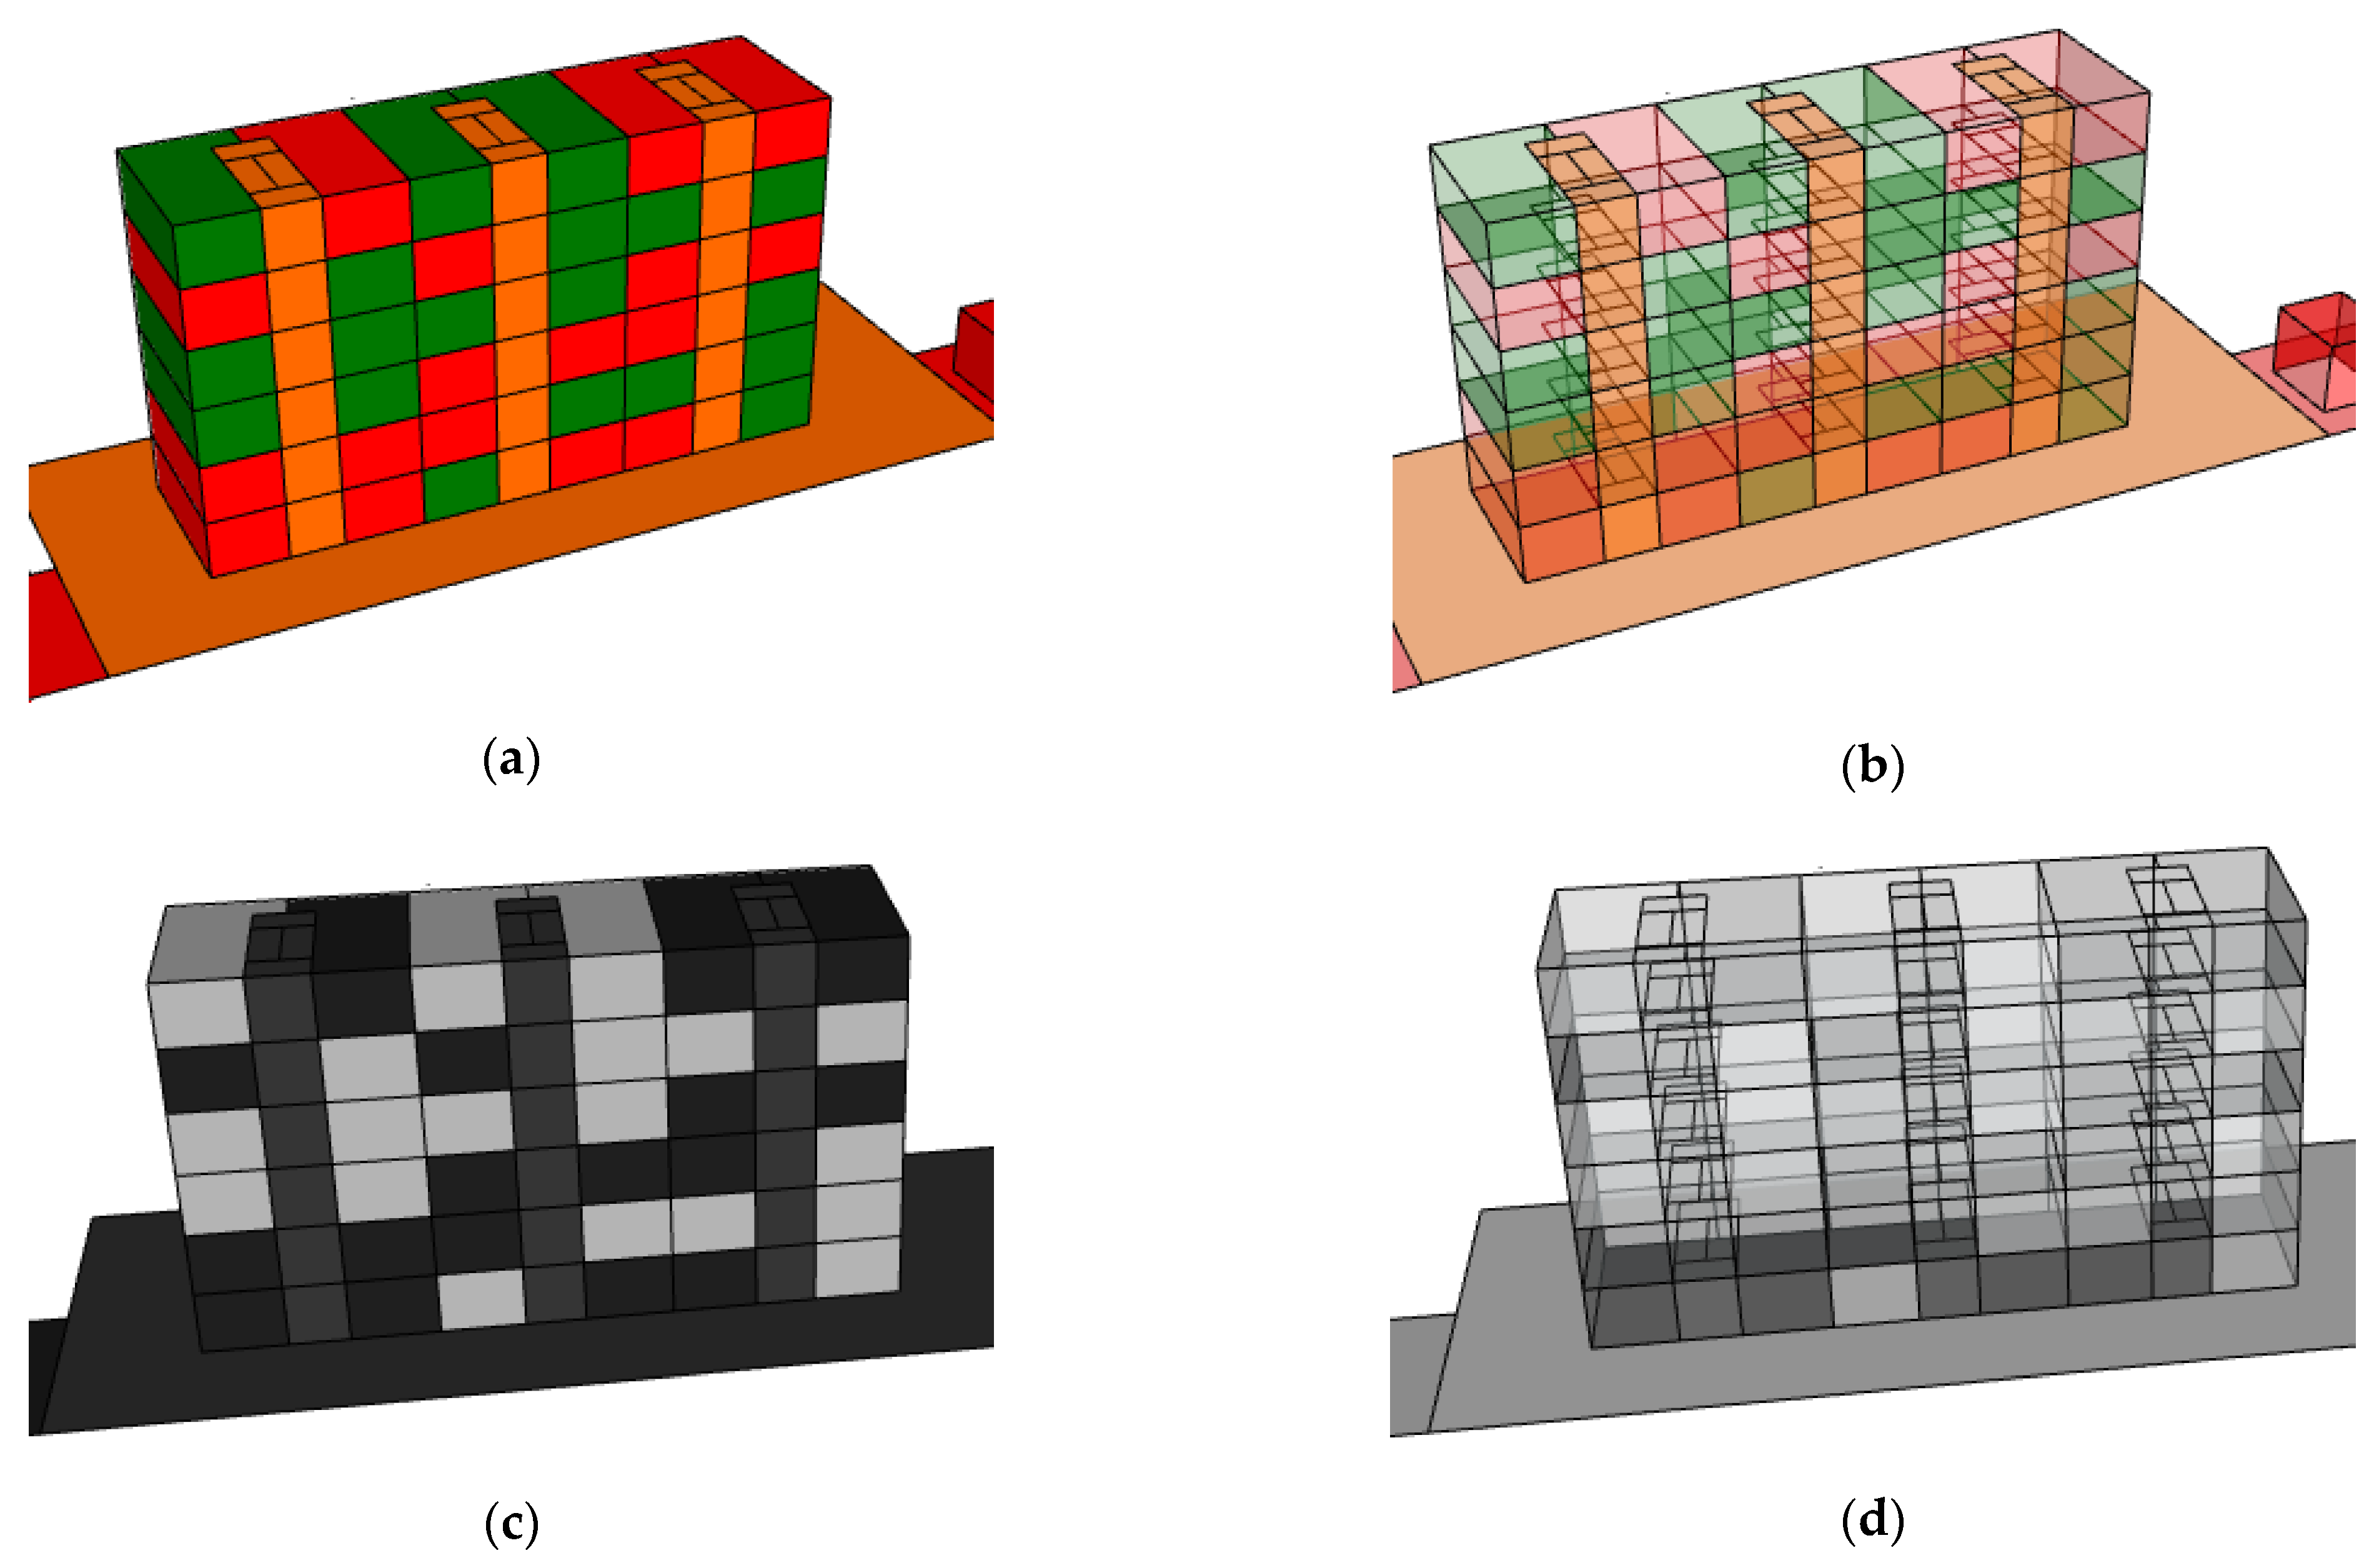
The selection of colors in the color scheme was based on the idea of “traffic lights” [
48], which users of physical maps should also associate with the colors used to mark the terrain’s elevation. The property right, as the strongest and broadest of rights that allows almost unlimited management of the property, was depicted using the color red, which is associated with warning, to draw special attention to these objects. Perpetual usufruct is depicted in yellow, and cooperative ownership of premises is depicted in green. Additionally, orange has been used to denote ownership of common parts in the building and to the land under that building. Such a distinction was deemed necessary because, under Polish law, the owners of the buildings marked in orange are, in part, the owners of all the premises in the building (including the owners of those properties to which limited real rights have been assigned). In the grayscale scheme, different gray cut-offs have been used (from almost black for ownership to light gray for the limited real right). The visualizations created according to the assumptions described above are shown in
Figure 3.
3.2. Questionnaire
The questionnaire was prepared as a Google form and made available to respondents online in the Polish language. Members of the research team were available to respondents in real time in case questions about the content of the questionnaire arose or technical problems occurred during its completion. They were accessible via electronic communication means or in person if the respondent decided to complete the questionnaire in the presence of the interviewer. Responses were recorded in real time in a database, with respondents’ anonymity ensured. The survey was divided into three sections:
The introduction, which included an invitation to complete the survey and presented the research problem;
The research part included a short theoretical introduction reminding of the definitions of individual property rights (at the same time, its task was to bridge the differences in the level of knowledge in this area between the real estate professional group and the other groups) and twelve closed-ended single-choice questions on visualization:
qn 1—the property right presented in solid colors;
qn 2—property right, solid colors;
qn 3—limited property rights, solid colors;
qn 4—property right, transparent colors;
qn 5—perpetual usufruct right, transparent colors;
qn 6—perpetual usufruct right, transparent colors;
qn 7—limited property rights, grayscale solid colors;
qn 8—perpetual usufruct right, grayscale solid;
qn 9—property right, grayscale solid;
qn 10—perpetual usufruct right, grayscale transparent;
qn 11—property right, grayscale transparent;
qn 12—perpetual usufruct right, grayscale transparent).
The questions were based on the analysis of the literature presented in
Section 2. On this basis, the visual variables whose impact on perception was to be checked and the research method were selected. First, visualizations were made, and then questions were developed. The respondents were tasked with answering these according to their knowledge of property law. They were not told what each color meant. They were only informed that a given color meant the same right in each question. Respondents were free to move around the panel in this section and returned to the theoretical section several times. Its questionnaire is included in
Table A1 (
Appendix A).
- 3.
Metrics, which included two questions related to gender and the professional group to which the survey participant belonged.
The time to complete the questionnaire was unlimited and was not controlled in any way during the study. It should be noted that the questions that dealt with the same law and were illustrated using the same visual variables dealt with different legal situations and had different degrees of difficulty (questions 1 and 2 and 5 and 6), but also (in one case, questions 10 and 12) provided a small check on the reliability of the answers. Thus:
Questions 1 and 2 (property rights, non-transparent color): the first one concerns a very simple situation where the building and the land are covered by the same property rights. The second, on the other hand, shows a building located on a parcel of land covered by a property right, with premises covered by a property right and a limited real right. The situation is more complex. The ownership right in question (to the common parts in the building and to the land) is held by all persons who have ownership rights to all the premises located in the building.
Questions 5 and 6 (perpetual usufruct, transparent color): Question 5 refers to the simpler situation where the building is covered by the right of ownership and the land underneath is covered by the right of perpetual usufruct. Question 6, on the other hand, shows a building located on a parcel of land covered by perpetual usufruct, with premises covered by ownership and a limited real right. The situation is therefore a little more complex and examines whether respondents see a difference between the color of the parcel of land (yellow) and the color of the common parts of the building (orange).
Questions 10 and 12 (right of perpetual usufruct, grayscale, transparent) are comparable. They only show a different configuration of objects.
3.3. Survey Participants
The survey was conducted in one of Poland’s (Central and Eastern Europe, a member state of the European Union) largest academic centers—Krakow. This city, as the second largest in the country in terms of area (327 square kilometers) and population (ca. 800,000), guaranteed a large diversity of professional groups to complete the questionnaire. The following universities function here: Jagiellonian University with Collegium Medicum, the University of Economics, the Pedagogical University, the University of Agriculture, the Academy of Music, the Academy of Fine Arts, the Academy of Physical Education, the Academy of Theatre Arts, and two technical universities, including the AGH University of Science and Technology, from which a significant number of respondents came, as well as two ecclesiastical universities.
The respondents were students who: (i) are fluent in Polish; (ii) were brought up and received their secondary education in the Polish legal realities and are therefore familiar with Polish real estate law at a level sufficient to complete the questionnaire. None of the respondents reported having a color recognition disorder.
The questionnaire was completed by 212 people, including 116 women and 96 men (respondents were given the option to report a different gender identity by writing down the name of the one they identify with, but none took this option). These persons were divided into six research groups, selected according to the field of study: (i) geodetic science; (ii) environmental engineering; (iii) medicine; (iv) sports; (v) mechanics; and (vi) management. Based on known cases of survey research on the perception [
49] and behavior of various social groups [
50], it was assumed that there would be at least 30 participants in each analyzed occupational group. The number of interviewees in each group is shown in
Table 2.
3.4. Compilation of Results
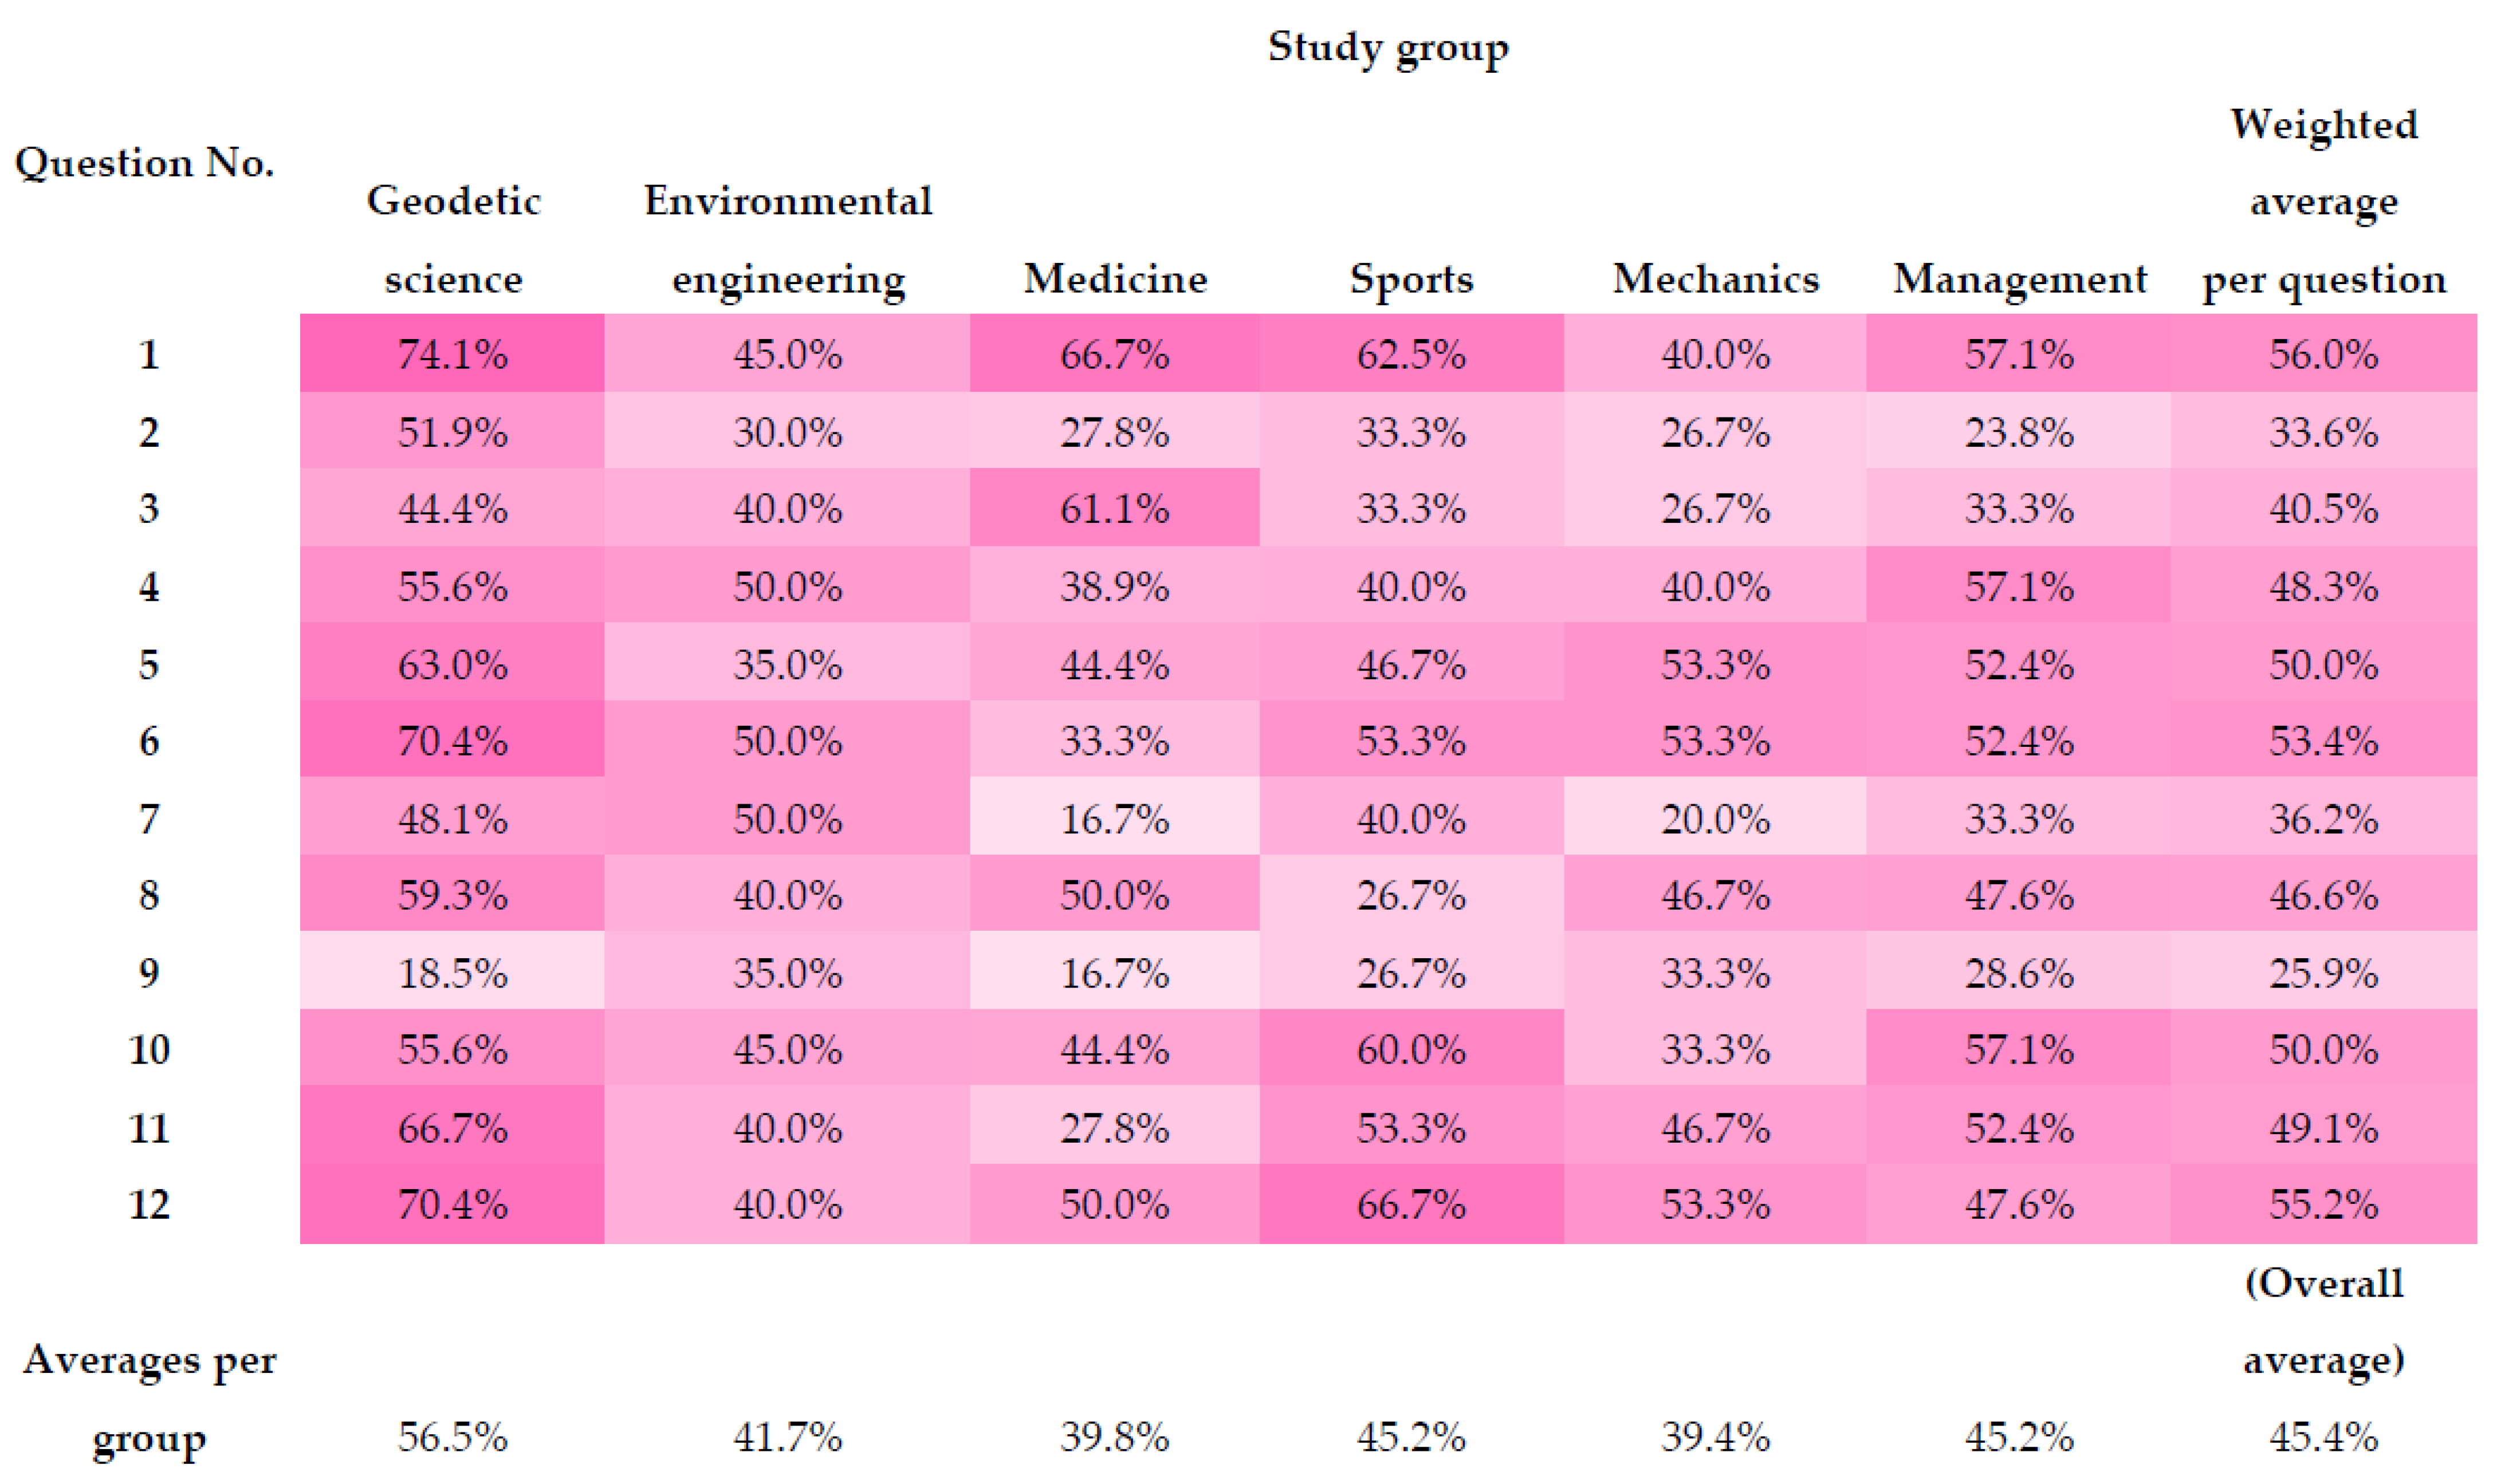
The results of the questionnaires were processed quantitatively by analyzing the percentage of correct answers given to the individual questions. Subsequently, using a heatmap, it was checked how they developed in:
The entire group that took the survey (
Figure 4, column ‘Weighted average per question l’);
Survey groups are extracted by the fields of study studied by the respondents (
Figure 4);
The entire group according to the gender declared by the respondents (
Figure 5,
Figure 6 and
Figure 7, column ‘Weighted average per question’);
The research groups extracted from the fields of study the respondents declared, with a breakdown by the respondents’ declared gender (
Figure 5,
Figure 6 and
Figure 7);
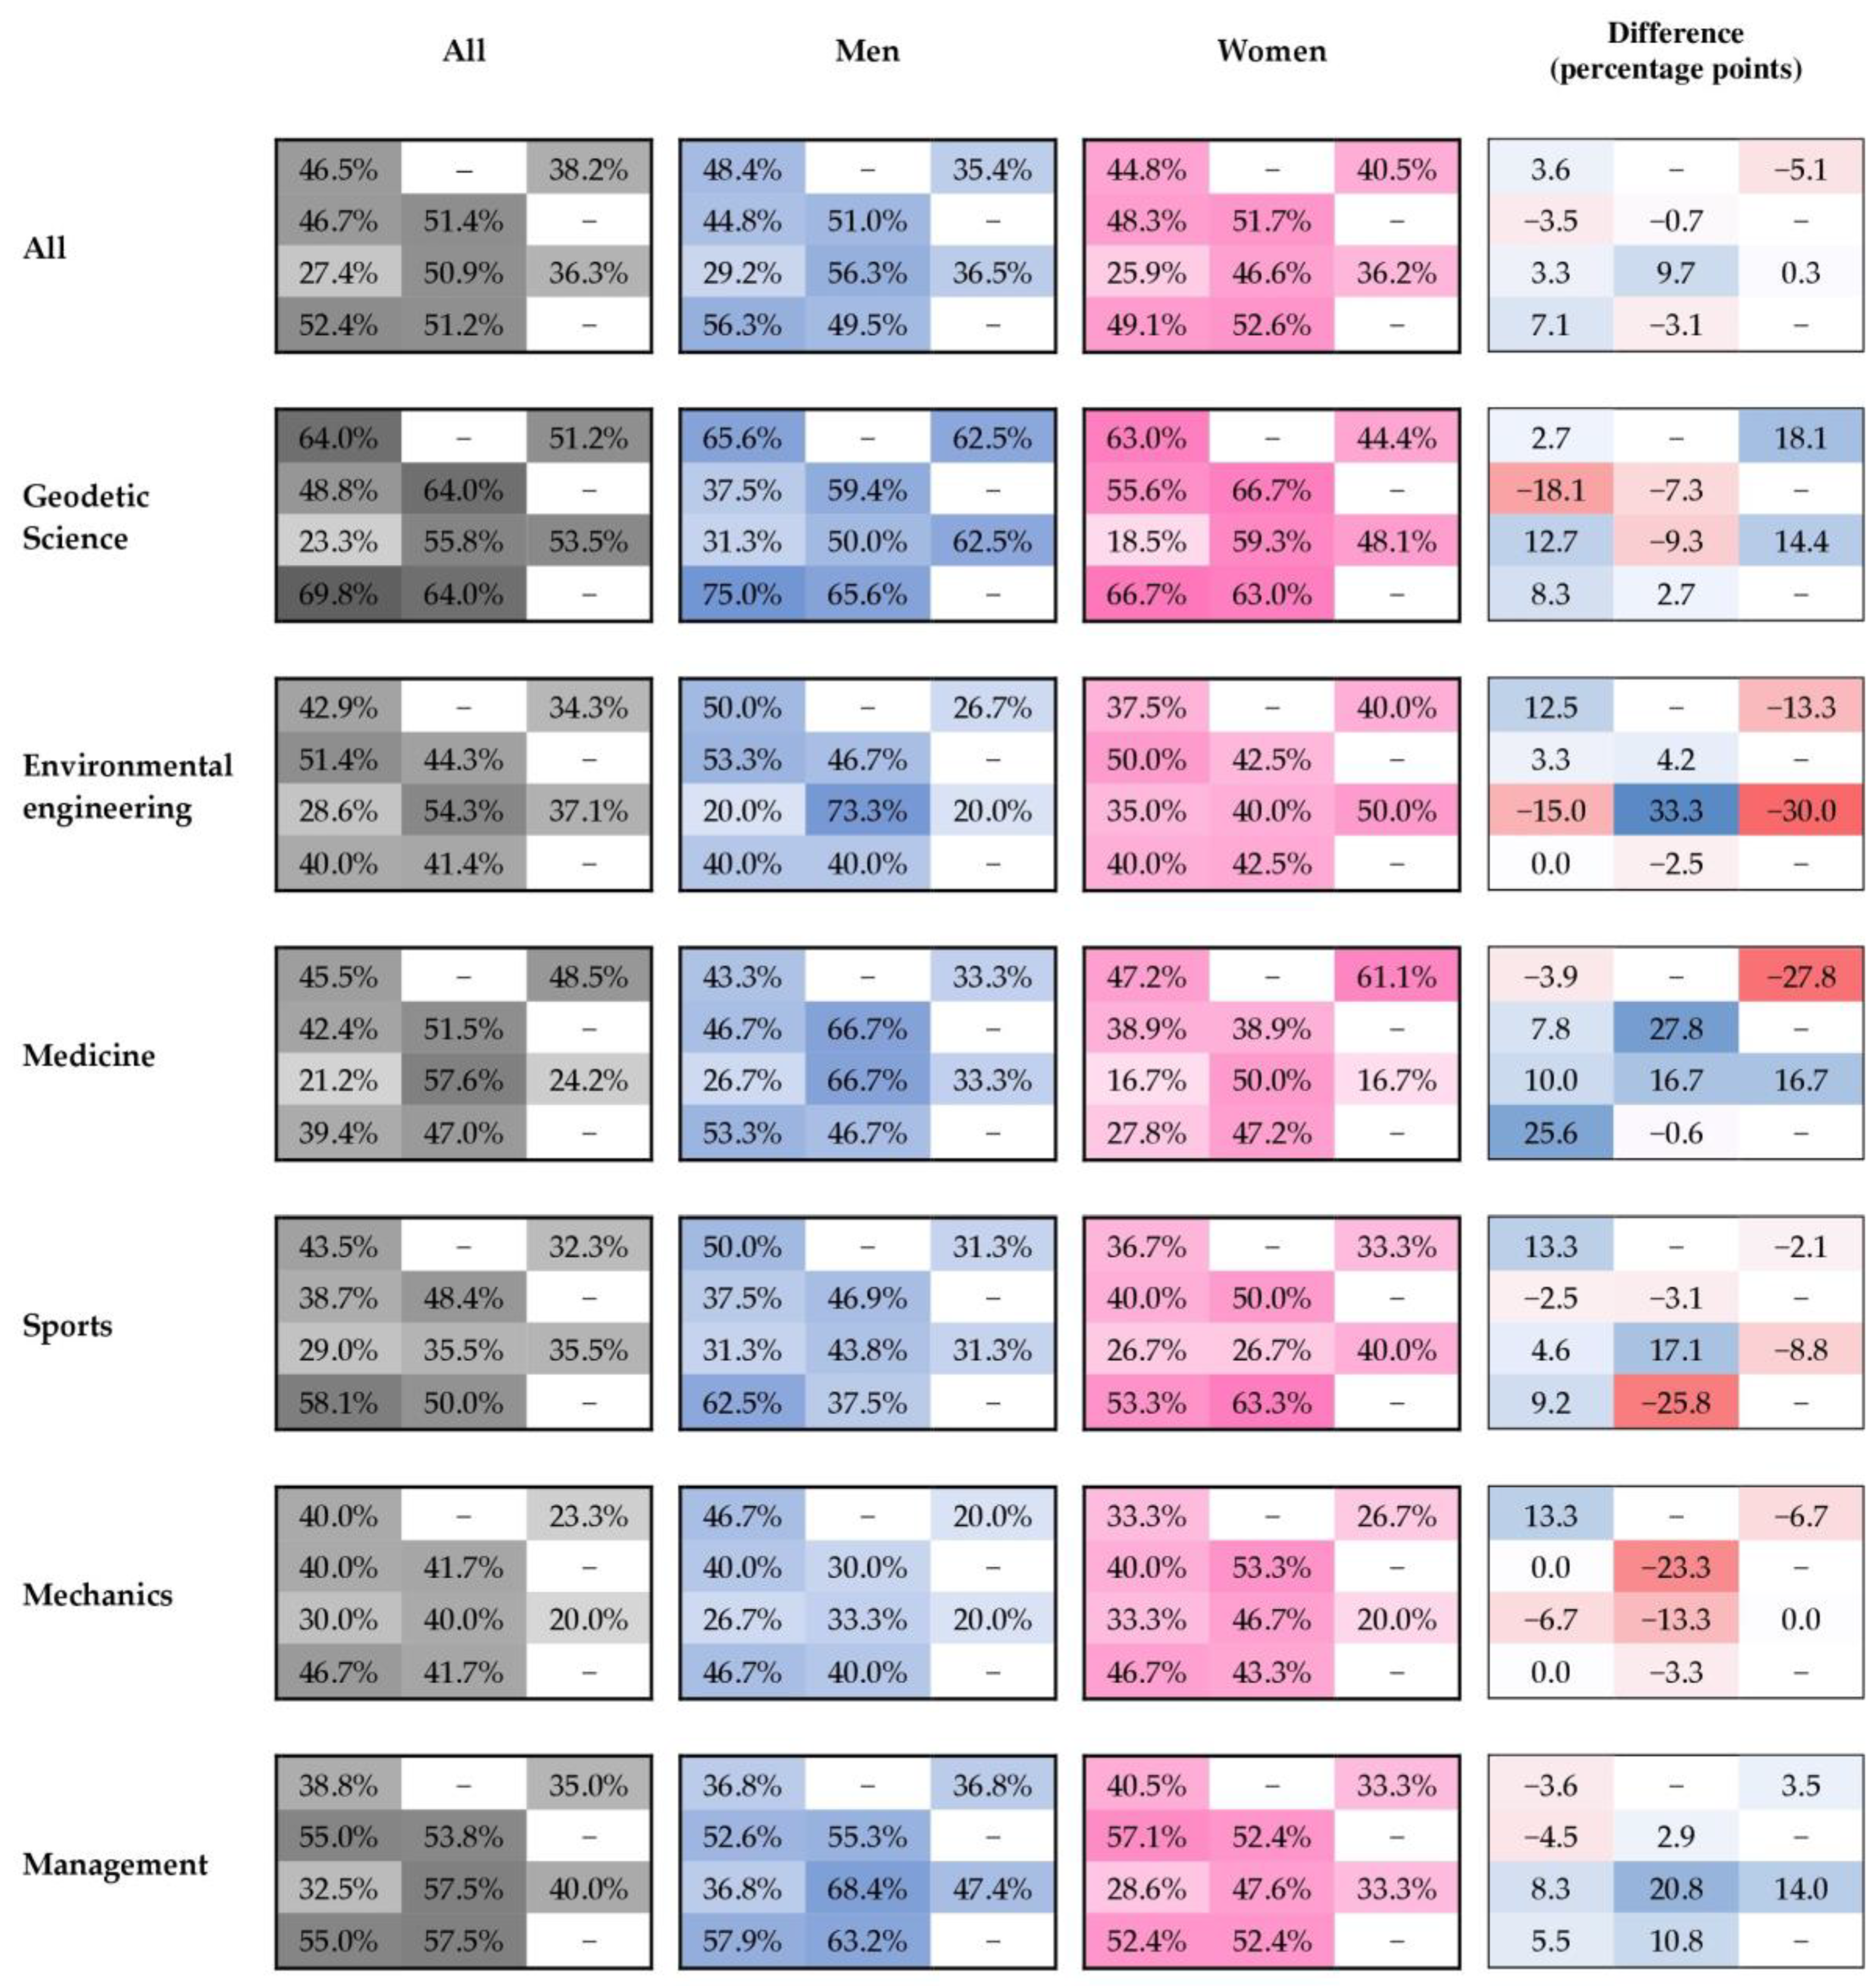
The entire group of respondents, taking into account the visualization parameters used to show the specific rights assigned to the property (
Figure 8, columns ‘men’, ‘women’, and ‘difference’).
The entire group that took the survey with the visualization parameters used to show the specific right assigned to the property (
Figure 9, column ‘All’);
4. Results and Discussion
4.1. Analysis in Total and by Field of Study
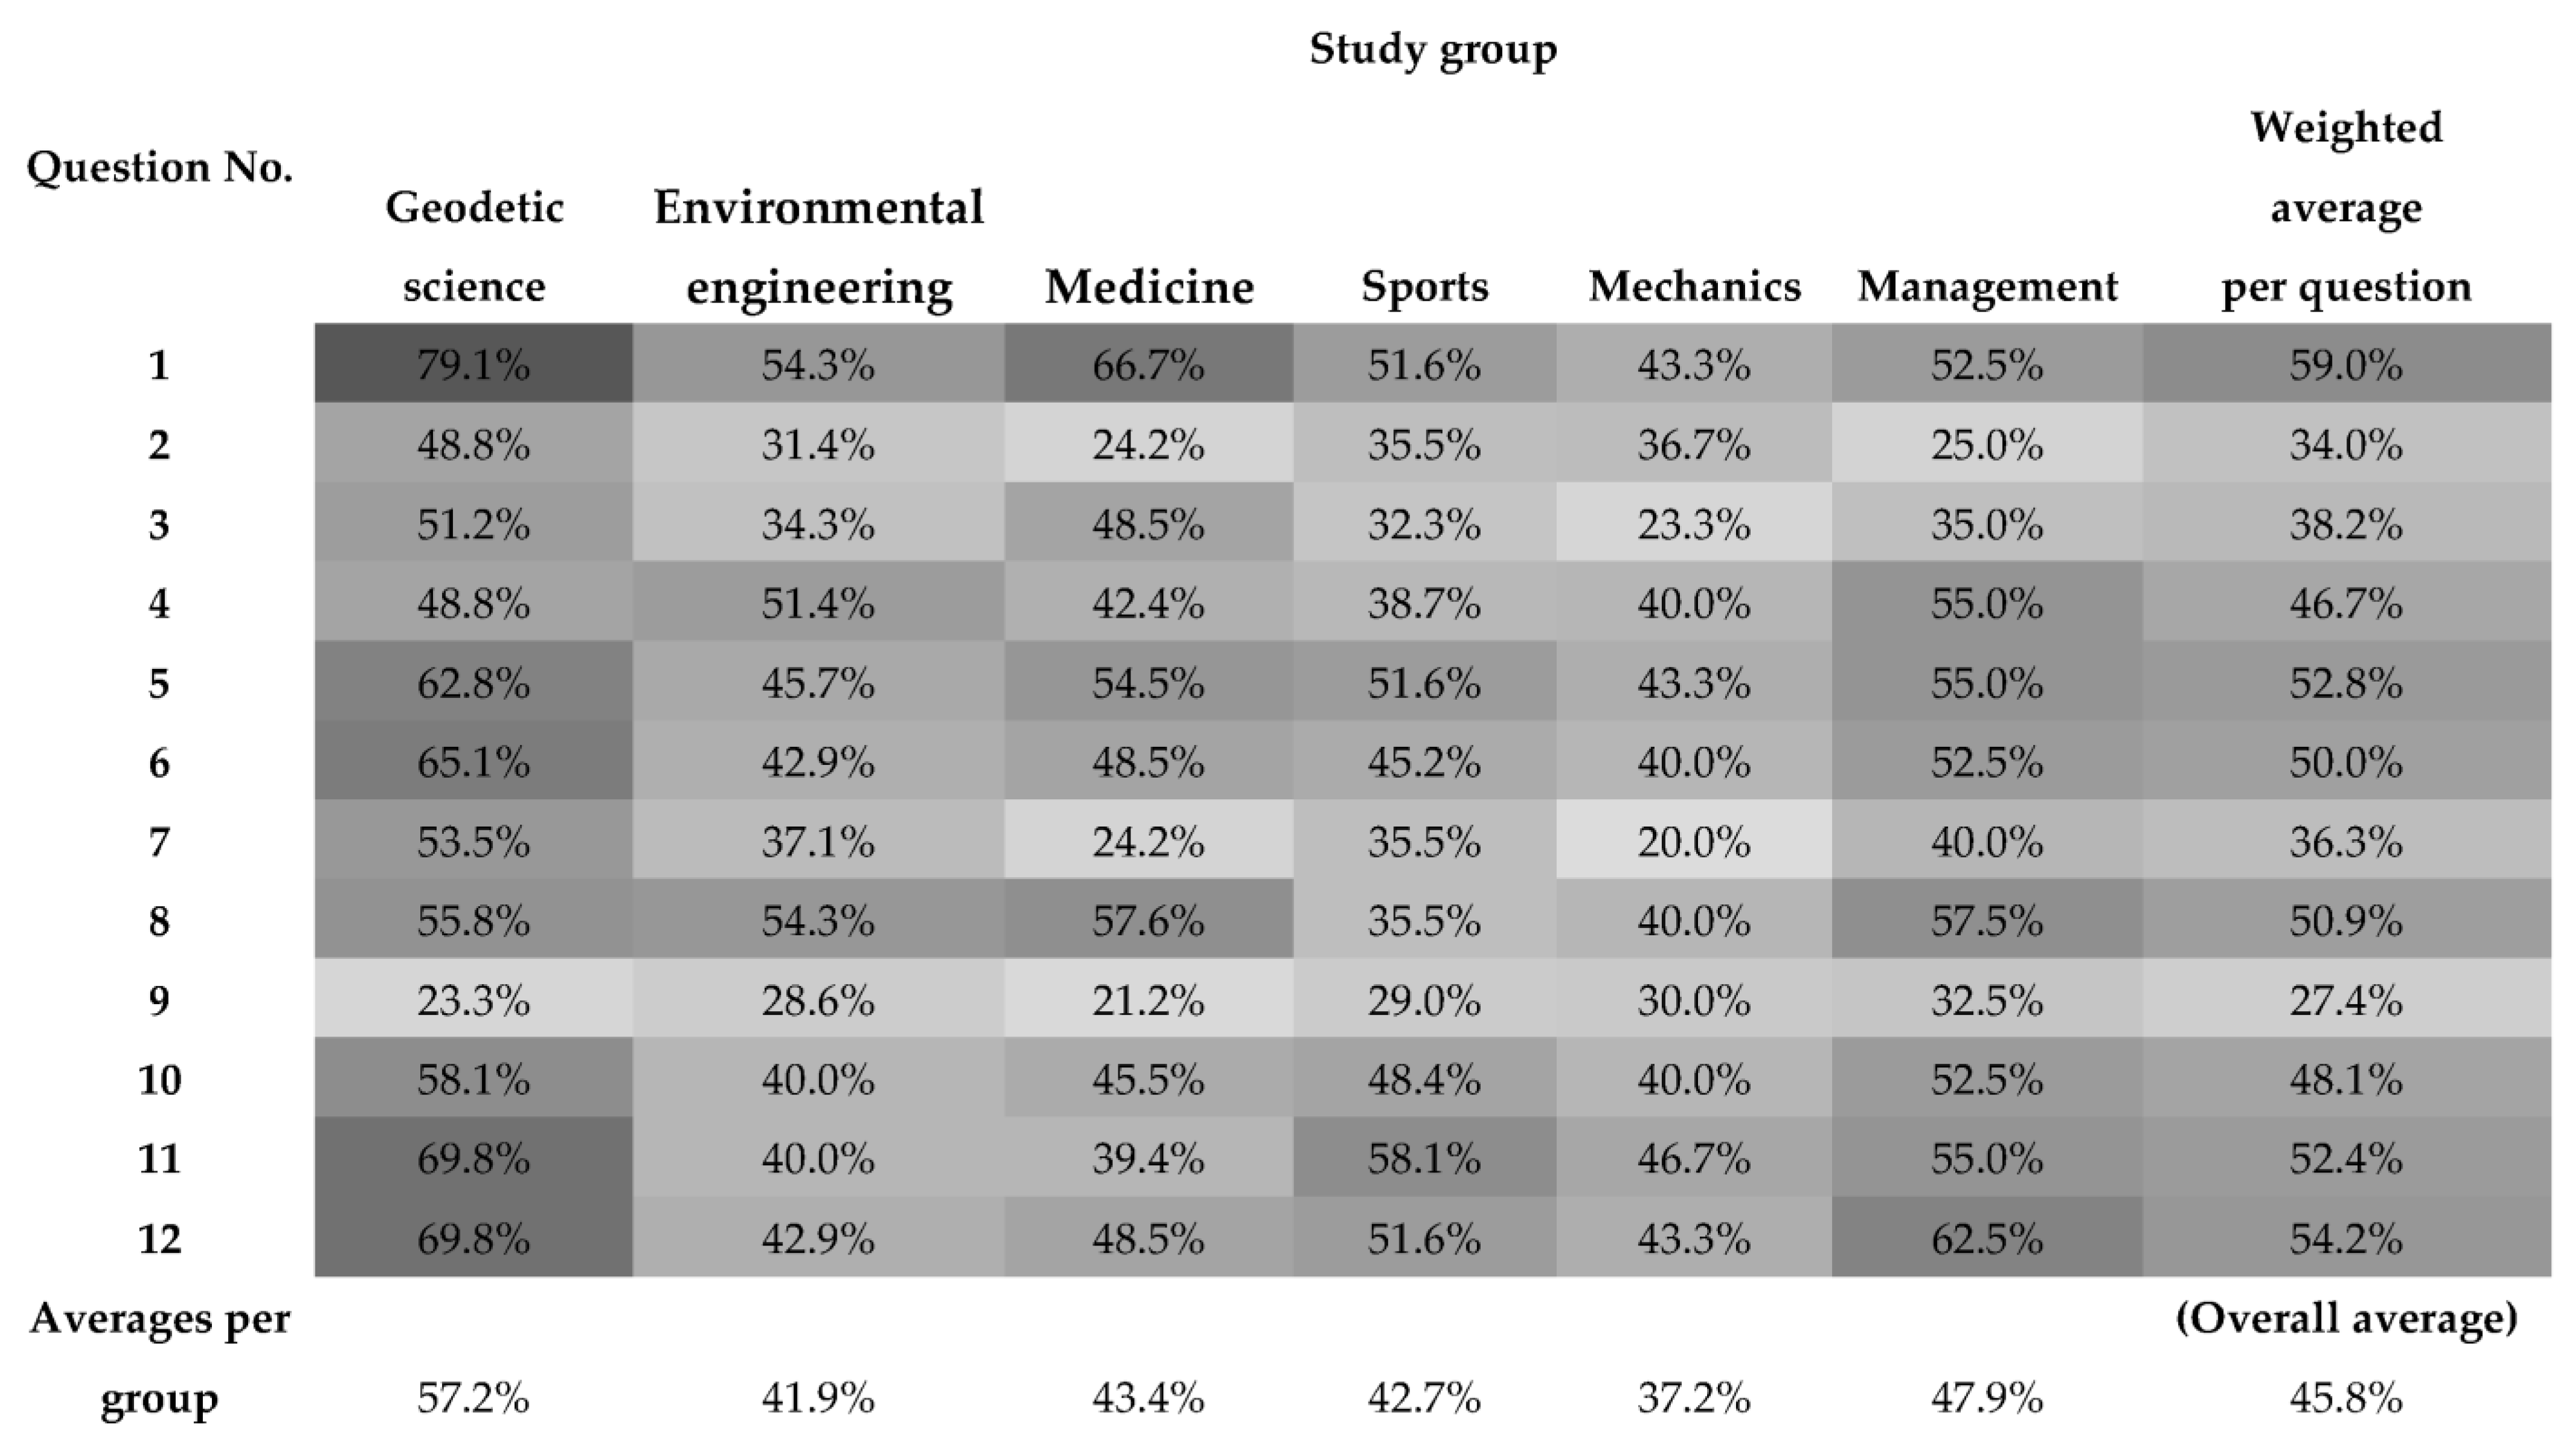
The obtained answers were checked for correctness, and then the percentage of respondents in total and in individual research groups that provided correct answers to questions 1–12 in the research part of the survey (
Appendix A) was determined. Based on the results obtained, the heatmap shown in
Figure 4 was drawn up.
For the entire group of respondents, question no. 1 on property rights depicted in solid colors proved to be the easiest. Question 2, seemingly analogous to question 1, as it was also about property rights presented in non-transparent colors, on the other hand, caused a lot of difficulty for respondents (only question 9 performed worse). This is most likely related to the level of difficulty of this question. The legal situation presented is much more complicated and concerns the ownership of the common parts of the building and of the land under the building, where there are a number of premises that are the subject of ownership and limited rights in rem.
More than 50% of correct answers were also given to the question on property rights presented in transparent shades of gray (No. 11) and questions on perpetual usufruct (Nos. 5, 6, 8, and 12). By far the most difficult question was No. 9, which concerned property rights in solid shades of gray (less than 30% of respondents answered it correctly).
The respondents from survey group no. 1, i.e., geodetic science, gave the most correct answers. Such a result should not come as a surprise. However, students learning the profession that will create a 3D cadastre in the future displayed a poor average (overall, only 57% of their interpretations were correct). More interestingly, for question no. 9, which concerned property rights depicted in solid shades of gray, only medical students answered worse than the students of geodetic science. Respondents from environmental engineering, medicine, and sports answered on average at a similar level (around 42–43%). Mechanical engineering students had the worst response, and management students had the best (48%, apart from geodetic science students). However, although there were questions to which more than half of the respondents in a given group gave the correct answer, the total number of correct answers in the survey did not exceed 50%.
Interestingly, questions 5 and 6, despite the difference in the level of difficulty of the legal situation presented, received a similar number of correct answers. This was probably because they related to the question about perpetual usufruct, which can only be attributed to the land, thus omitting its constituent parts.
The comparable level of correct answers for the perpetual usufruct and the simultaneous low percentage of correct answers for question 2 may also suggest that it is not a good idea to include in the visualizations a separate color for the right of ownership to the common parts of the building and the land under the building, in which there are many premises that are the subject of ownership and limited rights in rem. This is because, when asking about the right to the land, it may suggest that it is covered by the right of perpetual usufruct.
It also seems necessary to compare the percentage of correct answers given to questions 10 and 12, which were considered control questions (they asked about the same thing based on a drawing made using the same visual variables and with the same low complexity). Although question 12 performed slightly better, the difference noted does not seem significant enough to negate the credibility of the study.
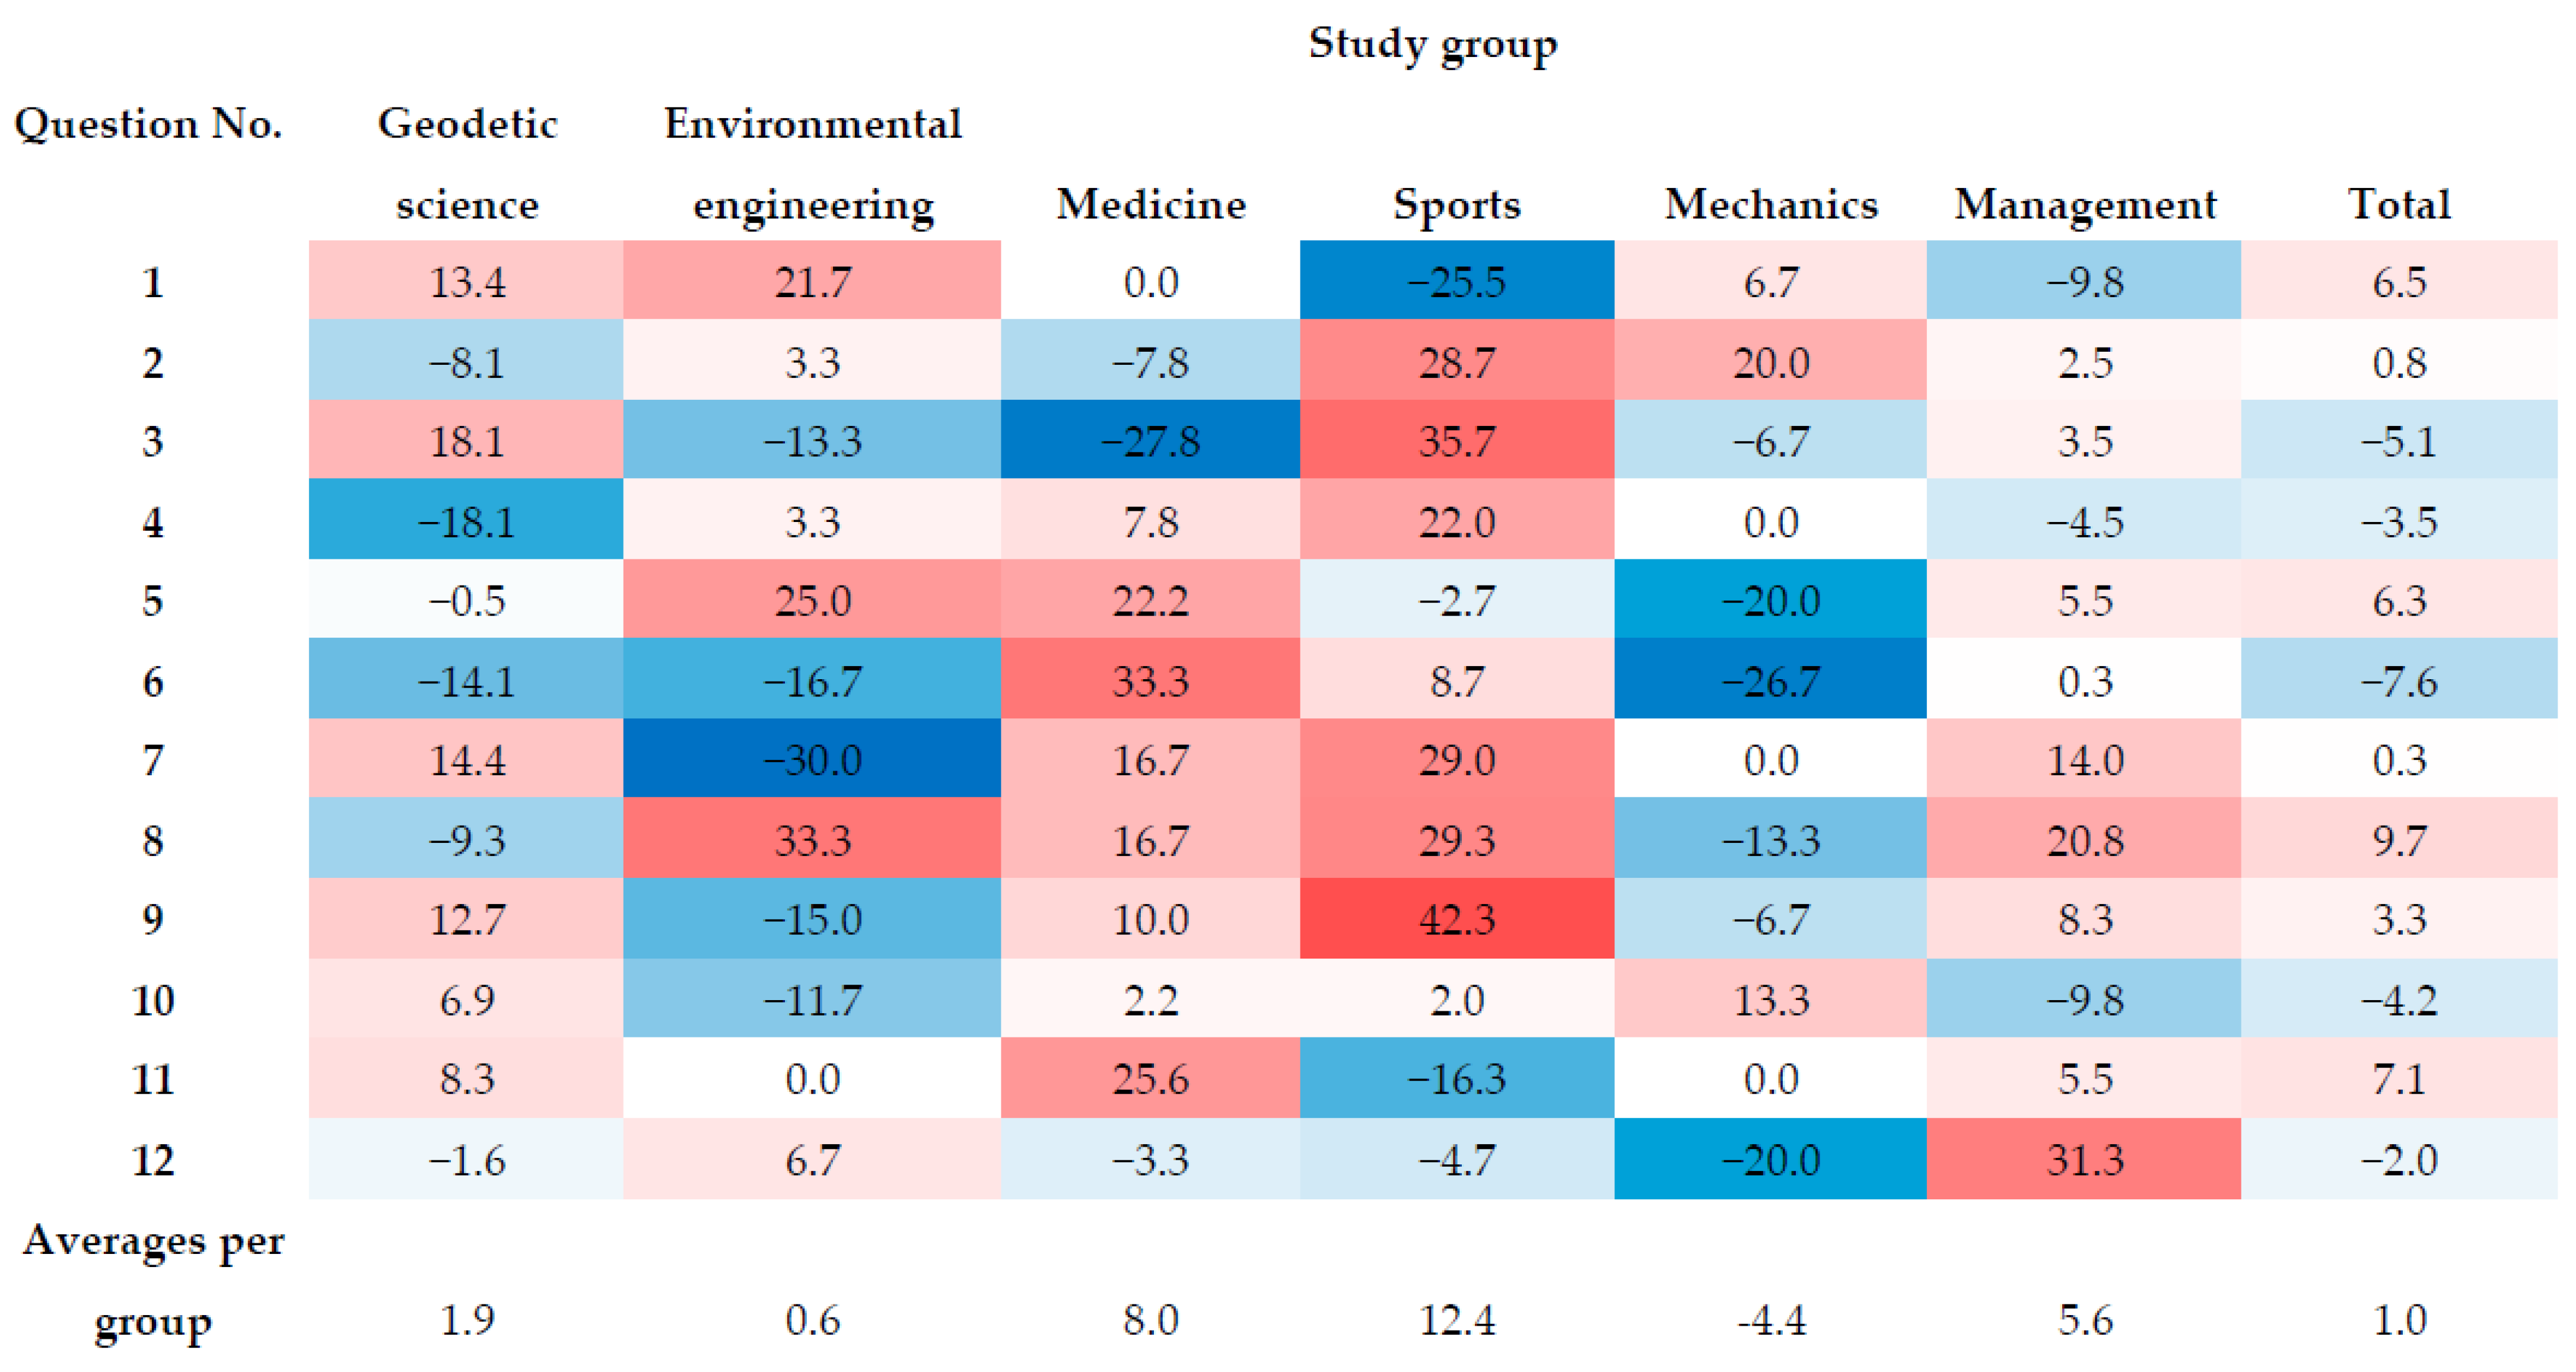
4.2. Analysis According to Gender
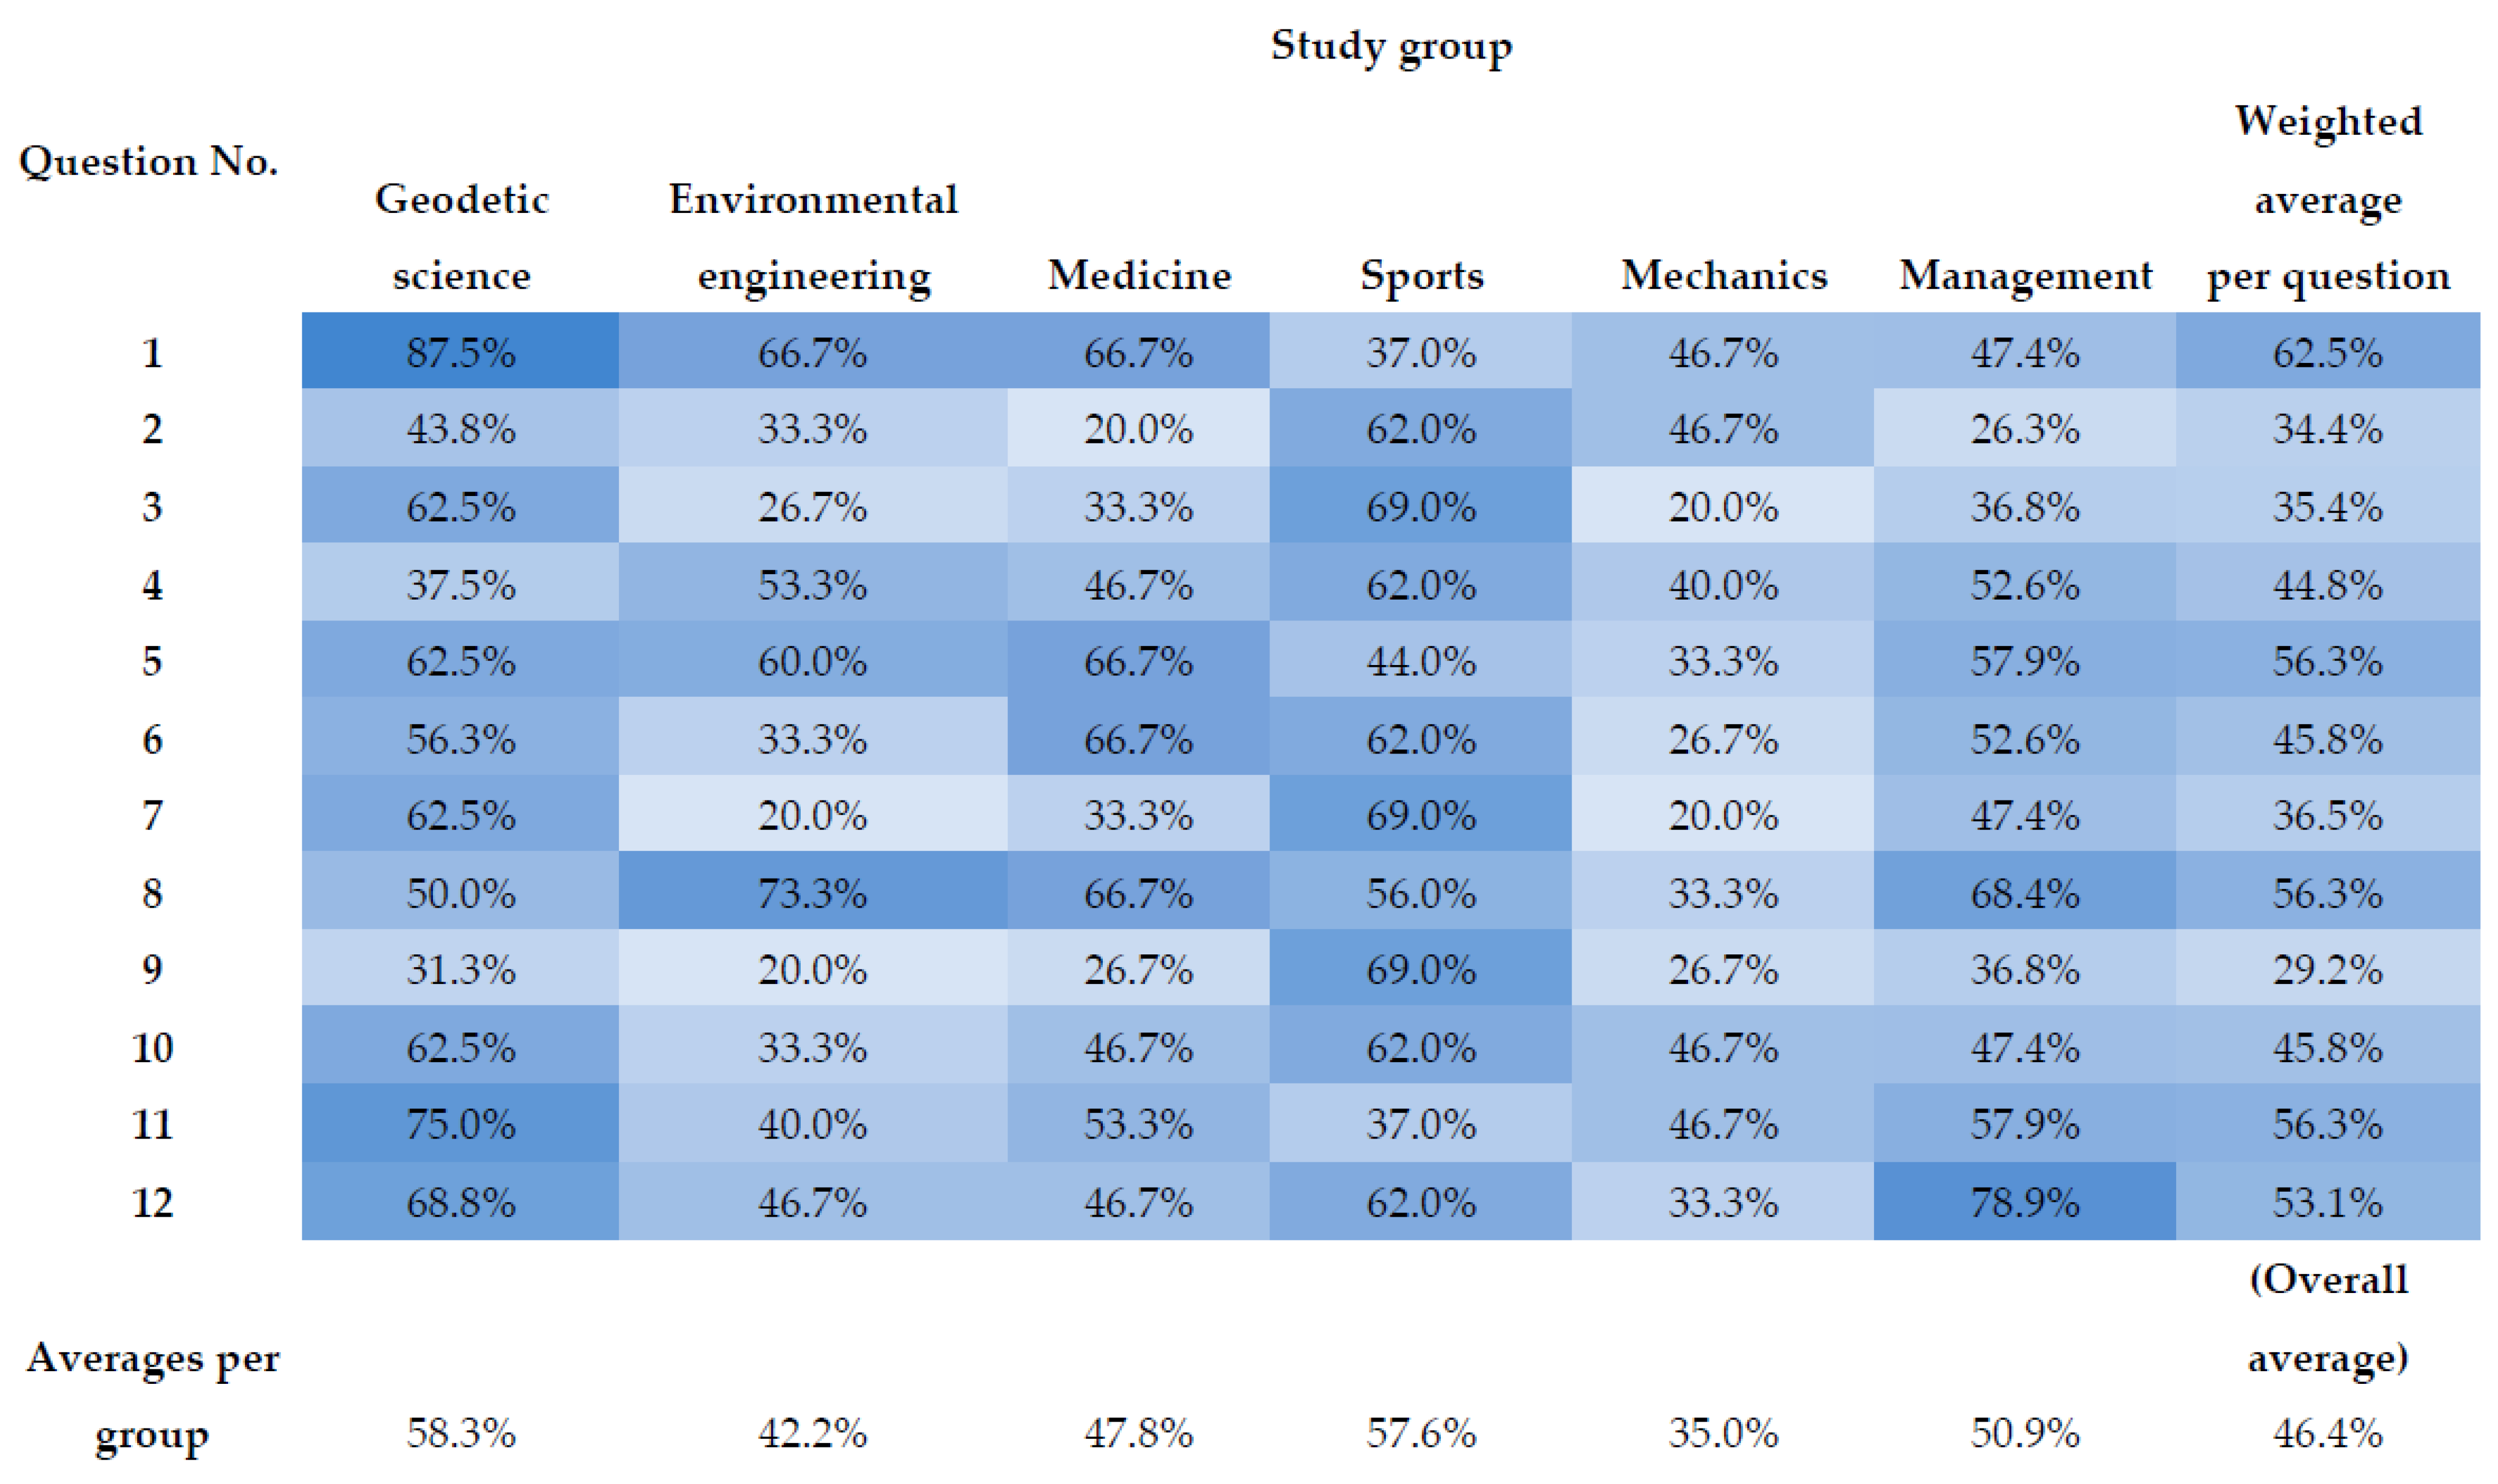
In turn, the responses were analyzed according to the gender declared by the respondents. The figures show the percentage of correct answers given by men (
Figure 4) and women (
Figure 5), as well as the differences between the percentages of correct answers given by men and women (
Figure 6).
The stereotypical belief that women pay more attention to colors than men and distinguish them better was not confirmed by the survey. The relationships captured across the entire group of respondents practically replicate in the groups separated by the respondents’ declared gender. Across the entire group that entered the survey, differences between the percentages of correct answers given by men and women ranged from −2.9 to +12.5 percentage points. Each gender group responded better to six of the twelve questions asked. Therefore, there is no evident bias in favor of either gender. One can see whether men or women obtain more correct answers on average. In geodetic science and environmental engineering, there is no significant gender dominance. In medicine, sports, and management, the male gender dominates in correct interpretations. For mechanics, the female gender dominates in their correct interpretations. The analysis per participant group shows ranges between 36% and 69%, with a standard deviation of 12% to 22%.
4.3. Impact of Visual Variables on the Correctness of the Determination of the Right Attributed to the Property
The most interesting analysis was the one that examined the effect of visualization parameters on the correctness of the determination of the right assigned to the property. As mentioned earlier (
Section 3.1), four possible combinations of visual variables and analysis were used to assess the perception of three different property rights in the survey. In this way, twelve different combinations of the parameters used for the visualization, with the rights assigned to the property could be obtained (
Figure 8).
However, not all possible combinations were included in the questionnaire. When arranging the questions, it was decided to provide the same combination twice to check the reliability of the answers (question pairs 1–2; 5–6; and 10–12). Simultaneously, there was no need to make the survey too long. Thus, the question containing visualizations of perpetual usufruct in solid colors and limited real rights in transparent colors and a transparent grayscale was dropped. According to the authors, the usufruct right visualized in non-transparent colors is easy to read, as under Polish legal conditions only land can be covered by this right. Furthermore, the non-transparent yellow color is clearly visible against the other colors used. Similarly, the limited real right in color on transparent visualizations stands out just as well as on non-transparent visualizations. In transparent gray scales, on the other hand, the same right could be very difficult to read.
Figure 6 and
Figure 7 show the percentages of correct answers depending on the visualization parameters used to show the specific right to the property.
In the entire research group, the share of correct answers exceeded slightly more than 50% in the case of questions concerning the property right shown in transparent shades of gray and perpetual usufruct shown in all possible combinations of visual variables. Alternatively, by far the most difficulties were encountered by respondents in reading the property rights shown in the visualisation made in gray scales and without the use of transparency (less than 30% of correct answers).
The highest number of correct answers to a question (75%) was given by male students of geodetic science in the case that concerned the property line on a visualisation made in transparent grayscale. Male environmental engineering students performed similarly (73%) in the question about perpetual usufruct, which was presented in a grayscale drawing without the use of transparency. Female medical students had the lowest proportion of correct answers (less than 17%) in questions illustrated with grayscale visualizations made without the use of transparency. These questions concerned property rights and limited property rights.
The results obtained by the geodetic science students were unquestionably the best. They were the only group (as a whole and by declared gender) in which the proportion of correct answers exceeded 60% for more than one or two combinations. The questions they answered best were property rights presented in solid colors and in transparent shades of gray, and perpetual usufruct presented in transparent shades of gray and also perpetual usufruct in transparent colors.
Additionally, male students did reasonably well with the limited real right (for each of the two combinations presented) and female students with the perpetual usufruct in transparent colors. Overall, less than half of the correct answers were given by the geodetic science group in the questions on property rights shown in transparent colors and solid shades of gray. Furthermore, female students performed worse on questions about limited property rights.
It should also be noted that the groups from environmental engineering and management strongly increased the average share of correct answers to the question about property rights visualized in transparent colors. The group of mechanics answered on average the worst of all (respondents did not exceed 50% correct answers to any question). Female students in this group gave more than half of the correct answers to only one question, and male students gave none.
4.4. Obtained Results versus Studies by Other Authors
The most extensive studies on the perception of visualizing 3D cadastre data were conducted by a team from Canada [
26,
27,
28,
29]. However, they concerned only one professional group—notaries.
Instead, the authors of the present article decided to check whether studying or practicing a learned profession that is not related to real estate law influences the ability to read information from images representing property rights defined in three dimensions.
As a result of the questionnaire, it turned out that the group studying geodetic science performed better on average than students in other fields of study. The results obtained, however, do not show a clear differentiation in the responses of the students of the different faculties. This means that if visualizations of 3D cadastre data were to be freely available to the public, they would have to be made using visual variables selected for specific users. Perhaps, as suggested by the experts involved in the experiment carried out in Sweden [
31], users should be able to access the visualizations in the app with the possibility to adjust the visual variables as they wish.
What is most important, however, is that although the study conducted only analyzed the perception of color and transparency, the results confirmed previous findings. The colorful visualizations proved to be better carriers of information, as long as they did not use transparency. Furthermore, transparency interfered in the case of more colorful and complex objects. However, it helped in the case of visualizations made in grayscale. This is most likely related to the fact that transparent colors interfere with the drawing, making interpretation difficult. In the case of drawings made in grayscale shades, this effect is not as unpredictable.
5. Conclusions
The survey confirmed the existing state of knowledge on the perception of the visualization of property rights in three dimensions. It should be stressed, however, that it went beyond previous studies on this issue, which only examined the perception of 3D cadastre data visualization among real estate professionals. Thus, the main contribution of the research to the development of 3D cadastre visualisations is to start a discussion on the differences in their perception among real estate professionals and those who have no experience in this area and may have to use multidimensional property data. Nevertheless, the authors regard the analyses carried out as preliminary research, based on which they wish to identify potential limitations of the study and directions for future analyses.
It can be noticed that, although the students dealing with real estate law on a daily basis performed better than the others, the results can hardly be considered satisfactory. Therefore, in the authors’ opinion, the research sample in future studies should be selected more carefully. The analysis of the results (especially for the geodetic science students) indicates that not all respondents were highly dedicated to the survey, and sometimes they probably replied randomly. This may have been influenced by the response collection technique (CAWI), which was, however, enforced by the still uncertain pandemic situation at the time of the survey (Q1 2022). In the future, however, the survey should take the form of a face-to-face interview and be conducted using the PAPI (paper and pen personal interview) technique. Such a form of survey would also allow control over the time taken by respondents to complete the entire questionnaire and even the time taken to answer individual questions.
The authors also wonder whether the respondents’ lack of familiarity with the visualization legend raised the difficulty level of the task set for them too much. In order to test this in the next approach to the 3D cadastre visualization perception survey, it is planned to divide the survey into two parts. First, questions formulated in a manner analogous to the survey described in the article should be asked. Then, after the legend has been shown, questions not directly derived from the legend should be asked to check whether knowledge of the legend can influence the answers.
It also seems reasonable to consider the survey of students only as a preliminary one, on the basis of which proper research will be carried out and the respondents will be more motivated to answer honestly since they will be: (i) real estate professionals who use land administration systems in their work; (ii) property owners who, at least during the purchase of this property, have had to consult the data contained in the land administration systems; (iii) persons completely unrelated to the real estate industry who have never had access to the data from the land administration system but who are potential buyers of the property.
In addition, it would also be useful to try to assess the reliability of the surveys using objective methods. The authors have already started research using eyetracking. As part of this, visualisations of property rights are shown to respondents on a computer monitor during a face-to-face interview, and an eyetracking device records which elements of the visualisation respondents look at first and which they look at longest when answering questions. It is assumed that the correlation between answers and eye focus in the areas of interest (AOI), which will be the parts of the visualization containing the subject of the question, will indicate whether the answer is given based on existing knowledge or whether the respondent chose it randomly.
It might also make sense to increase the size of the survey groups. With that said, research to date has usually been based on interviews in groups of similar size or smaller.
In addition, in the future, the survey should be modified to also include questions on the combination of the visualization and representation of the perpetual usufruct right visualized in colors without the use of the option of transparency and the limited real right visualized in colors and grayscale with the use of transparency.
The analysis of the results also led the authors to consider testing in the future the perception of color visualizations made in a color palette other than that used in the survey. This has to do with the fact that the majority of existing color recognition disorders in humans relate to the colors used in the visualizations used in the survey, i.e., red and green [
25]. The absence of reports of having such disorders from the respondents does not equate to the fact that they do not have them. Since only red-green color blindness affects 8% of men and 0.5% of women [
25], statistically speaking, people living with it should have been among the respondents and either not realized the disorder was weak or did not want to admit it.
In view of the above, it would seem that the 3D cadastre perception studies should be extended in the future to include an analysis of the results based solely on the answers given by those affected by color recognition disorders. These could consist of two stages, in which respondents would answer questions while viewing the visualizations without and with special light wave filtering glasses, which make it possible to improve the ability to see colors. It should also be noted that it is undoubtedly gratifying that there is no apparent predisposition to interpreting the visualizations according to the declared genders. According to the authors, if representatives of either gender showed a significant predisposition to more easily perceive visualisations of 3D property data, this would predispose them more to work with these visualisations. The absence of such an advantage on the part of the representatives of the respective genders implies a lack of handicap for them in their chosen profession. This is particularly important for the group of students of geodetic science, i.e., the group that is ultimately responsible for the creation of the 3D cadastre database and the visualization of its data.


