

ISPRS Int. J. Geo-Inf. 2024, 13(4), 137; https://doi.org/10.3390/ijgi13040137 - 18 Apr 2024
Abstract
►
Show Figures
This study investigated the effectiveness of new point-of-interest (POI) pictograms on tourist maps within the Croatian and Slovenian contexts, focusing on enhancing the tourist experience in urban settings for individuals with specific needs. Despite the widespread use of tourist maps, there is a
[...] Read more.
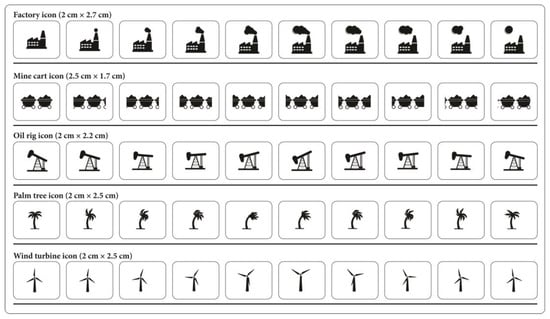
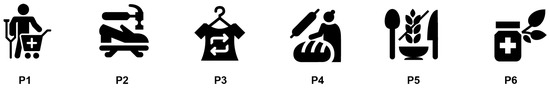
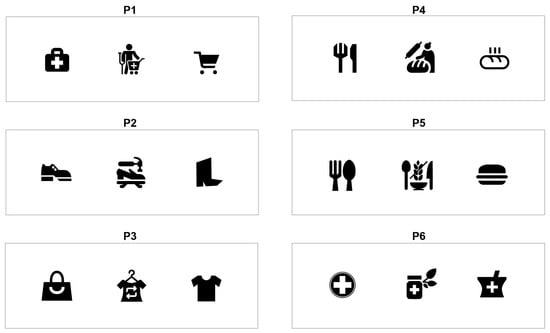
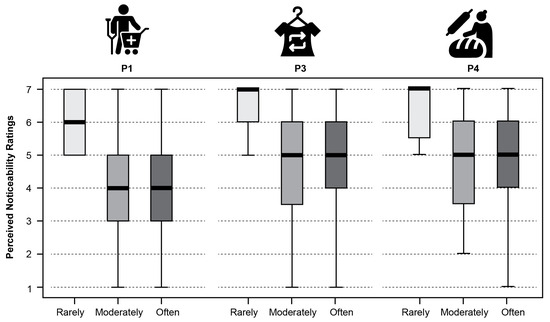
This study investigated the effectiveness of new point-of-interest (POI) pictograms on tourist maps within the Croatian and Slovenian contexts, focusing on enhancing the tourist experience in urban settings for individuals with specific needs. Despite the widespread use of tourist maps, there is a lack of research evaluating POI pictograms tailored to the needs of tourists with specific dietary, health-related, and sustainable clothing purchases. To fill this gap, we designed six new pictograms in three domains: healthcare, food, and apparel. The pictograms were evaluated using an online questionnaire involving 138 participants with a diverse range of ages and educational backgrounds. The results on comprehension and subjective assessments of the pictograms’ qualities revealed insights into the subtle cultural and lifestyle influences on pictogram perception. The findings provide a basis for considering the potential of new pictogram designs in improving navigational experiences with geospatial information and encouraging sustainable tourist behaviors.
Full article
Figure 1


