1. Introduction
Urban planning and policies increasingly place emphasis on different models of urban living, which leads to a greater focus on residents’ active mobility and the idea of proximity. The discussion about 20 min neighbourhoods or the 15 min city are tangible implications of this trend (cf. [
1,
2]).
Walkability plays an essential role in such concepts, which have a long-standing tradition in urban planning [
3]. There are many good reasons to strive for the ideal of a walkable city. A substantial number of studies demonstrate, for instance, that walkable neighbourhoods help improve residents’ everyday mobility, and thus prevent diseases and promote healthy ageing [
4,
5,
6,
7,
8,
9,
10].
Against this background, walkability indices are becoming increasingly popular, as they provide objective measures and allow the comparison of neighbourhoods and cities [
11,
12,
13,
14]. Yet, these studies often operate without differentiating pedestrians by age and ability and have so far been limited when addressing the needs of specific population groups, such as the elderly [
8,
15,
16,
17,
18,
19]. A lack of differentiation has been criticised not only with regard to demographic or social groups [
20,
21,
22], among others, and there has been a call for greater regional differentiation when developing walkability metrics. Moreover, the authors of [
23,
24] point out the impact of city size and structure, which have hardly been factored into pedestrian mobility studies so far. With this in mind, this article presents work on a methodology for urban walkability that accounts for the elderly. The starting point is a generic approach known as the Walk Score, which we adjust to the needs of older people. For this purpose, we take into consideration barriers such as sloping terrain and stairways, and we calculate the walking time of older people with respect to these barriers. Furthermore, we adjust the weighting of supply facilities according to their relevance for senior citizens.
We develop and implement this walkability index based on the example of the two medium-sized cities of Goslar and Kempten, located in the north and, respectively, the south of Germany. Accessibility analyses in Germany are primarily carried out in large cities on the one hand [
21,
25] and in rural areas with their pressing challenges on the other [
26,
27]. Cities of a small or medium size tend to be less of a focus, despite promising studies in other countries [
28,
29]. This gap comes as a surprise in view of the fact that German planning scholars are calling increasingly more clearly for greater attention to be paid to small and medium-sized cities [
30,
31].
In the following, we first introduce the areas of investigation and outline our methodology. Results from applying the adjusted Walk Score in the two sample cities are presented afterwards. Subsequently, we discuss the methodology’s chances and limitations and identify priorities for future improvement.
In this way, we want to contribute to the research discourse with a method proposal that adapts the Walk Score to the needs of older people and demonstrates its feasibility in the context of German cities.
2. Study Region and Methodological Framework
2.1. Study Region
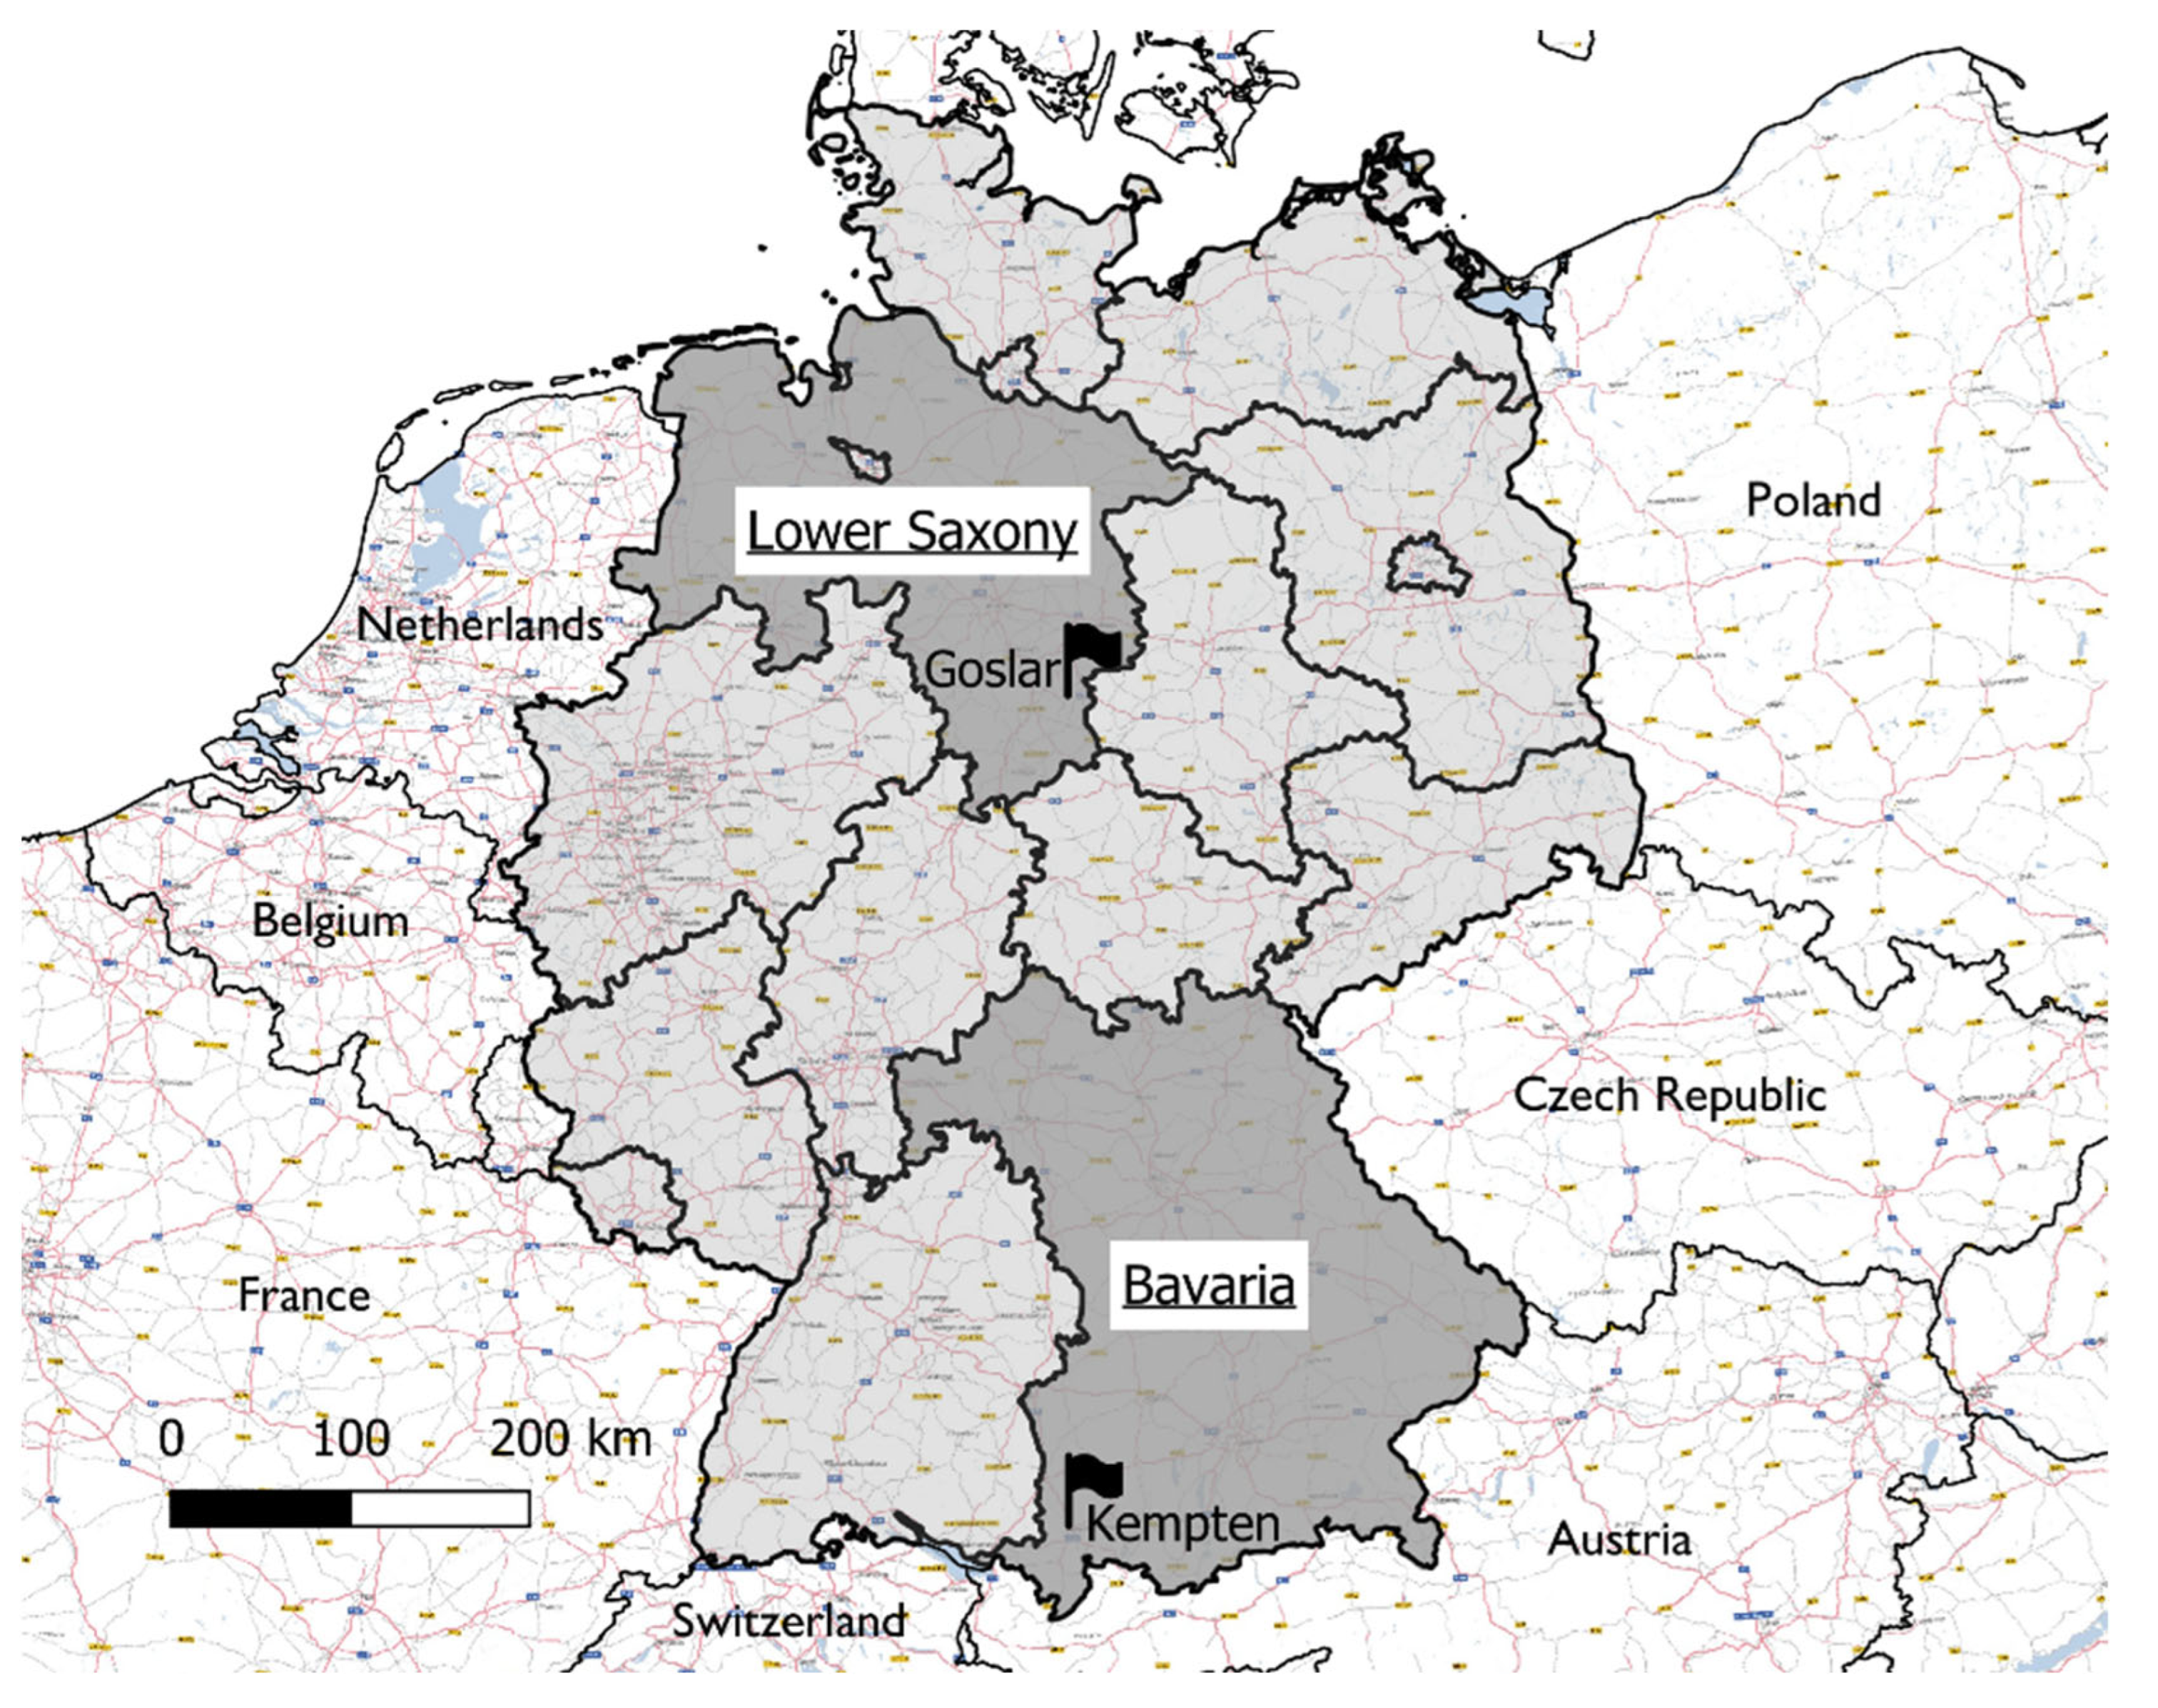
The city of Goslar is the administrative capital of the county of Goslar in the eastern part of Lower Saxony. At the end of 2020, the town had a population of just over 50,000. Immediately to the south, the Harz mountain range adjoins. The old town lies at an altitude of around 250 m, while the terrain in the Hahnenklee-Bockswiese district on the southern edge of the city rises to over 500 m. The old town of Goslar and the former Rammelsberg ore mine have been UNESCO World Heritage Sites since 1992. With the municipal incorporation of the town of Vienenburg in 2014, the area of the city grew to 163.88 km2. The former municipality of Vienenburg had an area of 71.14 km2 itself.
Kempten is a city with over 70,000 inhabitants in Bavaria close to the German border with Austria. Founded by the Romans, the city looks back on 2000 years of history. Kempten is centrally located in a hilly pre-Alpine landscape at an altitude of about 650 to 700 m above sea level (in the old town). The area of the city of Kempten is 63.28 km
2. Although Kempten has more inhabitants than Goslar, the area size of Kempten is significantly smaller. The location of the two cities is shown in
Figure 1.
The difference in altitude within both cities is considerable, meaning that the terrain in each case plays a non-negligible role in the mobility of the citizens. While flat areas predominate in the core of the cities, sloping terrain characterises large parts of the periphery.
2.2. Measuring Walkability: Indexes and Scores
Several metrics for measuring the walkability of a city are under discussion in planning sciences at present. The Walkability Index (WAI; [
32,
33]), for example, combines multiple criteria to measure different dimensions of walkability, in particular, road connectivity, land use heterogeneity, household density, and shopping opportunities. In contrast to the WAI, the Walk Score (WS) looks at the distances on the road network. The WS estimates neighbourhood walkability based on proximity to supply facilities such as bars, bookstores, coffee shops, drug stores, fitness centres, grocery stores, libraries, schools, parks, restaurants, and music stores [
34,
35]. The WS connects these categories using a preset weighting that “defines equal weights for most categories, except for grocery stores (sum of weights 3), restaurants/bars (sum of weights 3), and shopping and coffee shops (sum of weights 2)” [
16]. Additionally, the WS includes a distance function leading to a higher weighting for facilities that are faster to reach due to their proximity than for facilities of the same category that are less fast to reach.
The WS is the “most commonly used indicator in the recent literature on walkability indicators” [
36]. Reyer et al. [
21] point to the advantage of the WS over approaches to measure walkability derived from urban fabric and settings. After all, network distance rather reflects the reality of people’s lives. They are more likely to answer questions such as ‘How far do I have to walk to… ?’, ‘How long does it take me to… ?
’, etc., than rather abstract and indirect measures, such as those underlying the WAI. Despite these merits, the WS—just like the WAI—takes a rather generic approach that does not distinguish between age groups and their mobility abilities. Consequently, such metrics need to be adapted to the specifics of older people in order to provide reliable results for this group. We therefore use the WS as a starting point but integrate and adjust additional parameters with older people in mind.
By integrating the third dimension into the WS, we go one step further than previous studies. For example, Horak et al. [
16] bring the WS closer to the needs of older people but stay in 2D by using a simple graph representation of streets. In order to meet the needs of older people more properly, these authors see a change from the mezo to the micro level as a necessary next step. Parameters such as surface, slope, and obstacles should be taken more into account. Alves et al. [
7] consider such barriers. The aim of their Walkability Index for Elderly Health is, however, to calculate and identify age-friendly routes. The advantages of the WS, e.g., as an information basis for urban planning [
21], are not taken into account here.
3. Walkability Index for Older People—Complementing the Walk Score
3.1. Creating a Barrier-Sensitive Network—Data and Processing
For calculating the Walk Score, a network of walkable paths and roads is a prerequisite. Recent WS studies use road data from the OpenStreetMap project (OSM) for this task [
16,
37]. Volunteer data collectors drive the OSM. Despite the non-official character and obvious regional differences, the quality of OSM road data in Central Europe has reached a level that can be assumed to be suitable for our application purpose [
38,
39,
40]. Consequently, we use OSM data to create the network model consisting of all walkable pathways for Goslar and Kempten.
Sloping terrain is one of the most challenging walking surfaces for senior citizens. However, little research has addressed how walking on graded surfaces affects the performance and walking patterns of senior citizens [
7]. It is, therefore, not surprising that terrain so far is hardly taken into account when calculating walkability for older people [
16]. Existing walkability models that take terrain into account are not tailored to older people and tend to use low-resolution data, such as the SRTM DEM [
41]. However, with a resolution of only 1 arc second (approximately 30 m at the equator) and both varying and limited height accuracy, as in the case of the STRM, many gradients on the road network remain hidden.
In our model, we calculate inclination by using a high-resolution Digital Terrain Model (DTM; German: DGM), provided by official mapping agencies. The DTM describes the terrain surface without vegetation and buildings by a grid of ground points (whose elevations are given with an accuracy of 0.15 m), which are located (in the case of the DGM 1) at a distance of one metre from each other. High-quality data, both in terms of spatial resolution and elevation accuracy, such as the DGM 1, are required to calculate reasonable gradient values for short distances (see detailed analysis in
Appendix A).
In order to bring the spatial resolution of the high-precision data to fruition, a correspondingly accurate method for calculating the road segments is required. We, therefore, subdivide the road network into line segments of a maximum length of five metres. We determine the height difference by calculating the angle of inclination between the start and end vertices of the individual line segments and the length of the line between these vertices. The result of the calculation is either a positive or a negative value, which can be used to identify the direction of the gradient [
42,
43].
Furthermore, we integrate stairways into our network model, as these represent potential obstacles for older people. These features also stem from the OSM project, as OSM not only collects roads but also other data that serve as a topographical description of the earth’s surface. The OSM dataset even provides data on additional barriers, such as bollards or blocks, which can narrow roads and create obstacles for people with walking aids. In this study, however, we only consider healthy elderly people who can walk without the help of a walking aid. Therefore, from the spectrum of possible barriers, only closed gates were considered in addition to the stairways mentioned above. While closed gates affect all people, stairs in public spaces can be a key challenge for walkability from the perspective of older citizens [
7].
The supplementary use of German census data allows the walkability estimates to be combined with the cities´ demographics. The German census provides data on the population, including the number, age, gender, or citizenship of residents. In Germany, census data are collected every ten years. For our study, we use data from 2011 [
44]. All residents who are at least 65 years old are senior citizens in our model. Calculating the WS requires one start and one or many endpoints for each route. The German census data are organised in a grid structure that corresponds to Eurostat’s European population grid. We calculated the centroids of all 100 m × 100 m grid cells in our study areas and chose them as the starting point for the routing. The locations of the supply facilities serve as the endpoints and again were derived from OSM.
All datasets were processed using the GIS software package ArcMap (extension Network Analyst) by ESRI®™. The free and open-source software QGIS came into play for data preparation and visualization.
3.2. Senior-Specific Adaptations—Walking Time and Utilities
Walking time changes with the inclination. We adopted walking times based on Weidmann [
45]. The average horizontal gait speed of a pedestrian is then 1.34 m/s (metres per second). For a slope of 5%, the uphill speed is estimated to be 1.29 m/s, for 10% 1.19 m/s, and for 15% 1.07 m/s. The respective downhill speed is estimated to be 1.38 m/s for a slope of −5%, 1.40 m/s for −10%, and 1.40 m/s for −15%. Weidmann’s study considers deviating terrain and was carried out in Central Europe. However, it refers to the average population and has not been customized to senior citizens in particular. Against this background, we adjust the speeds suggested by Weidmann by following Artmann et al. [
46], who set the walking speed of seniors on a flat area at 1 m/s. For a slope of 5%, the uphill speed is then 0.96 m/s, for 10% 0.89 m/s, and for 15% 0.80 m/s. The figures for downhill speed are then 1.03 m/s for a slope of −5%, and 1.04 m/s for slopes of −10% and −15%. Sloping terrain is not the only obstacle that limits walkability. Stairways represent another type of barrier, which can, however, be mastered by healthy seniors. We have, therefore, adjusted Weidmann’s speed value for climbing stairs to 0.65 m/s, taking the same factor adopted from Artmann. In contrast to stairs, inclines above a given threshold (from 10% and 15%, respectively) in our model represent insurmountable obstacles that cannot be mastered.
We identified public transport, services, entertainment/leisure/sports, healthcare, social services, and dining as relevant categories of supply facilities that might serve as walking destinations for the elderly (
Table 1). The selection of these categories and the weighting of the categories customises the WS through estimates of previous research on pedestrian friendliness in Germany [
43,
47].
Table 1 presents the list of supply facilities including their weights. We perform our analyses both for all facilities listed in
Table 1 and for facilities that we consider essential for the elderly (see below). These essential facilities are marked in bold in
Table 1. The core of essential supply facilities consists of supermarkets, pharmacies, physicians, hairdressers, etc.; the broader catalogue includes, for example, swimming pools, churches, pubs, etc.
From the identified categories, we calculate the walkability of supply facilities for senior citizens in four ways:
Walking to essential facilities (facilities marked in bold in
Table 1), when the walking route may have a maximum slope of 10 percent;
Walking to essential facilities, when the walking route may have a maximum slope of 15 percent;
Walking to all facilities listed in
Table 1, when the walking route may have a maximum slope of 10 percent;
Walking to all listed facilities, when the walking route may have a maximum slope of 15 percent.
Following [
48], we set a predefined 20 min walking time limit. A standard network routing algorithm returns the number of essential/all listed facilities that can be reached within the given limits for the walking time (20 min) and 10/15 percent maximum slope of the walking route. The maximum WS value (WS = 100) is achieved when all essential/all listed facilities (see
Table 1) can be reached with a walking time of 5 min or less. The WS value decreases the longer it takes to reach facilities by foot and the fewer facilities can be reached within 20 min. WS = 0 indicates that no facility can be reached within 20 min walking time. The walking time depends on the walking speed, which in turn depends on the slope of the walking route.
In more detail, the algorithm works as follows. First, we calculate the walking time for each 5 m segment of the entire walkable path network of the study area (see Algorithm 1).
| Algorithm 1 Calculation of walking time |
| for each 5-metre segment dAB (see Appendix A) of the network |
| calculate walking time td,AB, segment d,AB, gait speed g,AB; td,AB = d,AB × g,AB |
| calculate walking time td,BA, segment d,AB, gait speed g,BA; td,BA = d,AB × g,BA |
| ! td,AB ≠ td,BA, because uphill gait speed is different from downhill gait speed |
| case |
| when “slope” > 0 and “slope” <= 5 then gait speed = 1.29/1.34 m/s |
| when “slope” > 5 and “slope” <= 10 then gait speed = 1.19/1.34 m/s |
| when “slope” > 10 and “slope” <= 15 then gait speed = 1.07/1.34 m/s |
| when “slope” < 0 and “slope” >= −5 then gait speed =1.38/1.34 m/s |
| when “slope” < −5 and “slope” >= −15 then gait speed = 1.40/1.34 m/s |
| when “highway” = ‘steps’ then gait speed = 0.65/1.34 (stairs) |
| when “slope” = 0 then gait speed = 1 m/s |
| endcase |
| endfor |
Second, we apply a comprehensive network analysis that breaks down the contribution of each supply facility in the study area to the adapted WS for the centres of all 100 × 100 m grid cells used as a spatial reference frame (see Algorithm 2).
| Algorithm 2 Network analysis |
| for each category ci of supply facility categories (see Table 1) |
| for each centre point of 100 m × 100 m census grid pj |
| Search for the nearest supply facility fij. The nearest facility is the one that |
| can be accessed with least cost, i.e., in the shortest walking time taking into |
| account the terrain slope of walking paths |
| Calculate contribution of fij to the total of the adapted WS |
| WSij = weight (ci) × weight (fij) |
| case |
| weight (fij) = 1 when walking time tij <= 5 min, |
| weight (fij) = 0.75 when walking time 5 min < tij <= 10 min, |
| weight (fij) = 0.50 when walking time 10 min < tij <= 15 min, |
| weight (fij) = 0.25 when walking time 15 min < tij <= 20 min, |
| weight (fij) = 0 when walking time tij > 20 min |
| endcase |
| endfor |
| endfor |
In the next section, we will use the WS, adapted to the needs of seniors, as an indicator to assess the walkability of the two cities of Goslar and Kempten for the elderly population.
4. Results
The implementation in Goslar and Kempten was based on the hypothesis that both the supply facilities chosen and the assumptions about when road gradients are no longer walkable can significantly influence our results. Therefore, we provided walkability calculations firstly for the essential facilities and, secondly, for further facilities that go beyond the essential.
We have also assumed that the maximum slope that an elderly person can still manage is 10 percent. Our considerations on the accuracy of slope calculations from digital elevation models demonstrate that the calculated slope values in our study can deviate from the real values on site by up to about 5 percent (see
Appendix A). To study in detail the impact of such a limited accuracy of slope values on facility accessibility, all network calculations were performed for both 10 percent and 15 percent slope limits. As shown in
Figure 2 and
Figure 3, the number of walkable facilities is higher in the lowest WS category (0–25) when the maximum slope is 10 percent rather than when it is 15 percent. In all higher WS categories (25–50, 50–70, 70–90, 90–100) the number of walkable facilities is higher when a 15 percent slope is permitted instead of 10 percent. It is immediately plausible that people can access more facilities if they can manage steeper gradients. This can be seen from the results for all categories except for the lowest one. The WS lower values for 15 percent compared to 10 percent slope in the lowest category (0–25) result from the fact that the higher number of walkable facilities in the other categories is compensated by the lower number in the lowest category.
From the locations that are in the lowest WS range (this includes a WS score from 0 to 25), few or no facilities can be reached within 20 min. This category makes up the clear majority of the locations in the cities of Goslar and Kempten. The highest level (“walker’s paradise”) is only achieved in a few areas, and only in the old towns of Goslar and Kempten. However, in both cities, more areas fall into this desirable WS range if only essential supply facilities are considered. The difference in walkability caused by variations in the maximum gradient or modifications in respect of all vs. only essential amenities is greater in Kempten than in Goslar (
Figure 2 and
Figure 3).
The pattern that emerges in Kempten (even if assumptions vary) is that the WS decreases from the city centre towards the periphery. This also applies to the city of Goslar, albeit based on two local centres, Goslar and Vienenburg (
Figure 4 and
Figure 5).
By additionally integrating census data into our model, we were able to link information on walkability and age. We displayed both information dimensions (accessibility and age) in a 3D visualization (
Figure 6), producing complementary findings: The higher the displayed bar of a grid cell, the more senior citizens live there, according to the census. While most of the tiles with a higher number of seniors in Goslar enjoy a medium to good walkability, the Walk Scores in Kempten are heterogeneous and mostly lower than in Goslar. The high and orange grid cell in Lenzfried/Kempten in
Figure 6 reveals the location of a retirement home located in this area. Walkability in the respective grid cell is only partly good (orange), as access to the retirement home is only possible via steep paths. The illustration demonstrates that the third dimension is not only important in terms of data and methodology. Even the visualization of walkability metrics can benefit from being 3D, as in this way the WS and age information can be displayed together in a single map in a way that is easy to understand despite the increasing complexity of the map´s message.
5. Discussion
5.1. Impact of City Size and Structure
The size of today’s city of Goslar, which is a result of the political decision to incorporate Vienenburg in 2014, has an influence on the spatial pattern of walkability. Within the city of Goslar, Vienenburg is a second, albeit smaller, centre—in addition to the core town of Goslar itself—which has more amenities and correspondingly better walking accessibility than the surrounding districts. This contrasts with Kempten, where walkability decreases almost concentrically from the town centre to the periphery. Thus, in both cities, comparable patterns appear to exist, which are characterised by a high walkability in the centre and a low walkability on the periphery. Yet, due to the monocentric structure in Kempten and the polycentric structure in Goslar, different framework conditions emerge for urban planning in dealing with walkability.
Further differences arise with regard to the number of staff and resources in the cities’ administration. In Goslar, the staffing in the department of geospatial information and surveying is more like in smaller cities with two people in charge, while in Kempten, four people are assigned to this department, which appears to be more like in a major city. This makes a difference in transferability and the city’s own commitment: In Kempten, our contacts had the idea of implementing our model in the city´s domain and developing it independently in the future. In Goslar, this was not up for debate and further cooperation with external partners from science was considered reasonable by our contacts there. Against this background, our research supports the observations of [
23,
24], who call for greater attention to be paid to the urban structure in walkability analyses.
5.2. Limitations of the Methodology and Next Steps
The proposed methodology has limitations that we intend to take into account in its future development. This refers, for example, to the chosen focus on a certain group of elderly people—namely, those who can walk independently, albeit more slowly. The mobility abilities of older people vary and stretch from people who are confined to bed to those who can still jog or cycle. In order to better reflect the reality of many people’s lives, it seems advisable to define specific mobility roles that reflect this diversity and to train the walkability model accordingly. The adaptations of our model and the need for additional datasets are likely to change significantly with such roles. For people who rely on a rollator, for example, road bollards (at too short a distance) and stairs can be insurmountable. These conditions are quite different from the ones we have set. Accordingly, a city’s WS under our model is likely to vary depending on which mobility role is addressed.
We have made several assumptions in implementing our model. Among other things, we have used previous studies to roughly adapt walking times to elderly people.
We did not further differentiate the groups of seniors, e.g., by gender. This also applies, for example, to speeds, which depend on the individual’s fitness level and whose variations could be accentuated on uphill or downhill stretches. Therefore, we believe that future studies should consider and conduct further empirical research on walking behaviour. A similar approach was taken in selecting and weighting the supply facilities for older people that were included in our model. This selection was made on the basis of previous studies and in consultation with experts in the cities, but no in-depth research was performed locally.
Further limitations arise with regard to the quality of the datasets, which deserves more attention. For instance, we used data from the 2011 census in Germany. The next census took place in 2022 and came too late for our project. At the time of the project, these data were almost 10 years out of date. Therefore, the population structure in the two cities will have changed to some extent in the meantime. Moreover, we extensively took advantage of data from the volunteered geographic information project OSM. Data from OSM have known weaknesses with regard to the completeness of amenities [
49]. The OSM community is predominantly made up of younger men [
50]. The resulting bias in the mapping has been criticized with regard to its lack of gender balance [
51]. It is also likely to be to the detriment of facilities of particular relevance to older people. There are significant quality differences between the different supply facilities. Our checks showed that supermarkets, for example, were complete in the study areas in OSM, whereas this was not the case for nursing and care facilities. Our focus at this stage was on developing a walkability index for older people that is transferable to other cities and not on validating or collecting missing data. Therefore, we have accepted some bias in the results due to data deficiencies.
Including the third dimension into the considerations proved to be critical for the adaption of the Walk Score to the needs of elderly people. Steep uphill and downhill slopes influence the walkability of pathways and streets for elderly people largely. Our research shows that very accurate digital elevation models are needed to reliably calculate slopes for passageways of all kinds. In our study, we used digital height models with 1 m grid width and 0.15 m height accuracy of grid points. Even with such a very high-quality digital height model, we found significant differences in the calculated walkability of facilities.
6. Conclusions
In this article, we present a method for calculating walkability and describe its application for elderly people in Goslar and Kempten, two medium-sized cities in Germany. The method starts from the Walk Score approach and reframes it with a view to the distinct needs of older people. To this end, we take into account stairs and sloped surfaces that complement the two-dimensional road network. We also pay attention to the slower walking times of the elderly and adapt the selection and weighting of supply facilities according to their relevance for older people.
By implementing the model, we showed that the Walk Score can be adjusted with a view to the specific needs of the elderly and can be applied to medium-sized German cities. For this purpose, a combination of different data, both official and voluntarily collected, was successfully employed. By using high-quality digital height models, it was possible to extend the walkability model from 2D to 3D to account for the fact that steep inclines and declines greatly affect walkability for many older people. The implementation in Goslar and Kempten also revealed differences arising from the city’s size and structure that should be taken into account in walkability studies. By taking into account the third dimension, the proposed approach also helps to address a common shortcoming of supply analysis in urban planning. By this, we mean the scant attention paid to the relationship between distance and slope. For example, on the one hand, walkability may be good in terms of slope, but the distance to supply facilities may be large, ultimately making it impossible for a senior to access the facility. Conversely, a close facility may be inaccessible to seniors because of the steep terrain. By applying our method, a city planner can customize parameters such as slope thresholds or inaccessible distances to optimize the interplay of distance and slope, taking into account the characteristics of citizens and specific site conditions.
In implementing the model, we have made certain assumptions, some of which have not yet been clearly empirically substantiated. Against this background, it needs to be kept in mind that a city´s Walk Score in our model is likely to vary depending on the specific mobility capability of considered seniors. We have optimised the model for a specific group of seniors, namely those who can still walk independently, albeit more slowly. Adapting the Walk Score for all older citizens and their varying abilities presents opportunities for future research.
Author Contributions
Conceptualization, Markus Schaffert; methodology, Markus Schaffert, Konstantin Geist, Jonathan Albrecht, Dorothea Enners, and Hartmut Müller; validation, Markus Schaffert, Konstantin Geist, Jonathan Albrecht, Dorothea Enners, and Hartmut Müller; formal analysis, Konstantin Geist, Jonathan Albrecht, and Dorothea Enners; investigation, Konstantin Geist, Jonathan Albrecht, and Dorothea Enners; data curation, Konstantin Geist, Jonathan Albrecht, and Dorothea Enners; writing—original draft preparation, Markus Schaffert, Konstantin Geist, Jonathan Albrecht, Dorothea Enners, and Hartmut Müller; writing—review and editing, Markus Schaffert, Konstantin Geist, Jonathan Albrecht, Dorothea Enners, and Hartmut Müller; visualization, Konstantin Geist, Jonathan Albrecht, and Dorothea Enners; supervision, Markus Schaffert and Hartmut Müller. All authors have read and agreed to the published version of the manuscript.
Funding
This research received no external funding.
Data Availability Statement
Restrictions apply to the availability of these data. Data were obtained from public authorities and are available only on application.
Acknowledgments
This research was supported by the public mapping agencies of Lower Saxony and Bavaria, which provided the use of authoritative data free of charge.
Conflicts of Interest
The authors declare no conflict of interest.
Appendix A
Calculation of Slope Gradients from a Digital Height Model
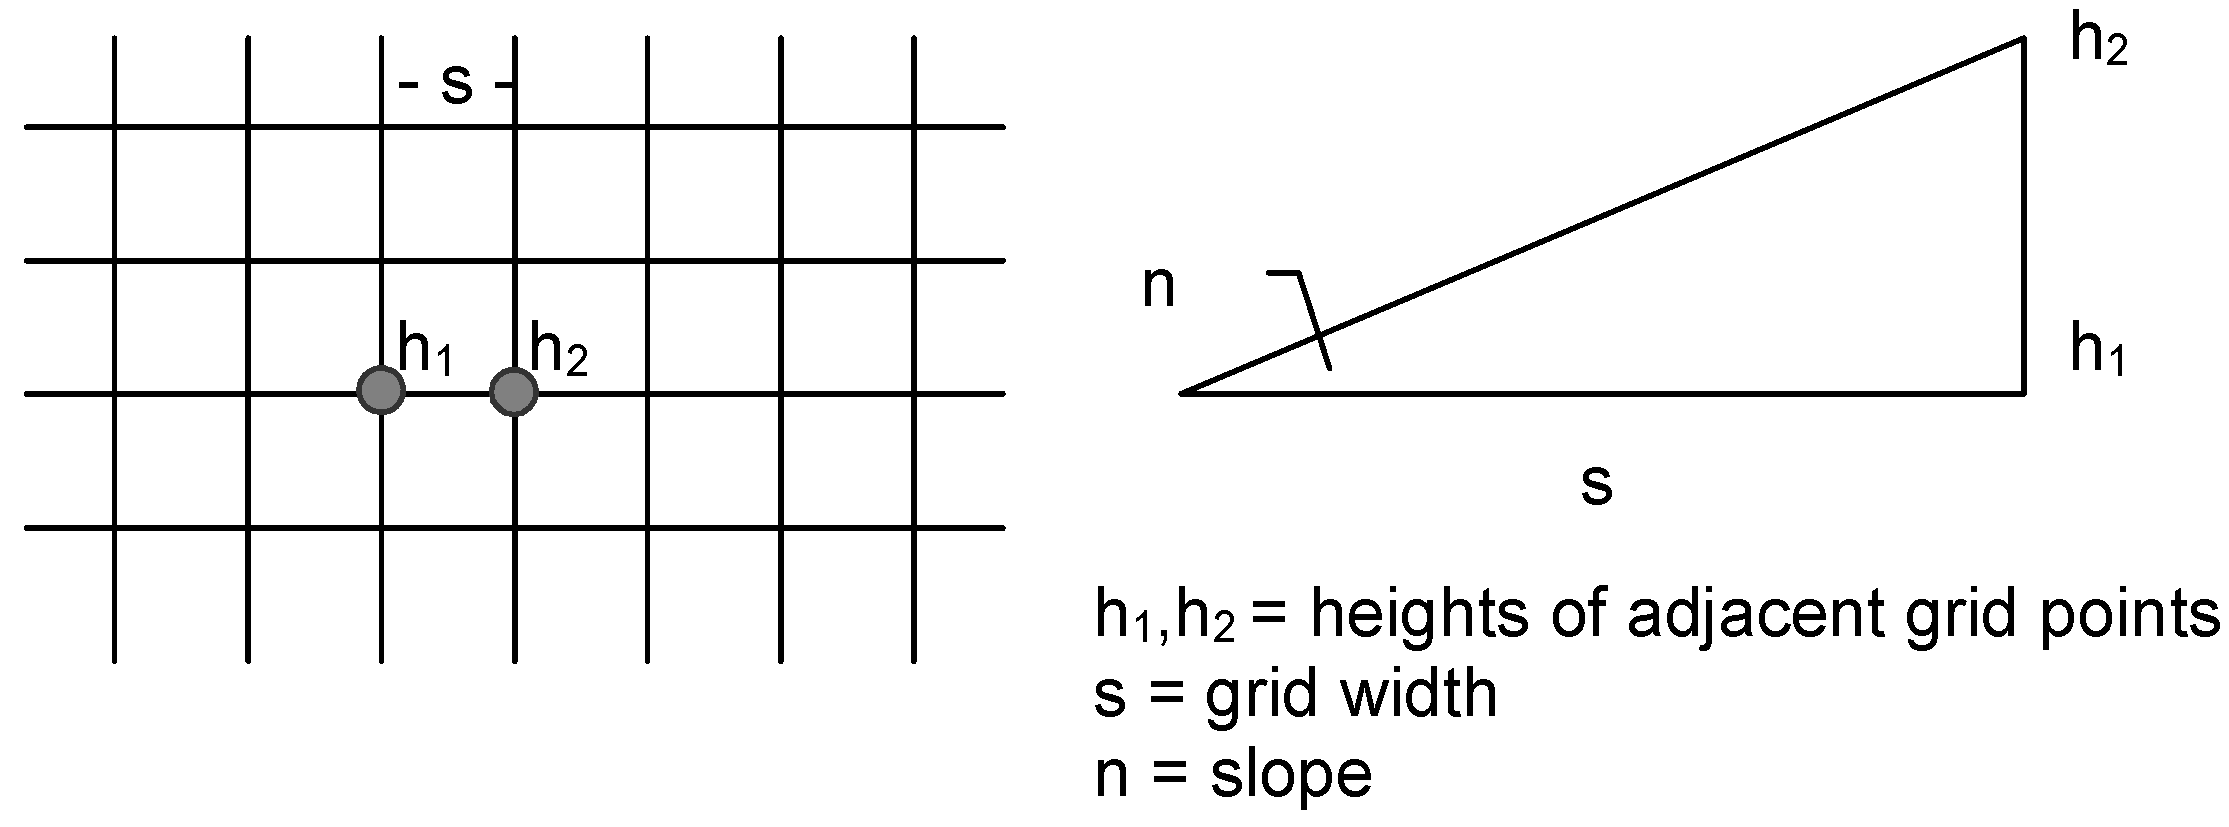
Digital height models of the earth’s surface are widely available, typically in the form of a regular grid with given heights of grid points (
Figure A1).
Figure A1.
Digital height model: grid width, heights, slopes.
Figure A1.
Digital height model: grid width, heights, slopes.
For given heights
h1 and
h2 and grid width
s we can calculate slope
n from Equation (A1).
As can be seen from Equations (A2) and (A3), the standard deviation σ
n of slope
n is a function of grid width
s and correlation factor
r between
h1 and
h2, with 0 ≤
r ≤ 1.
Data sources such as the SRTM (Shuttle Radar Topography Mission) and the EU Digital Elevation Model (EU-DEM) are freely available. They provide a typical grid resolution of approximately 1 arc second. The EU-DEM is available with a grid resolution of 25 m and a vertical accuracy of +/− 7 m RMSE (
https://land.copernicus.eu/user-corner/publications/eu-dem-flyer/view, accessed on 15 January 2023).
From Equation (A3) and σ
h1 = σ
h2 = σ = 7 m,
s = 25 m, we obtain
At worst, the calculated slope values would be subject to an error of 40 percent. In practice, the correlation will range somewhere between the two extreme values 0 and 1 but is usually unknown. Another shortcoming of such coarse digital height models is the low resolution, which means that not all slope changes in a walking path can be detected.
In Germany, the national mapping agencies maintain digital height models with a grid resolution of up to 1 m and a vertical accuracy of +/− 0.15 m RMSE.
For such a high-resolution digital height model, Equation (A3) and σ
h1 = σ
h2 = σ = 0.15 m,
s = 1 m yields
The calculated slope values n can be subject to an error of up to 21 percent, which is again not satisfactory. However, the resolution of 1 metre is not necessary for the walking direction since the slopes in urban areas do not change at such a high rate. We therefore divide the walkable paths into 5 m sections in the walking direction and assign the elevation values from the 1 m digital height model to the endpoints of each of these sections. In that way we adjust the length of path segments to the walkable network of a city (s = 5 m) while keeping the high accuracy of terrain heights (σ = 0.15 m).
From Equation (A3) we then obtain
To account for this uncertainty, albeit much lower, we perform the network calculations using two rounded values for the slope limit of the walkable routes, 10 percent and 15 percent, respectively (see main text).
References
- Calafiore, A.; Dunning, R.; Nurse, A.; Singleton, A. The 20-minute city: An equity analysis of Liverpool City Region. Transp. Res. Part D Transp. Environ. 2022, 102, 103111. [Google Scholar] [CrossRef]
- Caselli, B.; Carra, M.; Rossetti, S.; Zazzi, M. Exploring the 15-minute neighbourhoods. An evaluation based on the walkability performance to public facilities. Transp. Res. Procedia 2022, 60, 346–353. [Google Scholar] [CrossRef]
- Kissfazekas, K. Circle of paradigms? Or ‘15-minute’neighbourhoods from the 1950s. Cities 2022, 123, 103587. [Google Scholar] [CrossRef]
- Smith, K.R.; Brown, B.B.; Yamada, I.; Kowaleski-Jones, L.; Zick, C.D.; Fan, J.X. Walkability and body mass index: Density, design, and new diversity measures. Am. J. Prev. Med. 2008, 35, 237–244. [Google Scholar] [CrossRef] [PubMed]
- Nieuwenhuijsen, M.J.; Khreis, H. Car free cities: Pathway to healthy urban living. Environ. Int. 2016, 94, 251–262. [Google Scholar] [CrossRef]
- Weng, M.; Ding, N.; Li, J.; Jin, X.; Xiao, H.; He, Z.; Su, S. The 15-minute walkable neighborhoods: Measurement, social inequalities and implications for building healthy communities in urban China. J. Transp. Health 2019, 13, 259–273. [Google Scholar] [CrossRef]
- Alves, F.; Cruz, S.; Ribeiro, A.; Silva, A.B.; Martins, J.; Cunha, I. Walkability Index for Elderly Health: A Proposal. Sustainability 2020, 12, 7360. [Google Scholar] [CrossRef]
- Shielvds, R.; Gomes da Silva, E.J.; Lima e Lima, T.; Osorio, N. Walkability: A review of trends. J. Urban. Int. Res. Placemak. Urban Sustain. 2021, 16, 1–23. [Google Scholar]
- Yang, S.; Chen, X.; Wang, L.; Wu, T.; Fei, T.; Xiao, Q.; Jia, P. Walkability indices and childhood obesity: A review of epidemiologic evidence. Obes. Rev. 2021, 22, e13096. [Google Scholar] [CrossRef] [PubMed]
- Chandrabose, M.; Cao, Y.; Hadgraft, N.; Higgs, C.; Shuvo, F.K.; Dunstan, D.W.; Owen, N.; Sugiyama, T. Neighbourhood walkability and dietary attributes: Effect modification by area-level socio-economic status. Public Health Nutr. 2022, 25, 2593–2600. [Google Scholar] [CrossRef] [PubMed]
- Maghelal, P.K.; Capp, C.J. Walkability: A Review of Existing Pedestrian Indices. J. Urban Reg. Inf. Syst. Assoc. 2011, 23, 5–19. [Google Scholar]
- Sallis, J.F.; Cerin, E.; Conway, T.L.; Adams, M.A.; Frank, L.D.; Pratt, M.; Owen, N. Physical activity in relation to urban environments in 14 cities worldwide: A cross-sectional study. Lancet 2016, 387, 2207–2217. [Google Scholar] [CrossRef] [Green Version]
- Wang, H.; Yang, Y. Neighbourhood walkability: A review and bibliometric analysis. Cities 2019, 93, 43–61. [Google Scholar] [CrossRef]
- Lam, T.M.; Wang, Z.; Vaartjes, I.; Karssenberg, D.; Ettema, D.; Helbich, M.; Timmermans, E.J.; Frank, L.D.; Braver, N.R.D.; Wagtendonk, A.J.; et al. Development of an objectively measured walkability index for the Netherlands. Int. J. Behav. Nutr. Phys. Act. 2022, 19, 1–16. [Google Scholar] [CrossRef]
- Bayar, R.; Yılmaz, M. Measuring age-friendliness based on the walkability indices of older people to urban facilities. Urban Design Int. 2022, 28, 35–51. [Google Scholar] [CrossRef]
- Horak, J.; Kukuliac, P.; Maresova, P.; Orlikova, L.; Kolodziej, O. Spatial Pattern of the Walkability Index, Walk Score and Walk Score Modification for Elderly. ISPRS Int. J. Geo-Inf. 2022, 11, 279. [Google Scholar] [CrossRef]
- Golan, Y.; Henderson, J.; Wilkinson, N.L.; Weverka, A. Gendered walkability. J. Transp. Land Use 2019, 12, 501–526. [Google Scholar] [CrossRef]
- Distefano, N.; Pulvirenti, G.; Leonardi, S. Neighbourhood walkability: Elderly’s priorities. Res. Transp. Bus. Manag. 2021, 40, 100547. [Google Scholar] [CrossRef]
- Jehle, U.; Pajares, E. Analyse der Fußwegequalitäten zu Schulen: Entwicklung von Indikatoren auf Basis von OpenData. In Dresdner Flächennutzungssymposium; Rhombos-Verlag: Dresden, Germany, 2021; Volume 79, pp. 221–231. [Google Scholar]
- Adams, M.A.; Frank, L.D.; Schipperijn, J.; Smith, G.; Chapman, J.; Christiansen, L.B.; Coffee, N.; Salvo, D.; du Toit, L.; Dygrýn, J.; et al. International variation in neighborhood walkability, transit, and recreation environments using geographic information systems: The IPEN adult study. Int. J. Health Geogr. 2014, 13, 43. [Google Scholar] [CrossRef] [Green Version]
- Reyer, M.; Fina, S.; Siedentop, S.; Schlicht, W. Walkability is only part of the story: Walking for transportation in Stuttgart, Germany. Int. J. Environ. Res. Public Health 2014, 11, 5849–5865. [Google Scholar] [CrossRef] [PubMed]
- Jacobs, J.; Backholer, K.; Strugnell, C.; Allender, S.; Nichols, M. Socio-economic and regional differences in walkability and greenspace around primary schools: A census of Australian primary school neighbourhoods. J. Community Health 2021, 46, 98–107. [Google Scholar] [CrossRef]
- Ujang, N.; Salim, A.; Maulan, S. The Influence of Context and Urban Structure on the Walkability of Bukit Bintang Commercial District, Kuala Lumpur. ALAM CIPTA Int. J. Sustain. Trop. Des. Res. Pract. 2012, 5, 15–26. [Google Scholar]
- Bereitschaft, B. Older adult population and neighborhood walkability by metropolitan area size and degree of urban sprawl. Pap. Appl. Geogr. 2022, 8, 249–267. [Google Scholar] [CrossRef]
- Wittowsky, D.; Hoekveld, J.; Welsch, J.; Steier, M. Residential housing prices: Impact of housing characteristics, accessibility and neighbouring apartments—A case study of Dortmund, Germany. Urban Plan. Transp. Res. 2020, 8, 44–70. [Google Scholar] [CrossRef] [Green Version]
- Burk, J.; Meyer, C.; Peters, J.C.; Rauch, S. GIS-gestützte Modellierung der Erreichbarkeiten ambulanter Pflegedienste nach SGB V und SGB XI in Unterfranken unter Berücksichtigung demographischer Entwicklungen. Raumforsch. Und Raumordn. Spat. Res. Plan. 2020, 78, 487–507. [Google Scholar] [CrossRef]
- Rauch, S.; Rauh, J.; Graßl, M. Räumliche Analyse der MIV-und fußläufigen Erreichbarkeit von Nahversorgungsbetrieben in ländlichen Räumen Mainfrankens. In Tagungsband MobilEr; Sigert GmbH: Braunschweig, Germany, 2020; pp. 103–106. [Google Scholar]
- Buffel, T.; De Donder, L.; Phillipson, C.; Dury, S.; De Witte, N.; Verté, D. Social participation among older adults living in medium-sized cities in Belgium: The role of neighbourhood perceptions. Health Promot. Int. 2014, 29, 655–668. [Google Scholar] [CrossRef]
- Arellana, J.; Saltarín, M.; Larrañaga, A.M.; Alvarez, V.; Henao, C.A. Urban walkability considering pedestrians’ perceptions of the built environment: A 10-year review and a case study in a medium-sized city in Latin America. Transp. Rev. 2020, 40, 183–203. [Google Scholar] [CrossRef]
- Wagner, M.; Growe, A. Research on small and medium-sized towns: Framing a new field of inquiry. World 2021, 2, 105–126. [Google Scholar] [CrossRef]
- Adam, B.; Blätgen, N. Bevölkerungsdynamik und Innenentwicklung in Mittelstädten; BBSR-Analysen KOMPAKT: Berlin, Germany, 2019; Volume 10. [Google Scholar]
- Frank, L.D.; Sallis, J.F.; Saelens, B.E.; Leary, L.; Cain, K.; Conway, T.L.; Hess, P.M. The development of a walkability index: Application to the Neighborhood Quality of Life Study. Br. J. Sport. Med. 2010, 44, 924–933. [Google Scholar] [CrossRef]
- Liang, Z.; Lo, H.K.; Ng, K.F. Towards Walkability Enhancement: A Systematic Review and Future Directions. SSRN. Available online: https://ssrn.com/abstract=4013437 (accessed on 1 February 2023).
- Carr, L.J.; Dunsiger, S.I.; Marcus, B.H. Validation of Walk Score for estimating access to walkable amenities. Br. J. Sport. Med. 2011, 45, 1144–1148. [Google Scholar] [CrossRef] [Green Version]
- Hall, C.M.; Ram, Y. Walk score® and its potential contribution to the study of active transport and walkability: A critical and systematic review. Transp. Res. Part D Transp. Environ. 2018, 61, 310–324. [Google Scholar] [CrossRef]
- Jardim, B.; de Castro Neto, M. Walkability Indicators in the Aftermath of the COVID-19 Pandemic: A Systematic Review. Sustainability 2022, 14, 10933. [Google Scholar] [CrossRef]
- Otsuka, N.; Wittowsky, D.; Damerau, M.; Gerten, C. Walkability assessment for urban areas around railway stations along the Rhine-Alpine Corridor. J. Transp. Geogr. 2021, 93, 103081. [Google Scholar] [CrossRef]
- Ludwig, I.; Voss, A.; Krause-Traudes, M. A Comparison of the Street Networks of Navteq and OSM in Germany. In Advancing Geoinformation Science for a Changing World; Springer: Berlin/Heidelberg, Germany, 2011; pp. 65–84. [Google Scholar]
- Hochmair, H.; Zielstra, D.; Neis, P. Assessing the completeness of bicycle trails and designated lane features in OpenStreetMap for the United States. Trans. GIS 2014, 19, 63–81. [Google Scholar] [CrossRef]
- Boeing, G. Street network models and indicators for every urban area in the world. Geogr. Anal. 2022, 54, 519–535. [Google Scholar] [CrossRef]
- Deng, C.; Dong, X.; Wang, H.; Lin, W.; Wen, H.; Frazier, J.; Holmes, L. A data-driven framework for walkability measurement with open data: A case study of triple cities, New York. ISPRS Int. J. Geo-Inf. 2020, 9, 36. [Google Scholar] [CrossRef] [Green Version]
- Kelm, T.; Beyel, S.; Müller, C.; Klein, U. Identifizierung von Steigungen als Barrieren für Mobilitätseingeschränkte Personen. In Proceedings of the 22nd International Conference on Urban Planning, Regional Development and Information Society, REAL CORP 2017 PANTA RHEI—A World in Constant Motion, Wien, Austria, 12–14 September 2017; pp. 251–259. [Google Scholar]
- Mueller, C.; Beyel, S.; Klein, U. Barrier-free accessibility of facilities of the local general interest and space attractiveness for seniors. GIS-based demographic impact analysis and cartographic representations to gain insight. KN-J. Cartogr. Geogr. Inf. 2017, 67, 202–209. [Google Scholar] [CrossRef]
- Zensus. Statistical Offices of the Federation and the Länder. 2011. Available online: https://www.zensus2011.de/DE/Home/home_node.html (accessed on 1 February 2023).
- Weidmann, U. Transporttechnik der Fußgänger: Transporttechnische Eigenschaften des Fußgängerverkehrs, Literaturauswertung. IVT Schr. 1993, 90, 6585. [Google Scholar]
- Artmann, M.; Mueller, C.; Goetzlich, L.; Hof, A. Supply and demand concerning urban green spaces for recreation by elderlies living in care facilities: The role of accessibility in an explorative case study in Austria. Front. Environ. Sci. 2019, 7, 136. [Google Scholar] [CrossRef]
- Ahlmeyer, F.; Wittowsky, D. What do we need in Rural Areas? How to use Accessibility Modelling as a Strategy in Transport Planning. Raumforsch. Raumordn. Spat. Res. Plan. 2018, 76, 531–550. [Google Scholar]
- Burgdorf, M.; Krischausky, G.; Müller-Keißler, R. Indikatoren zur Nahversorgung: Erreichbarkeit von Gütern und Dienstleistungen des erweiterten täglichen Bedarfs; Bundesinstitut für Bau-, Stadt-und Raumforschung: Bonn, Germany, 2021. [Google Scholar]
- Brückner, J.; Schott, M.; Zipf, A.; Lautenbach, S. Assessing shop completeness in OpenStreetMap for two federal states in Germany. Agil. GIScience Ser. 2021, 2, 20. [Google Scholar] [CrossRef]
- Gardner, Z.; Mooney, P.; De Sabbata, S.; Dowthwaite, L. Quantifying gendered participation in OpenStreetMap: Responding to theories of female (under) representation in crowdsourced mapping. GeoJournal 2020, 85, 1603–1620. [Google Scholar] [CrossRef] [Green Version]
- Sharma, R. How and Why Diversity and Inclusion are Vital for the Future of Geospatial Data Management and the Surveying Profession. In Geospatial Data in the 2020s. Transformative Power and Pathways to Sustainability; Buxton, C., Louwsma, M., Müller, H., Schaffert, M., Eds.; International Federation of Surveyors: Copenhagen, Denmark, 2022; pp. 61–76. ISBN 978-87-93914-00-1. [Google Scholar]
| Disclaimer/Publisher’s Note: The statements, opinions and data contained in all publications are solely those of the individual author(s) and contributor(s) and not of MDPI and/or the editor(s). MDPI and/or the editor(s) disclaim responsibility for any injury to people or property resulting from any ideas, methods, instructions or products referred to in the content. |
© 2023 by the authors. Licensee MDPI, Basel, Switzerland. This article is an open access article distributed under the terms and conditions of the Creative Commons Attribution (CC BY) license (https://creativecommons.org/licenses/by/4.0/).


