Article

A Tale of Two Cities: COVID-19 Vaccine Hesitancy as a Result of Racial, Socioeconomic, Digital, and Partisan Divides

by
Rui Li
1,*,
Daniel Erickson
2,
Mareyam Belcaid
2,
Madu Franklin Chinedu
2 and
Oluwabukola Olufunke Akanbi
2
1
Department of Geography and Planning, University at Albany, State University of New York, Albany, NY 12222, USA
2
Institute for Geoinformatics, University of Muenster, 48149 Muenster, Germany
*
Author to whom correspondence should be addressed.
ISPRS Int. J. Geo-Inf. 2023, 12(4), 158; https://doi.org/10.3390/ijgi12040158
Submission received: 9 January 2023 / Revised: 21 March 2023 / Accepted: 4 April 2023 / Published: 7 April 2023

Abstract

:
The unprecedented COVID-19 pandemic has drawn great attention to the issue of vaccine hesitancy, as the acceptance of the innovative RNA vaccine is relatively low. Studies have addressed multiple factors, such as socioeconomic, political, and racial backgrounds. These studies, however, rely on survey data from participants as part of the population. This study utilizes the actual data from the U.S. Census Bureau as well as actual 2020 U.S. presidential election results to generate four major category of factors that divide the population: socioeconomic status, race and ethnicity, access to technology, and political identification. This study then selects a region in a traditionally democratic state (Capital Region in New York) and a region in a traditionally republican state (Houston metropolitan area in Texas). Statistical analyses such as correlation and geographically weighted regression reveal that factors such as political identification, education attainment, and non-White Hispanic ethnicity in both regions all impact vaccine acceptance significantly. Other factors, such as poverty and particular minority races, have different influences in each region. These results also highlight the necessity of addressing additional factors to further shed light on vaccine hesitancy and potential solutions according to identified factors.

1. Introduction

As a pharmaceutical means to combat the unprecedented coronavirus disease 2019 (COVID-19), innovative vaccines against COVID-19 have been developed and administered in multiple countries. By the end of July 2021, 57% of the population in the U.S. had received at least one dose of a COVID-19 vaccine [1]. A sizeable proportion of the population was still hesitant to receive COVID-19 vaccines. This is not a new phenomenon, as hesitancy towards other vaccines, such as influenza or meningococcal vaccines, has always existed due to sociodemographic and ideological factors [2,3]. During the COVID-19 pandemic, an NPR poll suggested that one out of four Americans would refuse a COVID-19 vaccine, and another 5% Americans were undecided [4]. While the effort of promoting vaccination and the later developed boosters has been ongoing, many individuals still demonstrate varying levels of hesitancy toward being vaccinated against COVID-19. Researchers have suggested many factors that possibly influence an individual’s willingness to get the COVID-19 vaccine, such as their race, religion, political affiliation, education, and income [5]. Prior to this pandemic, a report showed that conservatives were more likely to have negative attitudes towards vaccines because of trusting misinformation [6]. In this pandemic, political affiliation seems to have become a more prominent factor, as conservatives supporting former-president Trump display strong hesitancy toward COVID-19 vaccines [7]. In addition to these factors, other researchers further suggest structural barriers such as convenience, transportation, language, computer/internet access, and access to vaccination sites could impact vaccination progress. In particular, access to a computer and the internet may be a critical factor for scheduling COVID-19 vaccine appointments for those who live in underserved or rural communities [8]. This study reviews and selects representative factors to investigate how racial, socioeconomic, and political factors impact vaccine hesitancy.
The most substantial difference in this study is the methodology. Previous studies primarily employed surveys or interviews for data collection. This study, however, derives factors from census and election data to represent the racial, socioeconomic, digital, and political divides among populations and associate them with the actual COVID-19 vaccination rates at the ZIP code level. In the following sections, this study first reviews individual factors that divide society and their impacts on vaccine acceptance of introduce the research questions. Through adapted methodology and discussions, this study then aims to investigate how the factors influence vaccine hesitancy in two different regions to varying degrees: one a traditionally Democratic state, New York, and one a traditionally Republican state, Texas.

1.1. Racial Dividesf

Acceptance and accessibility of COVID-19 vaccines may have had similar disparities which are reflected in the mortality of minority during this pandemic. COVID-19 has disproportionately affected racial minority populations, which were more likely to live in poor neighborhoods with sparse healthy food options and fewer health facilities [9]. According to the Centers for Disease Control and Prevention (CDC), African Americans and Hispanic populations had three times higher mortality rates and four times higher hospitalization rates as compared to the non-Hispanic White population during the pandemic [10]. Researchers have suggested that structural barriers that lead to disproportionate minority health disparities also potentially cause low vaccination rates among racial minority populations. For example, Njoku and colleagues [8] suggested a few structural barriers that lead to racial divides: convenience, language, immigrant status, transportation, computer and internet access, and lack of trusted points of health access. Similarly, a few other studies suggest that higher hesitancy towards getting a COVID-19 vaccine could be related to interpersonal and systemic racism: this includes limited access to health facilities and historical mistrust towards medical authorities, especially among African Americans [11,12,13].
A recent study investigated the vaccination rate in five urban counties in Texas. These results show that racially segregated areas with higher proportions of Black and Latino residents had limited access to the vaccine. Researchers suggest that the results can be attributed to a long-standing lack of critical health infrastructure, especially hospitals and health clinics, in historically racially segregated areas [14].

1.2. Socioeconomic Divides

Unemployment and poverty are two identified key socioeconomic factors that influence individual choice to get vaccinated in many studies [15,16,17]. Unemployment is statistically associated with lower vaccination rates. A study in the U.S. found that unemployed individuals were more likely to seek vaccines if they were free of charge. In addition, income loss during the pandemic is significantly associated with refusal and delay of immunization against the COVID-19 virus. Most participants from the U.S. were knowledgeable about where to obtain the vaccine and how to access it for free or at a low cost. The accessibility and speed at which a vaccine became available influenced participants’ decision to vaccinate. Both education and employment were also two key factors that played a role in influencing vaccine hesitancy, although studies disagree about what that role may be. Individuals with a bachelor’s degree or a higher level of education are more likely to be employed and more inclined to vaccinate, because of having some understanding of disease severity and the benefits of vaccination [16,18]. On the other hand, some studies have reported that highly educated individuals, including those that had university and college degrees, were more likely to be vaccine-hesitant [19].
Studies have shown that lower incomes are statistically associated with lower vaccination frequencies [14]. Individuals who had a bachelor’s degree or a higher level of education and were earning an income greater than USD 50,000 a year were more supportive of prioritizing who should be vaccinated when the vaccine became available. When it comes to how the time and effort spent getting a vaccine influenced the vaccination decisions of patients, studies demonstrated a wide range of views. In terms of accessibility, it was found that individuals were more likely to get vaccinated if the location was convenient (e.g., at clinics or a vaccine center). Higher vaccination uptake is also observed in clinics where an efficient system is in place to reduce wait times.

1.3. Digital Divides

The term “digital divides” describes the different levels of access to internet connectivity, digital literacy, and technology resources among communities in the U.S. The COVID-19 pandemic has widened these disparities to a higher degree, so much so that one recent medical review said it could now be more correctly labeled a “digital chasm” [20]. These disparities in technological access have possibly led to meaningful ramifications for access to medical resources.
According to Human Rights Watch [21], most states use online systems for scheduling COVID-19 vaccine appointments. The same report suggests that only 50% of people over the age of 75 use the internet and for those 65 or over, 16.5% do not have access to the internet. The report also suggests that for older people of color, the proportions are even lower: 25% of Black adults and 21% of Latino or Hispanic adults over 65 do not have internet access. Another recent study found that there are other significant differences in terms of technology ownership and home internet access between racial or ethnic minority groups [22]. In particular, they found that 25% of Latino or Hispanic adults are “smartphone-only”, meaning that they only have access to the internet via smartphones. Only 17% of Black adults and 12% of White adults fall into this category, although these differences were not significant in the study. This may be especially critical if scheduling appointments for COVID-19 vaccination is more difficult or impossible using a smartphone. Moreover, the same study reports that 63% of Black adults, compared to 49% of White adults, think that not having high-speed internet at home would put them at a disadvantage when trying to make appointments with doctors or other medical professionals. Furthermore, there are geographic divisions in digital access; it was found that 79% of suburban adults and 77% of urban adults have broadband at home compared to only 72% of their rural counterparts. Moreover, a 2018 Pew Research Center study [23] reported that 24% of rural residents expressed that access to high-speed internet in their communities was a problem compared to only 13% of urban residents and 9% of suburban residents. These “dead zones,” or areas with poor broadband or cellular network coverage, are more likely to occur in low-income neighborhoods, rural areas, and in minority communities [20]. Poor internet access in these dead zones seems to have a measurable effect on vaccine uptake.
In addition to the access to internet, information accessed on internet can also lead to different impacts on vaccine acceptance. Information such as information on the vaccine’s reliability and side effects can positively lead to higher COVID-19 vaccine uptake across states [24]. However, vaccine hesitancy and growing distrust in medical and scientific expertise and institutions also have a negative impact on vaccine uptake, which further complicates the digital divides. In addition to the pandemic, there is an “infodemic” which fuels certain groups of the public with misinformation about the vaccine and pandemic, among other information, which can cause confusion and mislead the public [25]. This infodemic, depending on the perceived and believed information, could possibly lead to different vaccine outcomes among groups or communities. Misinformation is a likely factor facilitating vaccine hesitancy, as the source and type of information can greatly influence or create uncertainty in the minds of people, which can lead to distrust in vaccines. A study carried out by in the Netherlands [26] revealed the role of information and individual mindsets as factors in increased vaccine hesitancy. Chen and colleagues [27] found similar patterns in Taiwan by measuring the effect of “fake news”. This study analyzed approximately 700,000 digital news pieces over a six-month period and identified a correlation between the percentage of fake digital news and COVID-19 vaccination hesitancy. Their results suggest that 11 out 26 media sources were disseminating critical “fake news”, which led to a negative impact on vaccine acceptance.

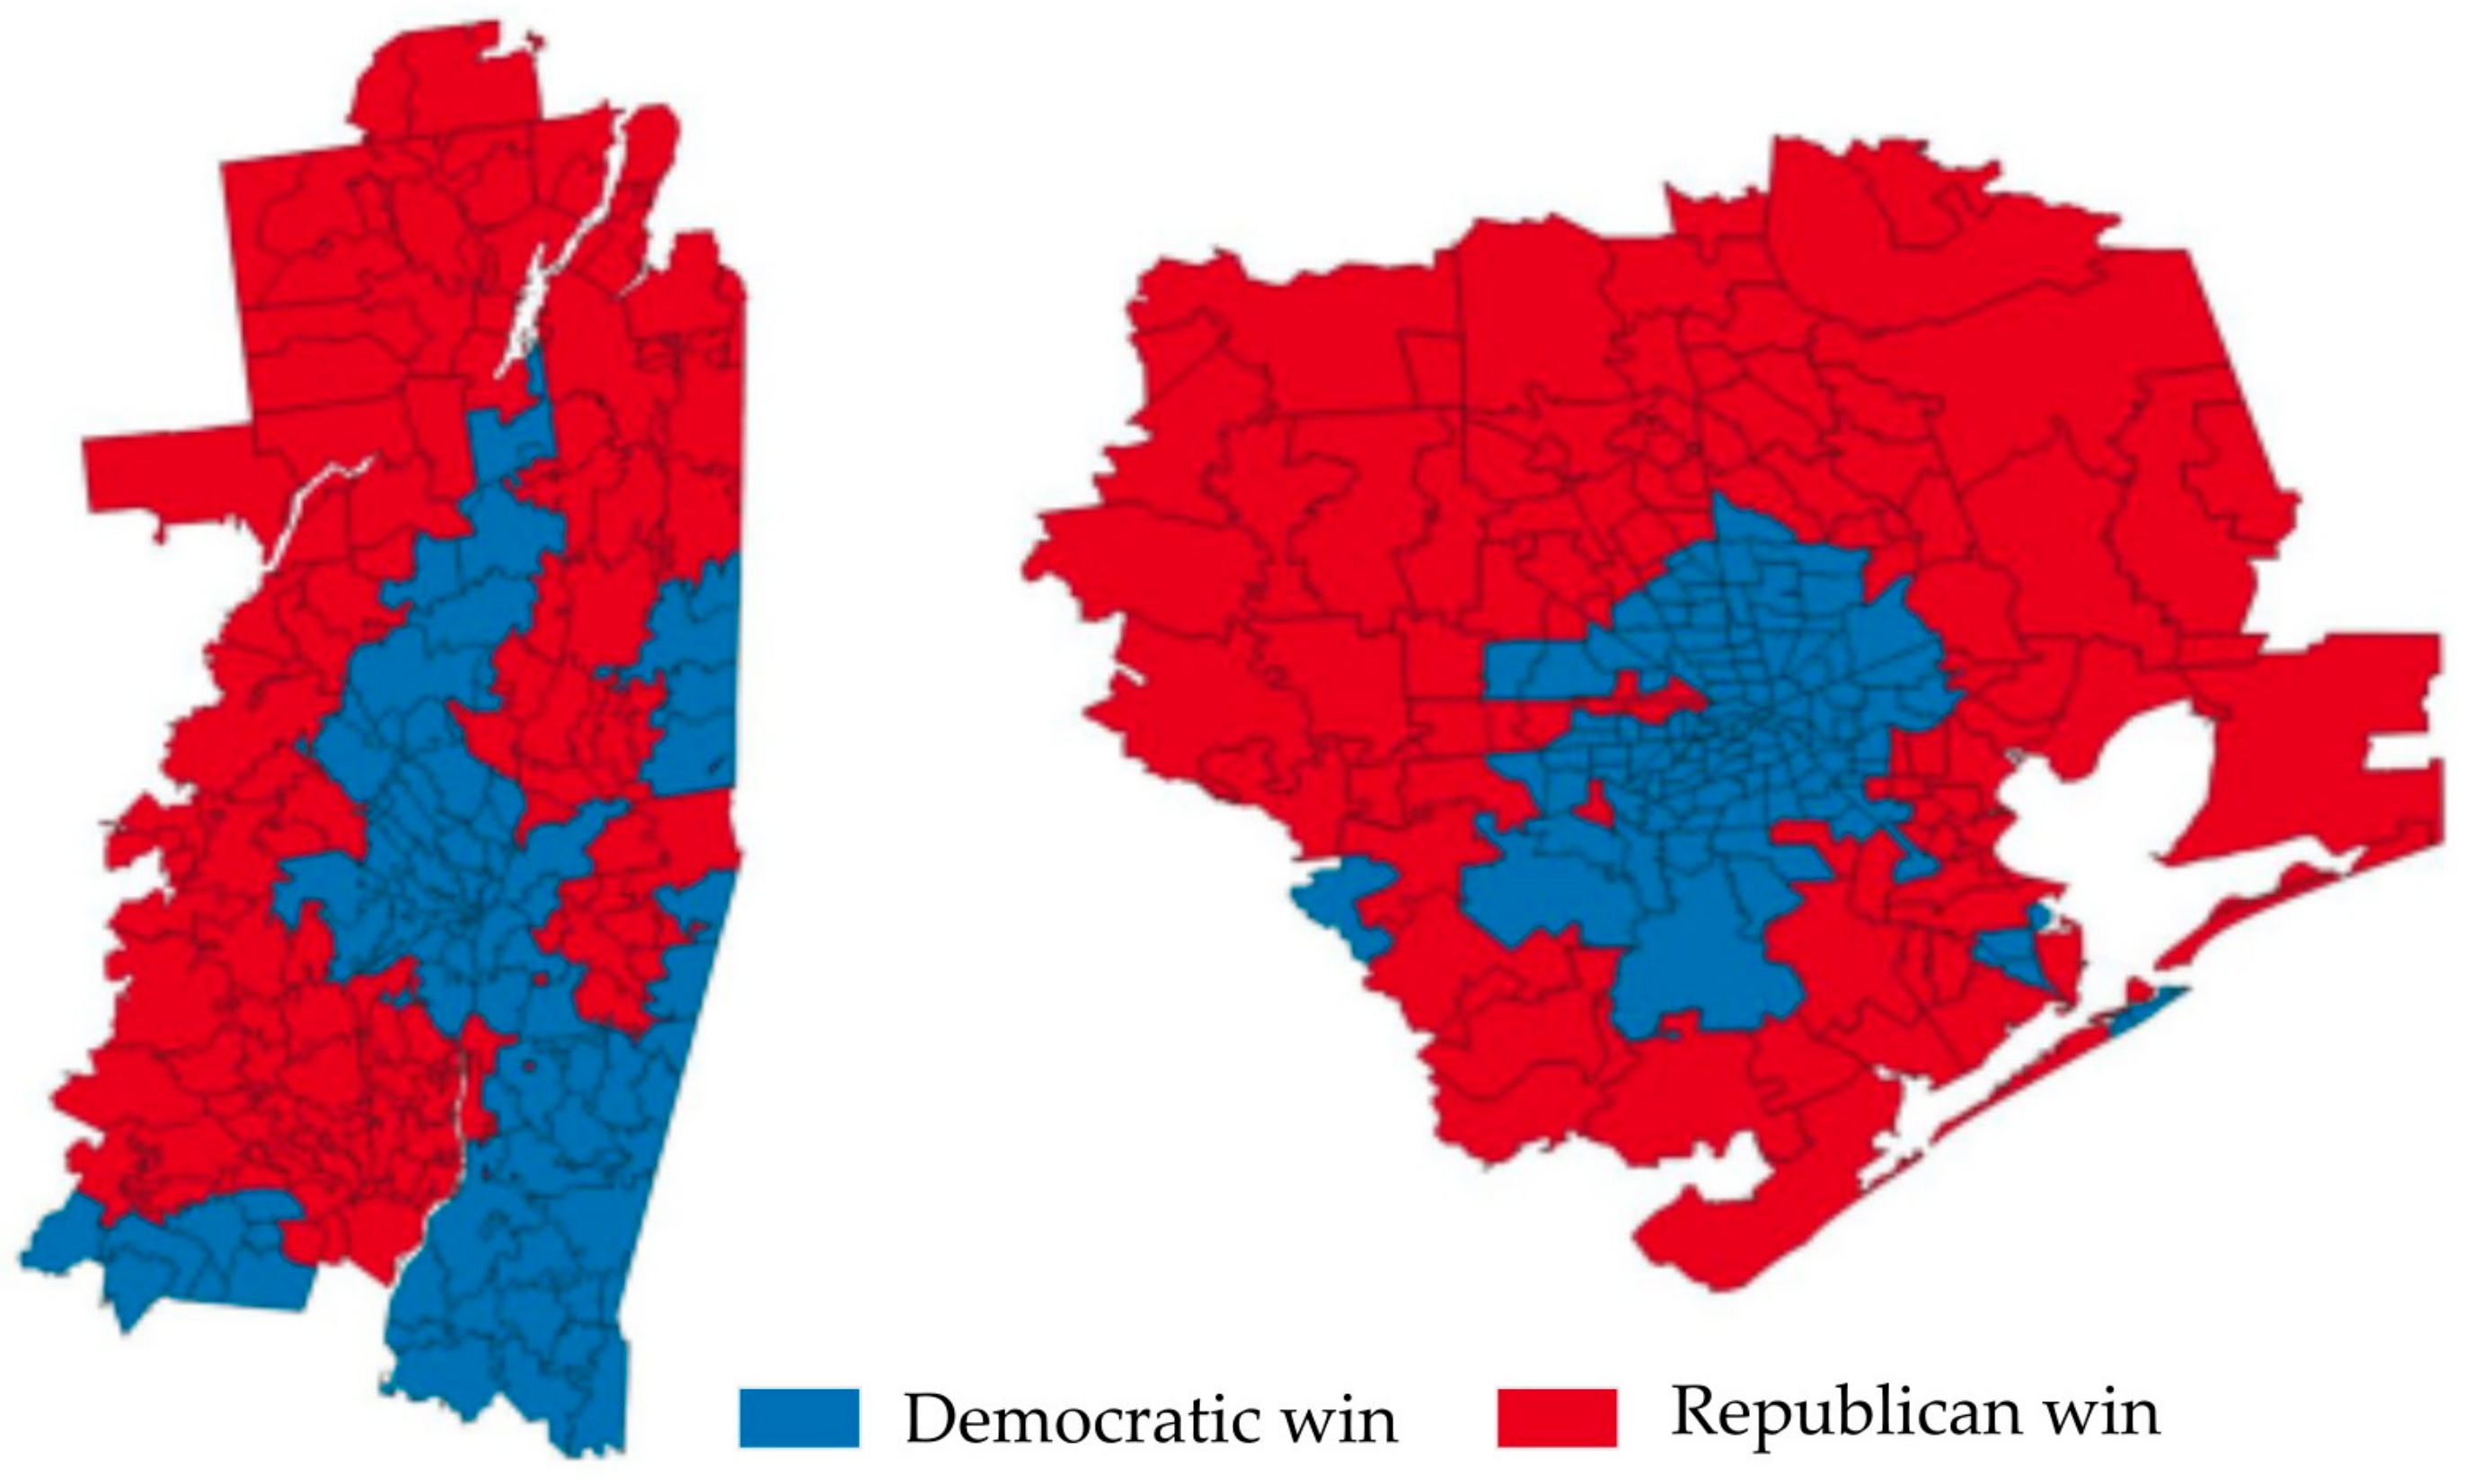
1.4. Partisan Divides

In the most recent U.S. presidential election, a significant amount of misinformation was spread primarily through social media that was aimed at the most ardent supporters of the then-presidential-candidate Trump [15,16,17]. This misinformation likely widened the political divides existing in the U.S. Researchers point out that one of the most important motivations in the U.S. for vaccine hesitancy is the political factor [28]. Sharma and colleagues [29] suggest that political affiliation with the Republican Party is negatively correlated with vaccine acceptance. Similar, the Kaiser Family Foundation (KFF) suggests that political partisanship is one of the largest contributors to vaccine hesitancy [30]. It stated that 92% of Democrats were vaccinated against COVID-19 with at least one dose in 2021, compared to 76% of independents and 55% of Republicans. Another survey focused on the relationship between political affiliation and prevalent news sources among college students in central New York and vaccine hesitancy [31]. This survey revealed that vaccine hesitancy is highly correlated with getting news from right-wing media and negatively correlated with left-wing media. It concluded that political affiliation has the highest correlation with vaccine hesitancy. Furthermore, Cao and colleagues [28] carried out a survey before the vaccine was available, which showed that people who have more trust in the institutions promoting COVID-19 vaccines, such as the CDC, might be less skeptical. In addition, they found that voters who primarily obtain their news and information from left-wing news outlets are more willing to accept the vaccine compared to those who mainly follow right-wing news.
There are other factors, as pointed out in the literature, which can impact vaccine acceptance. For example, a study by the Public Region Research Institute suggests that White evangelical Protestants are more vaccine-hesitant than other groups [32]. However, in general, White Americans are likely to be less religious than Black and Hispanic Americans [33]. Since this study employs actual data from the census and presidential election, religious affiliation data at such a detailed level are not available. It is also important to note that the decision of getting vaccination is personal, evolving, and complex; it would be a mistake to assume that all members of a particular group hold the same beliefs towards a vaccine [12]. In summary, this study reviews factors that have substantial impacts on the acceptance of COVID-19 vaccines. Consequently, this study aims to understand these factors by integrating them and assessing their roles regarding vaccine hesitancy comprehensively. To do so, the study first addresses the disparities in vaccine acceptance as the result of these influencing factors. By adapting a geographically weighted regression (GWR) model based on spatial dependency, this study then looks at how these factors intervene and shape the disparities in vaccine acceptance.

2. Materials and Methods

For this study, we selected two U.S. metropolitan areas and investigated the influences of the identified factors on vaccine acceptance. We chose one traditionally Democratic area and one traditionally Republican area with similar vaccination rates. New York and Texas were selected as the two representative states. With regard to specific areas, this study did not select New York City even though the majority of the population lives here, because the votes are heavily skewed towards the Democratic candidate, which makes its comparison with another less politically skewed metropolitan area unsuitable. After verifying availability of vaccination data, this study selected the Capital Region of New York State around Albany (hereafter the Capital Region) and the Houston metropolitan area in Texas (hereafter the Houston Metro) as the two study areas. As Table 1 shows, both areas have a similar number of ZIP Code Tabulation Areas (ZCTAs). Although the population of the Houston Metro is much larger than that of the Capital Region, both areas have similar average vaccination rates and numbers of ZCTAs voting for each party’s candidate (Figure 1).
This study used the vaccination rate at the ZIP code level, reported on 2 August 2021. The reported vaccination rates in both study areas are close to the national average of 57% [1]. While more recent vaccination were available then, this data period was chosen to exclude the potential influences of the Delta or Omicron variant surges, which may have led to a rise in COVID-19 vaccine rates [34].
For retrieving data to represent the identified factors (racial, socioeconomic, and technical), this study used the American Community Survey (ACS) 2016–2020 5-year estimate at the ZCTA level [35]. In particular, ACS tables covering the following topics were retrieved: racial and ethnic minorities as the racial factors; poverty rate, unemployment rate, and education attainment rates (including below high school degree and at least a bachelor’s degree) as the socioeconomic factors; and no computer access and no internet subscription as the technical factors. In addition to the ACS data, the voting rate for the Republican candidate in the 2020 presidential election was used to represent the factor of political divides. To derive this factor, published election results at the precinct level [36] were aggregated to the ZCTA level to estimate the voting rate for the Republic candidate.
This study first carried out descriptive statistics, followed by correction and geographically weighted regression (GWR), to investigate the influences of these factors on vaccine hesitancy. Instead of a classic regression method such as linear regression, GWR takes spatial adjacency and spatial heterogeneity into consideration [37]. Researchers such as Urban and Nakada [38] have compared the effectiveness of multiple models, including the ordinary least-squares (LS) model, spatial lag model (SLM), GWR, multi-scale GWR, and spatial error model (SEM) and found similar effectiveness between GWR and multi-scale GWR. This study then adapted the GWR for investigating the impacts of these factors on vaccine acceptance, which provided a more detailed assessment at the local level than the multi-scale GWR.

3. Results

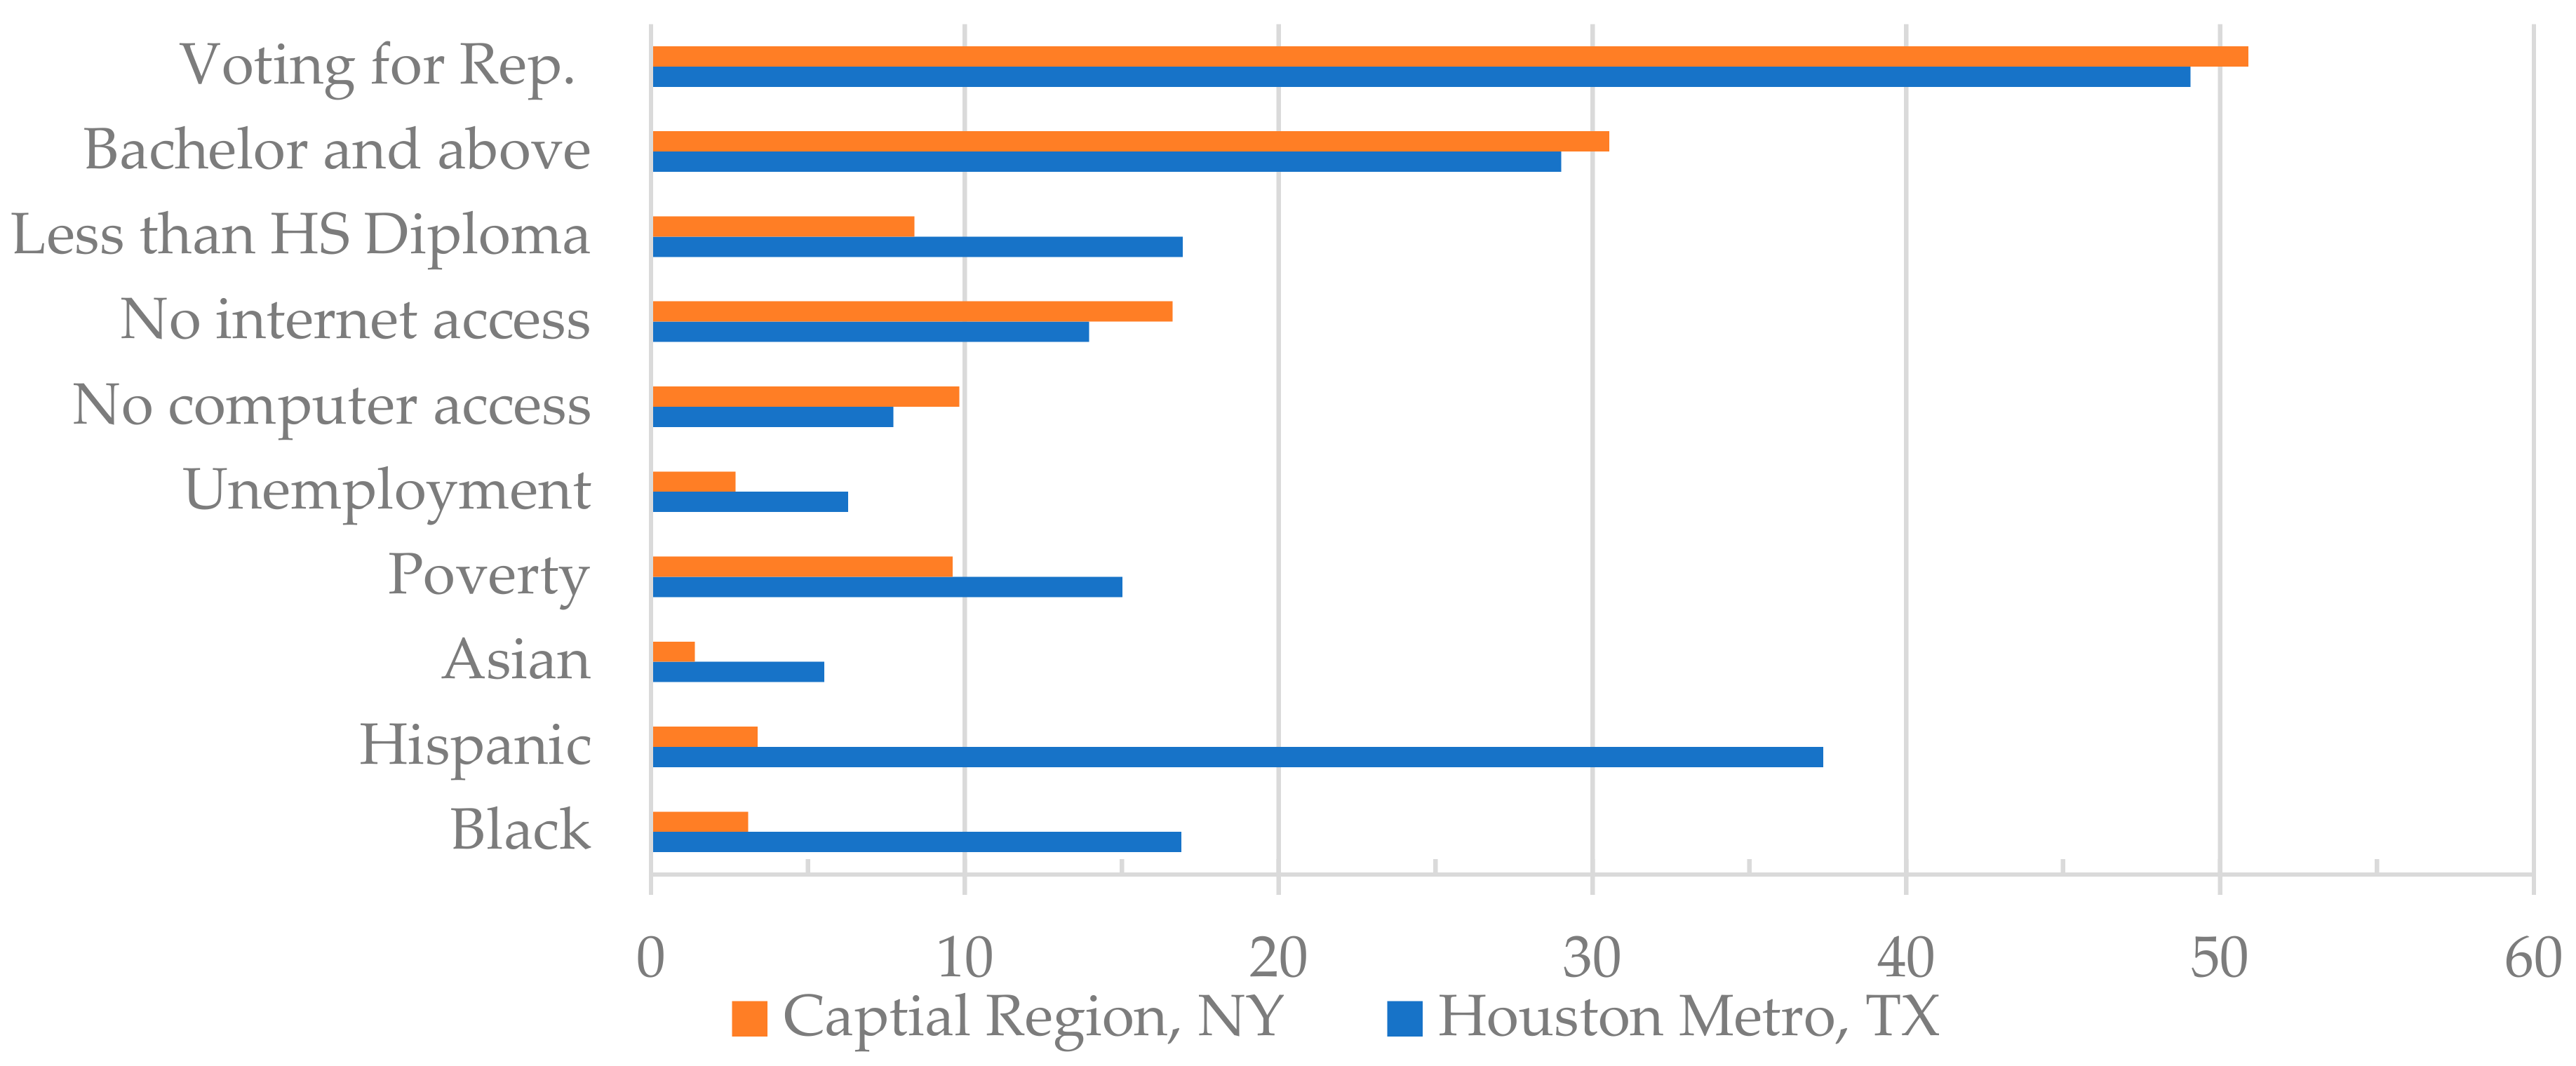
3.1. Disparities between Two Areas

An independent-samples t test showed that differences exist in many measures between these two regions—except the measures of voting for the Republican candidate and factors of educational attainment (bachelor’s degree and above). Regarding racial factors, both regions show great differences in the major minority groups. In particular, the Houston Metro has a much larger minority population than the Capital Region. As shown in Figure 1, the Houston Metro’s Asian population comprised a mean of 5.53% (SD = 8.44) while the Capital Region’s mean Asian population was only 1.63% (SD = 2.95), t (269.34) = 7.20, p < 0.001. The mean Hispanic population in the Houston Metro was 37.36% (SD = 21.61), but in the Capital Region it was only 3.4% (SD = 3.61), t (215.17) = 22.20, p < 0.001. The mean Black population in the Houston Metro was 16.90% (SD = 15.98), but in the Capital Region it was 3.10% (SD = 8.44), t (307.98) = 10.96, p < 0.001. Regarding educational attainment, the Houston Metro had a larger percentage of the population with less than a high school diploma (M = 16.95, SD = 12.09) in comparison to the Capital Region (M = 8.40, SD = 5.53), t (284.19) = 9.22, p < 0.001. Regarding access to computers and the internet, the Houston Metro had a lower percentage of the population without access to a computer (M = 7.73, SD = 6.75) than the Capital Region (M = 9.82, SD = 6.26), t (413) = −3.28, p = 0.001. Similarly, the Houston Metro’s percentage of the population without access to the internet (M = 13.97, SD = 8.73) is lower than that of the Capital Region (M = 16.64, SD = 9.64), t (413) = 0.003.
For those measures that do not show distinct differences between these two regions, there are noticeably different spatial patterns. For example, Figure 2 shows the 2022 presidential election results at the ZCTA level. The blue zones indicate ZCTAs where the Democratic candidate won, while the color red indicates ZCTAs where the Republican candidate won. It is noticeable that the city center of Houston is where most Democratic voters reside, which is surrounded by suburbs, in which most Republican voters reside. The pattern is different in the Capital Region as there is no urban center, while there are a few smaller urban areas, such as Albany, Troy, Schenectady, and Saratoga Springs, scattered across the region. Most Democratic voters reside in the urban and suburban areas, surrounded by rural areas that are dominated by Republican voters. Although the spatial patterns of voters seem different between the regions, it is not difficult to conclude that Democratic voters are more likely to reside in urban areas. In contrast, Republican voters are more likely to reside in rural areas.

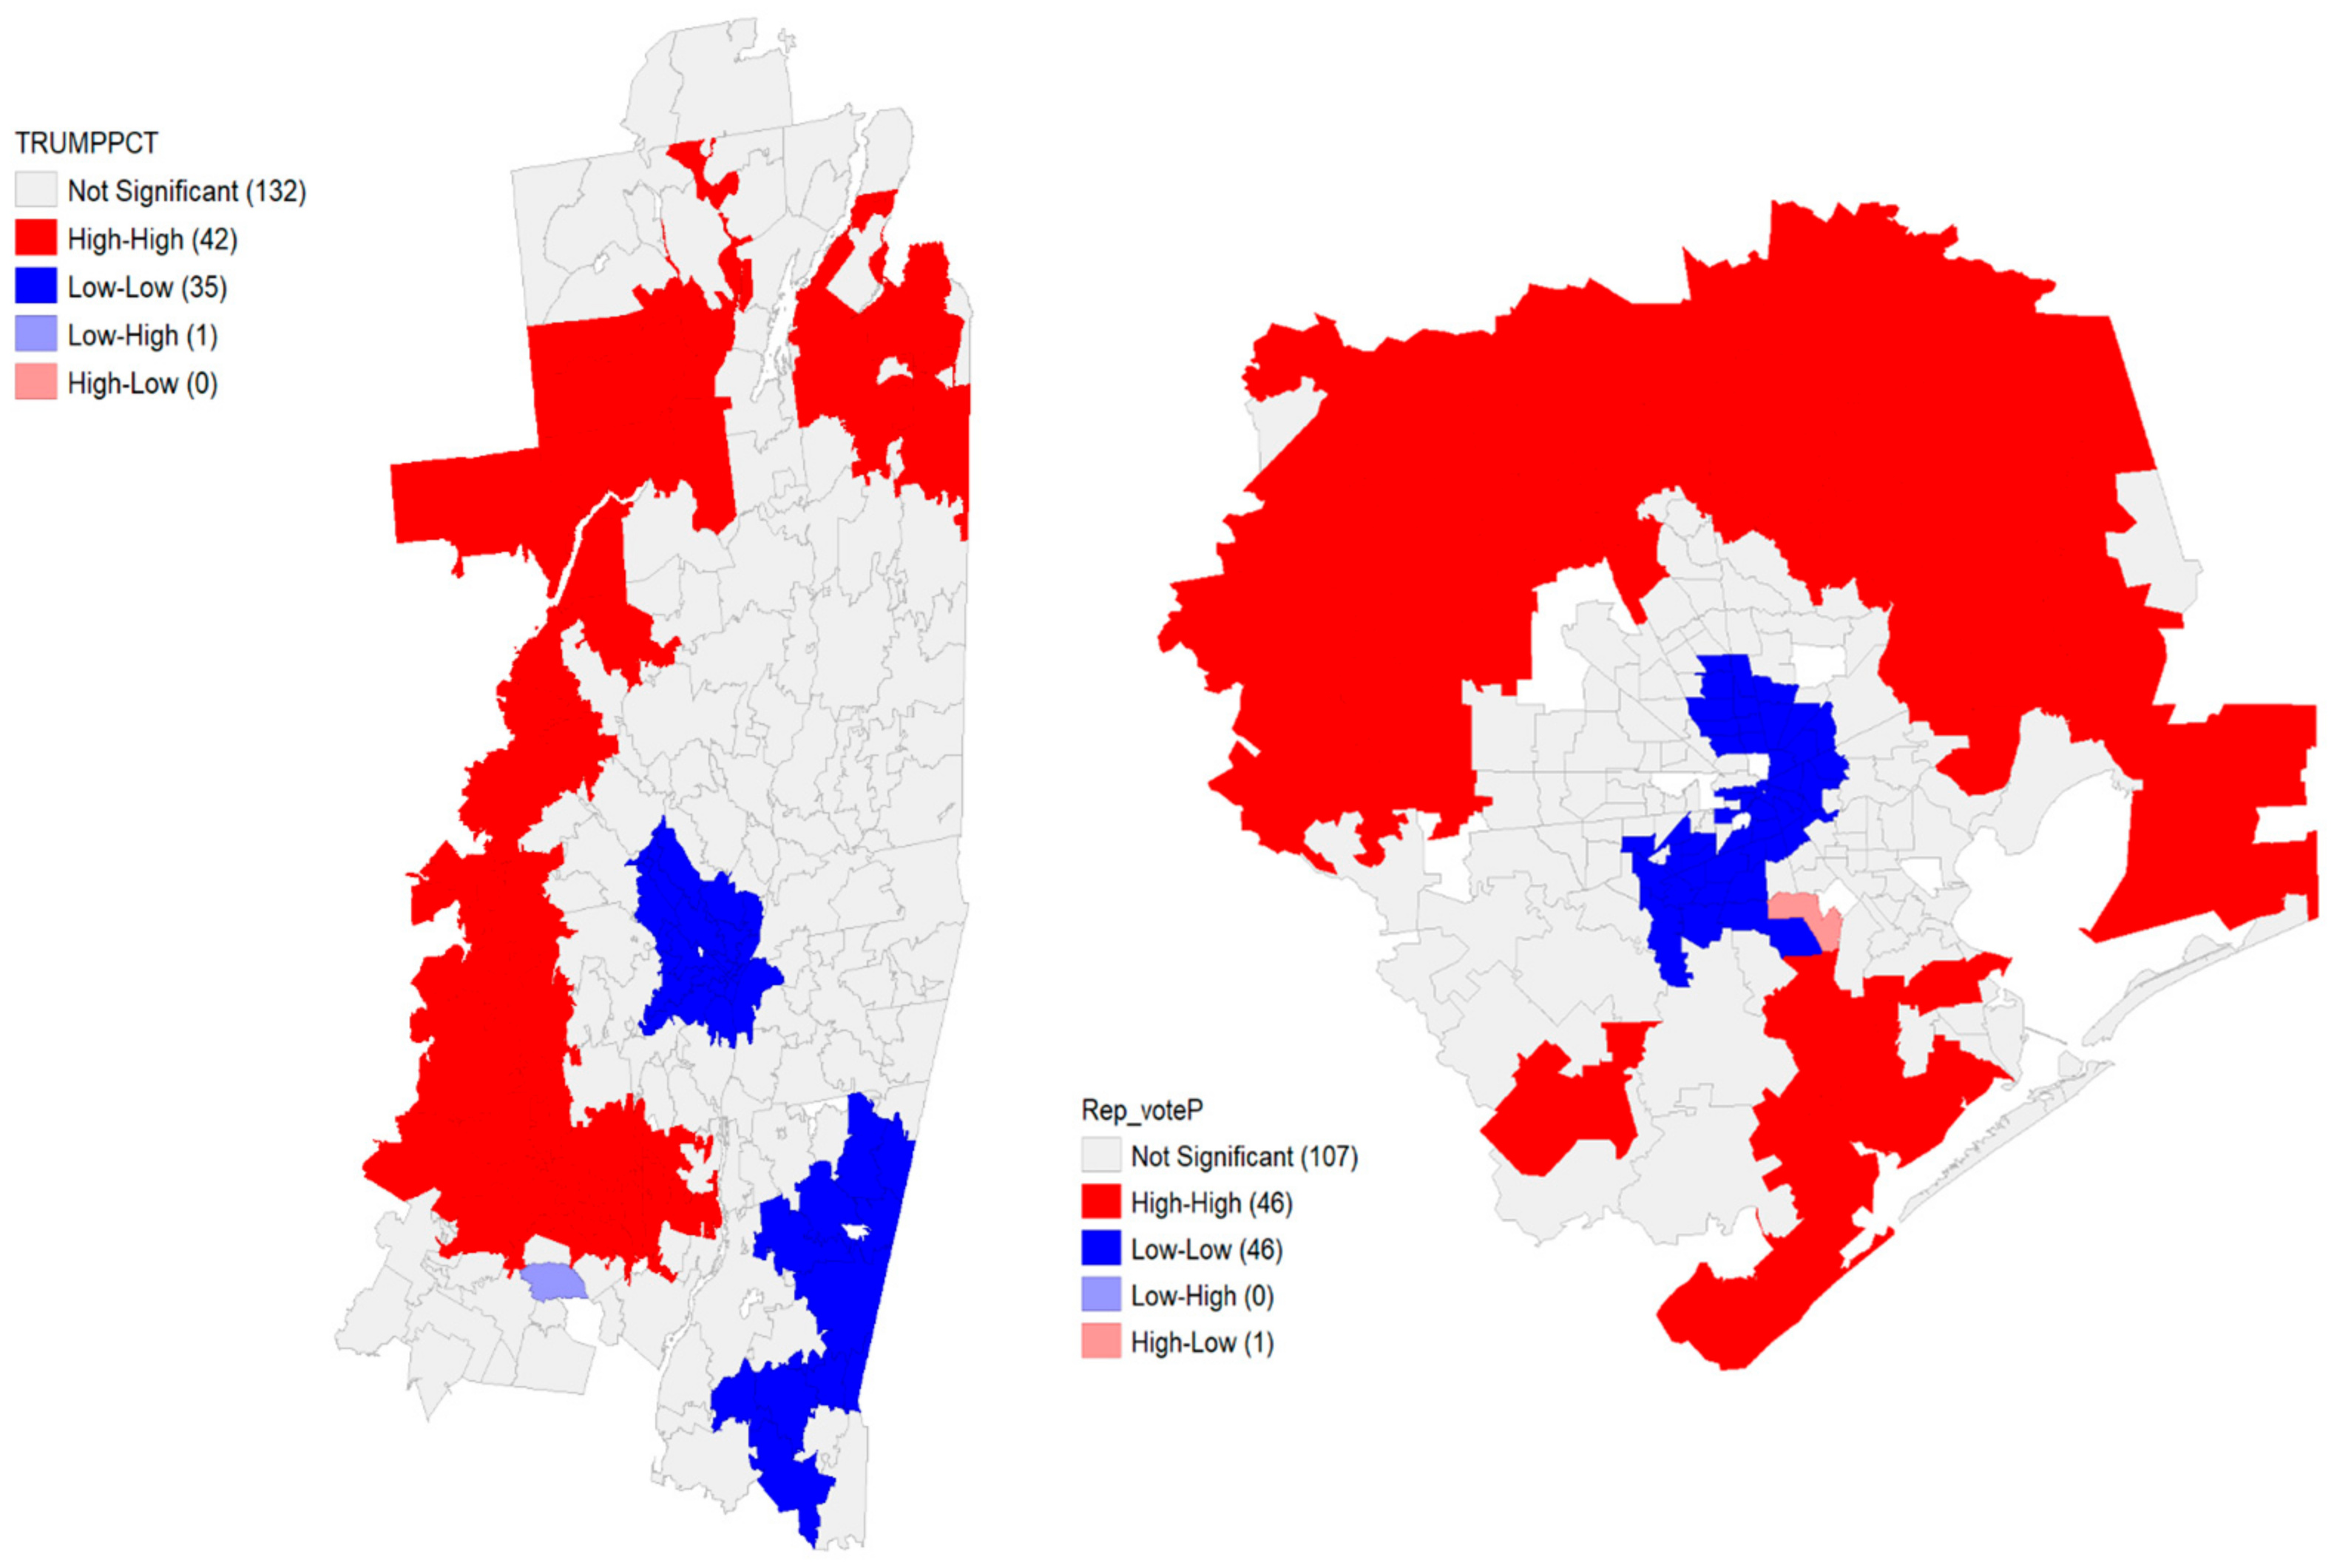
3.2. Disparities within Each Region

The average vaccination rates of both regions were similar, but local disparities were also very distinctive. We further used Local Moran’s I on the vaccination rates to associate this with other variables. As Figure 3 shows, in the Houston metropolitan area, high–high clusters (high Rep. voting areas adjacent to high Rep. voting areas) were concentrated in the ZIP codes in the Houston city limits, being especially prominent in the west side of the city. These areas correspond to places that typically have high proportions of Democratic voters, as well as ZIP codes with residents that are relatively wealthy and well-educated. Low–low clusters (low Rep. voting areas adjacent to low Rep. voting areas) tended to be located on the periphery of the metropolitan area, corresponding to areas that have a low population density, as well as ZIP codes that vote overwhelmingly Republican and have relatively lower education levels and incomes. In the Capital Region, these same relationships were apparent as well, but seemingly to a much smaller degree. Areas with high–high clusters tended to be concentrated in the relatively more affluent and higher-educated ZIP codes, but there was a weaker relationship with these variables. Race did seem to be more of a factor in the Capital Region, where minority-dominated areas tended to have lower vaccination rates. Low–low clusters seemed to be concentrated in suburban and rural areas with higher proportions of racial minorities.
Overall, Houston has a much more racially and ethnically diverse population, which slightly complicates the analysis. However, in both areas, racial segregation is unfortunately still quite noticeable, which does allow for analysis of areas that have high proportions of racial minorities, because they tend to be concentrated. In general, the rural and suburban areas tended to have lower vaccination rates in both study regions, and those areas generally had relatively lower education levels and lower incomes as compared to the urban areas.

3.3. Correlation among Factors
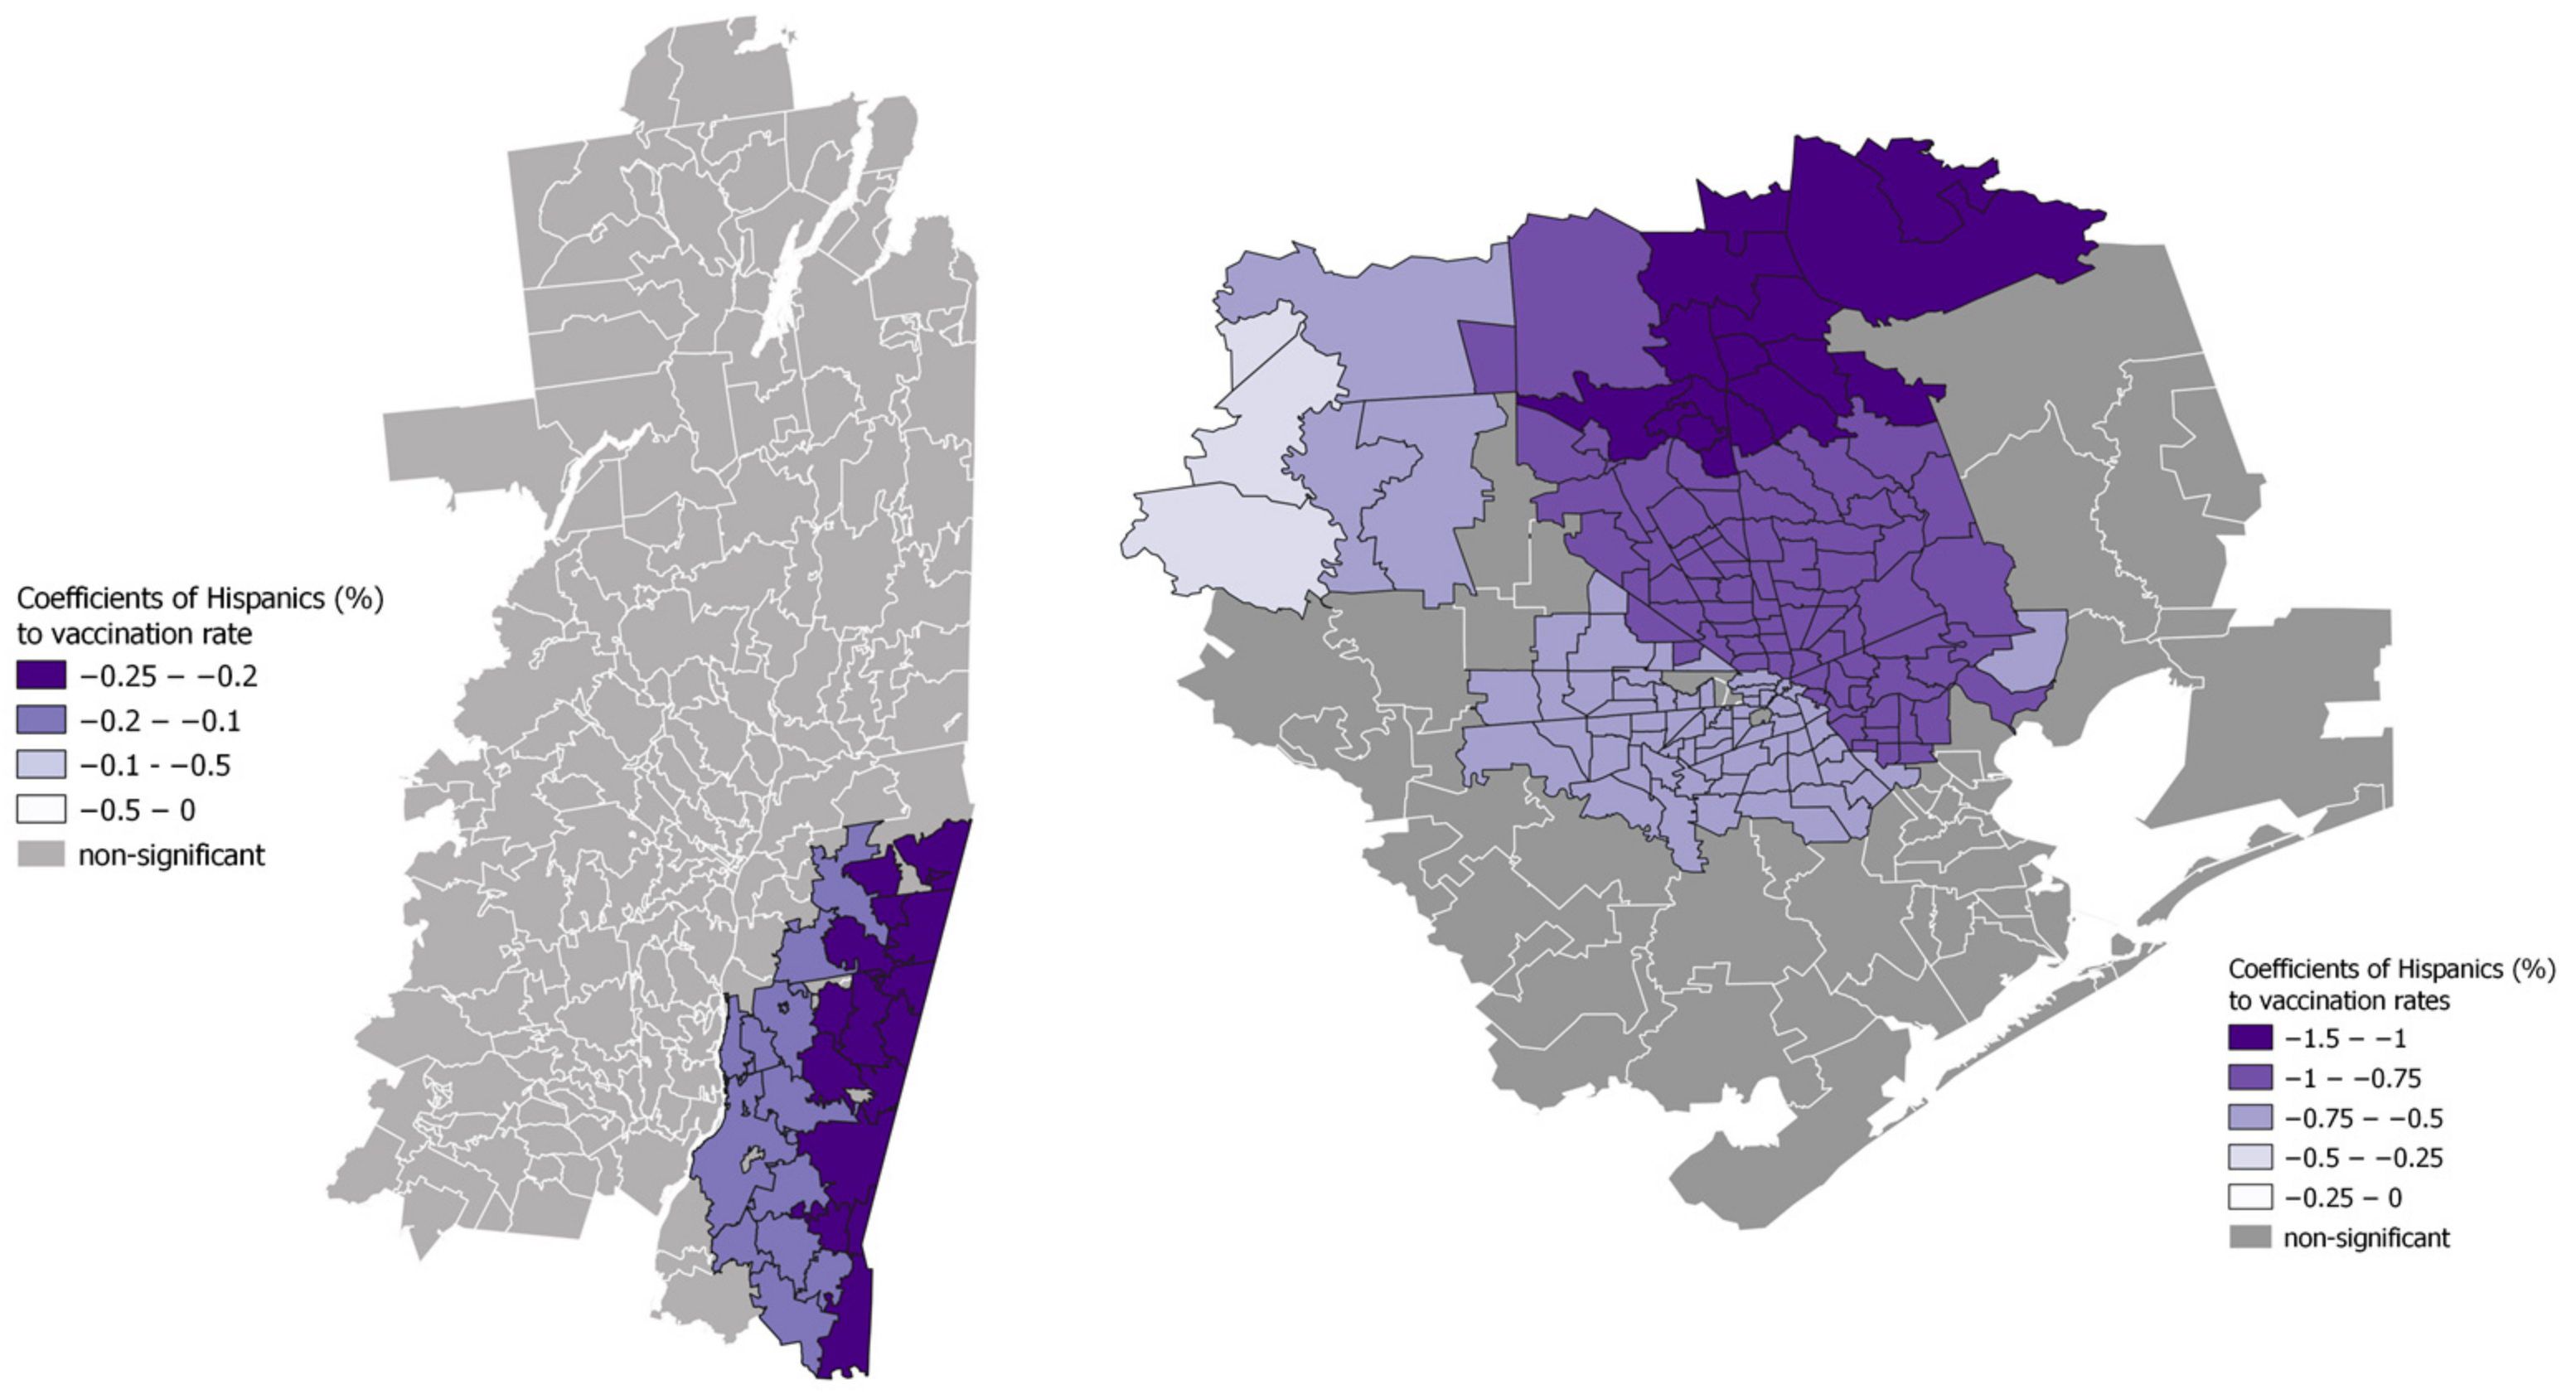
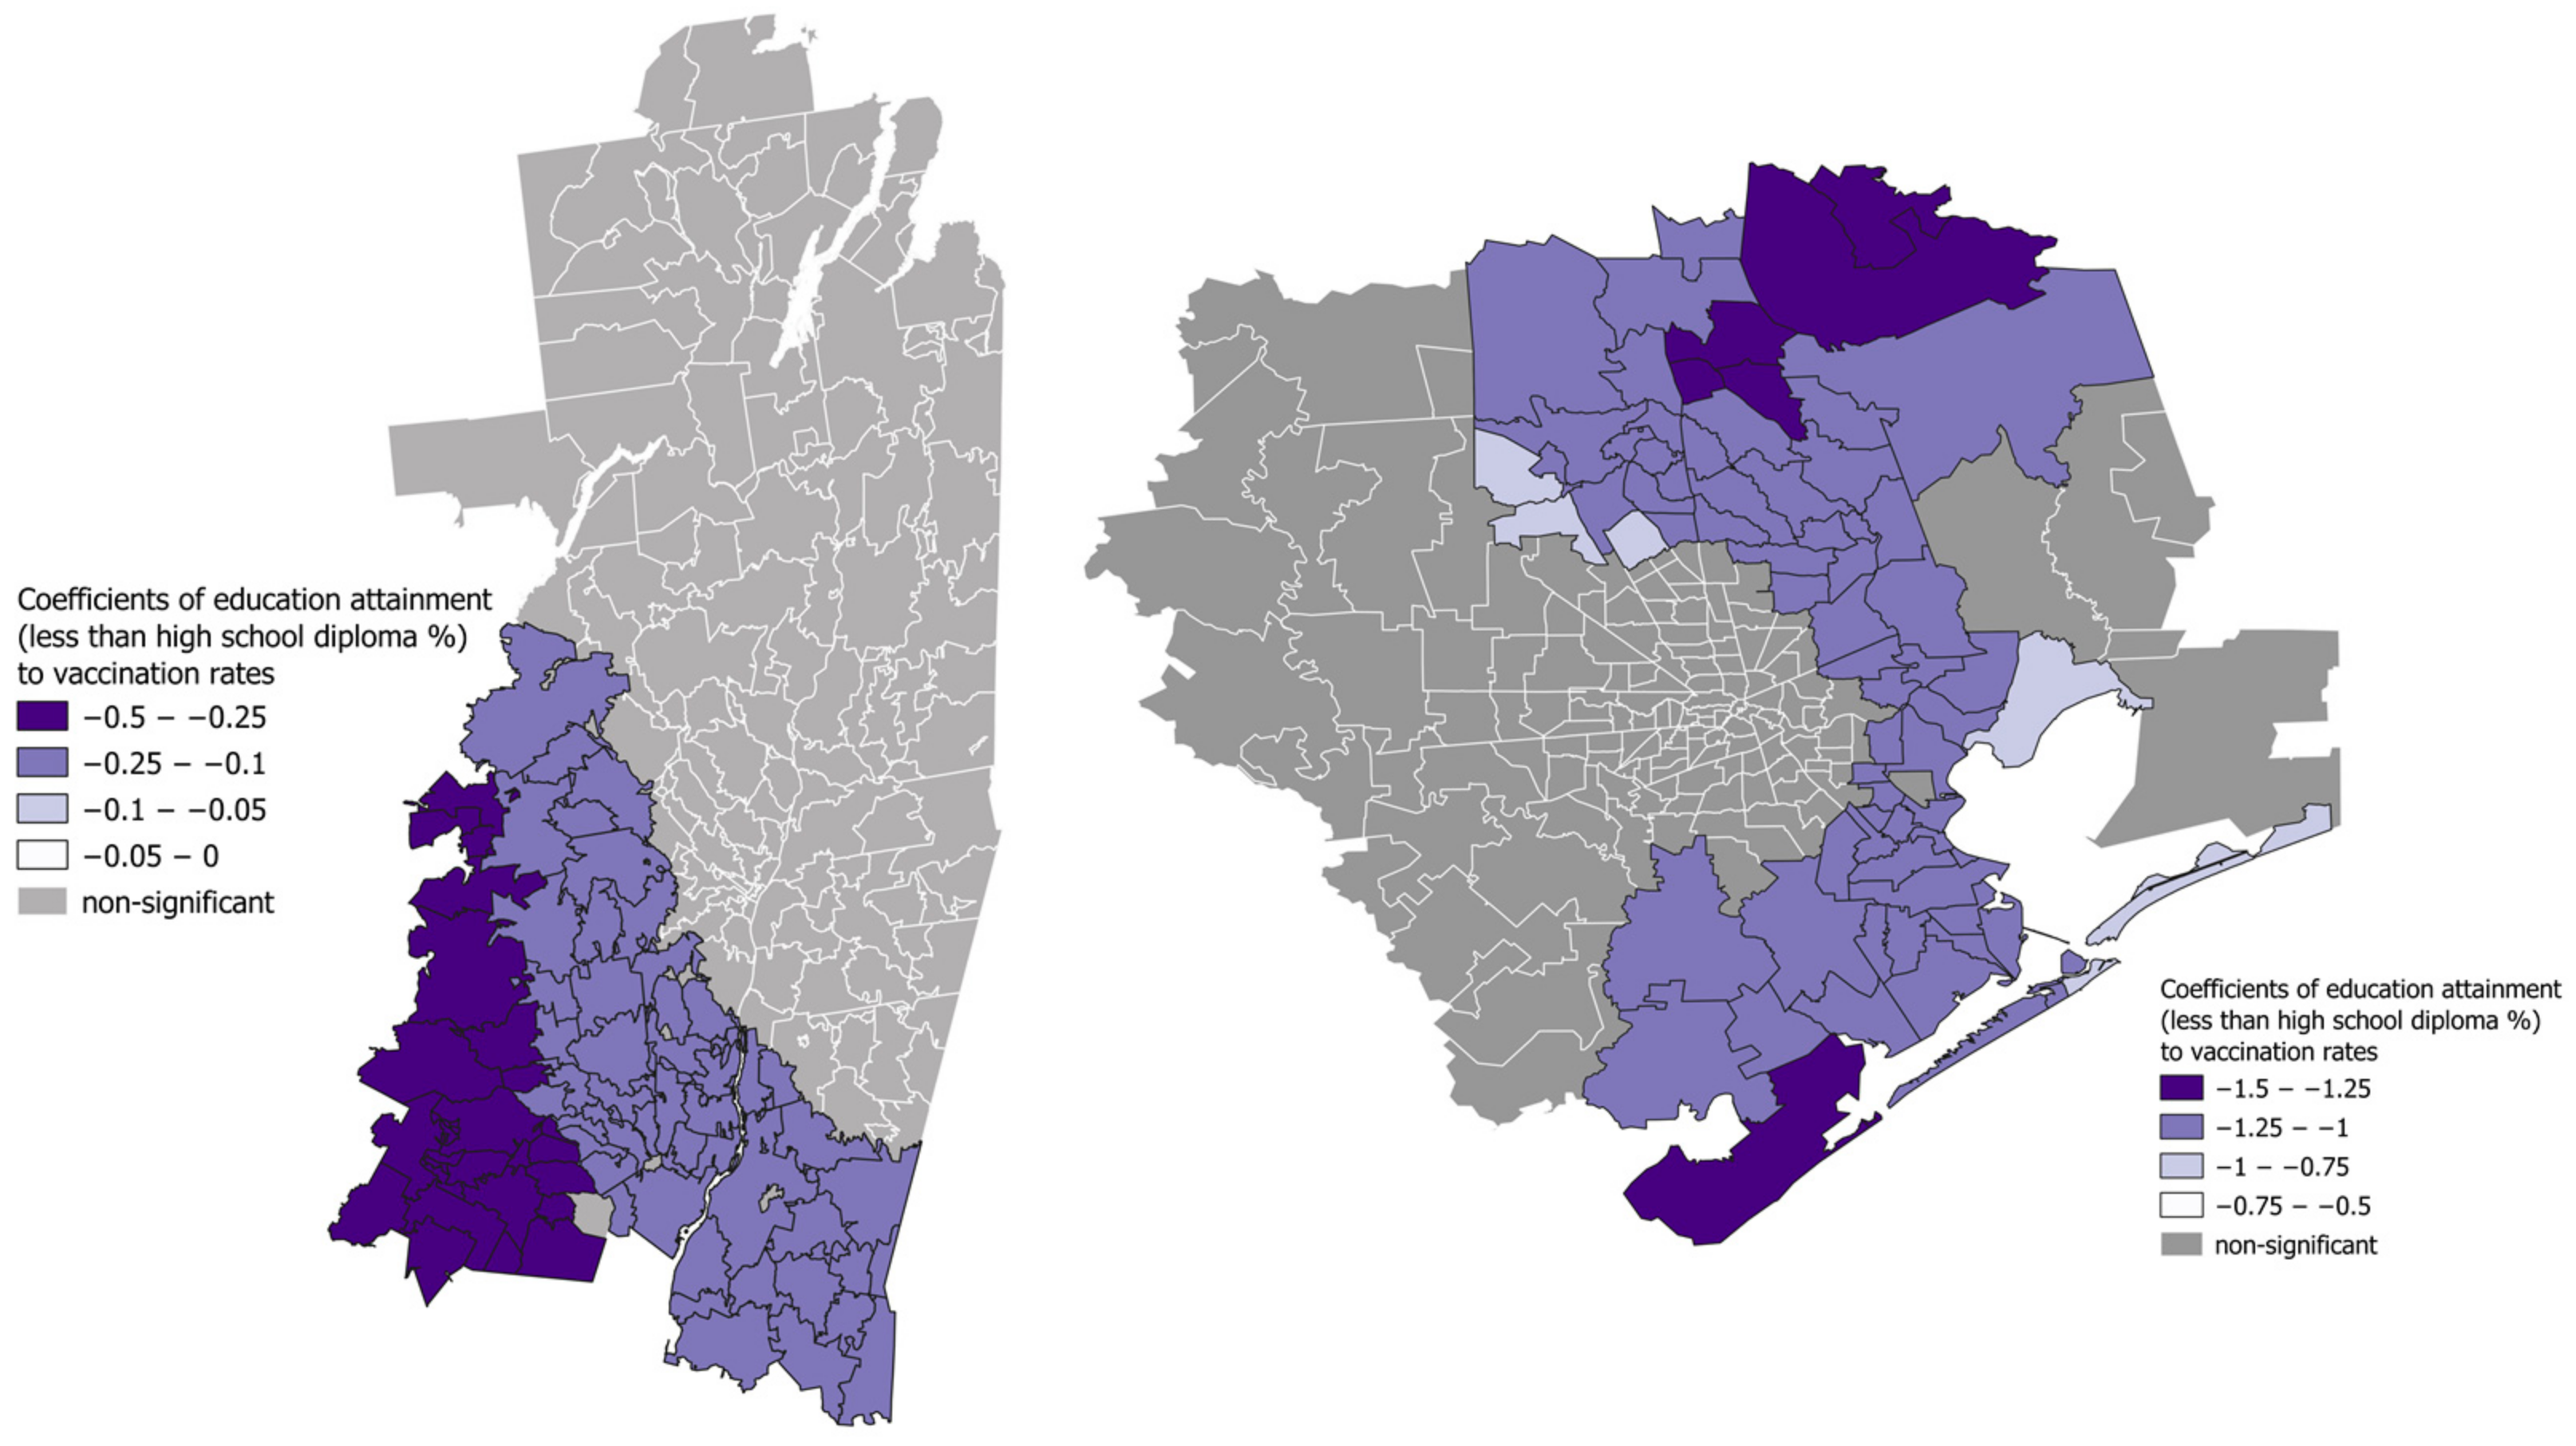
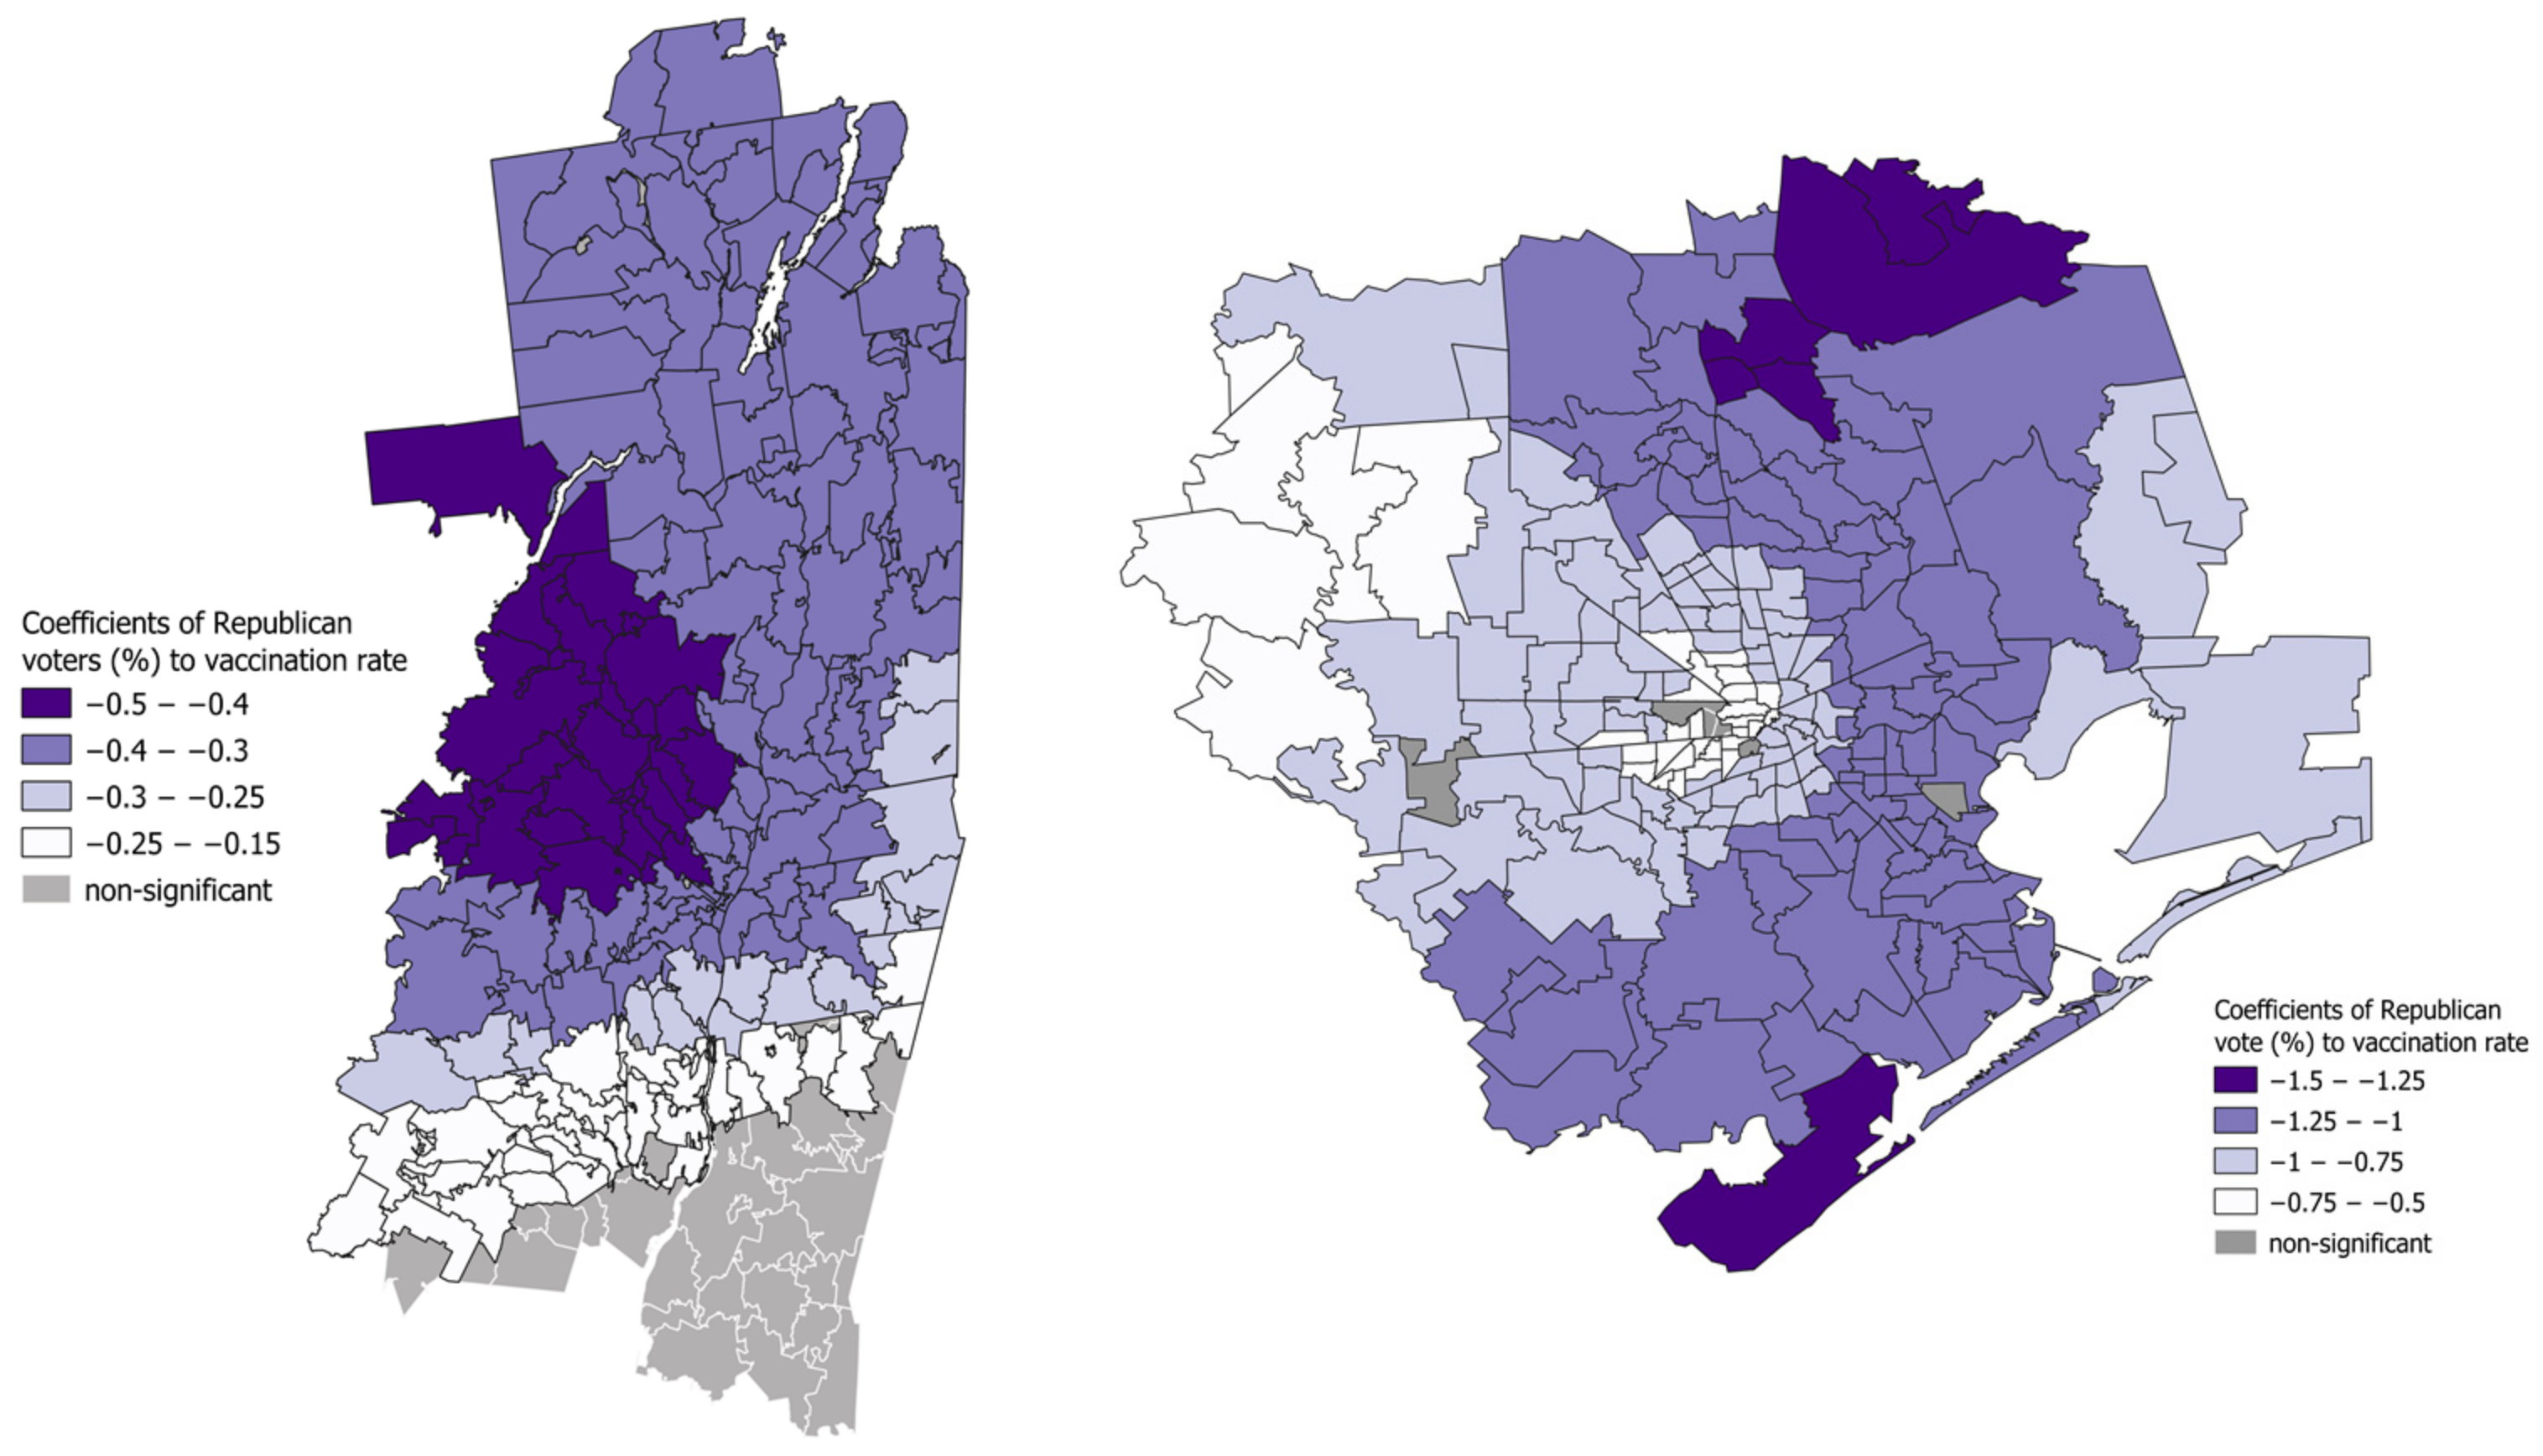
Pearson’s correlation indicated a strong correlation between the vaccination rate and other factors, such as education, ethnicity, socioeconomic status, internet accessibility, and political identity (Table 2). For Houston, Pearson’s correlation revealed that Hispanic ethnicity has a significant negative correlation with access to the internet and computers and a relatively high correlation with a lack of a high school diploma. This could explain their vaccine hesitancy and support our hypothesis. Unemployment, poverty, and Republican political affiliation negatively and considerably influenced rates of vaccine acceptance. Conversely, populations with college degrees and Asian populations had much stronger vaccine acceptance. For Albany, college attendance was considered a main factor for vaccine acceptance, while other factors—in particular poverty, high school attendance, access to the internet, right-wing partisanship, and Hispanic ethnicity—were negatively correlated with the vaccination rate, which likely means that these populations are more hesitant regarding vaccination.
We can confidently assert that vaccination rate is highly influenced by the education level for both cities; people with only a high school diploma or no high school diploma were more hesitant than those with a bachelor’s degree. It is also important to highlight the importance of internet accessibility in encouraging willingness to vaccinate; this remains an important factor for both regions but was more prominent in Houston. Ethnicity and socioeconomic status were also considered major factors for vaccine hesitancy; Hispanic, poor, and unemployed residents were more hesitant than other communities. Finally, the statistics support the hypothesis regarding the influence of political partisanship, showing that Republican voters were more hesitant than Democrats or Independents, although this remains a less prominent factor than others.

3.4. Regression

The factors significantly correlated with vaccination rate formed the basis for the selection of factors in regression. In addition to the significant correlation between the vaccination rate and the other factors, many factors were also significantly correlated. In particular, two related factors regarding educational attainment, having less than a high school diploma and a bachelor’s degree or above, were significantly correlated in both the Capital Region (r = −0.478, p < 0.001) and Houston Metro (r = −0.734, p < 0.001). Another pair of related factors were no internet access and no computer access, which were also significantly correlated in both the Capital Region (r = 0.674, p < 0.001) and Houston Metro (r = −0.185, p = 0.008). Since these factors are very similar to each other in terms of outcome, this study chose one out of each set of two to analyze using regression. The factors used in regression were Black, Asian, and Hispanic ethnicity, unemployment, poverty, no internet access, less than a high school diploma, and votes for Trump to represent the racial, socioeconomic, technical, and political divides. The vaccination rate in both regions was the dependent variable used for regression.
Both the global regression using the Gaussian model and local regression using GWR were carried out with the selected dependent variable and factors, which were based on promising results from previous studies. One reason for using the Gaussian over the Poisson model is that the measures used in this study were all rates. The other reason is that there is no widely accepted method for choosing bandwidth for local GWR, which determines the size of local neighborhoods and their weights [39]. Therefore, this study employed both global (Gaussian) and local (GWR) regression to approach a more comprehensive understanding. Table 3 shows the model summaries of both regions. The Gaussian model was able to explain about 16% of the deviance in vaccination rates in the Capital Region and over 66% of the deviance in Houston. The effectiveness of GWR was higher than that of the Gaussian model in both regions, with about 27% of deviance explained in the Capital Region and 77% in the Houston Metro.
Based on the Gaussian model (Table 4), we determined several factors affecting vaccination rates in both regions. In particular, Hispanic ethnicity was a significant factor in both regions. The vaccine rate decreased in regions with a higher Hispanic population. For example, with a 1% increase in the Hispanic population, the vaccination rate decreased by 0.16 in the Capital Region and 0.282 in Houston. Similarly, low educational attainment (less than a high school diploma) and voting for the Republican candidate both had negative impacts on vaccine rates. In the Capital Region, with a one-unit increase in the population with less than a high school diploma, the vaccination rate dropped by 0.16 in the Capital Region and 0.40 in the Houston Metro. Likewise, with a one-unit increase in voters for the Republican candidate in 2020, the vaccination rate dropped by 0.19 in the Capital Region and 0.99 in Houston. These correlations show that racial, socioeconomic, and political factors have very influential impacts on the vaccination rate.
In addition to the shared factors, there were specific factors which had an impact on the vaccination rate in specific regions. In the Capital Region, poverty had a significant impact on the vaccination rate. With a one-unit increase in the population under the federal poverty line, the rate of vaccination dropped by 0.20. In the Houston Metro, two specific factors, both of which are related to race, had significant impacts: the Black population and the Asian population. With a one-unit increase in the Black population in this region, the vaccination rate dropped by 0.67. In contrast, with a one-unit increase in the Asian population in the Houston Metro, the vaccination rate increased by 0.14.
On the global scale of the entire area, Gaussian regression revealed the disparities in vaccination rates caused by various factors. On the local scale, GWR further revealed the spatial disparities shaped by specific factors. Regarding factors that had significant impacts in both regions, the resulting spatial disparities within each region were quite extreme.
The first noticeable local disparity is that regarding the Hispanic population. As shown in Figure 4, in the Capital Region, the neighborhoods where the Hispanic population was a significant negative factor for the vaccination rate are located in the Columbia and Rensselaer counties, at the southeastern corner of the capital region. In Houston, the neighborhoods with sizeable Hispanic populations displayed a significant drop in vaccination rates, primarily those located in southeast and east Houston, and notably, in rural areas far north of the city in Montgomery County.
Educational attainment was another significant factor resulting in extreme disparities in each region. In particular, for populations with an educational attainment of lower than a high school diploma, particular neighborhoods showed significantly lower vaccination rates within each region. In the Capital Region, having populations with low educational attainment concentrated in some neighborhoods within Columbia, Greene, and Albany counties correlated with low vaccination rates (Figure 5). In Houston, the neighborhoods were scattered among the eastern and northern suburbs of the city, with the highest correlations occurring in rural areas to the far north and far south of the city in the Montgomery and Brazoria counties, respectively. Thus, rural neighborhoods with low educational attainment seemed to display the highest correlation with low vaccination rates in both regions.
In addition, neighborhoods where there were significant numbers of voters for the Republican presidential candidate in 2020 also correlated with a significant negative impact on vaccination rates in both regions at the local level (Figure 6). However, these neighborhoods had a different spatial distribution, as they were more widespread in each region than the extreme clusters resulting from other factors. Interestingly, for the Capital Region, the neighborhoods where voting for the Republican candidate had the highest impact were areas in Albany County, where the socioeconomic levels were also among the highest in the region. There was a very distinctive contrast in this region as the neighborhoods where voters for the Republican presidential candidate did not have an impact were also the areas where a significant Hispanic population had a significantly negative impact on vaccination rates. This implies that the factors affecting vaccination rates in these neighborhoods could be related to difficulty in accessing technology and information, rather than perhaps the more obvious factor of political affiliation. In Houston, the neighborhoods with the highest impact of voters for the Republican presidential candidate in 2020 were in the suburban areas in the north and south. Except in the city center where the impact of Republican voters was not high, almost all areas in Houston Metro were impacted by this factor negatively, so much so that we can assert that where there were more votes for the Republican candidate, there was a correspondingly lower vaccination rate. Like in the Capital Region, there is a socioeconomic correlation in Houston as well. For example, in one of the wealthiest areas in the city to the west of the city center (Montrose, University Place, River Oaks) there is a corresponding drop in vaccine hesitancy, with some of the lowest coefficients in the entire Metro Area.

4. Discussions

In our study, we consider several factors that could be significant reasons for why people in New York and Texas are hesitant to receive a COVID-19 vaccine. We see significant correlations with our chosen variables, suggesting they may also be reasons why people in our study area are hesitant to receive the vaccine. Following the order in which our factors were introduced, we further discuss their impact on vaccination rates and vaccine hesitancy.

4.1. Racial Divides

Racial factors were found to be significant in both regions. The most prominent racial factor is the presence of sizeable Hispanic populations in some areas in both regions. In the Capital Region, only the Hispanic population variable shows a significant impact on vaccination rates, implying areas with a higher percentage of Hispanic residents had lower vaccination rates. These areas, however, show no significant impact from votes for the Republican presidential candidate. This is likely an indication that Hispanic residents in these areas were affected by structural barriers such as technology, language, or transportation that impacted their ability to schedule or receive the vaccine, instead of political identification, which is more negatively associated with vaccination rates. In addition to Hispanic populations, Black and Asian populations had significant impacts on vaccination rates in the Houston Metro. Notably, the Asian population had the opposite impact as compared to the other two racial/ethnic factors. In areas where a larger Asian population resided, the vaccination rates were relatively higher. In contrast, in areas where larger Black and Hispanic populations resided, the vaccination rates were comparatively lower. This is perhaps because of East Asian communities having possibly been more aware of the situation due to its initial occurrence in China and other cultural factors. As a result, with the introduction of COVID-19 vaccines, Asian communities may have also been more likely to receive the vaccine in the early stages relative to other racial groups. For the Black and Hispanic populations in Texas, other related factors were access to technology and information, as well as political identification, which we address in the corresponding sections below.

4.2. Socioeconomic Divides

We selected two related factors, poverty and educational attainment, to represent the socioeconomic status of residents. Results from regression show that poverty had a significant impact in the Capital Region but not in the Houston Metro. In particular, areas with higher poverty rates had lower vaccination rates in the Capital Region. This factor could be related to the difficulty of accessing technology or transportation facilitating vaccination, especially in rural areas. The poverty factor, however, may be less likely to be associated with political identification. Future studies should address more detailed factors to reveal their specific impact on vaccination acceptance. The other factor of educational attainment, in particular populations with less than a high school diploma, had a significant impact in both regions. Since the 2016 presidential election, many studies have investigated the voting base of the 2016 and 2020 Republican presidential candidate. For example, based on the 2016 presidential election results, Cook and colleagues [40] suggested that the most devoted supporters of former-president Trump were also much more likely to only have had a high school degree or less. The results from this study further support the finding that for populations with less than a high school diploma, there is a strong correlation with more votes for the 2020 Republican candidate, which in turn is linked to the lower vaccination rates.

4.3. Digital Divides

Computer and internet access have been identified as having a measurable effect on whether individuals choose to vaccinate or can get a vaccine. This is due to two important reasons, among others: (1) the internet provides information about the vaccine itself and (2) online scheduling is the primary method by which individuals make an appointment to receive the vaccine. The data also show that those who are more likely to lack adequate technological access—due to lacking high-speed internet, reliable mobile data connections, or access to a computer—are also more likely to be on the lower end of the economic spectrum, to live in a rural community, to be elderly, to be a member of a racial minority group, or to be some combination of those. Lacking a personal vehicle or being far away from a vaccination site might be a simple geographic explanation for why some choose or are unable to get vaccinated. Other more complex, socioeconomic reasons are more difficult to pin down because they are intertwined and informed by both personal realities and long-standing structural inequalities. Nevertheless, it is important to address those other factors to better understand the spatial variability of vaccination rates.
In the Houston area, we see that clusters of high vaccination rates are concentrated in the west of the city and in the exclaves of Kingwood and The Woodlands in the north of the city. Clusters of low vaccination rates are located on the periphery of the Houston metropolitan area, in the far northeast and far south. Geographically, this would seem to represent an urban–rural divide. Areas where there are high vaccination rates are generally where most of the population lives; these areas tend to have good digital infrastructure and numerous vaccination sites. Moreover, the highest vaccination rates seem to be concentrated in the relatively affluent areas. By contrast, the lowest vaccination rates are generally found in sparsely populated areas that align relatively well with areas that have high proportions of residents without access to a computer or reliable internet. Indeed, several clusters of low vaccination rates are also found in the areas east of the center of the city, with some of the highest poverty rates (which tracks closely with areas with high proportions of residents lacking computers).
As the Anderson and Ray-Warren article [14] found, there is a relative dearth of vaccination sites and healthcare facilities in neighborhoods with high proportions of Black and Latino residents in Texan cities. Additionally, residential segregation seems highly prevalent in the Houston area. Our results indicate that a lack of computer and/or internet access is highly correlated with being below the poverty line, and indeed, several clusters of populations with low vaccination rates were centered in these areas that lack digital resources. This potentially indicates that there is a link between digital resources and whether an individual chooses to or is able to get a vaccine. Although Goel and Nelson [24] found that there is a significant correlation between information gleaned from the internet and vaccination rates (which is confirmed by our results), they also found that there was no correlation found between spatial variability of digital resources and vaccination rates. Our results would seem to contradict these findings. It is likely that their broader focus on the entire country and state-based analysis was not small-scale enough to account for the distribution of digital resources. There are clearly neighborhood-scale differences between vaccination rates and digital access, and although we think that the digital divide is not the primary explanatory variable here, it is certainly one of them, and it is a good indicator of the heterogeneity of both economic and healthcare resources.

4.4. Political Divides

In the framework of this study, statistical methods were conducted to point out the impact of political behavior on vaccine acceptance using mainly descriptive statistics, geographically weighted regression (GWR), and correlation indices. The results of this study show that, indeed, people voting for Republican candidates are more hesitant to accept the COVID-19 vaccine. This could be due to many reasons. One of them might be the fact that right-wing media were not sincerely encouraging vaccination as some previous studies suggested. They were rather trying to spread misinformation that promoted fear regarding the vaccination and a lack of confidence towards responsible entities. Other reasons could be related to an individual’s political beliefs. However, based on correlation results, the interdependence between vaccine hesitancy and political partisanship is more significant in Texas than New York. In a previous study investigating the voter base for the same Republican candidate in 2016, the voting base was more associated with lower levels of educational attainment (more likely to not have a college degree), higher annual income levels (above USD 100,000), and an older average age (above 65). By contrast, populations with higher levels of educational attainment (more likely to have a post-graduate degree), lower annual incomes (below 50,000), and a younger average age (below 30) favored the Republican candidate the least [40]. Supported by the findings in our study, it is then perhaps not surprising that low educational attainment (less than high school) and voting for the Republican candidate both contribute negatively to vaccination rates.

5. Conclusions

Acceptance of the COVID-19 vaccine remains a heated topic among researchers, as various factors influence individual health decisions. Different from most studies, which use survey methods to collect individuals’ likelihoods of accepting COVID-19 vaccination, this study utilizes actual vaccination data, the American Community Survey, and 2020 presidential election results to investigate various factors’ impact on vaccination rates. This factor is then associated with population characteristics including race and ethnicity, poverty, educational attainment, and access to the internet using regression models to assess their roles in actual acceptance of the COVID-19 vaccine based on contemporaneous vaccination rates. This study used geographically weighted regression (GWR) as the main approach to associate the actual vaccination rates with the identified factors. GWR is local model that may result in overfitting because it uses coefficients based on smaller divisions within a study area. The results may have amplified and reflected noise in the dataset [41]. As there is no widely accepted method of choosing the ideal bandwidth, which is determined based on the data itself instead, the use of GWR should be supplemented with additional analyses, such as other global regression models, to gain a better understanding of the area instead of local neighborhoods.
This study selected the Capital Region in New York and the Houston Metro in Texas as comparable regions to investigate the roles of identified factors in vaccination rates. Results show that political identification as Republican voters, low educational attainment (less than high school), and identification as non-White Hispanic all had negative impacts on vaccination rates in both regions. Since the two regions are areas where vaccination rates and voting for specific political parties are very similar and not too different from the national average, the results could show a similar trend in other regions as well as at the national level. In addition, this study can be applied to other countries or regions where a political divide or polarization forms to investigate how this factor influences vaccine acceptance together with other racial and socioeconomic factors.
This study shows the nuance of differences between regions, which calls for detailed analysis when investigating other areas, as this nuance might shed light on more underlying factors that contribute to acceptance of COVID-19 vaccines. Specifically in poverty-stricken areas, access to technology, information, and transportation may be limited for residents, restricting their ability to schedule and receive vaccines. In areas where voters are more likely to be Republican, political identity seems to be more decisive for individuals in choosing to get a vaccine. It is necessary to carry out additional research to understand the intervening roles of many individual and social characteristics that affect vaccine acceptance. For example, would greater access to health facilities in impoverished areas have led to less polarization towards COVID-19 vaccines during this pandemic and thus less segregation of health outcomes among populations? Can the same conclusion be generated when applying the methods to other U.S. regions or different countries? With the availability of vaccines, has the acceptance of the COVID-19 vaccine changed from a spatiotemporal perspective over time?
Like many other studies, this study addresses the acceptance of the COVID-19 vaccine. Given this is a very new topic, findings from studies on this pandemic can be implied in further public health research. Disease experts point out that there is likely to be more frequent and serve disease outbreaks in the future [42]. Understanding how different factors affect individual decisions about vaccination in specific areas can help officials to develop tailored approaches towards vaccine information distribution and education. In addition, further research on acceptance of the COVID-19 vaccine could investigate if acceptance or hesitation towards new vaccines is associated with prolonged disease outbreaks or economic implications.

Author Contributions

Conceptualization, Rui Li, Daniel Erickson; methodology, Rui Li, Daniel Erickson; formal analysis, Rui Li, Daniel Erickson, Mareyam Belcaid, Madu Franklin Chinedu, Oluwabukola Olufunke Akanbi; investigation, Rui Li, Daniel Erickson; data curation, Rui Li, Daniel Erickson, Mareyam Belcaid, Madu Franklin Chinedu, Oluwabukola Olufunke Akanbi; writing—original draft preparation, Rui Li, Daniel Erickson, Mareyam Belcaid, Madu Franklin Chinedu, Oluwabukola Olufunke Akanbi; writing—review and editing, Rui Li, Daniel Erickson; visualization, Rui Li, Daniel Erickson; supervision, Rui Li; project administration, Rui Li. All authors have read and agreed to the published version of the manuscript.

Funding

This research received no external funding.

Data Availability Statement

All data used in this manuscript are publicly available. Corresponding access to data sources is provided in references.

Conflicts of Interest

The authors declare no conflict of interest.

References

  1. US Coronavirus Vaccine Tracker. Available online: https://usafacts.org/visualizations/covid-vaccine-tracker-states/ (accessed on 6 July 2022).
  2. Galarce, E.M.; Minsky, S.; Viswanath, K. Socioeconomic Status, Demographics, Beliefs and A (H1N1) Vaccine Uptake in the United States. Vaccine 2011, 29, 5284–5289. [Google Scholar] [CrossRef] [PubMed]
  3. Timmermans, D.R.; Henneman, L.; Hirasing, R.A.; Van der Wal, G. Attitudes and Risk Perception of Parents of Different Ethnic Backgrounds Regarding Meningococcal C Vaccination. Vaccine 2005, 23, 3329–3335. [Google Scholar] [CrossRef] [PubMed]
  4. Brumfiel, G. Vaccine Refusal May Put Herd Immunity At Risk, Researchers Warn. NPR 2021, 7. [Google Scholar]
  5. Troiano, G.; Nardi, A. Vaccine Hesitancy in the Era of COVID-19. Public Health 2021, 194, 245–251. [Google Scholar] [CrossRef]
  6. Lupton, R.N.; Hare, C. Conservatives Are More Likely to Believe That Vaccines Cause Autism. The Washington Post, 2015. Available online: https://www.washingtonpost.com/news/monkey-cage/wp/2015/03/01/conservatives-are-more-likely-to-believe-that-vaccines-cause-autism/(accessed on 8 January 2023).
  7. Hornsey, M.J.; Finlayson, M.; Chatwood, G.; Begeny, C.T. Donald Trump and Vaccination: The Effect of Political Identity, Conspiracist Ideation and Presidential Tweets on Vaccine Hesitancy. J. Exp. Soc. Psychol. 2020, 88, 103947. [Google Scholar] [CrossRef]
  8. Njoku, A.; Joseph, M.; Felix, R. Changing the Narrative: Structural Barriers and Racial and Ethnic Inequities in COVID-19 Vaccination. Int. J. Environ. Res. Public Health 2021, 18, 9904. [Google Scholar] [CrossRef]
  9. Yancy, C.W. COVID-19 and African Americans. JAMA 2020, 323, 1891–1892. [Google Scholar] [CrossRef] [Green Version]
  10. CDC. COVID-19 Hospitalization and Death by Race/Ethnicity. Available online: https://stacks.cdc.gov/view/cdc/91857 (accessed on 29 December 2021).
  11. Callaghan, T.; Moghtaderi, A.; Lueck, J.A.; Hotez, P.; Strych, U.; Dor, A.; Fowler, E.F.; Motta, M. Correlates and Disparities of Intention to Vaccinate against COVID-19. Soc. Sci. Med. 2021, 272, 113638. [Google Scholar] [CrossRef]
  12. Hamel, L.; Kirzinger, A.; Lopes, L.; Sparks, G.; Brodie, M. KFF COVID-19 Vaccine Monitor: January 2021. KFF, 2021. Available online: https://www.kff.org/coronavirus-covid-19/report/kff-covid-19-vaccine-monitor-january-2021/(accessed on 8 January 2023).
  13. Malik, A.A.; McFadden, S.M.; Elharake, J.; Omer, S.B. Determinants of COVID-19 Vaccine Acceptance in the US. eClinicalMedicine 2020, 26, 100495. [Google Scholar] [CrossRef]
  14. Anderson, K.F.; Ray-Warren, D. Racial-Ethnic Residential Clustering and Early COVID-19 Vaccine Allocations in Five Urban Texas Counties. J. Health Soc. Behav. 2022, 63, 472–490. [Google Scholar] [CrossRef]
  15. Börjesson, M.; Enander, A. Perceptions and Sociodemographic Factors Influencing Vaccination Uptake and Precautionary Behaviours in Response to the A/H1N1 Influenza in Sweden. Scand. J. Public Health 2014, 42, 215–222. [Google Scholar] [CrossRef]
  16. Hilyard, K.M.; Freimuth, V.S.; Musa, D.; Kumar, S.; Quinn, S.C. The Vagaries of Public Support for Government Actions in Case of a Pandemic. Health Aff. 2010, 29, 2294–2301. [Google Scholar] [CrossRef]
  17. Myers, L.B.; Goodwin, R. Determinants of Adults’ Intention to Vaccinate against Pandemic Swine Flu. BMC Public Health 2011, 11, 15. [Google Scholar] [CrossRef] [Green Version]
  18. Hilton, S.; Smith, E. Public Views of the UK Media and Government Reaction to the 2009 Swine Flu Pandemic. BMC Public Health 2010, 10, 697. [Google Scholar] [CrossRef] [Green Version]
  19. Majid, U.; Ahmad, M. The Factors That Promote Vaccine Hesitancy, Rejection, or Delay in Parents. Qual. Health Res. 2020, 30, 1762–1776. [Google Scholar] [CrossRef]
  20. Press, V.G.; Huisingh-Scheetz, M.; Arora, V.M. Inequities in Technology Contribute to Disparities in COVID-19 Vaccine Distribution. JAMA Health Forum 2021, 2, e210264. [Google Scholar] [CrossRef]
  21. Saha, S. US Digital Divide Threatens Vaccine Access for Older People. Human Rights Watch, 2021. Available online: https://www.hrw.org/news/2021/02/08/us-digital-divide-threatens-vaccine-access-older-people(accessed on 8 January 2023).
  22. Vogels, E.A. Some Digital Divides Persist between Rural, Urban and Suburban America. Pew Research Center, 2021. Available online: https://www.pewresearch.org/fact-tank/2021/08/19/some-digital-divides-persist-between-rural-urban-and-suburban-america/(accessed on 8 January 2023).
  23. Anderson, M. About a Quarter of Rural Americans Say Access to High-Speed Internet Is a Major Problem; Pew Research Center: Washington, DC, USA, 2018. [Google Scholar]
  24. Goel, R.K.; Nelson, M.A. COVID-19 Internet Vaccination Information and Vaccine Administration: Evidence from the United States. J. Econ. Finance 2021, 45, 716–734. [Google Scholar] [CrossRef]
  25. Webb Hooper, M.; Nápoles, A.M.; Pérez-Stable, E.J. No Populations Left behind: Vaccine Hesitancy and Equitable Diffusion of Effective COVID-19 Vaccines. J. Gen. Intern. Med. 2021, 36, 2130–2133. [Google Scholar] [CrossRef] [PubMed]
  26. de Vries, H.; Verputten, W.; Preissner, C.; Kok, G. COVID-19 Vaccine Hesitancy: The Role of Information Sources and Beliefs in Dutch Adults. Int. J. Environ. Res. Public Health 2022, 19, 3205. [Google Scholar] [CrossRef] [PubMed]
  27. Chen, Y.-P.; Chen, Y.-Y.; Yang, K.-C.; Lai, F.; Huang, C.-H.; Chen, Y.-N.; Tu, Y.-C. The Prevalence and Impact of Fake News on COVID-19 Vaccination in Taiwan: Retrospective Study of Digital Media. J. Med. Internet Res. 2022, 24, e36830. [Google Scholar] [CrossRef]
  28. Cao, J.; Ramirez, C.M.; Alvarez, R.M. The Politics of Vaccine Hesitancy in the United States. Soc. Sci. Q. 2022, 103, 42–54. [Google Scholar] [CrossRef]
  29. Sharma, M.; Davis, R.E.; Wilkerson, A.H. COVID-19 Vaccine Acceptance among College Students: A Theory-Based Analysis. Int. J. Environ. Res. Public Health 2021, 18, 4617. [Google Scholar] [CrossRef]
  30. Sparks, G.; Lopes, L.; Montero, A.; Hamel, L.; Brodie, M. KFF COVID-19 Vaccine Monitor: April 2022. KFF, 2022. Available online: https://www.kff.org/coronavirus-covid-19/poll-finding/kff-covid-19-vaccine-monitor-april-2022/(accessed on 8 January 2023).
  31. Lasher, E.; Fulkerson, G.; Seale, E.; Thomas, A.; Gadomski, A. COVID-19 Vaccine Hesitancy and Political Ideation among College Students in Central New York: The Influence of Differential Media Choice. Prev. Med. Rep. 2022, 27, 101810. [Google Scholar] [CrossRef]
  32. Public Religion Research Institute. Religious Identities and the Race Against the Virus: Engaging Faith Communities on COVID-19 Vaccination: (Wave 1: March 2021); Public Religion Research Institute: Washington, DC, USA, 2021. [Google Scholar]
  33. Protestants, E. Religious Landscape Study; Pew Research Center: Washington, DC, USA, 2015. [Google Scholar]
  34. Gamio, L.; Walker, A.S. Where the Delta Wave Has Driven up COVID-19 Vaccinations; New York Times: New York, NY, USA, 2021. [Google Scholar]
  35. US Census Bureau. U.C. 2016–2020 ACS 5-Year Estimates. Available online: https://www.census.gov/programs-surveys/acs/technical-documentation/table-and-geography-changes/2020/5-year.html (accessed on 26 July 2022).
  36. Park, A.; Smart, C.; Taylor, R.; Watkins, M. An Extremely Detailed Map of the 2020 Election; New York Times: New York, NY, USA, 2021. [Google Scholar]
  37. Fotheringham, A.S.; Brunsdon, C.; Charlton, M. Geographically Weighted Regression: The Analysis of Spatially Varying Relationships; John Wiley & Sons: Hoboken, NJ, USA, 2003; ISBN 0-470-85525-8. [Google Scholar]
  38. Urban, R.C.; Nakada, L.Y.K. GIS-Based Spatial Modelling of COVID-19 Death Incidence in São Paulo, Brazil. Environ. Urban. 2020, 33, 229–238. [Google Scholar] [CrossRef]
  39. Nakaya, T.; Fotheringham, A.S.; Brunsdon, C.; Charlton, M. Geographically Weighted Poisson Regression for Disease Association Mapping. Stat. Med. 2005, 24, 2695–2717. [Google Scholar] [CrossRef] [Green Version]
  40. Cook, A.C.; Hill, N.J.; Trichka, M.I.; Hwang, G.J.; Sommers, P.M. Who Voted for Trump in 2016? Open J. Soc. Sci. 2017, 5, 199. [Google Scholar] [CrossRef] [Green Version]
  41. Brunsdon, C.; Fotheringham, A.S.; Charlton, M.E. Geographically Weighted Regression: A Method for Exploring Spatial Nonstationarity. Geogr. Anal. 1996, 28, 281–298. [Google Scholar] [CrossRef]
  42. Jones, K.E.; Patel, N.G.; Levy, M.A.; Storeygard, A.; Balk, D.; Gittleman, J.L.; Daszak, P. Global Trends in Emerging Infectious Diseases. Nature 2008, 451, 990–993. [Google Scholar] [CrossRef]
Figure 1. Percentage of population in the considered variables in each region.
Ijgi 12 00158 g001
Figure 2. Presidential election results in 2022 at the ZCTA level in the Capital Region (left) and Houston Metro (right).
Ijgi 12 00158 g002
Figure 3. Local Moran’s I, showing clusters of Republican voters based on ZCTAs.
Ijgi 12 00158 g003
Figure 4. Local coefficients of Hispanic population (%) with regard to vaccination rates as obtained using geographically weighted regression (GWR).
Ijgi 12 00158 g004
Figure 5. Local coefficients of educational attainment (less than a high school diploma %) with regard to vaccination rates as obtained using geographically weighted regression (GWR).
Ijgi 12 00158 g005
Figure 6. Local coefficients of voters for the Republican presidential candidate in 2020 (%) with regard to vaccination rates using geographically weighted regression (GWR).
Ijgi 12 00158 g006
Table 1. Comparison between the Capital Region and the Houston Metro.
NY (Capital Region)TX (Houston Metro)
Number of ZCTAs221 (93 Dem., 128 Rep.)213 (113 Dem., 100 Rep.)
Population1,151,7036,881,708
Avg. vaccination rate56.45%54.41%
Table 2. Pearson’s correlation between vaccination rate and other significant factors.
Capital Region Vax RateHouston Metro Vax Rate
Voting for Rep. candidate−0.139 *−0.226 **
Bachelor and above0.385 **0.772 **
Less than high school−0.276 **−0.463 **
No internet access−0.142 *−0.459 **
No computer−0.003−0.388 **
Unemployment−0.112−0.243 **
Poverty−0.238 **−0.377 **
Asian0.1010.577 **
Hispanic−0.161 *−0.306 **
* p < 0.05; ** p< 0.001.
Table 3. Model summaries of the Gaussian global model and local GWR in both regions.
Capital Region, NYHouston Metro, TX
GAU.S.SIANGWRGAU.S.SIANGWR
AIC578.455567.773377.849349.354
AICc581.561571.459380.983363.685
R20.1560.2650.6610.77
Adj. R20.1220.1990.6470.725
Table 4. Gaussian global regression on vaccination rates in both regions.
NYTX
Blacks0.044−0.665 **
Asians0.0610.14 *
Hispanics−0.16 *−0.282 *
Unemployment−0.055−0.008
Poverty−0.202 *−0.091
No access to the internet−0.004−0.02
Less than a high school diploma−0.162 *−0.403 **
Voting for Rep. presidential candidate−0.193 *−0.985 **
* p < 0.05; ** p < 0.001.
Disclaimer/Publisher’s Note: The statements, opinions and data contained in all publications are solely those of the individual author(s) and contributor(s) and not of MDPI and/or the editor(s). MDPI and/or the editor(s) disclaim responsibility for any injury to people or property resulting from any ideas, methods, instructions or products referred to in the content.

