Article

Evaluation of Supply–Demand Matching of Public Health Resources Based on Ga2SFCA: A Case Study of the Central Urban Area of Tianjin

1
School of Architecture, Tianjin University, Tianjin 300072, China
2
School of Architecture, Tianjin Chengjian University, Tianjin 300192, China
*
Author to whom correspondence should be addressed.
ISPRS Int. J. Geo-Inf. 2023, 12(4), 156; https://doi.org/10.3390/ijgi12040156
Submission received: 28 December 2022 / Revised: 3 April 2023 / Accepted: 4 April 2023 / Published: 6 April 2023

Abstract

:
Determining whether the supply–demand matching (SDM) of urban public health resources is reasonable involves important issues such as health security and the rational use of resources. Using the central urban area of Tianjin as the research area, this paper used the Gaussian-based 2-step floating catchment area method (Ga2SFCA), combined with multi-source data, and comprehensively considered public medical, natural, and physical resources to evaluate the SDM of single-category and integrated public health resources in the research area. The results showed the following: (1) there was a good fit between supply and demand for public medical and natural health resources in Tianjin’s central urban area. For public physical health resources, there was a poor fit between supply and demand; the population in the supply insufficient and scarce areas for 82.78% of the total and was mainly distributed in the marginal areas of the four districts around the city and the six districts of the inner city. (2) For integrated public health resources, the degree of SDM was generally good. It had a circular structure that gradually shrank from the core to the edge. In order to promote the supply–demand balance of urban public health resources, this paper proposed three strategies involving three aspects: the supply, accessibility, and demand of urban public health resources. These strategies involve the service supply level, urban traffic network and slow traffic, development intensity, and population scale.

1. Introduction

Health, as the basis of human survival and development, can affect social stability, economic growth, and national security [1]. With the rapid social and economic development in China, the living environment was rapidly improved, which led to the continuous improvement of residents’ health, among which urban public health resources, such as medical care, parks, and sports, play a significant role in encouraging the improvement of urban residents’ health and the realization of urban health goals as the material carriers of residents’ health protection [2,3,4]. On the other hand, as urban populations continue to grow quickly, public health resources exhibit unequal resource allocation in terms of the quantity, distribution, and service capacity, resulting in an imbalance between their supply and demand and the urban population in terms of space. [5]. Therefore, the scientific assessment of the supply–demand matching (SDM) of urban public health resources is of great theoretical and practical significance to reasonably allocate and lay out public health resources, enhance their service capacity, and reduce the differences in health service capacity between different regions, thus raising the standard of urban health care services and lengthening citizens’ healthy lives.
The study of urban public health resources early mainly focused on public health care [6] and urban environmental pollution [7], with a focus on controlling disease, curbing the spread of disease, and protecting susceptible people [8,9,10,11,12,13]. With the emergence and extension of the concept of the “healthy city”, health no longer belongs exclusively to the medical and health care fields, and the research fields on urban public health issues gradually expanded to include medicine, public health, disaster management, geography, architecture, and urban planning [14], and the focus expanded from the analysis of health risks brought by diseases and the environment to the analysis of health risks affecting human health and the balance of resources for sports and health protection. On the other hand, the research scale was expanded, and new research results were achieved in multi-scale and multi-perspective research. At the macro level, relevant organizations and scholars analyzed indicators related to healthy cities from several aspects, such as the 53 indicators proposed in 1997 when the WHO published Indicators of Healthy Cities: Analysis of All-European Information, in which 12 environmental indicators were related to urban planning, including environmental pollution, urban green space, sports and leisure, pedestrian streets, bicycle paths, and public transport network coverage [15]. These indicators highlighted the direction of work for urban planners; Wang et al. proposed four categories of planning spatial elements that affect health, including land use, spatial morphology, road traffic, green space, and open space, and argued that road planning should take into account such elements as promoting exercise, reducing pollution, and health effects on the human body [16]. At the micro level, some scholars focused on urban public health resources, conducted multi-level studies of a particular type of resource, and proposed that urban planners should pay attention to urban green spaces [17], the physical activities of residents [18], medical facilities [19,20], and sports facilities [21], which are considered to be essential for promoting the physical and mental health of residents and challenging socioeconomic inequalities; some other scholars combined different public resources [21,22,23] to analyze the spatial configuration of urban public service facilities, etc., at multiple levels.
The balanced layout and optimal allocation of urban public health resources can help promote the improvement of residents’ health and the realization of healthy city goals [24]. At present, research on the matching degree of supply and demand and the quantification of various types of urban public health resources is a hot topic. Among the research methods, common quantitative analysis methods include the network analysis method [25], minimum distance method [26], cumulative opportunity method [27], potential model method [28], proportional model method [29], 2-step floating catchment area method (2SFCA) [30,31], and so on. Among them, by taking into account the magnitude of both supply and demand and overlaying elements such as service radius in the measurement, the computation of SDM is more accurate when using the 2-step floating catchment area method (2SFCA). However, the traditional 2SFCA also has limitations: (1) it only takes into account the distance of the road network between the supply and demand points, ignoring the distance decay; (2) it gives the same supply capacity to different suppliers, ignoring the variability of the service capacity on the supply side. Therefore, the 2SFCA research method was widely recognized by scholars in established studies, and various extended forms emerged, including Enhanced 2SFCA [32], Gaussian 2SFCA [33], Kernel Density 2SFCA [34], and Gravity 2SFCA [35] for distance decay; and 3SFCA [36,37], improved M2SFCA [38], Huff 2SFCA [39], reliability-based 2SFCA [40,41], etc., considering selection propensity and supply. In practical research, this method is widely used in the study of SDM for urban medical facilities [33], public service facilities [42], park green spaces [34], elderly facilities [35], etc. Among them, the Gaussian 2SFCA model not only introduces the decay law of urban residents’ travel distance but also takes into account the supply service capacity of urban public health resources, which can be modified in conjunction with specific scenarios and plays the role of an effective measure of urban complex factors.
These improved models optimize the traditional models to some extent, but there are still some shortcomings. (1) On the demand side, the traditional health resource SDM is mostly evaluated by sub-district (one of the administrative divisions in China, which usually consists of many communities.) [43], community (which usually consists of many residential quarters) [44], or grid [45], which makes it difficult to form a precise portrayal of the spatial allocation of health resources in different residential quarters, leading to large errors in the results. (2) On the supply side, the current research results are rather one-sided when measuring the level of supply services, and some scholars use a single variable as the assessment index of supply, such as the number of beds in medical facilities [45], the average green area in parks [46], the average number [47] and area [48] in sports facilities, etc., and some scholars integrated different elements to consider their supply service capacity, such as assessing the normalized attractiveness index of parks based on the number of facilities in urban parks [44], without taking into account the service quality of health resources of the same magnitude.
In general, in the process of urbanization, urban health resources gradually diversify, and recent research on urban public health resources mostly focused on a certain category of resources such as parks and green areas, medical facilities, physical activities, etc., which were usually studied at multi-level for this category of resources. Fewer studies were conducted on integrated urban public health resources. Different categories of health resources interact and complement each other, and the combined benefits of their SDM were not yet extensively discussed. The urban health resources were concerned by Chinese scholars Jiang et al. [24], who divided urban health resources into two primary categories, health care resources and recreational health resources, and two secondary categories, public and commercial. Later, Ran et al. [48] and Wang et al. [49] made certain extensions and divided urban health resources into three categories: medical, natural, and sports. With reference to their views, this paper summarizes the definition of urban public health resources based on the perspective of public resources: urban public health resources refer to urban resources with social and natural attributes that exert positive mental and physical effects on city residents. They occupy certain urban spaces and are spatial places with related facilities that improve the health of residents by providing treatment, experience, and related services. Public health resources are classified into three categories based on the service they provide: medical, nature, and physical resources.
In view of this, this paper chose the central urban area of Tianjin as its research area, which overcomes the drawback that current research take the sub-districts and communities as the statistical units with insufficient accuracy, takes the residential quarters as the research unit at the central urban area scale, takes the SDM degree perspective, uses multi-source data, considers the supply service capacity of various resources from both supply capacity and service quality, uses the Ga2SFCA method to evaluate the SDM of different resources, takes into account both car and pedestrian travel modes, combines multiple search thresholds, and finally, summarizes the findings of the evaluation of the supply of and demand for urban public health resources in order to serve as a guide for the layout optimization of urban public health resources.

2. Study Area and Datasets

2.1. Study Area

This study took the central urban area of Tianjin as the study area, i.e., the area within the outer ring road of Tianjin, including the six districts of the inner city (Heping, Hexi, Hedong, Nankai, Hebei, and Hongqiao) and parts of the four districts around the city (Dongli, Xiqing, Jinan, and Beichen), with an area of 334.53 km2 and 84 streets as of the end of 2021 (Figure 1). This paper captured a total of 4016 residential quarters from the network, and the total population calculated by the number of households is 7.306 million. The central area of Tianjin is the gathering area for the population, resources, economy, and culture of Tianjin, and the dense gathering of people inevitably brings high demand for health resources, and so, it is crucial to investigate whether the supply of and demand for health resources are balanced.

2.2. Data Source and Process

2.2.1. Data Source

This paper defines and classifies the categories of urban resources according to their various specifications and specific functions. Urban public medical health resources refer to medical service resources that provide medical services, are open to residents, and have national uniform standards for accreditation, which can be divided into tertiary hospitals, secondary hospitals, primary hospitals, and community hospitals according to their class. Urban public natural health resources refer to parks and green areas in urban space that provide leisure experiences for residents and have a certain ecological purification effect. This paper refers to the criteria for classifying park green spaces in GBT51346-2019 Urban Green Space Planning Standards and divides the park green spaces into three classes: comprehensive parks (more than 10 hm2); community parks (1–10 hm2); and pleasure gardens (less than 1 hm2). Urban public physical health resources refer to resources for improving residents’ physical quality and plastic fitness function, which are divided into playground tracks and gymnasiums according to the function. The data sources are shown in Table 1.

2.2.2. Data on Public Medical Health Resources

The public medical health resources data used in this paper, with attributes including directory, grade, type, address, and number of beds, are shown in Table 1. Among them, the bed numbers of tertiary and secondary hospitals are publicly available. Due to the missing bed data for primary hospitals and community hospitals, this paper used the average value of the bed data of the same class and function of hospitals that can be obtained, and assigned the number of beds to the remaining missing data with reference to the general bed number setting standard, which is shown in Table 2. A total of 530 medical health resource points were counted, including 33 tertiary hospitals, 56 secondary hospitals, 370 primary hospitals, and 71 community hospitals (Figure 2).
The supply and service capacity of medical resources is usually reflected by the grade, number of beds, number of technicians, etc. In this paper, the grade (tertiary hospitals, secondary hospitals, primary hospitals, and community hospitals) and number of beds were selected to reflect the supply service capacity of public medical and health resources. Assuming that the grade value of tertiary hospitals is 1, according to the linear decreasing relationship, the weight value between adjacent grades differs by 0.25, and the grade values of the remaining three types of hospitals are 0.75, 0.5, and 0.25. By multiplying the grade value by the number of beds, the supply service capacity of each public medical and health resource can be estimated.

2.2.3. Data on Public Natural Health Resources

The public natural health resources studied in this paper refer to the open park green spaces in the city. There are 20 comprehensive parks (more than 10 hm2), 97 community parks (17 community class I parks (5–10 hm2) and 80 community class II parks (1–5 hm2)), and 40 pleasure gardens (less than 1 hm2), totaling 157, according to the sources in Table 1. We extracted the multiple entrances of comprehensive parks as supply points due to their large areas, we fused multiple results on the same comprehensive park, and we extracted the mass of community parks and pleasure gardens as supply points (Figure 3).
The quantity and quality of park green space are crucial for maintaining a balance between supply and demand [51]. The park scale, development, and utilization level integrally reflect the supply service capacity of park green space [52], while the park quality reflects its health service level to some extent; accordingly, this paper examines the park quality with the park grade and blue-green space service index, and assumes a grade value of 1 for comprehensive parks and 0.667 and 0.333 for the other two classes of parks, respectively. Meanwhile, this paper uses park mndwi (normalized difference water index) and ndvi (normalized difference vegetation index) to characterize the blue-green space service index. Meanwhile, mndwi and ndvi were derived from the inversion of Landsat 8 remote sensing data downloaded from the geospatial data cloud [53] (remote sensing data dated 11 August 2021, less than 1% cloudiness within the study area, accuracy 30 m). The weights of the three indicators of park rank, mndwi, and ndvi were obtained using the Delphi method by 30 experts [49], which were 0.246, 0.328, and 0.426, respectively, and the park quality was obtained by superimposing the weights of the three. The park quality was multiplied by the park scale to derive the supply service capacity of each public natural health resource.

2.2.4. Data on Public Physical Health Resources

The public physical education and health resources studied in this paper include playground tracks and gymnasiums that are open to the public. The data sources are shown in Table 1, where the playground tracks include social playgrounds, university playgrounds, and primary and secondary school playgrounds announced to be open to the public in Tianjin in 2019, for a total of 57, including 5 social playgrounds, 13 university playgrounds, and 39 primary and secondary school playgrounds, and the supply capacity is assigned according to the average size of sports playgrounds. Assuming that the supply capacity of primary and secondary school playgrounds is 10, the supply capacities of university playgrounds and social playgrounds are 20 and 30, respectively [47,54]. The category of gymnasiums includes all kinds of courts, fitness centers, swimming centers, martial arts sports facilities, etc., for a total of 1819 venues. Considering the lack of data, this paper adopted the number of reviews on Yelp with more complete data as the judgment standard for supply service level [55], which was divided into ≤74, 74–227, 227–528, 528–955, and >955 according to the natural breakpoint method, and the supply service capacity was 10, 20, 30, 40, and 50 (Figure 4).

2.2.5. Basic Geographic Information Data

This paper split the road data into 6 levels of roads, such as high-speed expressway, trunk road, secondary road (ramp), branch road, trail, and pedestrian, and established two levels of road network: one was the driving road network, including the high-speed expressway road network, trunk road, secondary road (ramp), branch road, and trail. The speed of traffic was set at 75, 45, 30, 20, and 10 km/h. The other was the walking road network, including trunk road, secondary roads (ramps), branch roads, trail, and pedestrian. The speed of pedestrians was set at 1.5 m/s as the standard. Using the OD cost matrix function of the network analysis tool in ArcGIS 10.5, the shortest travel time from each residential quarter (demand point) to the public health resource (supply point) was calculated.

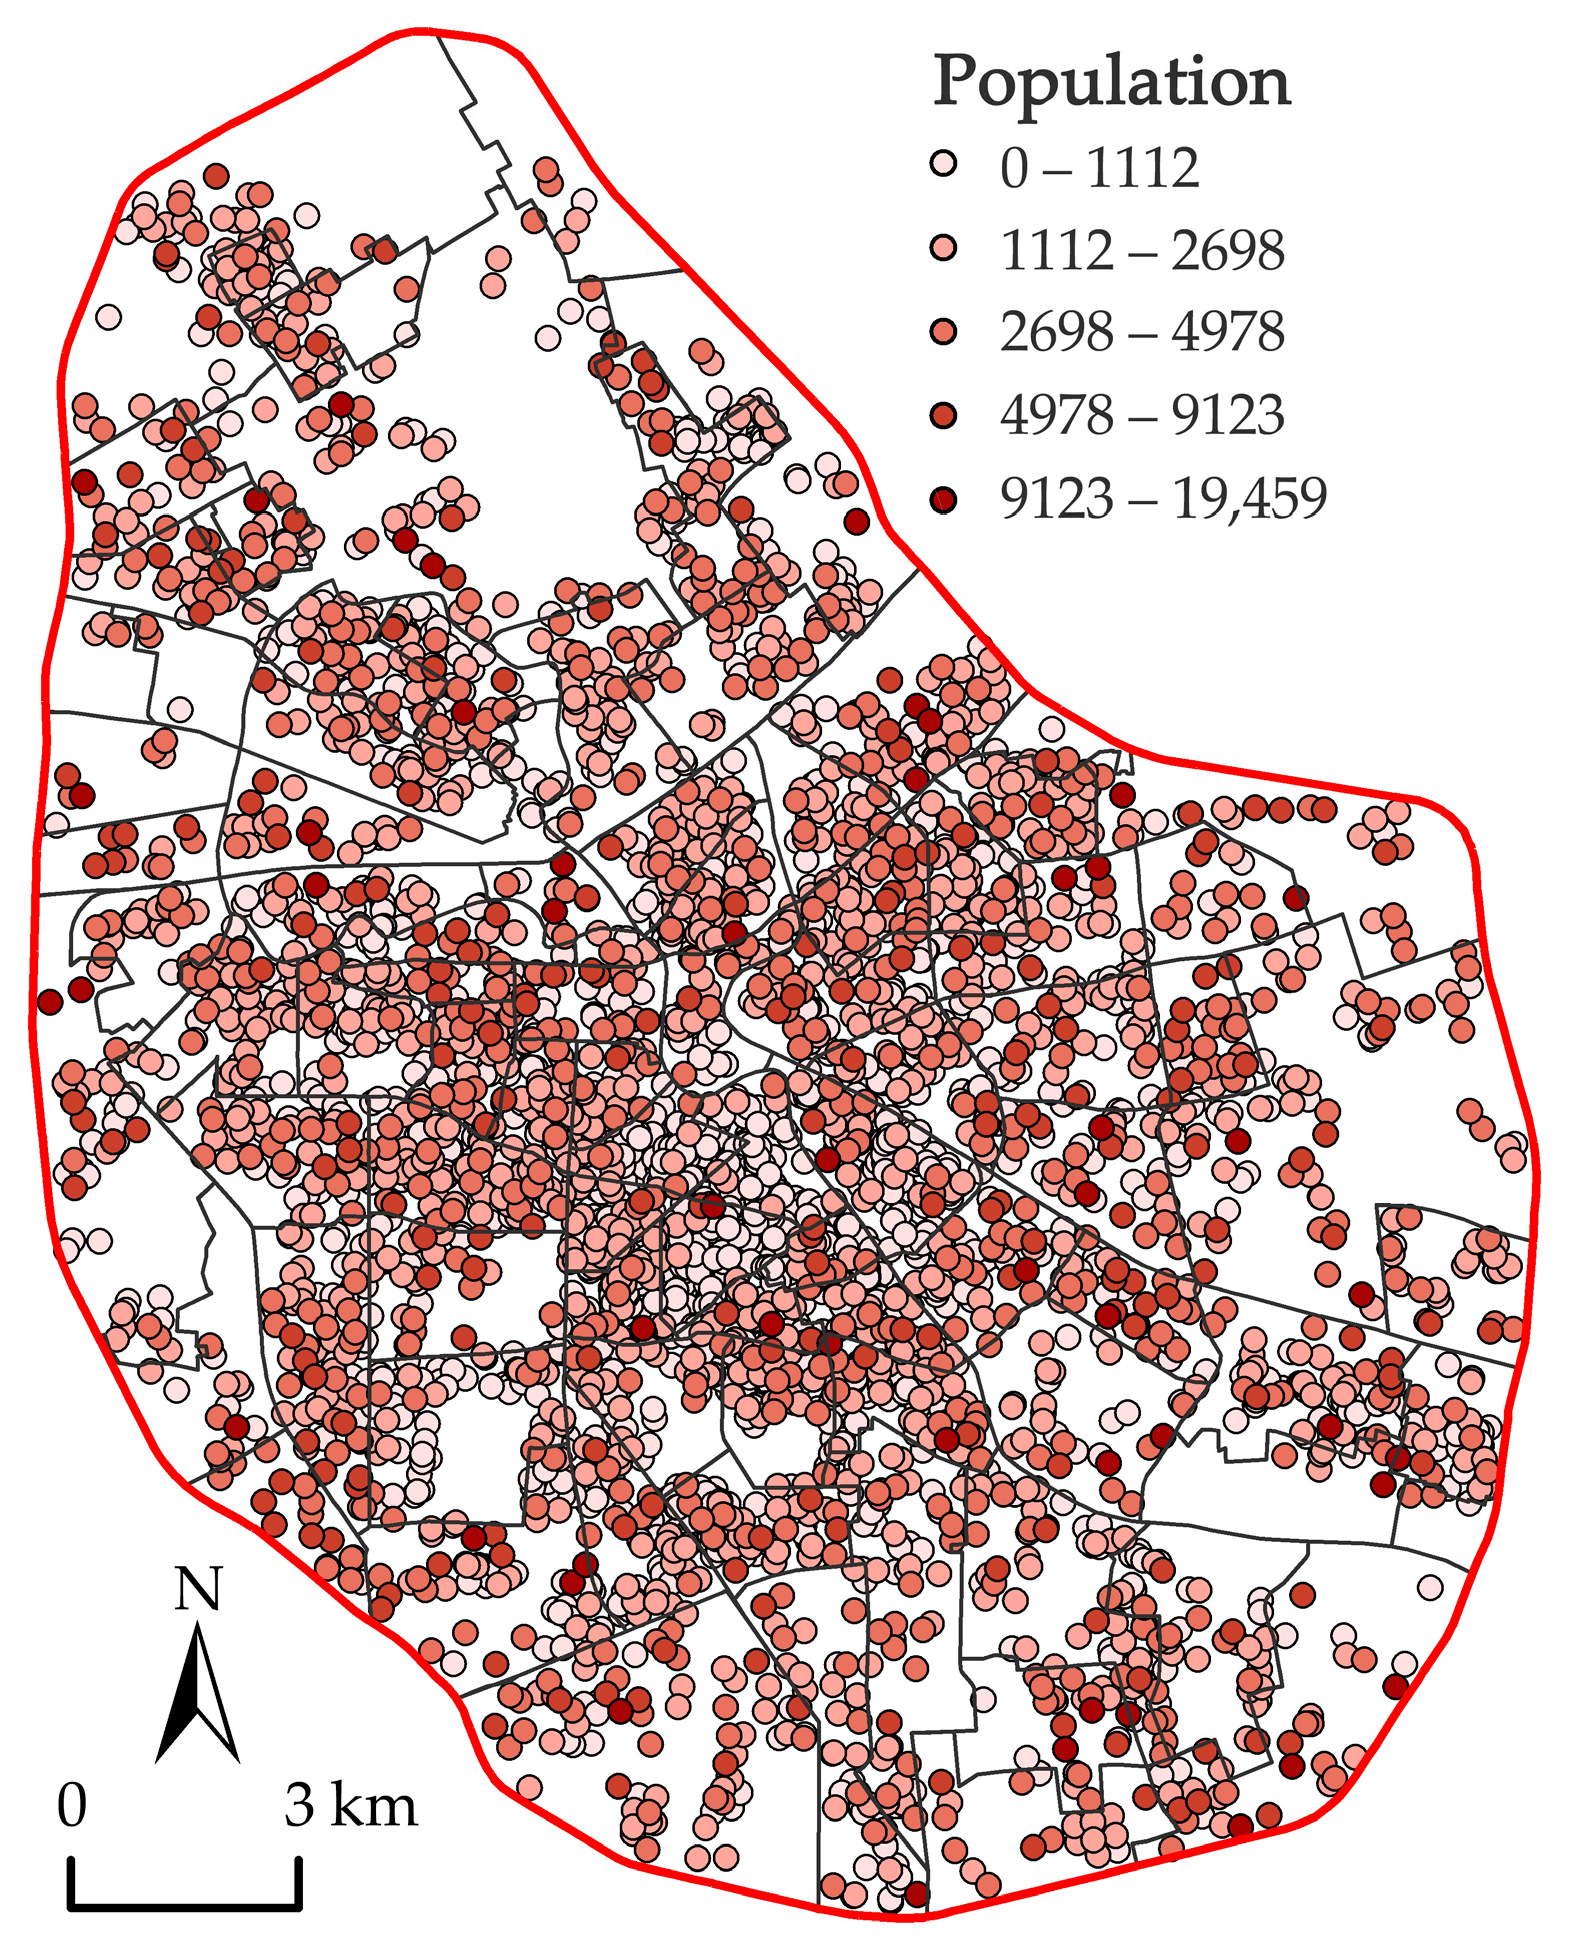
2.2.6. Demographic Data

This article obtained the name, total number of households, and coordinates of residential quarters in Tianjin’s center city from the official website of Anjuke (Table 1). In this paper, we referred to the Tianjin Statistical Yearbook [56] and took the average household size of 2.72 persons/household in Tianjin in 2020 as the standard. We then multiplied the number of households in the district by 2.72 to obtain the population data of each residential quarter (Figure 5).

2.3. Research Framework and Methodology

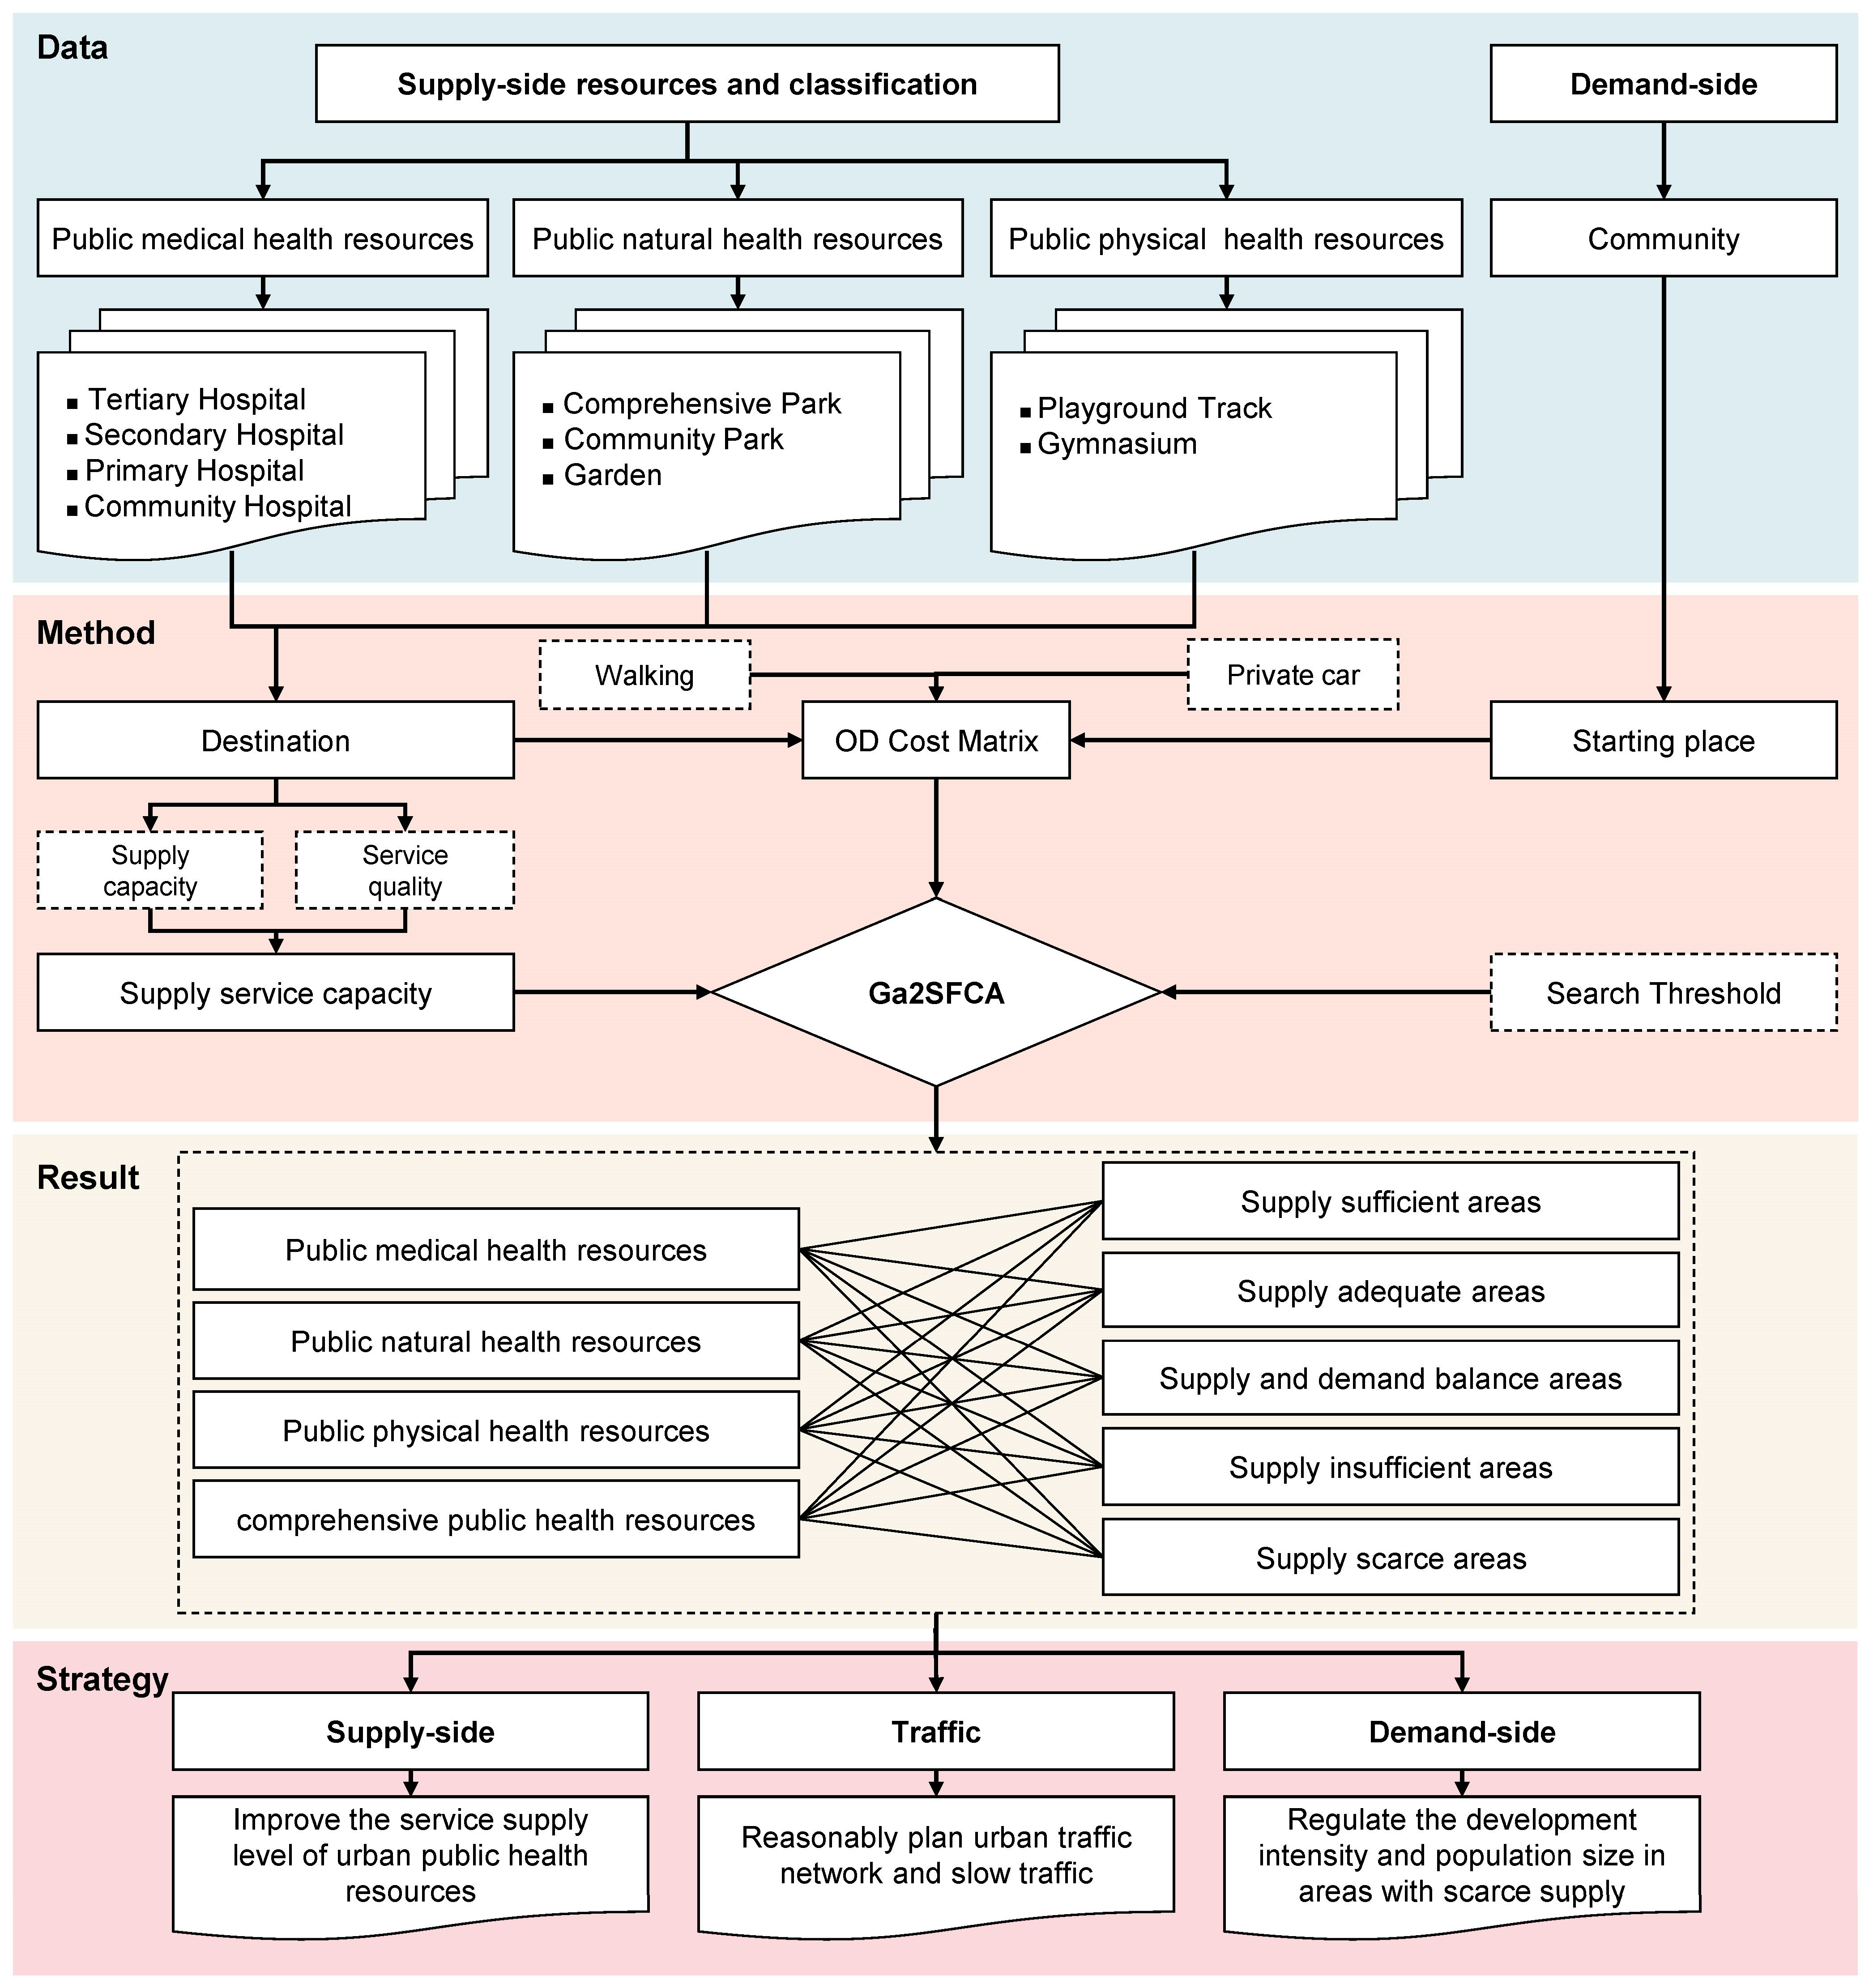
2.3.1. Research Framework

We classified the supply-side public health resources and calculated their supply service capacity by considering the class and service capacity comprehensively, constructed two kinds of OD cost matrix for vehicular and pedestrian traffic with residential quarters as the demand side, determined the search thresholds for different classes of resources, applied the Gaussian-based 2-step floating catchment area method while assigning weights to each class of public health resource to form a single category and an integrated urban public health resource SDM assessment, and finally, proposed three strategies for supply-side, demand-side, and traffic (Figure 6).

2.3.2. Methodology

In this paper, the term “accessibility” is used, and the definition found in the international literature was used as a guide, and we referred to the degree to which the supply service capability of urban public health resources fits the demand of the people within a specific radius as the SDM, i.e., the supply capacity to demand capacity ratio [52]. The supply service capacity used in this paper was superimposed from different categories of data and was represented in the form of relative values. Ga2SFCA (Gaussian-based 2-step floating catchment area method) was proposed by Dai [34] in 2011 to measure the accessibility of urban green space. The Ga2SFCA model not only introduces the decay law of urban residents’ travel distance, but also takes into account the supply-service capacity of urban public health resources, which can be modified in conjunction with specific scenarios and plays the role of an effective measure of urban complex factors. A large number of scholars used this method to discuss the SDM and social equity of various resources in cities, and it was well validated.
Therefore, in this paper, Ga2SFCA was used to measure the SDM of public health resources with public health resources as the supply points and residential quarters as the demand points, and the specific steps were as follows:
The first step was centered on each public health resource, as in Equation (1):
R   j = S j i { d i j     d 0 } k D i × G ( d i j )
where R j refers to the ratio of supply and demand of public health resources j to the total population of the residential quarters within the search domain; i refers to settlements; S j is the supply capacity of public health resources, which is expressed in this paper by the supply service level; D i refers to the size of the residential quarters, which is expressed as the population of residential quarters in this paper; k refers to the number of residential quarters in the search domain; d i j is the distance between residential quarter i and public health resource j , where we use the passage of time as a representation; d 0 refers to the spatial search threshold, which is represented by the time cost in this paper; and G d i j is the sports decay function considering the distance—see Equation (2):
G d i j = e 1 2 × d i j d 0 2 e 1 2 1 e 1 2 ,   d i j     d 0 0 ,                                                 d i j   >   d 0
The second step was centered on each residential quarter—see Equation (3):
A   i = i { d i j   d 0 } m R j ×   G d i j
where A i refers to the final SDM value of each residential quarter and m refers to the number of public health resources within the spatial search threshold d 0 centered on residential quarter point i .
In this paper, we referred to previous studies and considered the different service scope and nature of resources at each level in order to determine the travel mode and spatial search threshold of public health resources at each level. This paper used the Delphi method by 30 experts to attach weights to the three types of public health resources to calculate the SDM of integrated public health resources, and finally, obtained the following table (Table 3).

3. Results and Analysis

The spatial SDM assessment of medical, parks, and sports public health resources was obtained by adding up the resource SDM values at each level for each category of public health resources, respectively, and the SDM of each residential quarter site was classified into five levels by the natural breakpoint method: supply–demand affluent area, supply–demand satisfied area, supply–demand balanced area, supply–demand insufficient area, and supply–demand scarce area [52]. The five-level classification structure of the three types of public health resources was obvious and could better illustrate the rationality of this classification.

3.1. Single Category Urban Public Health Resources

3.1.1. Public Medical Health Resources

The spatial mapping of the SDM degree of medical and public health resources in Tianjin city center (Figure 7) showed a clear spatial distribution characteristic of “higher in the center, balanced in the middle, and lower in the periphery.” The number and proportion of the population in the residential quarters (Table 4) showed that 39.48% of the population was located in the supply–demand balance area, and the population in this area had reasonable access to medical facilities at all levels, which were primarily scattered over the six districts of the inner city perimeter; 29.98% of the population was located in the supply insufficient area, which was obviously distributed in the periphery of the study area, mainly in the four districts around the city; 26.4% of the population was located in the supply and demand adequate area, which was mostly located in the core area of the six districts, where medical resources were abundant and the population density was small; and 4.73% of the population was located in the supply sufficient area, which was obviously concentrated in the southern part of the Heping District (such as Shangyeschang sub-district), the southern part of the Hebei District (such as sub-districts of Guangfu, Ningyuan, and Guangfu Road), the western part of the Hedong District (such as Dawangzhuang sub-district), and parts of the Hexi District (such as Liulin sub-district). It was clear that the distribution of public medical health resources tended to have a strong correlation with the economic level and population distribution of the city; the closer it was to the center, the higher the economic development and the more dense the distribution of quality medical resources tended to be.

3.1.2. Public Natural Health Resources

The spatial mapping of the matching degree of supply and demand of natural public health resources in the central city of Tianjin (Figure 8) showed a spatial distribution characteristic of “high in the core, low in the middle, and balanced in the periphery.” The number and proportion of the population in the residential quarters (Table 5) showed that 40.88% of the population was located in the supply–demand balanced area, i.e., they enjoyed a reasonable supply of public natural health resources, which were mostly located in the center of the six districts of the inner city; 35.27% of the residential quarter population was located in the supply insufficient area, and these residential quarters were mostly located in the peripheral areas of the four districts around the city and the six districts of the inner city, where the distribution of park green spaces was low and the population was high, and the supply exceeded the demand, among which it is worth mentioning that Shuixi Park (Phase I), as a comprehensive park with a large service supply capacity, had a weak SDM in the surrounding residential quarters, which may be due to the distance of Shuixi Park (Phase I) from residential areas and the sparse traffic road network, which was not conducive to the rapid arrival of pedestrians and vehicles; 22.79% of the population of the residential quarters was located in supply adequate area, which were mostly located in the western, southern, and eastern parts of Hexi District, Heping District, the southern part of Nankai District, and some areas of the four districts around the city, where the park green areas were more aggregated; only 0.41% and 0.65% of the residential quarter population was located in the supply scarce area and the supply sufficient area, respectively, where the supply sufficient area was mainly located at the edge of Nankai District (Huayuan sub-district and Sports Center sub-district) and Hexi District (Yuexiu Road sub-district and Liu Lin sub-district); the supply scarce area was scattered in each district, with Dongli District (Wanxin sub-district) being the main area. The distribution and formation of parks and green areas were the result of the combined effects of the natural endowment, economic level, government policies, and historical development of the city, and so, their distribution and supply service capacity were misaligned with the distribution of the urban population.

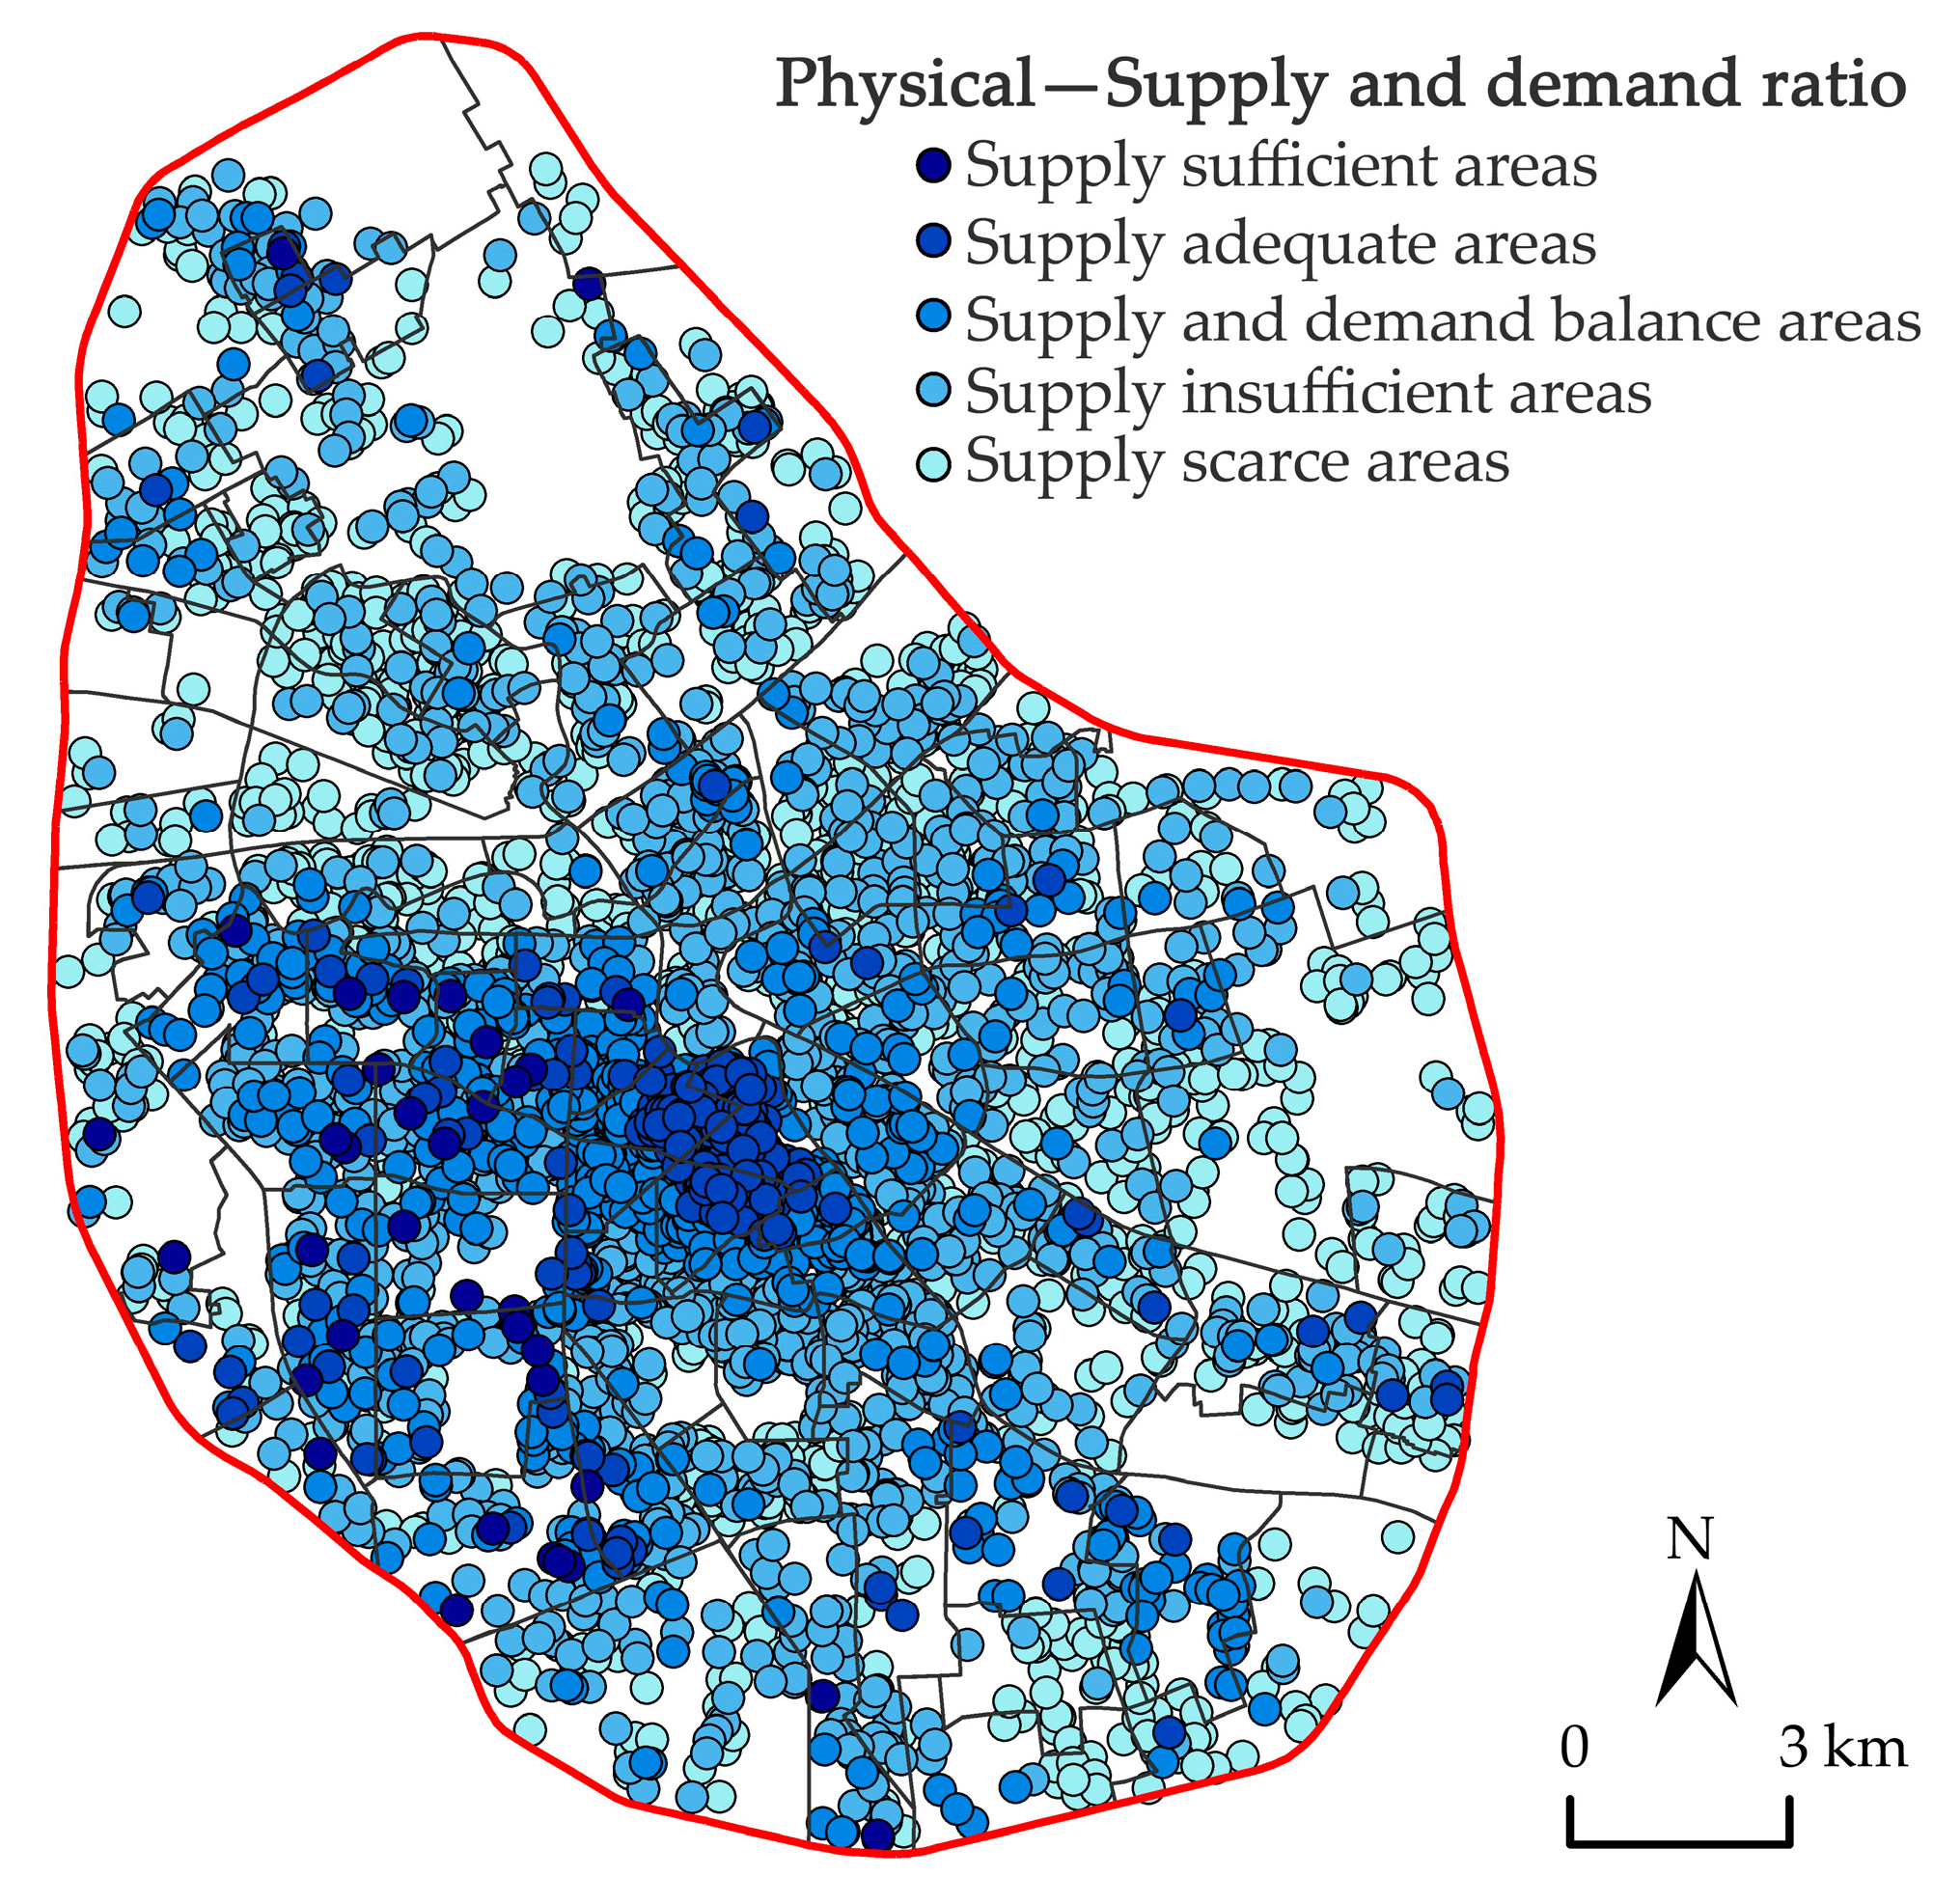
3.1.3. Public Physical Health Resources

The spatial mapping of the matching degree of supply and demand for public health resources in the central city of Tianjin (Figure 9) showed the characteristics of “high in the core, balanced in the middle, and low in the periphery.” The number and proportion of the population in the residential quarters (Table 6) showed that 42.84% and 39.94% of the population in the residential quarters were located in the supply scarce area and the supply insufficient area, respectively, and the residential quarters in the supply scarce area were basically distributed at the edge of the four districts around the city and the six districts of the inner city. This was probably due to the low density of sports venues and playgrounds in this area, which made it difficult to meet the requirement of a 15 min living circle and required residents to expend more energy and costs on public physical health resources. A total of 13.38% of the population was located in the supply–demand balanced area. Most of these residential quarters were distributed in the middle non-core area of the six districts of the inner city, mainly in the Heping and Nankai districts, where the distribution density of gymnasiums and playgrounds was higher and the service capacity was higher; only 3.13% and 0.71% of the residential quarter population was located in the supply adequate areas and supply sufficient areas, respectively. These residential quarters were mainly in the core area of the six districts of the inner city, and there was also a scattered distribution at the edges of the four districts around the city (sub-districts of Xiaobailou, Quanyechang, Tiyuguan in Heping District, sub-districts of Changhong, Wangxiangdi, Gulou, Xingnan, and Tiyuzhongxin in Nankai District). This was mostly due to there being many public sports facilities and health resources distributed in this area. Public physical health resources tended to significantly correlate with urban economic development, and so, their SDM roughly reflected the characteristics of high at the center and low at the periphery.

3.2. Urban Integrated Public Health Resources

The spatial distribution of comprehensive public health resources in the central city of Tianjin was obtained by normalizing the data on the matching of the supply of and demand for medical, natural, and physical resources and superimposing them according to their weights (Figure 10), which showed the characteristics of a spatial distribution of “higher in the center and lower in the periphery.” Meanwhile, there was an obvious interlacing of high and low value areas and a multi-center aggregation distribution. The number and proportion of the population in the residential quarters (Table 7) showed that 43.40% of the population in the residential quarters were located in the balanced SDM areas, and most of these residential quarters were located in the marginal areas of the six districts of the inner city; 35.06% of the population in the residential quarters were located in supply insufficient areas. Most of these residential quarters were located in the four districts around the city and the northern sub-districts of Nankai District. Furthermore, 3.56% and 17.56% of the population in the residential quarters were located in supply sufficient areas and supply adequate areas, respectively. Heping District (sub-districts of Quanyechang, Xiaobailou) and Nankai District (sub-districts of Sports Center, Guangkai, Shuita) had a high SDM. The reason was that these areas made up Tianjin’s CBD, making them the most economically developed area of Tianjin, where the density of the community was low, the transportation was convenient, and the medical, natural, and sports health resources were richly configured and concentrated. In addition, Heping District (sub-districts of Nanyingmen, Xinxing), Nankai District (sub-districts of Sports Center, Guangkai, Changhong, Gulou), Hedong District (sub-districts of Tangjiakou, Chunhua, Changzhou Road, Lushan Road, Liulin, Meijiang), Hebei District (Wanghailou sub-district), and Beichen District (Guoyuan Xincun sub-district) were also found to be high-SDM areas. Health resources showed regional aggregation and high service capacity, which can better match the demand of the population in the area.

4. Discussion

4.1. Contribution

This paper explored the SDM of urban public health resources based on a summary of related studies. It provided an alternative way of considering urban public health resources in other regions of the world in terms of its research perspective and data precision.
(1)
Firstly, in terms of research perspective, this paper was based on the perspective of urban public health resources and analyzed their SDM assessment using Ga2SFCA. At the same time, it combined two types of travel modes, namely vehicular and pedestrian, and considered a variety of travel space thresholds, which can more accurately depict how residents were traveling. We expect that the analysis in this paper can draw attention to urban public health resources and spread them to other cities and even other countries.
(2)
Secondly, on the supply side, this paper adopted a more scientific measurement of supply and service capacity for each category of health resource. It not only considered single-level supply capacity, such as beds, park green space area, sports facility category, etc., but also added hospital grade, blue-green space service index, sports facilities evaluation grade, etc., comprehensively considered supply capacity and service quality, and considered the supply characteristics of resources at multiple levels. It more objectively and truly reflected the supply and service capacity of urban public health resources.
(3)
On the demand side, we took the more accurate residential quarter as the starting point, multiplied the number of households in the residential quarter and the average population of Tianjin in 2020 to obtain more accurate population data, and simulated the real population from a more realistic perspective to overcome the problem of the poor accuracy of sub-districts and communities in the current study. The same approach can be adopted for other cities.
(4)
Finally, for the results of the resource SDM assessment, the graded statistics can provide precise guidance on the optimization priorities, construction directions, and capital investment in urban public health resource planning and assessment, especially in high-density urban center areas.

4.2. Suggestions

Urban public health resources are key resources in cities. In the process of urbanization, various public health and safety incidents made us realize the importance of urban public health resources. The reasonable layout of urban public health resources directly affects people’s health and well-being. On this basis, this paper argues that the matching of the supply and demand of urban public health resources can be improved in the following ways:
(1)
Improving the service supply level of urban public health resources. The Ga2SFCA method used in this paper considers both service quality and resource supply capacity. The government can improve its supply service level in two ways. Firstly, to improve the supply capacity of all kinds of resources, the top–down rational allocation and distribution of resources should be considered, such as choosing more schools in the central urban area of Tianjin to open playgrounds and gymnasiums, increasing the number and construction of playgrounds open to the public in society and calling for the construction of urban running tracks and walking paths to create a city image of fitness for all [57]. Secondly, improving the service quality of health resources should be considered; for example, by establishing a two-way flow between primary hospitals and large hospitals [58] to achieve the technical help of the grassroots medical structure. Comprehensive parks and community class I parks have a large area, and most of these resources in the central urban area of Tianjin are located in marginal areas, it is necessary to enhance the attractiveness of park green space by strengthening its recreational capacity and ecological value. Small park green spaces should increase the installation of rest facilities; larger park green spaces can be equipped with running tracks to form a comprehensive platform for nature and sports which can increase the willingness of residents to visit and to stay.
(2)
Reasonable planning of urban transportation road network and slow traffic to improve the accessibility of public health resources. In this study, the Tianjin Haihe River formed a natural barrier in the city, which makes the connection between the two sides of the river weak and the accessibility low; however, it also forms a good water-friendly landscape. The public health resources on both sides of the river should make the most of the natural scenery on both sides, improve pedestrian paths, slow down traffic, and make public health resources easier to access in order to better match supply with demand.
(3)
Regulate the development intensity and population scale of areas with scarce supply. Urban public health resources have an irreplaceable position in guaranteeing the physical and mental health of residents. The core area of Tianjin city is a high SDM area, where the population density is low and there is a waste of resources, while the middle and peripheral areas have different kinds of resource shortages, where the population density is high. Based on the principle of social equity, for public medical and physical health resources, the four districts around the city should increase the supply of resources or improve the existing resources to achieve the goal of improving the SDM. For public natural health resources, the supply of resources should be increased in the six districts of the city, while comprehensive parks in Tianjin are mostly located in urban fringe areas, pleasure gardens have greater flexibility, and so, can be injected into urban space through pocket parks and other forms [59]. The idle resources of various types of land in the city can be used to transform and upgrade; for example, small and micro spaces in residential areas can be revitalized to form outdoor fitness venues [54].

4.3. Limitations

Although this paper adopted the Ga2SFCA method to comprehensively consider the SDM of various public health resources, there were still some shortcomings in the calculation accuracy: (1) In assessing the SDM of public health resources in the central city of Tianjin, this paper maximally considered the ways and maximum time costs of different categories and levels of resources required to reach various destinations, but there were still some deviations from the actual situation. For example, this paper set the way of reaching the park for residents to walk and the maximum time taken to 15 min; however, in fact, in the visitation survey, we found that many residents also drive or walk for longer than this to reach such destinations. Additionally, this paper only discussed two travel models: walking and car travel. Therefore, further research on multiple arrival modes with different time investments is needed. (2) In this paper, there was an incomplete selection of indicators for measuring the supply service capacity of public health resources. For example, in this paper, due to the difficulty of data acquisition, the total number of public reviews on Anjuke were used as the reference standard for grading the supply service capacity of sports venues in sports and health resources, which may be biased.

5. Conclusions

Based on the Ga2SFCA method, this paper comprehensively considered the supply service capacity of various resources and calculated the SDM of public health resources in the central urban area of Tianjin, calculated their SDM levels in a hierarchical manner, and drew the following conclusions:
(1)
In the central urban area of Tianjin, different public health resources had varying SDMs. The SDM of public medical health resources was the best, and the SDM of public physical health resources was the worst. Supply insufficient and scarce areas were primarily found in the peripheral areas of the four districts around the city and the six districts of the inner city, which are the future focus areas for optimizing the organization of diverse public health resources and enhancing the standard of care. These are the crucial areas for optimizing the organization of diverse public health resources and raising the standard of service.
(2)
The spatial differentiation of the supply and demand of various public health resources was obvious. The SDM of public medical health resources and public physical health resources generally showed the characteristics of high in the core and low at the periphery, while the SDM of public natural health resources generally showed the trend of high in the core, low in the middle, and high at the periphery.
(3)
The SDM of integrated public health resources in the central city of Tianjin was generally good. The SDM value showed a gradually decreasing circle structure from the core area to the peripheral area, with 35.47% of the population being located in insufficient and scarce areas. At the same time, the SDM in the central city of Tianjin reflected a mixed distribution of high and low values, and the distribution of high values of SDM showed a multi-center aggregation phenomenon, forming a pattern of decreasing multi-centeredness. Most of these centers were located in the sub-district of Quanyechang, Xiaobailou, Sports Center, and Liulin. From the perspective of the comprehensive regulation of the SDM of urban public health resources, the SDM degree of urban fringe areas should be systematically improved, focusing on the improvement of urban transportation road networks and slow traffic level.
The research results are helpful to understand the supply and demand matching of public health resources in the central city of Tianjin and to provide reference for scientific priority planning for the reasonable location and layout of medical facilities, park green space, and sports facilities.

Author Contributions

Conceptualization, Xiaoyu Guo, Jian Zeng, and Aihemaiti Namaiti; methodology, Xiaoyu Guo and Aihemaiti Namaiti; software, Aihemaiti Namaiti and Xiaoyu Guo; validation, Aihemaiti Namaiti and Suiping Zeng; formal analysis, Suiping Zeng and Xiaoyu Guo; investigation, Xiaoyu Guo; resources, Xiaoyu Guo; data curation, Xiaoyu Guo; writing—original draft preparation, Xiaoyu Guo; writing—review and editing, Aihemaiti Namaiti, Suiping Zeng, and Jian Zeng; visualization, Xiaoyu Guo and Aihemaiti Namaiti; supervision, Jian Zeng; project administration, Suiping Zeng; funding acquisition, Suiping Zeng. All authors have read and agreed to the published version of the manuscript.

Funding

This research was funded by the National Natural Science Foundation of China (grant number 52078320) and the Tianjin University Independent Innovation Fund (grant number 2021XSC-0129).

Data Availability Statement

Data are not available due to privacy restrictions.

Conflicts of Interest

The authors declare no conflict of interest.

References

  1. Fang, P.Q.; Dong, S.P.; Xiao, J.J.; Liu, C.J.; Feng, X.W.; Wang, Y.P. Regional inequality in health and its determinants: Evidence from China. Health Policy 2010, 94, 14–25. [Google Scholar] [CrossRef] [PubMed]
  2. Ye, Q.; Deng, Z.H.; Chen, Y.Y.; Liao, J.Z.; Li, G.; Lu, Y.B. How Resource Scarcity and Accessibility Affect Patients’ Usage of Mobile Health in China: Resource Competition Perspective. JMIR mHealth uHealth 2019, 7, e13491. [Google Scholar] [CrossRef] [PubMed]
  3. Brown, G.; Schebella, M.F.; Weber, D. Using participatory GIS to measure physical activity and urban park benefits. Landscape Urban Plan. 2014, 121, 34–44. [Google Scholar] [CrossRef]
  4. White, R.L.; Babic, M.J.; Parker, P.D.; Lubans, D.R.; Astell-Burt, T.; Lonsdale, C. Domain-Specific Physical Activity and Mental Health: A Meta-analysis. Am. J. Prev. Med. 2017, 52, 653–666. [Google Scholar] [CrossRef]
  5. Zhu, J.X.; Xu, Q.; Pan, Y.; Qiu, L.F.; Peng, Y.; Bao, H.J. Land-Acquisition and Resettlement (LAR) Conflicts: A Perspective of Spatial Injustice of Urban Public Resources Allocation. Sustainability 2018, 10, 884. [Google Scholar] [CrossRef] [Green Version]
  6. Richter, R.W.; Bengen, B.; Alsup, P.A.; Bruun, B.; Kilcoyne, M.M.; Challenor, B.D. A Resource for Improved Health Care Delivery. Am. J. Public Health 1974, 64, 1056–1061. [Google Scholar] [CrossRef] [Green Version]
  7. Zhang, D.H.; Zhou, C.S.; He, B.J. Spatial and temporal heterogeneity of urban land area and PM2.5 concentration in China. Urban Climate 2022, 45, 101268. [Google Scholar] [CrossRef]
  8. Hancock, T. The evolution, impact and significance of the healthy cities/healthy communities movement. J. Public Health Policy 1993, 14, 5–18. [Google Scholar] [CrossRef]
  9. Hayes, M. ‘Man, disease and environmental associations’: From medical geography to health inequalities. Prog. Hum. Geog. 1999, 23, 289–296. [Google Scholar] [CrossRef]
  10. International Health Conference. Constitution of the World Health Organization 1946; World Health Organization: Geneva, Switzerland, 2002; Volume 80, pp. 983–984. [Google Scholar]
  11. Woo, J.; Chan, R.; Leung, J.; Wong, M. Relative contributions of geographic, socioeconomic, and lifestyle factors to quality of life, frailty, and mortality in elderly. PLoS ONE 2010, 5, e8775. [Google Scholar] [CrossRef]
  12. Padilla, C.M.; Deguen, S.; Lalloue, B.; Blanchard, O.; Beaugard, C.; Troude, F.; Navier, D.Z.; Vieira, V.M. Cluster analysis of social and environment inequalities of infant mortality. A spatial study in small areas revealed by local disease mapping in France. Sci. Total Environ. 2013, 454, 433–441. [Google Scholar] [CrossRef] [PubMed] [Green Version]
  13. Bastos, L.; Silveira, J.C.; Luna, C.F.; Lucena-Silva, N. Childhood and Adolescent Cancer in the State of Pernambuco, Brazil: Incidence, Geographical Distribution, and Association with Environmental Health Indicators. J. Pediatr. Hematol. Onc. 2018, 40, 7–14. [Google Scholar] [CrossRef] [PubMed]
  14. Yuan, Q.; Meng, J.Q.; Leng, H. Urban spatial impacts on residents’health risk caused by climate changeand planning intervention. City Plan. Rev. 2021, 45, 71–80. (In Chinese) [Google Scholar]
  15. Price, C.W. Healthy Cities Indicators: Analysis of Data from Cities across Europe; WHO Regional Office for Europe: Copenhagen, Denmark, 1997. [Google Scholar]
  16. Wang, L.; Liao, S.W.; Zhao, X.J. Exploration of approaches and factors of healthy city planning. Urban Plan. Int. 2016, 31, 4–9. [Google Scholar] [CrossRef] [Green Version]
  17. Wolch, J.R.; Byrne, J.; Newell, J.P. Urban green space, public health, and environmental justice: The challenge of making cities ‘just green enough’. Landscape Urban Plan. 2014, 125, 234–244. [Google Scholar] [CrossRef] [Green Version]
  18. Sallis, J.F.; Cerin, E.; Conway, T.L.; Adams, M.A.; Frank, L.D.; Pratt, M.; Salvo, D.; Schipperijn, J.; Smith, G.; Cain, K.L.; et al. Physical activity in relation to urban environments in 14 cities worldwide: A cross-sectional study. Lancet 2016, 387, 2207–2217. [Google Scholar] [CrossRef] [Green Version]
  19. Asaria, M.; Ali, S.; Doran, T.; Ferguson, B.; Fleetcroft, R.; Goddard, M.; Goldblatt, P.; Laudicella, M.; Raine, R.; Cookson, R. How a universal health system reduces inequalities: Lessons from England. J. Epidemiol. Commun. H 2016, 70, 637–643. [Google Scholar] [CrossRef] [PubMed]
  20. Zhang, D.H.; Zhang, G.J.; Zhou, C.S. Differences in Accessibility of Public Health Facilities in Hierarchical Municipalities and the Spatial Pattern Characteristics of Their Services in Doumen District, China. Land 2021, 10, 1249. [Google Scholar] [CrossRef]
  21. Higgs, G.; Langford, M.; Norman, P. Accessibility to sport facilities in Wales: A GIS-based analysis of socioeconomic variations in provision. Geoforum 2015, 62, 105–120. [Google Scholar] [CrossRef] [Green Version]
  22. Wang, W.; Zhou, Z.H.; Chen, J.; Cheng, W.; Chen, J. Analysis of Location Selection of Public Service Facilities Based on Urban Land Accessibility. Int. J. Env. Res. Public Health 2021, 18, 516. [Google Scholar] [CrossRef]
  23. Azmoodeh, M.; Haghighi, F.; Motieyan, H. Proposing an integrated accessibility-based measure to evaluate spatial equity among different social classes. Environ. Plan. B-Urban 2021, 48, 2790–2807. [Google Scholar] [CrossRef]
  24. Jiang, Y.P.; Zhen, F.; Sun, H.H. Spatial characteristics of urban health resources at block scale—A case study of central urban area of NanJing. Econ. Geogr. 2018, 38, 85–94. (In Chinese) [Google Scholar] [CrossRef]
  25. Reyes, M.; Paez, A.; Morency, C. Walking accessibility to urban parks by children: A case study of Montreal. Landscape Urban Plan. 2014, 125, 38–47. [Google Scholar] [CrossRef]
  26. Zeng, W.; Xiang, L.L.; Zhang, X.L. Research in spatial pattern of accessibility to community service facilitiesand spatial deprivation of low income community in NanJing. Hum. Geogr. 2017, 32, 73–81. (In Chinese) [Google Scholar] [CrossRef]
  27. Kelobonye, K.; Zhou, H.; McCarney, G.; Xia, J.H. Measuring the accessibility and spatial equity of urban services under competition using the cumulative opportunities measure. J. Transp. Geogr. 2020, 85, 101268. [Google Scholar] [CrossRef]
  28. Yang, N.; Chen, S.Y.; Hu, W.L.; Wu, Z.G.; Chao, Y. Spatial Distribution Balance Analysis of Hospitals in Wuhan. Int. J. Env. Res. Public Health 2016, 13, 971. [Google Scholar] [CrossRef] [Green Version]
  29. Kong, Y.F.; Li, X.J.; Zhang, X.F. Analysis of spatial accessibility for school redistricting in rural China: A case study of the secondary schools in GongYi city, HeNan Province. Natl. Remote Sens. Bull. 2008, 12, 800–809. [Google Scholar]
  30. Luo, W.; Wang, F.H. Measures of spatial accessibility to health care in a GIS environment: Synthesis and a case study in the Chicago region. Environ. Plan. B-Plan. Design 2003, 30, 865–884. [Google Scholar] [CrossRef] [Green Version]
  31. Ngui, A.N.; Apparicio, P. Optimizing the two-step floating catchment area method for measuring spatial accessibility to medical clinics in Montreal. BMC Health Serv. Res. 2011, 11, 166. [Google Scholar] [CrossRef] [Green Version]
  32. Luo, W.; Qi, Y. An enhanced two-step floating catchment area (E2SFCA) method for measuring spatial accessibility to primary care physicians. Health Place 2009, 15, 1100–1107. [Google Scholar] [CrossRef]
  33. Dai, D.J. Black residential segregation, disparities in spatial access to health care facilities, and late-stage breast cancer diagnosis in metropolitan Detroit. Health Place 2010, 16, 1038–1052. [Google Scholar] [CrossRef]
  34. Dai, D. Racial/ethnic and socioeconomic disparities in urban green space accessibility: Where to intervene? Landscape Urban Plan. 2011, 102, 234–244. [Google Scholar] [CrossRef]
  35. Tao, Z.L.; Cheng, Y.; Dai, T.Q. Measuring spatial accessibility to residential care facilities in Beijing. Prog. Geogr. 2014, 33, 616–624. (In Chinese) [Google Scholar] [CrossRef]
  36. Wan, N.; Zou, B.; Sternberg, T. A three-step floating catchment area method for analyzing spatial access to health services. Int. J. Geogr. Inf. Sci. 2012, 26, 1073–1089. [Google Scholar] [CrossRef]
  37. Bell, S.; Wilson, K.; Bissonnette, L.; Shah, T. Access to Primary Health Care: Does Neighborhood of Residence Matter? Ann. Assoc. Am. Geogr. 2013, 103, 85–105. [Google Scholar] [CrossRef]
  38. Delamater, P.L. Spatial accessibility in suboptimally configured health care systems: A modified two-step floating catchment area (M2SFCA) metric. Health Place 2013, 24, 30–43. [Google Scholar] [CrossRef]
  39. Luo, J. Integrating the Huff Model and Floating Catchment Area Methods to Analyze Spatial Access to Healthcare Services. Trans. Gis 2014, 18, 436–448. [Google Scholar] [CrossRef]
  40. Sahebgharani, A.; Haghshenas, H. Analyzing accessibility to fire stations: A floating catchment area model for stochastic transportation networks with travel time correlation. Trans. Gis. 2022, 26, 182–200. [Google Scholar] [CrossRef]
  41. Chen, B.Y.; Cheng, X.P.; Kwan, M.P.; Schwanen, T. Evaluating spatial accessibility to healthcare services under travel time uncertainty: A reliability-based floating catchment area approach. J. Transp. Geogr. 2020, 87, 102794. [Google Scholar] [CrossRef]
  42. Yang, L.A.; Zhang, S.M.; Guan, M.; Cao, J.F.; Zhang, B.L. An Assessment of the Accessibility of Multiple Public Service Facilities and Its Correlation with Housing Prices Using an Improved 2SFCA Method-A Case Study of Jinan City, China. Isprs Int. J. Geo-Inf. 2022, 11, 414. [Google Scholar] [CrossRef]
  43. Wei, Y.; Xiu, C.L.; Gao, R.; Wang, Q. Evaluation of green space accessibility of Shenyang using Gaussian-based 2step floating catchment area method. Prog. Geogr. 2014, 33, 479–487. [Google Scholar] [CrossRef]
  44. Hu, S.J.; Song, W.; Li, C.G.; Lu, J. A multi-mode Gaussian-based two-step floating catchment area method for measuring accessibility of urban parks. Cities 2020, 105, 102815. [Google Scholar] [CrossRef]
  45. Qian, T.L.; Chen, J.; Li, A.; Wang, J.C.; Shen, D.T. Evaluating Spatial Accessibility to General Hospitals with Navigation and Social Media Location Data: A Case Study in Nanjing. Int. J. Env. Res. Public Health 2020, 17, 2752. [Google Scholar] [CrossRef]
  46. Wei, F. Greener urbanization? Changing accessibility to parks in China. Landscape Urban Plan. 2017, 157, 542–552. [Google Scholar] [CrossRef]
  47. Xiao, T.; Ding, T.F.; Zhang, X.K.; Tao, Z.L.; Liu, Y. Spatial Accessibility to Sports Facilities in Dongguan, China: A Multi-Preference Gaussian Two-Step Floating Catchment Area Method. Appl. Spat. Anal. Policy 2022, 15, 1093–1114. [Google Scholar] [CrossRef]
  48. Ran, Z.; Zhou, G.H.; Zhang, H.H.; Tang, C.L.; Chen, W.Y. Spatial correlation between urban health resources and population distribution: A case study of the central urban area of Changsha City. Resour. Sci. 2019, 41, 1488–1499. (In Chinese) [Google Scholar] [CrossRef]
  49. Wang, F.; Zhu, M.W.; Chen, C.W.; Xiao, Y.; Zhang, X.X. Equity of urban health resources based on walkability and spatial distribution of population: A case study of the central urban area of Guangzhou City. Resour. Sci. 2021, 43, 390–402. [Google Scholar] [CrossRef]
  50. Tencent.189. School Stadiums and Gymnasiums in Tianjin are Open to the Public! (2019-12-05). Available online: https://new.qq.com/omn/20191205/20191205A0ME6G00.html (accessed on 30 April 2022).
  51. Rigolon, A. A complex landscape of inequity in access to urban parks: A literature review. Landscape Urban Plan. 2016, 153, 160–169. [Google Scholar] [CrossRef]
  52. Wang, F.Y.; Wang, K.Y.; Liu, H.C. Evaluation and influence factors of spatial accessibility of ecological space recreation service in the Pearl River Delta Urban Agglomeration: A modified Two-step Floating Catchment Area method. Acta Ecol. Sin. 2020, 40, 3622–3633. (In Chinese) [Google Scholar]
  53. Fu, Y.; Guo, Q.Z.; Wu, X.X. Land surface temperature inversion in Tianjin city based on landsat 8 remote sensing data. Environ. Monit. China 2018, 34, 165–172. (In Chinese) [Google Scholar] [CrossRef]
  54. Wei, F.; Wang, X. Measuring spatial accessibility to physical activity spaces in Hangzhou using 2SFCA method. City Plan. Rev. 2019, 43, 112–119. (In Chinese) [Google Scholar]
  55. Zhang, D.H.; Zhou, C.S.; Sun, D.Q.; Qian, Y. The influence of the spatial pattern of urban road networks on the quality of business environments: The case of Dalian City. Environ. Dev. Sustain. 2022, 24, 9429–9446. [Google Scholar] [CrossRef]
  56. Tianjin Municipal Bureau of Statistics. Survey Office of the National Bureau of Statistics in Tianjin. Tianjin Statistical Yearbook 2021; China Statistical Press: Tianjin, China, 2021. [Google Scholar]
  57. Giles-Corti, B.; Vernez-Moudon, A.; Reis, R.; Turrell, G.; Dannenberg, A.L.; Badland, H.; Foster, S.; Lowe, M.; Sallis, J.F.; Stevenson, M.; et al. City planning and population health: A global challenge. Lancet 2016, 388, 2912–2924. [Google Scholar] [CrossRef] [PubMed]
  58. Chen, Y.Y.; Yin, Z.; Xie, Q. Suggestions to ameliorate the inequity in urban/rural allocation of healthcare resources in China. Int. J. Equity Health 2014, 13, 1–6. [Google Scholar] [CrossRef] [Green Version]
  59. Peschardt, K.K.; Stigsdotter, U.K.; Schipperrijn, J. Identifying Features of Pocket Parks that May Be Related to Health Promoting Use. Landscape Res. 2016, 41, 79–94. [Google Scholar] [CrossRef]
Figure 1. The geographical location and administrative division of the central urban area of Tianjin.
Ijgi 12 00156 g001
Figure 2. Spatial distribution of public medical health resources in the research area.
Ijgi 12 00156 g002
Figure 3. Spatial distribution of public natural health resources in the research area.
Ijgi 12 00156 g003
Figure 4. Spatial distribution of public physical health resources in the research area.
Ijgi 12 00156 g004
Figure 5. Spatial distribution of population in the research area.
Ijgi 12 00156 g005
Figure 6. The framework of this study.
Ijgi 12 00156 g006
Figure 7. Schematic diagram of SDM assessment of public medical health resources in the research area.
Ijgi 12 00156 g007
Figure 8. Schematic diagram of SDM assessment of public natural health resources in the research area.
Ijgi 12 00156 g008
Figure 9. Schematic diagram of SDM assessment of public physical health resources in the research area.
Ijgi 12 00156 g009
Figure 10. Schematic diagram of SDM assessment of comprehensive public health resources in the central urban area of Tianjin.
Ijgi 12 00156 g010
Table 1. Data sources of urban public health resources in the central urban area of Tianjin.
Resource NameData TypeRemarksSource
Public Medical Health ResourcesDirectory, Grade, Address (2022)Provided by official statistics of Tianjin Municipal Health Commission
Coordinate (2022)Baidu Maps API “https://lbsyun.baidu.com” (accessed on 25 March 2022)
Number of bedsGeneral beds (2022)WeDoctor “https://www.guahao.com/” (accessed on 25 March 2022)
Official websites of hospitals
Missing bedsTable 2
Public Natural Health ResourcesDirectory, Address (2022)Provided by Tianjin Landscape Management Office
Grade (2019)《GBT51346-2019 Standard for Urban Green Space Planning》
Coordinate, Faceted data of parks (2022)Baidu Maps API “https://lbsyun.baidu.com/” (accessed on 10 April 2022)
landsat8 OLI/TIRS (2021-8-11) Geospatial Data Cloud “http://www.gscloud.cn/”(accessed on 10 April 2022)
Public Physical Health ResourcesDirectory, Address of playground track (2022)Web published data [50]
Coordinate of playground track (2022)Baidu Maps API “https://lbsyun.baidu.com/” (accessed on 25 April 2022)
Coordinate of stadiums (2022)Yelp “https://www.dianping.com/” (accessed on 25 April 2022)
Vectored data (2022)Open Street Map “https://master.apis.dev.openstreetmap.org/” (accessed on 15 April 2022)
Name, Households, Coordinate (2022-2)Anjuke “https://tianjin.anjuke.com/” (accessed on 20 April 2022)
Table 2. Reference standard for the number of beds in various function hospitals.
Type of Various Function HospitalReference Number of Beds
Health center, infirmary, health station4
Comprehensive outpatient clinics, Chinese medicine clinics, specialist clinics, staff hospitals10
General hospital, community hospital, maternal and child health center50
Chinese medicine hospital, combined Chinese and Western medicine hospital, specialist hospital50
Table 3. Travel mode, spatial search threshold, and weight of urban public health resources.
Resource NameCategoriesTravel ModeSpatial Search ThresholdWeights
Public Medical Health ResourcesTertiary HospitalBy carMaximum passage time between supply and demand points0.426
Secondary HospitalOn foot30 min
Primary HospitalOn foot20 min
Community HospitalOn foot15 min life circle
Public Natural Health ResourcesComprehensive ParkBy carMaximum passage time between supply and demand points0.328
Community Class I ParkBy car30 min
Community Class II ParkOn foot20 min
GardenOn foot15 min life circle
Public Physical Health ResourcesPlayground TrackOn foot15 min life circle0.246
GymnasiumOn foot15 min life circle
Table 4. Hierarchical statistics of SDM of public medical health resources in central Tianjin.
SDM LevelSDM ValuePopulation
QuantityPercentage
Supply sufficient areas0.0071–0.0564345,7774.73%
Supply adequate areas0.0064–0.00711,928,58626.40%
Supply and demand balance areas0.0057–0.00642,884,10339.48%
Supply insufficient areas0.0015–0.00572,117,39528.98%
Supply scarce areas0–0.001530,0340.41%
Table 5. Hierarchical statistics of SDM of public natural health resources in central Tianjin.
SDM LevelSDM ValuePopulation
QuantityPercentage
Supply sufficient areas6.36–9.0147,6000.65%
Supply adequate areas5.57–6.361,664,98322.79%
Supply and demand balance areas5.25–5.572,986,48140.88%
Supply insufficient areas0.80–5.252,576,79735.27%
Supply scarce areas0–0.8030,0340.41%
Table 6. Hierarchical statistics of SDM of public physical health resources in central Tianjin.
SDM LevelSDM ValuePopulation
QuantityPercentage
Supply sufficient areas0.0148–0.039151,9540.71%
Supply adequate areas0.0084–0.0148228,3963.13%
Supply and demand balance areas0.0053–0.0084977,37813.38%
Supply insufficient areas0.0027–0.00532,917,98939.94%
Supply scarce areas0–0.00273,130,17842.84%
Table 7. Hierarchical statistics of SDM of comprehensive public health resources in research area.
SDM LevelSDM ValuePopulation
QuantityPercentage
Supply sufficient areas0.31–0.61260,3963.56%
Supply adequate areas0.28–0.311,283,13017.56%
Supply and demand balance areas0.25–0.283,170,76743.40%
Supply insufficient areas0.13–0.252,561,56835.06%
Supply scarce areas0–0.1330,0340.41%
Disclaimer/Publisher’s Note: The statements, opinions and data contained in all publications are solely those of the individual author(s) and contributor(s) and not of MDPI and/or the editor(s). MDPI and/or the editor(s) disclaim responsibility for any injury to people or property resulting from any ideas, methods, instructions or products referred to in the content.

