Next Issue
Volume 14, December-2
Previous Issue
Volume 14, November-2
 
 
remotesensing-logo

Journal Browser

Journal Browser

Remote Sens., Volume 14, Issue 23 (December-1 2022) – 278 articles

Cover Story (view full-size image): 
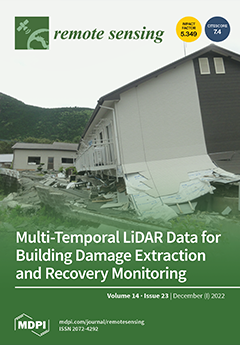
This study demonstrates the use of multi-temporal LiDAR data to extract collapsed buildings and to monitor their removal process in Minami-Aso village, Kumamoto prefecture, Japan, after the April 2016 Kumamoto earthquake. By taking the difference in digital surface models (DSMs) acquired at pre- and post-event times, collapsed buildings were extracted and the results were compared with damage survey data by the municipal government and aerial optical images. Approximately 40% of severely damaged buildings showed a reduction in the average height within a footprint between the pre- and post-event DSMs. Comparing the removal process of buildings in the post-event periods with the damage classification result from the municipal government, the damage level was found to affect judgements by the owners regarding demolition and removal. View this paper
  • Issues are regarded as officially published after their release is announced to the table of contents alert mailing list.
  • You may sign up for e-mail alerts to receive table of contents of newly released issues.
  • PDF is the official format for papers published in both, html and pdf forms. To view the papers in pdf format, click on the "PDF Full-text" link, and use the free Adobe Reader to open them.
Order results
Result details
Section
Select all
Export citation of selected articles as:
20 pages, 12319 KiB  
Article
Sentinel-1 InSAR and GPS-Integrated Long-Term and Seasonal Subsidence Monitoring in Houston, Texas, USA
by Yuhao Liu, Guoquan Wang, Xiao Yu and Kuan Wang
Remote Sens. 2022, 14(23), 6184; https://doi.org/10.3390/rs14236184 - 06 Dec 2022
Cited by 6 | Viewed by 2199
Abstract
For approximately 100 years, the Houston region has been adversely impacted by land subsidence associated with excessive groundwater withdrawals. The rapidly growing population in the Houston region means the ongoing subsidence must be vigilantly monitored. Interferometric synthetic aperture radar (InSAR) has become a [...] Read more.
For approximately 100 years, the Houston region has been adversely impacted by land subsidence associated with excessive groundwater withdrawals. The rapidly growing population in the Houston region means the ongoing subsidence must be vigilantly monitored. Interferometric synthetic aperture radar (InSAR) has become a powerful tool for remotely mapping land-surface deformation over time and space. However, the humid weather and the heavy vegetation have significantly degraded the performance of InSAR techniques in the Houston region. This study introduced an approach integrating GPS and Sentinel-1 InSAR datasets for mapping long-term (2015–2019) and short-term (inter-annual, seasonal) subsidence within the greater Houston region. The root-mean-square (RMS) of the detrended InSAR-displacement time series is able to achieve a subcentimeter level, and the uncertainty (95% confidence interval) of the InSAR-derived subsidence rates is able to achieve a couple of millimeters per year for 5-year or longer datasets. The InSAR mapping results suggest the occurrence of moderate ongoing subsidence (~1 cm/year) in nothwestern Austin County, northern Waller County, western Liberty County, and the city of Mont Belvieu in Champers County. Subsidence in these areas was not recognized in previous GPS-based investigations. The InSAR mapping results also suggest that previous GPS-based investigations overestimated the ongoing subsidence in southwestern Montgomery County, but underestimated the ongoing subsidence in the northeastern portion of the county. We also compared the InSAR- and GPS-derived seasonal ground movements (subsidence and heave). The amplitudes of the seasonal signals from both datasets are comparable, below 4 mm within non-subsiding areas and over 6 mm in subsiding (>1 cm/year) areas. This study indicates that groundwater-level changes in the Evangeline aquifer are the primary reason for ongoing long-term and seasonal subsidence in the Houston region. The former is dominated by inelastic deformation, and the latter is dominated by elastic deformation. Both could cause infrastructure damage. This study demonstrated the potential of employing the GPS- and InSAR-integrated method (GInSAR) for near-real-time subsidence monitoring in the greater Houston region. The near-real-time monitoring would also provide timely information for understanding the dynamic of groundwater storage and improving both long-term and short-term groundwater resource management. Full article
Show Figures

Figure 1

16 pages, 1734 KiB  
Article
Etna Output Rate during the Last Decade (2011–2022): Insights for Hazard Assessment
by Sonia Calvari and Giuseppe Nunnari
Remote Sens. 2022, 14(23), 6183; https://doi.org/10.3390/rs14236183 - 06 Dec 2022
Cited by 6 | Viewed by 1379
Abstract
During the last two decades, the Etna volcano has undergone several sequences of lava fountaining (LF) events that have had a major impact on road conditions, infrastructure and the local population. In this paper, we consider the LF episodes occurring between 2011 and [...] Read more.
During the last two decades, the Etna volcano has undergone several sequences of lava fountaining (LF) events that have had a major impact on road conditions, infrastructure and the local population. In this paper, we consider the LF episodes occurring between 2011 and 2022, calculating their erupted volumes using the images recorded by the monitoring thermal cameras and applying a manual procedure and a dedicated software to determine the lava fountain height over time, which is necessary to obtain the erupted volume. The comparison between the results indicates the two procedures match quite well, the main differences occurring when the visibility is poor and data are interpolated. With the aim of providing insights for hazard assessment, we have fitted some probabilistic models of both the LF inter-event times and the erupted volumes of pyroclastic material. In more detail, we have tested power-law distributions against log-normal, Weibull, generalised Pareto and log-logistic. Results show that the power-law distribution is the most likely among the alternatives. This implies the lack of characteristic scales for both the inter-event time and the pyroclastic volume, which means that we have no indication as to when a new episode of LF will occur and/or how much material will be erupted. What we can reasonably say is only that short inter-event times are more frequent than long inter-event times, and that LF characterised by small volumes are more frequent than LF with high volumes. However, if the hypothesis that magma accumulates on Etna at a rate of about 0.8 m3s1 holds, the material accumulated in the source region from the beginning of the observation period (2011) to the present (2022) has already been ejected. In simple terms, there is no accumulated magma in the shallow storage that is prone to be erupted in the near future. Full article
Show Figures

Figure 1

24 pages, 9636 KiB  
Article
Time-Range Adaptive Focusing Method Based on APC and Iterative Adaptive Radon-Fourier Transform
by Jian Guan, Jiazheng Pei, Yong Huang, Xiaolong Chen and Baoxin Chen
Remote Sens. 2022, 14(23), 6182; https://doi.org/10.3390/rs14236182 - 06 Dec 2022
Cited by 2 | Viewed by 1379
Abstract
In conventional radar signal processing, the cascade of pulse compression (i.e., matched filter) and Radon-Fourier transform (RFT) can extract the estimated scattering coefficient of the target in the range-velocity dimension through long-time coherent integration (i.e., long-time focusing). However, matched filter has problems such [...] Read more.
In conventional radar signal processing, the cascade of pulse compression (i.e., matched filter) and Radon-Fourier transform (RFT) can extract the estimated scattering coefficient of the target in the range-velocity dimension through long-time coherent integration (i.e., long-time focusing). However, matched filter has problems such as range sidelobes. RFT belongs to a standard time-dimension matched filter, which will cause velocity sidelobes of strong targets. The range-velocity sidelobes caused by matched filter and RFT will mask other weak targets and affect the subsequent signal processing processes such as target detection and tracking. To suppress range-velocity sidelobes and achieve better range-velocity focusing, this paper proposes a time-range adaptive focusing method named APC-IARFT for short, which is based on adaptive pulse compression (APC) and newly proposed iterative adaptive Radon-Fourier transform (IARFT). In the APC-IARFT method, the radar time-range adaptive focusing consists of two steps: range-dimension adaptive focusing and long-time adaptive focusing in the velocity dimension. The APC method can realize range-dimension adaptive focusing and suppress range sidelobes of strong targets. Then, based on the minimum variance distortionless response (MVDR) formulation, the proposed IARFT method iteratively designs time-dimension adaptive filter of each range-velocity grid according to the received signal processed by APC to suppress velocity sidelobes of strong targets and achieve long-time adaptive focusing. Compared with the conventional cascade of matched filter and RFT, the cascade of matched filter and adaptive Radon-Fourier transform (ARFT), the results show that the proposed time-range adaptive focusing method (i.e., APC-IARFT) is competent for a variety of scenarios. Full article
(This article belongs to the Special Issue Radar High-Speed Target Detection, Tracking, Imaging and Recognition)
Show Figures

Graphical abstract

18 pages, 4593 KiB  
Article
Transmit Beampattern Design for Distributed Satellite Constellation Based on Space–Time–Frequency DoFs
by Xiaomin Tan, Chongdi Duan, Yu Li, Jinming Chen and Jianping An
Remote Sens. 2022, 14(23), 6181; https://doi.org/10.3390/rs14236181 - 06 Dec 2022
Cited by 1 | Viewed by 1606
Abstract
For distributed satellite constellations, detection performance can be equivalently regarded as a single large satellite by the cooperative operation of multiple small satellites, which is a promising research topic of the Next-Generation Radar (NGR) system. However, dense grating lobes inevitably occur in the [...] Read more.
For distributed satellite constellations, detection performance can be equivalently regarded as a single large satellite by the cooperative operation of multiple small satellites, which is a promising research topic of the Next-Generation Radar (NGR) system. However, dense grating lobes inevitably occur in the synthetic transmit pattern due to its distributed configuration, as a result of which the detection performance of dynamic coherent radar is seriously weakened. In this paper, a novel transmit beampattern optimization method for dynamic coherent radar based on a distributed satellite constellation is presented. Firstly, the effective coherent detection range interval is determined by several influence factors, i.e., coherent detection, far-field, and system link constraints. Then, we discuss the quantitative evaluation method for coherent integration in terms of synchronization error, beam pointing error, and high-speed motion characteristics and we allocate the corresponding terms in a reasonable way from the perspective of engineering. Finally, the space–time–frequency degrees of freedom (DOFs), which can be collected from satellite spacing, carrier frequencies, and platform motion characteristics, are utilized to realize a robust transmit beampattern with low sidelobe by invoking a genetic algorithm (GA). Simulation results validate the effectiveness of our theoretic analysis, and unambiguous coherent transmit beamforming with a satellite constellation of limited scale is accomplished. Full article
(This article belongs to the Special Issue Radar Techniques and Imaging Applications)
Show Figures

Graphical abstract

16 pages, 4816 KiB  
Article
Assessing Vegetation Phenology across Different Biomes in Temperate China—Comparing GIMMS and MODIS NDVI Datasets
by Jiangtao Xiao, Ke Huang, Yang Lin, Ping Ren and Jiaxing Zu
Remote Sens. 2022, 14(23), 6180; https://doi.org/10.3390/rs14236180 - 06 Dec 2022
Cited by 3 | Viewed by 1837
Abstract
Assessing vegetation phenology is very important for better understanding the impact of climate change on the ecosystem, and many vegetation index datasets from different remote sensors have been used to quantify vegetation phenology from a regional to global perspective. This study mainly analyzes [...] Read more.
Assessing vegetation phenology is very important for better understanding the impact of climate change on the ecosystem, and many vegetation index datasets from different remote sensors have been used to quantify vegetation phenology from a regional to global perspective. This study mainly analyzes the similarities and differences in phenology derived from GIMMS NDVI3g and MODIS NDVI datasets across different biomes throughout temperate China. We applied three commonly used methods to extract the start and end of the growing season (SOS and EOS) from two datasets between 2000 and 2015, and analyzed the spatio-temporal characteristics and trends of key phenological parameters between these two datasets in temperate China. Results showed that the multi-year mean GIMMS NDVI was higher than MODIS NDVI throughout most of temperate China, and the consistencies between GIMMS NDVI and MODIS NDVI for all biomes in the senescence phase were better than those in the green-up phase. NDVI differences between GIMMS and MODIS resulted in some distinctions between phenology derived from the two datasets. The results of SOS and EOS for three methods also showed wide discrepancies in spatial patterns, especially in SOS. For different biomes, differences of SOS in forests were obviously less than that in shrublands, grasslands-IM, grasslands-QT and meadows, whereas the differences of EOS in forests were relatively greater than that in SOS. Moreover, large differences of phenological trends were found between GIMMS and MODIS datasets from 2000 to 2015 in entire region and different biomes, and it is particularly noteworthy that both SOS and EOS showed a low proportion of the identical significant trends. The results suggested NDVI datasets obtained from GIMMS and MODIS sensors could induce the differences of the inversion of vegetation phenology in some degree due to the differences of instrumental characteristics between these two sensors. These findings highlighted that inter-calibrate datasets derived from different satellite sensors for some biomes (e.g., grasslands) should be needed when analyzing land surface phenology and their trends, and also provided baseline information for choosing different NDVI datasets in subsequent studies on vegetation patterns and dynamics. Full article
Show Figures

Figure 1

34 pages, 14793 KiB  
Article
Epoch-Based Height Reference System for Sea Level Rise Impact Assessment on the Coast of Peninsular Malaysia
by Sanusi Cob, Majid Kadir, Rene Forsberg, Wim Simons, Marc Naeije, Ami Hassan Din, Husaini Yacob, Asyran Amat, Daud Mahdzur, Zuhairy Ibrahim, Kenidi Aziz, Norehan Yaacob, Felix Johann, Tim Jensen, Hergeir Teitsson, Shahrum Ses, Anim Yahaya, Soeb Nordin and Fadhil Majid
Remote Sens. 2022, 14(23), 6179; https://doi.org/10.3390/rs14236179 - 06 Dec 2022
Cited by 2 | Viewed by 2598
Abstract
The Peninsular Malaysia Geodetic Vertical Datum 2000 (PMGVD2000) inherited several deficiencies due to offsets between local datums used, levelling error propagations, land subsidence, sea level rise, and sea level slopes along the southern half of the Malacca Strait on the west coast and [...] Read more.
The Peninsular Malaysia Geodetic Vertical Datum 2000 (PMGVD2000) inherited several deficiencies due to offsets between local datums used, levelling error propagations, land subsidence, sea level rise, and sea level slopes along the southern half of the Malacca Strait on the west coast and the South China Sea in the east coast of the Peninsular relative to the Port Klang (PTK) datum point. To cater for a more reliable elevation-based assessment of both sea level rise and coastal flooding exposure, a new epoch-based height reference system PMGVD2022 has been developed. We have undertaken the processing of more than 30 years of sea level data from twelve tide gauge (TG) stations along the Peninsular Malaysia coast for the determination of the relative mean sea level (RMSL) at epoch 2022.0 with their respective trends and incorporates the quantification of the local vertical land motion (VLM) impact. PMGVD2022 is based on a new gravimetric geoid (PMGeoid2022) fitted to the RMSL at PTK. The orthometric height is realised through the GNSS levelling concept H = hGNSS–Nfit_PTK–NRMDT, where NRMDT is a constant offset due to the relative mean dynamic ocean topography (RMDT) between the fitted geoid at PTK and the local MSL datums along the Peninsular Malaysia coast. PMGVD2022 will become a single height reference system with absolute accuracies of better than ±3 cm and ±10 cm across most of the land/coastal area and the continental shelf of Peninsular Malaysia, respectively. Full article
Show Figures

Figure 1

19 pages, 5467 KiB  
Article
Improved Dempster–Shafer Evidence Theory for Tunnel Water Inrush Risk Analysis Based on Fuzzy Identification Factors of Multi-Source Geophysical Data
by Yulin Ding, Binru Yang, Guangchun Xu and Xiaoyong Wang
Remote Sens. 2022, 14(23), 6178; https://doi.org/10.3390/rs14236178 - 06 Dec 2022
Cited by 4 | Viewed by 1459
Abstract
Water inrush is one of the most important risk factors in tunnel construction because of its abruptness and timeliness. Various geophysical data used in actual construction contain useful information related to groundwater development. However, the existing approaches with such data from multiple sources [...] Read more.
Water inrush is one of the most important risk factors in tunnel construction because of its abruptness and timeliness. Various geophysical data used in actual construction contain useful information related to groundwater development. However, the existing approaches with such data from multiple sources and sensors are generally independent and cannot integrate this information, leading to inaccurate projections. In addition, existing tunnel advanced geological forecast reports for risk projections interpreted by human operators generally contain no quantitative observations or measurements, but only consist of ambiguous and uncertain qualitative descriptions. To surmount the problems above, this paper proposes a tunnel water inrush risk analysis method by fusing multi-source geophysical observations with fuzzy identification factors. Specifically, the membership function of the fuzzy set is used to solve the difficulty in determining the basic probability assignment function in the improved Dempster–Shafer evidence theory. The prediction model of effluent conditions fuses seismic wave reflection data, ground penetrating radar data, and transient electromagnetic data. Therefore, quantitative evaluations of the effluent conditions are achieved, including the strand water, linear water, seepage and dripping water, and anhydrous. Experimental evaluations with a typical tunnel section were conducted, in which the state of the groundwater from a series of geological sketch reports in this sectionpaper were used as ground truth for verification. The experimental results revealed that the proposed method not only has high accuracy and robustness but also aligns well with different evidence effectively that generally contradicts manual interpretation reports. The results from 12 randomly selected tunnel sections also demonstrate the generalization abilities of the proposed method. Full article
(This article belongs to the Special Issue Multi-Data Applied to Near-Surface Geophysics)
Show Figures

Figure 1

21 pages, 19464 KiB  
Article
All-Weather and Superpixel Water Extraction Methods Based on Multisource Remote Sensing Data Fusion
by Xiaopeng Chen, Fang Gao, Yingye Li, Bin Wang and Xiaojie Li
Remote Sens. 2022, 14(23), 6177; https://doi.org/10.3390/rs14236177 - 06 Dec 2022
Cited by 2 | Viewed by 1265
Abstract
The high spatial and temporal resolution of water body data offers valuable guidance for disaster monitoring and assessment. These data can be employed to quickly identify water bodies, especially small water bodies, and to accurately locate affected areas, which is significant for protecting [...] Read more.
The high spatial and temporal resolution of water body data offers valuable guidance for disaster monitoring and assessment. These data can be employed to quickly identify water bodies, especially small water bodies, and to accurately locate affected areas, which is significant for protecting people’s lives and property. However, the application of optical remote sensing is often limited by clouds and fog during actual floods. In this paper, water extraction methods of the multisource data fusion model (MDFM) and superpixel water extraction model (SWEM) are proposed, in which the MDFM fuses optical and synthetic aperture radar (SAR) images, and all-weather water extraction is achieved by using spectral information of optical images, texture information and the good penetration performance of SAR images. The SWEM further improves the accuracy of the water boundary with superpixel decomposition for extracted water boundaries using the fully constrained least squares (FCLS) method. The results show that the correlation coefficient (r) and area accuracy (Parea) of the MDFM and SWEM are improved by 2.22% and 9.20% (without clouds), respectively, and 3.61% and 18.99% (with clouds), respectively, compared with the MDFM, and 41.54% and 85.09% (without clouds), respectively, and 32.31% and 84.31% (with clouds), respectively, compared with the global surface water product of the European Commission Joint Research Centre’s Global Surface Water Explorer (JRC-GSWE). The MDFM and SWEM can extract water bodies with all weather and superpixel and improve the temporal and spatial resolution of water extraction, which has obvious advantages. Full article
(This article belongs to the Section Remote Sensing in Geology, Geomorphology and Hydrology)
Show Figures

Figure 1

21 pages, 3390 KiB  
Article
Estimation of Human Body Height Using Consumer-Level UAVs
by Andrea Tonini, Marco Painho and Mauro Castelli
Remote Sens. 2022, 14(23), 6176; https://doi.org/10.3390/rs14236176 - 06 Dec 2022
Cited by 2 | Viewed by 1745
Abstract
Consumer-level UAVs are often employed for surveillance, especially in urban areas. Within this context, human recognition via estimation of biometric traits, like body height, is of pivotal relevance. Previous studies confirmed that the pinhole model could be used for this purpose, but only [...] Read more.
Consumer-level UAVs are often employed for surveillance, especially in urban areas. Within this context, human recognition via estimation of biometric traits, like body height, is of pivotal relevance. Previous studies confirmed that the pinhole model could be used for this purpose, but only if the accurate distance between the aerial camera and the target is known. Unfortunately, low positional accuracy of the drones and the difficulties of retrieving the coordinates of a moving target like a human may prevent reaching the required level of accuracy. This paper proposes a novel solution that may overcome this issue. It foresees calculating the relative altitude of the drone from the target by knowing only the ground distance between two points visible in the image. This relative altitude can be then used to calculate the target-to-camera distance without using the coordinates of the drone or the target. The procedure was verified with real data collected with a quadcopter, first considering a controlled environment with a wooden pole of known height and then a person in a more realistic scenario. The verification confirmed that a high level of accuracy can be reached, even with regular market drones. Full article
Show Figures

Figure 1

20 pages, 4562 KiB  
Article
Long-Term Spatiotemporal Variability of Whitings in Lake Geneva from Multispectral Remote Sensing and Machine Learning
by Gaël Many, Nicolas Escoffier, Michele Ferrari, Philippe Jacquet, Daniel Odermatt, Gregoire Mariethoz, Pascal Perolo and Marie-Elodie Perga
Remote Sens. 2022, 14(23), 6175; https://doi.org/10.3390/rs14236175 - 06 Dec 2022
Cited by 1 | Viewed by 1868
Abstract
Whiting events are massive calcite precipitation events turning hardwater lake waters to a milky turquoise color. Herein, we use a multispectral remote sensing approach to describe the spatial and temporal occurrences of whitings in Lake Geneva from 2013 to 2021. Landsat-8, Sentinel-2, and [...] Read more.
Whiting events are massive calcite precipitation events turning hardwater lake waters to a milky turquoise color. Herein, we use a multispectral remote sensing approach to describe the spatial and temporal occurrences of whitings in Lake Geneva from 2013 to 2021. Landsat-8, Sentinel-2, and Sentinel-3 sensors are combined to derive the AreaBGR index and identify whitings using appropriate filters. 95% of the detected whitings are located in the northeastern part of the lake and occur in a highly reproducible environmental setting. An extended time series of whitings in the last 60 years is reconstructed from a random forest algorithm and analyzed through a Bayesian decomposition for annual and seasonal trends. The annual number of whiting days between 1958 and 2021 does not follow any particular monotonic trend. The inter-annual changes of whiting occurrences significantly correlate to the Western Mediterranean Oscillation Index. Spring whitings have increased since 2000 and significantly follow the Atlantic Multidecadal Oscillation index. Future climate change in the Mediterranean Sea and the Atlantic Ocean could induce more variable and earlier whiting events in Lake Geneva. Full article
Show Figures

Figure 1

17 pages, 6078 KiB  
Article
An Empirical Grid Model for Precipitable Water Vapor
by Xinzhi Wang, Fayuan Chen, Fuyang Ke and Chang Xu
Remote Sens. 2022, 14(23), 6174; https://doi.org/10.3390/rs14236174 - 06 Dec 2022
Cited by 4 | Viewed by 1396
Abstract
Atmospheric precipitable water vapor (PWV) is a key variable for weather forecast and climate research. Various techniques (e.g., radiosondes, global navigation satellite system, satellite remote sensing and reanalysis products by data assimilation) can be used to measure (or retrieve) PWV. However, gathering PWV [...] Read more.
Atmospheric precipitable water vapor (PWV) is a key variable for weather forecast and climate research. Various techniques (e.g., radiosondes, global navigation satellite system, satellite remote sensing and reanalysis products by data assimilation) can be used to measure (or retrieve) PWV. However, gathering PWV data with high spatial and temporal resolutions remains a challenge. In this study, we propose a new empirical PWV grid model (called ASV-PWV) using the zenith wet delay from the Askne model and improved by the spherical harmonic function and vertical correction. Our method is convenient and enables the user to gain PWV data with only four input parameters (e.g., the longitude and latitude, time, and atmospheric pressure of the desired position). Profiles of 20 radiosonde stations in Qinghai Tibet Plateau, China, along with the latest publicly available C-PWVC2 model are used to validate the local performance. The PWV data from ASV-PWV and C-PWVC2 is generally consistent with radiosonde (the average annual bias is −0.44 mm for ASV-PWV and −1.36 mm for C-PWVC2, the root mean square error (RMSE) is 3.44 mm for ASV-PWV and 2.51 mm for C-PWVC2, respectively). Our ASV-PWV performs better than C-PWVC2 in terms of seasonal characteristics. In general, a sound consistency exists between PWV values of ASV-PWV and the fifth generation of European Centre for Medium-Range Weather Forecasts Atmospheric Reanalysis (ERA5) (total 7381 grid points in 2020). The average annual bias and RMSE are −0.73 mm and 4.28 mm, respectively. ASV-PWV has a similar performance as ERA5 reanalysis products, indicating that ASV-PWV is a potentially alternative option for rapidly gaining PWV. Full article
Show Figures

Figure 1

19 pages, 5334 KiB  
Article
Swidden Agriculture Landscape Mapping Using MODIS Vegetation Index Time Series and Its Spatio-Temporal Dynamics in Northern Laos
by Peng Li and Yin Yang
Remote Sens. 2022, 14(23), 6173; https://doi.org/10.3390/rs14236173 - 06 Dec 2022
Cited by 4 | Viewed by 2147
Abstract
Swidden agriculture or shifting cultivation is still being widely practiced in tropical developing countries and Laos has spared no effort to eradicate it since the mid-1990s. So far, the development of swidden agriculture in this land-locked mountainous country during the 2000–2020 bi-decade remains [...] Read more.
Swidden agriculture or shifting cultivation is still being widely practiced in tropical developing countries and Laos has spared no effort to eradicate it since the mid-1990s. So far, the development of swidden agriculture in this land-locked mountainous country during the 2000–2020 bi-decade remains poorly examined. Moderate-resolution Imaging Spectroradiometer (MODIS) time-series products have shown potential in monitoring vegetative status; however, only extremely limited cases of remote sensing of swidden agriculture landscapes have been reported. Taking northern Laos as a study area and using 2001–2020 MODIS vegetation indices products, the Savitzky–Golay filter, the Mann–Kendall trend test and a threshold method were employed to delineate and monitor annual patterns and dynamics of swidden agriculture landscape at the village level. The results showed that: MODIS Normalized Difference Vegetation Index (NDVI) time series perform better in delineating the temporal development of swidden agriculture. The swidden agriculture landscape has shown a general descending trend in the past decades, especially in the 2010s, with an annual average of 14.70 × 10⁴ ha. The total number of swidden-practicing villages (or districts) also displayed a declining trend and there were 957 villages or 91 districts practicing it continuously between 2001 and 2020. An average of 32 villages per year or two districts per decade highlights the difficulty in ending swidden agriculture in Laos, although the government of Laos has established a number of policies for the eradication of swidden agriculture by 2020. This study provides a necessary methodological reference for monitoring a two-decade evolution and transformation of swidden agriculture in the tropics. Full article
(This article belongs to the Special Issue Forest Disturbance Monitoring Using Satellite Remote Sensing)
Show Figures

Graphical abstract

19 pages, 6780 KiB  
Article
Investigating the Impact of the Spatiotemporal Bias Correction of Precipitation in CMIP6 Climate Models on Drought Assessments
by Xin Wang, Jiawei Yang, Junnan Xiong, Gaoyun Shen, Zhiwei Yong, Huaizhang Sun, Wen He, Siyuan Luo and Xingjie Cui
Remote Sens. 2022, 14(23), 6172; https://doi.org/10.3390/rs14236172 - 06 Dec 2022
Cited by 3 | Viewed by 1512
Abstract
Precipitation of future climate models is critical for the assessments of future drought but contains large systematic biases over the Tibetan Plateau. Although the common precipitation bias correction method, quantile mapping has achieved remarkable results in terms of temporal bias correction, it does [...] Read more.
Precipitation of future climate models is critical for the assessments of future drought but contains large systematic biases over the Tibetan Plateau. Although the common precipitation bias correction method, quantile mapping has achieved remarkable results in terms of temporal bias correction, it does not consider the spatial distribution of bias. Furthermore, the extent to which precipitation bias affects drought estimation remains unclear. In our study, we take the Qinghai–Tibet Plateau (QHTP) as the case study and quantify the impact of corrected precipitation bias for seven Coupled Model Intercomparison Project Phase 6 (CMIP6) models on drought assessment in historical and future scenarios (SSP1-2.6, SSP2-4.5, and SSP5-8.5). To improve the accuracy of drought prediction, potential evapotranspiration (PET) was also corrected. Firstly, the histogram matching-quantile mapping (HQ) algorithm considering spatial correction is established to correct precipitation and PET. Then, we quantified the effects of precipitation and potential evapotranspiration correction on the change of drought intensity, and finally analyzed the spatiotemporal trends of precipitation, PET, and SPEI over the QHTP in the future. The results show that the HQ method can effectively improve the simulation ability of the model, especially the simulation accuracy of the ensemble model. After correction, the average annual total precipitation (TP) declined by 64.262% in 99.952% of QHTP, the average PET increased in 11.902% of the area and decreased in 88.098% of the area, while the intensity of the drought in 81.331% of the area increased by 2.875% and the 18.669% area decreased by 1.139%. Therefore, the uncorrected simulation data overestimated the future increase trend in precipitation and underestimated the future decrease trend in SPEI. The trend of HQ-corrected TP increased by 3.730 mm/10a, 7.190 mm/10a, and 12.790 mm/10a, and the trend of SPEI (TP and PET corrected) decreased by 0.143/100a, 0.397/100a, and 0.675/100a, respectively. Therefore, quantifying the changing relationship between precipitation bias correction and drought assessments is useful for understanding regional climate change. Full article
(This article belongs to the Section Atmospheric Remote Sensing)
Show Figures

Figure 1

24 pages, 18321 KiB  
Article
Training Machine Learning Algorithms Using Remote Sensing and Topographic Indices for Corn Yield Prediction
by Mailson Freire de Oliveira, Brenda Valeska Ortiz, Guilherme Trimer Morata, Andrés-F Jiménez, Glauco de Souza Rolim and Rouverson Pereira da Silva
Remote Sens. 2022, 14(23), 6171; https://doi.org/10.3390/rs14236171 - 06 Dec 2022
Cited by 6 | Viewed by 2751
Abstract
Methods using remote sensing associated with artificial intelligence to forecast corn yield at the management zone level can help farmers understand the spatial variability of yield before harvesting. Here, spectral bands, topographic wetness index, and topographic position index were integrated to predict corn [...] Read more.
Methods using remote sensing associated with artificial intelligence to forecast corn yield at the management zone level can help farmers understand the spatial variability of yield before harvesting. Here, spectral bands, topographic wetness index, and topographic position index were integrated to predict corn yield at the management zone using machine learning approaches (e.g., extremely randomized trees, gradient boosting machine, XGBoost algorithms, and stacked ensemble models). We tested four approaches: only spectral bands, spectral bands + topographic position index, spectral bands + topographic wetness index, and spectral bands + topographic position index + topographic wetness index. We also explored two approaches for model calibration: the whole-field approach and the site-specific model at the management zone level. The model’s performance was evaluated in terms of accuracy (mean absolute error) and tendency (estimated mean error). The results showed that it is possible to predict corn yield with reasonable accuracy using spectral crop information associated with the topographic wetness index and topographic position index during the flowering growth stage. Site-specific models increase the accuracy and reduce the tendency of corn yield forecasting on management zones with high, low, and intermediate yields. Full article
Show Figures

Graphical abstract

19 pages, 6314 KiB  
Article
A Filtering Method for LiDAR Point Cloud Based on Multi-Scale CNN with Attention Mechanism
by Bin Wang, Hao Wang and Dongmei Song
Remote Sens. 2022, 14(23), 6170; https://doi.org/10.3390/rs14236170 - 06 Dec 2022
Cited by 5 | Viewed by 2143
Abstract
Point cloud filtering is an important prerequisite for three-dimensional surface modeling with high precision based on LiDAR data. To cope with the issues of low filtering accuracy or excessive model complexity in traditional filtering algorithms, this paper proposes a filtering method for LiDAR [...] Read more.
Point cloud filtering is an important prerequisite for three-dimensional surface modeling with high precision based on LiDAR data. To cope with the issues of low filtering accuracy or excessive model complexity in traditional filtering algorithms, this paper proposes a filtering method for LiDAR point cloud based on a multi-scale convolutional neural network incorporated with the attention mechanism. Firstly, a regular image patch centering on each point is constructed based on the elevation information of point clouds. As thus, the point cloud filtering problem is transformed into the image classification problem. Then, considering the ability of multi-scale convolution to extract features at different scales and the potential of the attention mechanism to capture key information in images, a multi-scale convolutional neural network framework is constructed, and the attention mechanism is incorporated to coordinate multi-scale convolution kernel with channel and spatial attention modules. After this, the feature maps of the LiDAR point clouds can be acquired at different scales. For these feature maps, the weights of each channel layer and different spatial regions can be further tuned adaptively, which makes the network training more targeted, thereby improving the model performance for image classification and eventually separating of ground points and non-ground points preferably. Finally, the proposed method is compared with the cloth simulation filtering method (CSF), deep neural network method (DNN), k-nearest neighbor method (KNN), deep convolutional neural network method (DCNN) and scale-irrelevant and terrain-adaptive method (SITA) for the standard ISPRS dataset of point cloud filtering and the filter dataset of Qinghai. The experimental results show that the proposed method can obtain lower classification errors, which proves the superiority of this method in point cloud filtering. Full article
Show Figures

Graphical abstract

15 pages, 5264 KiB  
Technical Note
Interannual Variabilities of the Southern Bay of Bengal Cold Pool Associated with the El Niño–Southern Oscillation
by Jianjie Feng, Yun Qiu, Changming Dong, Xutao Ni, Wenshu Lin, Hui Teng and Aijun Pan
Remote Sens. 2022, 14(23), 6169; https://doi.org/10.3390/rs14236169 - 06 Dec 2022
Cited by 4 | Viewed by 1176
Abstract
The southern Bay of Bengal (BOB) cold pool (SCP) plays an important role in the regional climate fluctuation of the BOB. However, the interannual variability in the SCP is still unknown. Multisource satellite remote sensing data and assimilation have been applied to explore [...] Read more.
The southern Bay of Bengal (BOB) cold pool (SCP) plays an important role in the regional climate fluctuation of the BOB. However, the interannual variability in the SCP is still unknown. Multisource satellite remote sensing data and assimilation have been applied to explore the interannual variability in the SCP and its relationship with El Niño–Southern Oscillation (ENSO) events for the period 1982–2020. The anomalous SST of the SCP in the summer following the peak phase (i.e., winter) of the ENSO was closely related to the ENSO events. El Niño (La Niña)-induced the warm (cold) anomaly of the SCP starting from May and persisted throughout August with a peak value appearing in June during the El Niño (La Niña) decaying years. In the El Niño decaying years, the southwest monsoon current (SMC) was weakened, forced locally by the weakening southwesterly wind and remotely by the easterly wind anomaly at the equator associated with El Niño. The El Niño-related weakening SMC and the associated less cold advection led to the warm anomaly of the SCP. In addition, El Niño-related atmospheric heating also made a comparable contribution to the evolution of the SCP’s SST. In the early stage (15 May to 10 June), its contribution to the warming of the SCP was much larger than that of the SMC, whereas from mid-June to August, it reversed to have a cooling effect and partially offset the advection heating induced by the SMC on the SCP. In the La Niña decaying years, similar oceanic and atmospheric processes operated but in an opposite way. Full article
Show Figures

Figure 1

22 pages, 20353 KiB  
Article
Satellite Radar and Camera Time Series Reveal Transition from Aligned to Distributed Crater Arrangement during the 2021 Eruption of Cumbre Vieja, La Palma (Spain)
by Valeria Muñoz, Thomas R. Walter, Edgar U. Zorn, Alina V. Shevchenko, Pablo J. González, Diego Reale and Eugenio Sansosti
Remote Sens. 2022, 14(23), 6168; https://doi.org/10.3390/rs14236168 - 06 Dec 2022
Cited by 10 | Viewed by 3055
Abstract
Magma-filled dikes may feed erupting fissures that lead to alignments of craters developing at the surface, yet the details of activity and migrating eruptions at the crater row are difficult to monitor and are hardly understood. The 2021 Tajogaite eruption at the Cumbre [...] Read more.
Magma-filled dikes may feed erupting fissures that lead to alignments of craters developing at the surface, yet the details of activity and migrating eruptions at the crater row are difficult to monitor and are hardly understood. The 2021 Tajogaite eruption at the Cumbre Vieja, La Palma (Spain), lasted 85 days and developed a pronounced alignment of craters that may be related to changes within the volcano edifice. Here, we use COSMO-SkyMed satellite radar data and ground-based time-lapse photographs, offering a high-resolution dataset to explore the locations and characteristics of evolving craters. Our results show that the craters evolve both gradually and suddenly and can be divided into three main phases. Phase 1, lasting the first 6 weeks of the eruption, was characterized by a NW–SE linear evolution of up to seven craters emerging on the growing cone. Following two partial collapses of the cone to the northwest and a seismicity increase at depth, Phase 2 started and caused a propagation of the main activity toward the southeastern side, together with the presence of up to 11 craters along this main NW–SE trend. Associated with strong deep and shallow earthquakes, Phase 3 was initiated and continued for the final 2 weeks of the eruption, expressed by the development of up to 18 craters, which became dominant and clustered in the southeastern sector in early December 2021. In Phase 3, a second and oblique alignment and surface fracture was identified. Our findings that crater and eruption changes coincide together with an increase in seismic activity at depth point to a deep driver leading to crater and morphology changes at the surface. These also suggest that crater distributions might allow for improved monitoring of changes occurring at depth, and vice versa, such that strong seismicity changes at depth may herald the migration and new formation of craters, which have major implications for the assessment of tephra and lava flow hazards on volcanoes. Full article
(This article belongs to the Special Issue Assessment and Prediction of Volcano Hazard Using Remote Sensing)
Show Figures

Graphical abstract

24 pages, 15994 KiB  
Article
Optimization Method of Airborne LiDAR Individual Tree Segmentation Based on Gaussian Mixture Model
by Zhenyu Zhang, Jian Wang, Zhiyuan Li, Youlong Zhao, Ruisheng Wang and Ayman Habib
Remote Sens. 2022, 14(23), 6167; https://doi.org/10.3390/rs14236167 - 05 Dec 2022
Cited by 2 | Viewed by 1682
Abstract
Forests are the main part of the terrestrial ecosystem. Airborne LiDAR is fast, comprehensive, penetrating, and contactless and can depict 3D canopy information with a high efficiency and accuracy. Therefore, it plays an important role in forest ecological protection, tree species recognition, carbon [...] Read more.
Forests are the main part of the terrestrial ecosystem. Airborne LiDAR is fast, comprehensive, penetrating, and contactless and can depict 3D canopy information with a high efficiency and accuracy. Therefore, it plays an important role in forest ecological protection, tree species recognition, carbon sink calculation, etc. Accurate recognition of individual trees in forests is a key step to various application. In real practice, however, the accuracy of individual tree segmentation (ITS) is often compromised by under-segmentation due to the diverse species, obstruction and understory trees typical of a high-density multistoried mixed forest area. Therefore, this paper proposes an ITS optimization method based on Gaussian mixture model for airborne LiDAR data. First, the mean shift (MS) algorithm is used for the initial ITS of the pre-processed airborne LiDAR data. Next, under-segmented samples are extracted by integrated learning, normally segmented samples are classified by morphological approximation, and the approximate distribution uncertainty of the normal samples is described with a covariance matrix. Finally, the class composition among the under-segmented samples is determined, and the under-segmented samples are re-segmented using Gaussian mixture model (GMM) clustering, in light of the optimal covariance matrix of the corresponding categories. Experiments with two datasets, Trento and Qingdao, resulted in ITS recall of 94% and 96%, accuracy of 82% and 91%, and F-scores of 0.87 and 0.93. Compared with the MS algorithm, our method is more accurate and less likely to under-segment individual trees in many cases. It can provide data support for the management and conservation of high-density multistoried mixed forest areas. Full article
(This article belongs to the Special Issue 3D Point Clouds in Forest Remote Sensing II)
Show Figures

Figure 1

23 pages, 8316 KiB  
Article
Spatial Heterogeneity and Temporal Variation in Urban Surface Albedo Detected by High-Resolution Satellite Data
by Hantian Wu, Bo Huang, Zhaoju Zheng, Zonghan Ma and Yuan Zeng
Remote Sens. 2022, 14(23), 6166; https://doi.org/10.3390/rs14236166 - 05 Dec 2022
Cited by 2 | Viewed by 2162
Abstract
Albedo is one of the key parameters in the surface energy balance and it has been altered due to urban expansion, which has significant impacts on local and regional climate. Many previous studies have demonstrated that changes in the urban surface albedo are [...] Read more.
Albedo is one of the key parameters in the surface energy balance and it has been altered due to urban expansion, which has significant impacts on local and regional climate. Many previous studies have demonstrated that changes in the urban surface albedo are strongly related to the city’s heterogeneity and have significant spatial-temporal characteristics but fail to address the albedo of the urban surface as a unique variable in urban thermal environment research. This study selects Beijing as the experimental area for exploring the spatial-temporal characteristics of the urban surface albedo and the albedo’s uniqueness in environmental research on urban spaces. Our results show that the urban surface albedo at high spatial resolution can better represent the urban spatial heterogeneity, seasonal variation, building canyon, and pixel adjacency effects. Urban surface albedo is associated with building density and height, land surface temperature (LST), and fractional vegetation cover (FVC). Furthermore, albedo can reflect livability and environmental rating due to the variances of building materials and architectural formats in the urban development. Hence, we argue that the albedo of the urban surface can be considered as a unique variable for improving the acknowledgment of the urban environment and human livability with wider application in urban environmental research. Full article
(This article belongs to the Special Issue Remote Sensing of Ecosystems)
Show Figures

Graphical abstract

19 pages, 5829 KiB  
Article
Spatial Dynamics and Predictive Analysis of Vegetation Cover in the Ouémé River Delta in Benin (West Africa)
by Abdel Aziz Osseni, Hubert Olivier Dossou-Yovo, Gbodja Houéhanou François Gbesso, Toussaint Olou Lougbegnon and Brice Sinsin
Remote Sens. 2022, 14(23), 6165; https://doi.org/10.3390/rs14236165 - 05 Dec 2022
Cited by 1 | Viewed by 1846
Abstract
The vegetation cover of the Ouémé Delta constitutes a biodiversity hotspot for the wetlands in southern Benin. However, the overexploitation of natural resources in addition to the intensification of agricultural practices led to the degradation of the natural ecosystems in this region. The [...] Read more.
The vegetation cover of the Ouémé Delta constitutes a biodiversity hotspot for the wetlands in southern Benin. However, the overexploitation of natural resources in addition to the intensification of agricultural practices led to the degradation of the natural ecosystems in this region. The present work aims to reconstruct, using remote sensing, the spatial dynamics of land use in the Ouémé Delta in order to assess the recent changes and predict the trends in its vegetation cover. The methodology was based on remote sensing and GIS techniques. Altogether, this process helped us carry out the classification of Landsat images for a period of 30 years (stating year 1990, 2005, and 2020) via the Envi software. The spatial statistics resulting from this processing were combined using ArcGIS software to establish the transition matrices in order to monitor the conversion rates of the land cover classes obtained. Then, the prediction of the plant landscape by the year 2035 was performed using the “Land Change Modeler” extension available under IDRISI. The results showed seven (07) classes of occupation and land use. There were agglomerations, mosaics of fields and fallow land, water bodies, dense forests, gallery forests, swamp forests, and shrubby wooded savannahs. The observation of the vegetation cover over the period of 15 years from 1990 to 2005 showed a decrease from 71.55% to 63.42% in the surface area of the Ouémé Delta. A similar trend was noticed from 2005 to 2020 when it reached 55.19%, entailing a loss of 16.37% of the surface area of natural habitats in 30 years. The two drivers of such changes are the fertility of alluvial soils for agriculture along and urbanization. The predictive modeling developed for 2035 reveals a slight increase in the area of dense forests and shrubby wooded savannas, contrary to the lack of significant decrease in the area of gallery forests and swamp forests. This is key information that is expected to be useful to both policy and decision makers involved in the sustainable management and conservation of natural resources in the study area. Full article
(This article belongs to the Special Issue Advances in Remote Sensing for Environmental Monitoring)
Show Figures

Graphical abstract

11 pages, 3946 KiB  
Editorial
Recent Advances in Modelling Geodetic Time Series and Applications for Earth Science and Environmental Monitoring
by Xiaoxing He, Jean-Philippe Montillet, Zhao Li, Gaël Kermarrec, Rui Fernandes and Feng Zhou
Remote Sens. 2022, 14(23), 6164; https://doi.org/10.3390/rs14236164 - 05 Dec 2022
Cited by 1 | Viewed by 2214
Abstract
Geodesy is the science of accurately measuring the topography of the earth (geometric shape and size), its orientation in space, and its gravity field. With the advances in our knowledge and technology, this scientific field has extended to the understanding of geodynamical phenomena [...] Read more.
Geodesy is the science of accurately measuring the topography of the earth (geometric shape and size), its orientation in space, and its gravity field. With the advances in our knowledge and technology, this scientific field has extended to the understanding of geodynamical phenomena such as crustal motion, tides, and polar motion. This Special Issue is dedicated to the recent advances in modelling geodetic time series recorded using various instruments. Due to the stochastic noise properties inherent in each of the time series, careful modelling is necessary in order to extract accurate geophysical information with realistic associated uncertainties (statistically sufficient). The analyzed data have been recorded with various space missions or ground-based instruments. It is impossible to be comprehensive in the vast and dynamic field that is Geodesy, particularly so-called “Environmental Geodesy”, which intends to understand the Earth’s geodynamics by monitoring any changes in our environment. This field has gained much attention in the past two decades due to the need by the international community to understand how climate change modifies our environment. Therefore, this Special Issue collects some articles which emphasize the recent development of specific algorithms or methodologies to study particular natural phenomena related to the geodynamics of the earth’s crust and climate change. Full article
Show Figures

Figure 1

22 pages, 5553 KiB  
Article
Trend Analysis and Driving Factors of Vegetation Dynamics in Northern China from 1982 to 2015
by Rui Sun, Shaohui Chen and Hongbo Su
Remote Sens. 2022, 14(23), 6163; https://doi.org/10.3390/rs14236163 - 05 Dec 2022
Cited by 5 | Viewed by 1639
Abstract
Under the background of global warming, understanding the dynamic of vegetation plays a key role in revealing the structure and function of an ecosystem. Assessing the impact of climate change and human activities on vegetation dynamics is crucial for policy formulation and ecological [...] Read more.
Under the background of global warming, understanding the dynamic of vegetation plays a key role in revealing the structure and function of an ecosystem. Assessing the impact of climate change and human activities on vegetation dynamics is crucial for policy formulation and ecological protection. Based on the Global Inventory Monitoring and Modeling System (GIMMS) third generation of Normalized Difference Vegetation Index (NDVI3g), meteorological data and land cover data, this study analyzed the linear and nonlinear trends of vegetation in northern China from 1982 to 2015, and quantified the relative impact of climate change and human activities on vegetation change. The results showed that more than 53% of the vegetation had changed significantly, and 36.64% of the vegetation had a reverse trend. There were potential risks of vegetation degradation in the southwestern, northwestern and northeastern parts of the study’s area. The linear analysis method cannot disclose the reversal of the vegetation growth trend, which will underestimate or overestimate the risk of vegetation degradation or restoration. Climate change and human activities promoted 76.54% of the vegetation growth in the study area, with an average contribution rate of 51.22% and 48.78%, respectively, while the average contribution rate to the vegetation degradation area was 47.43% and 52.57%, respectively. Vegetation restoration of grassland and woodland was mainly affected by climate change, and human activities dominated their degradation, while cropland vegetation was opposite. The contribution rate of human activities to vegetation change in the southeastern and eastern parts of the study area was generally higher than that of climate change, but it was the opposite in the high altitude area, with obvious spatial heterogeneity. These results are helpful to understand the dynamic mechanism of vegetation in northern China, and provide a scientific basis for vegetation restoration and protection of regional ecosystems. Full article
Show Figures

Graphical abstract

30 pages, 8911 KiB  
Article
Remote Monitoring of Mediterranean Hurricanes Using Infrasound
by Constantino Listowski, Edouard Forestier, Stavros Dafis, Thomas Farges, Marine De Carlo, Florian Grimaldi, Alexis Le Pichon, Julien Vergoz, Philippe Heinrich and Chantal Claud
Remote Sens. 2022, 14(23), 6162; https://doi.org/10.3390/rs14236162 - 05 Dec 2022
Cited by 2 | Viewed by 2445
Abstract
Mediterranean hurricanes, or medicanes, are tropical-like cyclones forming once or twice per year over the waters of the Mediterranean Sea. These mesocyclones pose a serious threat to coastal infrastructure and lives because of their strong winds and intense rainfall. Infrasound technology has already [...] Read more.
Mediterranean hurricanes, or medicanes, are tropical-like cyclones forming once or twice per year over the waters of the Mediterranean Sea. These mesocyclones pose a serious threat to coastal infrastructure and lives because of their strong winds and intense rainfall. Infrasound technology has already been employed to investigate the acoustic signatures of severe weather events, and this study aims at characterizing, for the first time, the infrasound detections that can be related to medicanes. This work also contributes to infrasound source discrimination efforts in the context of the Comprehensive Nuclear-Test-Ban Treaty. We use data from the infrasound station IS48 of the International Monitoring System in Tunisia to investigate the infrasound signatures of mesocyclones using a multi-channel correlation algorithm. We discuss the detections using meteorological fields to assess the presence of stratospheric waveguides favoring propagation. We corroborate the detections by considering other datasets, such as satellite observations, a surface lightning detection network, and products mapping the simulated intensity of the swell. High- and low-frequency detections are evidenced for three medicanes at distances ranging between 250 and 1100 km from the station. Several cases of non-detection are also discussed. While deep convective systems, and mostly lightning within them, seem to be the main source of detections above 1 Hz, hotspots of swell (microbarom) related to the medicanes are evidenced between 0.1 and 0.5 Hz. In the latter case, simulations of microbarom detections are consistent with the observations. Multi-source situations are highlighted, stressing the need for more resilient detection-estimation algorithms. Cloud-to-ground lightning seems not to explain all high-frequency detections, suggesting that additional sources of electrical or dynamical origin may be at play that are related to deep convective systems. Full article
(This article belongs to the Special Issue Infrasound, Acoustic-Gravity Waves, and Atmospheric Dynamics)
Show Figures

Figure 1

11 pages, 1529 KiB  
Technical Note
Performance of Drought Indices in Assessing Rice Yield in North Korea and South Korea under the Different Agricultural Systems
by Seonyoung Park, Jaese Lee, Jongmin Yeom, Eunkyo Seo and Jungho Im
Remote Sens. 2022, 14(23), 6161; https://doi.org/10.3390/rs14236161 - 05 Dec 2022
Cited by 3 | Viewed by 2000
Abstract
Drought affects a region’s economy intensively and its severity is based on the level of infrastructure present in the affected region. Therefore, it is important not only to reflect on the conventional environmental properties of drought, but also on the infrastructure of the [...] Read more.
Drought affects a region’s economy intensively and its severity is based on the level of infrastructure present in the affected region. Therefore, it is important not only to reflect on the conventional environmental properties of drought, but also on the infrastructure of the target region for adequate assessment and mitigation. Various drought indices are available to interpret the distinctive meteorological, agricultural, and hydrological characteristics of droughts. However, these drought indices do not consider the effective assessment of damage of drought impact. In this study, we evaluated the applicability of satellite-based drought indices over North Korea and South Korea, which have substantially different agricultural infrastructure systems to understand their characteristics. We compared satellite-based drought indices to in situ-based drought indices, standardized precipitation index (SPI), and rice yield over the Korean Peninsula. Moderate resolution imaging spectroradiometer (MODIS), tropical rainfall measuring mission (TRMM), and global land data assimilation system (GLDAS) data from 2001 to 2018 were used to calculate drought indices. The correlations of the indices in terms of monitoring meteorological and agricultural droughts in rice showed opposite correlation patterns between the two countries. The difference in the prevailing agricultural systems including irrigation resulted in different impacts of drought. Vegetation condition index (VCI) and evaporative stress index (ESI) are best suited to assess agricultural drought under well-irrigated regions as in South Korea. In contrast, most of the drought indices except for temperature condition index (TCI) are suitable for regions with poor agricultural infrastructure as in North Korea. Full article
(This article belongs to the Special Issue Monitoring Environmental Changes by Remote Sensing)
Show Figures

Figure 1

21 pages, 4410 KiB  
Article
ArithFusion: An Arithmetic Deep Model for Temporal Remote Sensing Image Fusion
by Md Reshad Ul Hoque, Jian Wu, Chiman Kwan, Krzysztof Koperski and Jiang Li
Remote Sens. 2022, 14(23), 6160; https://doi.org/10.3390/rs14236160 - 05 Dec 2022
Cited by 1 | Viewed by 1349
Abstract
Different satellite images may consist of variable numbers of channels which have different resolutions, and each satellite has a unique revisit period. For example, the Landsat-8 satellite images have 30 m resolution in their multispectral channels, the Sentinel-2 satellite images have 10 m [...] Read more.
Different satellite images may consist of variable numbers of channels which have different resolutions, and each satellite has a unique revisit period. For example, the Landsat-8 satellite images have 30 m resolution in their multispectral channels, the Sentinel-2 satellite images have 10 m resolution in the pan-sharp channel, and the National Agriculture Imagery Program (NAIP) aerial images have 1 m resolution. In this study, we propose a simple yet effective arithmetic deep model for multimodal temporal remote sensing image fusion. The proposed model takes both low- and high-resolution remote sensing images at t1 together with low-resolution images at a future time t2 from the same location as inputs and fuses them to generate high-resolution images for the same location at t2. We propose an arithmetic operation applied to the low-resolution images at the two time points in feature space to take care of temporal changes. We evaluated the proposed model on three modality pairs for multimodal temporal image fusion, including downsampled WorldView-2/original WorldView-2, Landsat-8/Sentinel-2, and Sentinel-2/NAIP. Experimental results show that our model outperforms traditional algorithms and recent deep learning-based models by large margins in most scenarios, achieving sharp fused images while appropriately addressing temporal changes. Full article
(This article belongs to the Section Remote Sensing Image Processing)
Show Figures

Figure 1

17 pages, 6286 KiB  
Technical Note
Multi-Sensor Fusion of SDGSAT-1 Thermal Infrared and Multispectral Images
by Lintong Qi, Zhuoyue Hu, Xiaoxuan Zhou, Xinyue Ni and Fansheng Chen
Remote Sens. 2022, 14(23), 6159; https://doi.org/10.3390/rs14236159 - 05 Dec 2022
Cited by 2 | Viewed by 2007
Abstract
Thermal infrared imagery plays an important role in a variety of fields, such as surface temperature inversion and urban heat island effect analysis, but the spatial resolution has severely restricted the potential for further applications. Data fusion is defined as data combination using [...] Read more.
Thermal infrared imagery plays an important role in a variety of fields, such as surface temperature inversion and urban heat island effect analysis, but the spatial resolution has severely restricted the potential for further applications. Data fusion is defined as data combination using multiple sensors, and fused information often has better results than when the sensors are used alone. Since multi-resolution analysis is considered an effective method of image fusion, we propose an MTF-GLP-TAM model to combine thermal infrared (30 m) and multispectral (10 m) information of SDGSAT-1. Firstly, the most relevant multispectral bands to the thermal infrared bands are found. Secondly, to obtain better performance, the high-resolution multispectral bands are histogram-matched with each thermal infrared band. Finally, the spatial details of the multispectral bands are injected into the thermal infrared bands with an MTF Gaussian filter and an additive injection model. Despite the lack of spectral overlap between thermal infrared and multispectral bands, the fused image improves the spatial resolution while maintaining the thermal infrared spectral properties as shown by subjective and objective experimental analyses. Full article
Show Figures

Figure 1

20 pages, 2909 KiB  
Article
Dual-Branch Attention-Assisted CNN for Hyperspectral Image Classification
by Wei Huang, Zhuobing Zhao, Le Sun and Ming Ju
Remote Sens. 2022, 14(23), 6158; https://doi.org/10.3390/rs14236158 - 05 Dec 2022
Cited by 6 | Viewed by 1792
Abstract
Convolutional neural network (CNN)-based hyperspectral image (HSI) classification models have developed rapidly in recent years due to their superiority. However, recent deep learning methods based on CNN tend to be deep networks with multiple parameters, which inevitably resulted in information redundancy and increased [...] Read more.
Convolutional neural network (CNN)-based hyperspectral image (HSI) classification models have developed rapidly in recent years due to their superiority. However, recent deep learning methods based on CNN tend to be deep networks with multiple parameters, which inevitably resulted in information redundancy and increased computational cost. We propose a dual-branch attention-assisted CNN (DBAA-CNN) for HSI classification to address these problems. The network consists of spatial-spectral and spectral attention branches. The spatial-spectral branch integrates multi-scale spatial information with cross-channel attention by extracting spatial–spectral information jointly utilizing a 3-D CNN and a pyramid squeeze-and-excitation attention (PSA) module. The spectral branch maps the original features to the spectral interaction space for feature representation and learning by adding an attention module. Finally, the spectral and spatial features are combined and input into the linear layer to generate the sample label. We conducted tests with three common hyperspectral datasets to test the efficacy of the framework. Our method outperformed state-of-the-art HSI classification algorithms based on classification accuracy and processing time. Full article
(This article belongs to the Special Issue Deep Learning for the Analysis of Multi-/Hyperspectral Images)
Show Figures

Figure 1

19 pages, 4637 KiB  
Article
Exploring the Ability of Solar-Induced Chlorophyll Fluorescence for Drought Monitoring Based on an Intelligent Irrigation Control System
by Wenhui Zhao, Jianjun Wu, Qiu Shen, Jianhua Yang and Xinyi Han
Remote Sens. 2022, 14(23), 6157; https://doi.org/10.3390/rs14236157 - 05 Dec 2022
Cited by 2 | Viewed by 1318
Abstract
Drought is one of the most devastating disasters and a serious constraint on agricultural development. The reflectance-based vegetation indices (VIs), such as Normalized Difference Vegetation Index (NDVI), have been widely used for drought monitoring, but there is a lag in the response of [...] Read more.
Drought is one of the most devastating disasters and a serious constraint on agricultural development. The reflectance-based vegetation indices (VIs), such as Normalized Difference Vegetation Index (NDVI), have been widely used for drought monitoring, but there is a lag in the response of VIs to the changes of photosynthesis induced by drought. Solar-induced chlorophyll fluorescence (SIF) is closely related to photosynthesis of vegetation and can capture changes induced by drought timely. This study investigated the capability of SIF for drought monitoring. An intelligent irrigation control system (IICS) utilizing the Internet of Things was designed and constructed. The soil moisture of the experiment plots was controlled at 60–80% (well-watered, T1), 50–60% (mild water stress, T2), 40–50% (moderate water stress, T3) and 30–40% (severe water stress, T4) of the field water capacity using the IICS based on data collected by soil moisture sensors. Meanwhile, SIF, NDVI, Normalized Difference Red Edge (NDRE) and Optimized Soil Adjusted Vegetation Index (OSAVI) were collected for a long time series using an automated spectral monitoring system. The differences in the responses of SIF, NDVI, NDRE and OSAVI to different drought intensities were fully analyzed. This study illustrates that the IICS can realize precise irrigation management strategies and the construction of regulated deficit irrigation treatments. SIF significantly decreased under mild stress, while NDVI, NDRE and OSAVI only significantly decreased under moderate and severe stress, indicating that SIF is more sensitive to drought. This study demonstrates the excellent ability of SIF for drought monitoring and lays the foundation for the future application of SIF in agricultural drought monitoring. Full article
(This article belongs to the Special Issue Remote Sensing for Agricultural Water Management (RSAWM))
Show Figures

Graphical abstract

20 pages, 1292 KiB  
Article
Multi-Scale Feature Aggregation Network for Semantic Segmentation of Land Cover
by Xu Shen, Liguo Weng, Min Xia and Haifeng Lin
Remote Sens. 2022, 14(23), 6156; https://doi.org/10.3390/rs14236156 - 05 Dec 2022
Cited by 6 | Viewed by 2027
Abstract
Land cover semantic segmentation is an important technique in land. It is very practical in land resource protection planning, geographical classification, surveying and mapping analysis. Deep learning shows excellent performance in picture segmentation in recent years, but there are few semantic segmentation algorithms [...] Read more.
Land cover semantic segmentation is an important technique in land. It is very practical in land resource protection planning, geographical classification, surveying and mapping analysis. Deep learning shows excellent performance in picture segmentation in recent years, but there are few semantic segmentation algorithms for land cover. When dealing with land cover segmentation tasks, traditional semantic segmentation networks often have disadvantages such as low segmentation precision and weak generalization due to the loss of image detail information and the limitation of weight distribution. In order to achieve high-precision land cover segmentation, this article develops a multi-scale feature aggregation network. Traditional convolutional neural network downsampling procedure has problems of detail information loss and resolution degradation; to fix these problems, a multi-scale feature extraction spatial pyramid module is made to assemble regional context data from different areas. In order to address the issue of incomplete information of traditional convolutional neural networks at multiple sizes, a multi-scale feature fusion module is developed to fuse attributes from various layers and several sizes to boost segmentation accuracy. Finally, a multi-scale convolutional attention module is presented to enhance the segmentation’s attention to the target in order to address the issue that the classic convolutional neural network has low attention capacity to the building waters in land cover segmentation. Through the contrast experiment and generalization experiment, it can be clearly demonstrated that the segmentation algorithm proposed in this paper realizes the high precision segmentation of land cover. Full article
(This article belongs to the Special Issue Pattern Recognition and Image Processing for Remote Sensing II)
Show Figures

Figure 1

17 pages, 3180 KiB  
Article
Storm-Time Relative Total Electron Content Modelling Using Machine Learning Techniques
by Marjolijn Adolfs, Mohammed Mainul Hoque and Yuri Y. Shprits
Remote Sens. 2022, 14(23), 6155; https://doi.org/10.3390/rs14236155 - 05 Dec 2022
Cited by 1 | Viewed by 1596
Abstract
Accurately predicting total electron content (TEC) during geomagnetic storms is still a challenging task for ionospheric models. In this work, a neural-network (NN)-based model is proposed which predicts relative TEC with respect to the preceding 27-day median TEC, during storm time for the [...] Read more.
Accurately predicting total electron content (TEC) during geomagnetic storms is still a challenging task for ionospheric models. In this work, a neural-network (NN)-based model is proposed which predicts relative TEC with respect to the preceding 27-day median TEC, during storm time for the European region (with longitudes 30°W–50°E and latitudes 32.5°N–70°N). The 27-day median TEC (referred to as median TEC), latitude, longitude, universal time, storm time, solar radio flux index F10.7, global storm index SYM-H and geomagnetic activity index Hp30 are used as inputs and the output of the network is the relative TEC. The relative TEC can be converted to the actual TEC knowing the median TEC. The median TEC is calculated at each grid point over the European region considering data from the last 27 days before the storm using global ionosphere maps (GIMs) from international GNSS service (IGS) sources. A storm event is defined when the storm time disturbance index Dst drops below 50 nanotesla. The model was trained with storm-time relative TEC data from the time period of 1998 until 2019 (2015 is excluded) and contains 365 storms. Unseen storm data from 33 storm events during 2015 and 2020 were used to test the model. The UQRG GIMs were used because of their high temporal resolution (15 min) compared to other products from different analysis centers. The NN-based model predictions show the seasonal behavior of the storms including positive and negative storm phases during winter and summer, respectively, and show a mixture of both phases during equinoxes. The model’s performance was also compared with the Neustrelitz TEC model (NTCM) and the NN-based quiet-time TEC model, both developed at the German Aerospace Agency (DLR). The storm model has a root mean squared error (RMSE) of 3.38 TEC units (TECU), which is an improvement by 1.87 TECU compared to the NTCM, where an RMSE of 5.25 TECU was found. This improvement corresponds to a performance increase by 35.6%. The storm-time model outperforms the quiet-time model by 1.34 TECU, which corresponds to a performance increase by 28.4% from 4.72 to 3.38 TECU. The quiet-time model was trained with Carrington averaged TEC and, therefore, is ideal to be used as an input instead of the GIM derived 27-day median. We found an improvement by 0.8 TECU which corresponds to a performance increase by 17% from 4.72 to 3.92 TECU for the storm-time model using the quiet-time-model predicted TEC as an input compared to solely using the quiet-time model. Full article
Show Figures

Figure 1

Previous Issue
Back to TopTop