Next Issue
Volume 14, December-1
Previous Issue
Volume 14, November-1
 
 
remotesensing-logo

Journal Browser

Journal Browser

Remote Sens., Volume 14, Issue 22 (November-2 2022) – 277 articles

Cover Story (view full-size image): 
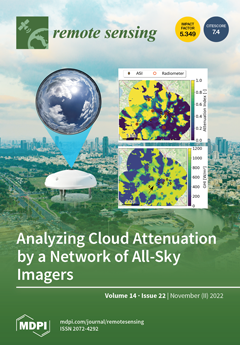
All-sky imagers (ASIs) can be used to model clouds and detect cloud attenuation, including its spatial variation. This can support solar-irradiance nowcasts, upscaling of photovoltaic production, and numeric weather predictions. We develop a network of ASIs for this task—aiming to cover a whole town and to achieve higher accuracy. We combine images of 12 ASIs which monitor the cloud scene from different perspectives. Areas covered by clouds are detected and distinguished by optical thickness. Including a single rotating shadowband irradiometer, a map of cloud attenuation is derived. The method suppresses errors present in a single ASI’s observation. In the validation, we show that the network of ASIs detects spatial variations of cloud attenuation considerably more accurately than state-of-the-art approaches in all atmospheric conditions. View this paper
  • Issues are regarded as officially published after their release is announced to the table of contents alert mailing list.
  • You may sign up for e-mail alerts to receive table of contents of newly released issues.
  • PDF is the official format for papers published in both, html and pdf forms. To view the papers in pdf format, click on the "PDF Full-text" link, and use the free Adobe Reader to open them.
Order results
Result details
Section
Select all
Export citation of selected articles as:
19 pages, 8886 KiB  
Article
Construction and Optimization of Ecological Security Pattern in the Loess Plateau of China Based on the Minimum Cumulative Resistance (MCR) Model
by Hong Wei, Hui Zhu, Jun Chen, Haoyang Jiao, Penghui Li and Liyang Xiong
Remote Sens. 2022, 14(22), 5906; https://doi.org/10.3390/rs14225906 - 21 Nov 2022
Cited by 17 | Viewed by 2364
Abstract
With accelerating urbanization, the regional ecological security pattern (ESP) faces unprecedented threats. The situation is particularly serious in the Loess plateau of China (LPC) due to the fragile ecological environment and poor natural conditions. Constructing an ecological network and optimizing the ESP is [...] Read more.
With accelerating urbanization, the regional ecological security pattern (ESP) faces unprecedented threats. The situation is particularly serious in the Loess plateau of China (LPC) due to the fragile ecological environment and poor natural conditions. Constructing an ecological network and optimizing the ESP is significant for guiding regional development and maintaining the stability of the ecological process. This study constructed an ecological security network by integrating the minimum cumulative resistance (MCR) model and morphological spatial-pattern-analysis approach in LPC. Additionally, the optimization scheme of the regional ESP has also been proposed. Results show that the ecological source area is about 57,757.8 km2, 9.13% of the total area, and is mainly distributed in the southeast of the study area. The spatial distribution of ecological sources shows specific agglomeration characteristics. The ecological security network constructed contains 24 main ecological corridors, 72 secondary ecological corridors, and 53 ecological nodes. Referring to the identified ecological sources area, corridors, nodes, and other core components, the “two barriers, five corridors, three zones and multipoint” ESP optimization scheme was presented. This research hopes to provide a valuable reference for constructing the ecological security network and optimizing ecological space in ecologically fragile areas of western China. Full article
(This article belongs to the Special Issue Remote Sensing of Interaction between Human and Natural Ecosystem)
Show Figures

Figure 1

24 pages, 6474 KiB  
Article
Comparing Different Light Use Efficiency Models to Estimate the Gross Primary Productivity of a Cork Oak Plantation in Northern China
by Linqi Liu, Xiang Gao, Binhua Cao, Yinji Ba, Jingling Chen, Xiangfen Cheng, Yu Zhou, Hui Huang and Jinsong Zhang
Remote Sens. 2022, 14(22), 5905; https://doi.org/10.3390/rs14225905 - 21 Nov 2022
Cited by 3 | Viewed by 1714
Abstract
Light use efficiency (LUE) models have been widely used to estimate terrestrial gross primary production (GPP). However, the estimation of GPP still has large uncertainties owing to an insufficient understanding of the complex relationship between water availability and photosynthesis. The plant water stress [...] Read more.
Light use efficiency (LUE) models have been widely used to estimate terrestrial gross primary production (GPP). However, the estimation of GPP still has large uncertainties owing to an insufficient understanding of the complex relationship between water availability and photosynthesis. The plant water stress index (PWSI), which is based on canopy temperature, is very sensitive to the plant stomatal opening and has been regarded as a good indicator for monitoring plant water status at the regional scale. In this study, we selected a cork oak plantation in northern China with an obvious seasonal drought as the research object. Using the ground-observed data, we evaluated the applicability of the LUE models with typical water stress scalars (MOD17, MODTEM, EC-LUE, ECM-LUE, SM-LUE, GLO-PEM, and Wang) in a GPP simulation of the cork oak plantation and explored whether the model’s accuracy can be improved by applying PWSI to modify the above models. The results showed that among the seven LUE models, the water stress scalar had a greater impact on the model’s performance than the temperature stress scalar. On sunny days, the daily GPP simulated by the seven LUE models was poorly matched with the measured GPP, and all models explained only 23–52% of the GPP variation in the cork oak plantation. The modified LUE models can significantly improve the prediction accuracy of the GPP and explain 49–65% of the variation in the daily GPP. On cloudy days, the performance of the modified LUE models did not improve, and the evaporative fraction was more suitable for defining the water stress scalar in the LUE models. The ECM-LUE and the modified GLO-PEM based on PWSI had optimal model structures for simulating the GPP of the cork oak plantation under cloudy and sunny days, respectively. This study provides a reference for the accurate prediction of GPP in terrestrial ecosystems in the future. Full article
Show Figures

Graphical abstract

21 pages, 2058 KiB  
Article
UAV-LiDAR and RGB Imagery Reveal Large Intraspecific Variation in Tree-Level Morphometric Traits across Different Pine Species Evaluated in Common Gardens
by Erica Lombardi, Francisco Rodríguez-Puerta, Filippo Santini, Maria Regina Chambel, José Climent, Víctor Resco de Dios and Jordi Voltas
Remote Sens. 2022, 14(22), 5904; https://doi.org/10.3390/rs14225904 - 21 Nov 2022
Cited by 4 | Viewed by 2454
Abstract
Remote sensing is increasingly used in forest inventories. However, its application to assess genetic variation in forest trees is still rare, particularly in conifers. Here we evaluate the potential of LiDAR and RGB imagery obtained through unmanned aerial vehicles (UAVs) as high-throughput phenotyping [...] Read more.
Remote sensing is increasingly used in forest inventories. However, its application to assess genetic variation in forest trees is still rare, particularly in conifers. Here we evaluate the potential of LiDAR and RGB imagery obtained through unmanned aerial vehicles (UAVs) as high-throughput phenotyping tools for the characterization of tree growth and crown structure in two representative Mediterranean pine species. To this end, we investigated the suitability of these tools to evaluate intraspecific differentiation in a wide array of morphometric traits for Pinus nigra (European black pine) and Pinus halepensis (Aleppo pine). Morphometric traits related to crown architecture and volume, primary growth, and biomass were retrieved at the tree level in two genetic trials located in Central Spain and compared with ground-truth data. Both UAV-based methods were then tested for their accuracy to detect genotypic differentiation among black pine and Aleppo pine populations and their subspecies (black pine) or ecotypes (Aleppo pine). The possible relation between intraspecific variation of morphometric traits and life-history strategies of populations was also tested by correlating traits to climate factors at origin of populations. Finally, we investigated which traits distinguished better among black pine subspecies or Aleppo pine ecotypes. Overall, the results demonstrate the usefulness of UAV-based LiDAR and RGB records to disclose tree architectural intraspecific differences in pine species potentially related to adaptive divergence among populations. In particular, three LiDAR-derived traits related to crown volume, crown architecture, and main trunk—or, alternatively, the latter (RGB-derived) two traits—discriminated the most among black pine subspecies. In turn, Aleppo pine ecotypes were partly distinguishable by using two LiDAR-derived traits related to crown architecture and crown volume, or three RGB-derived traits related to tree biomass and main trunk. Remote-sensing-derived-traits related to main trunk, tree biomass, crown architecture, and crown volume were associated with environmental characteristics at the origin of populations of black pine and Aleppo pine, thus hinting at divergent environmental stress-induced local adaptation to drought, wildfire, and snowfall in both species. Full article
(This article belongs to the Special Issue 3D Point Clouds in Forest Remote Sensing II)
Show Figures

Figure 1

20 pages, 6755 KiB  
Article
Quality Control of CyGNSS Reflectivity for Robust Spatiotemporal Detection of Tropical Wetlands
by Hironori Arai, Mehrez Zribi, Kei Oyoshi, Karin Dassas, Mireille Huc, Shinichi Sobue and Thuy Le Toan
Remote Sens. 2022, 14(22), 5903; https://doi.org/10.3390/rs14225903 - 21 Nov 2022
Cited by 2 | Viewed by 1746
Abstract
The aim of this study was to develop a robust methodology for evaluating the spatiotemporal dynamics of the inundation status in tropical wetlands with the currently available Global Navigation Satellite System-Reflectometry (GNSS-R) data by proposing a new quality control technique called the “precision [...] Read more.
The aim of this study was to develop a robust methodology for evaluating the spatiotemporal dynamics of the inundation status in tropical wetlands with the currently available Global Navigation Satellite System-Reflectometry (GNSS-R) data by proposing a new quality control technique called the “precision index”. The methodology was applied over the Mekong Delta, one of the most important rice-production systems comprising aquaculture areas and natural wetlands (e.g., mangrove forests, peatlands). Cyclone Global Navigation Satellite System (CyGNSS) constellation data (August 2018–December 2021) were used to evaluate the spatiotemporal dynamics of the reflectivity Γ over the delta. First, the reflectivity Γ, shape and size of each specular footprint and the precision index were calibrated at each specular point and reprojected to a 0.0045° resolution (approximately equivalent to 500 m) grid at a daily temporal resolution (Lv. 2 product); then, the results were obtained considering bias-causing factors (e.g., the velocity/effective scattering area/incidence angle). The Lv. 2 product was temporally integrated every 15 days with a Kalman smoother (+/− 14 days temporal localization with Gaussian kernel: 1σ = 5 days). By applying the smoother, the regional-annual dynamics over the delta could be clearly visualized. The behaviors of the GNSS-R reflectivity and the Advanced Land Observing Satellite-2 Phased-Array type L-band Synthetic Aperture Radar-2 quadruple polarimetric scatter signals were compared and found to be nonlinearly correlated due to the influence of the incidence angle and the effective scattering area. Full article
(This article belongs to the Special Issue GNSS-R Earth Remote Sensing from SmallSats)
Show Figures

Figure 1

20 pages, 4441 KiB  
Article
SATNet: A Spatial Attention Based Network for Hyperspectral Image Classification
by Qingqing Hong, Xinyi Zhong, Weitong Chen, Zhenghua Zhang, Bin Li, Hao Sun, Tianbao Yang and Changwei Tan
Remote Sens. 2022, 14(22), 5902; https://doi.org/10.3390/rs14225902 - 21 Nov 2022
Cited by 5 | Viewed by 1878
Abstract
In order to categorize feature classes by capturing subtle differences, hyperspectral images (HSIs) have been extensively used due to the rich spectral-spatial information. The 3D convolution-based neural networks (3DCNNs) have been widely used in HSI classification because of their powerful feature extraction capability. [...] Read more.
In order to categorize feature classes by capturing subtle differences, hyperspectral images (HSIs) have been extensively used due to the rich spectral-spatial information. The 3D convolution-based neural networks (3DCNNs) have been widely used in HSI classification because of their powerful feature extraction capability. However, the 3DCNN-based HSI classification approach could only extract local features, and the feature maps it produces include a lot of spatial information redundancy, which lowers the classification accuracy. To solve the above problems, we proposed a spatial attention network (SATNet) by combining 3D OctConv and ViT. Firstly, 3D OctConv divided the feature maps into high-frequency maps and low-frequency maps to reduce spatial information redundancy. Secondly, the ViT model was used to obtain global features and effectively combine local-global features for classification. To verify the effectiveness of the method in the paper, a comparison with various mainstream methods on three publicly available datasets was performed, and the results showed the superiority of the proposed method in terms of classification evaluation performance. Full article
Show Figures

Figure 1

21 pages, 25034 KiB  
Article
Repeated (4D) Marine Geophysical Surveys as a Tool for Studying the Coastal Environment and Ground-Truthing Remote-Sensing Observations and Modeling
by Giuseppe Stanghellini, Camilla Bidini, Claudia Romagnoli, Renata Archetti, Massimo Ponti, Eva Turicchia, Fabrizio Del Bianco, Alessandra Mercorella, Alina Polonia, Giulia Giorgetti, Andrea Gallerani and Luca Gasperini
Remote Sens. 2022, 14(22), 5901; https://doi.org/10.3390/rs14225901 - 21 Nov 2022
Cited by 2 | Viewed by 1927
Abstract
Sandy beaches and the nearshore environment are dynamic coastal systems characterized by sediment mobilization driven by alternating stormy and mild wave conditions. However, this natural behavior of beaches can be altered by coastal defense structures. Repeated surveys carried out with autonomous surface vehicles [...] Read more.
Sandy beaches and the nearshore environment are dynamic coastal systems characterized by sediment mobilization driven by alternating stormy and mild wave conditions. However, this natural behavior of beaches can be altered by coastal defense structures. Repeated surveys carried out with autonomous surface vehicles (ASVs) may represent an interesting tool for studying nearshore dynamics and testing the effects of mitigation strategies against erosion. We present a one-year experiment involving repeated stratigraphic and morpho-bathymetric surveys of a nearshore environment prone to coastal erosion along the Emilia-Romagna coast (NE Italy), the Lido di Dante beach, carried out between October 2020 and December 2021 using an ASV. Seafloor and subseafloor “snapshots” collected at different time intervals enabled us to delineate the seasonal variability and shed light on key controlling variables, which could be used to integrate and calibrate remote-sensing observations and modeling. The results demonstrated that repeated surveys could be successfully employed for monitoring coastal areas and represent a promising tool for studying coastal dynamics on a medium/short (years/months) timescale. Full article
Show Figures

Graphical abstract

16 pages, 6501 KiB  
Article
Comprehensive Analysis of PERSIANN Products in Studying the Precipitation Variations over Luzon
by Jie Hsu, Wan-Ru Huang and Pin-Yi Liu
Remote Sens. 2022, 14(22), 5900; https://doi.org/10.3390/rs14225900 - 21 Nov 2022
Cited by 6 | Viewed by 1483
Abstract
This study evaluated the capability of satellite precipitation estimates from five products derived from Precipitation Estimation from Remotely Sensed Information using Artificial Neural Networks (including PERSIANN, PERSIANN-CCS, PERSIANN-CDR, PERSIANN-CCS-CDR, and PDIR-Now) to represent precipitation characteristics over Luzon. The analyses focused on monthly and [...] Read more.
This study evaluated the capability of satellite precipitation estimates from five products derived from Precipitation Estimation from Remotely Sensed Information using Artificial Neural Networks (including PERSIANN, PERSIANN-CCS, PERSIANN-CDR, PERSIANN-CCS-CDR, and PDIR-Now) to represent precipitation characteristics over Luzon. The analyses focused on monthly and daily timescales from 2003–2015 and adopted surface observations from the Asian Precipitation Highly Resolved Observational Data Integration Towards Evaluation of Water Resources (APHRODITE) platform as the evaluation base. Among the five satellite precipitation products (SPPs), PERSIANN-CDR was observed to possess a better ability to qualitatively and quantitatively estimate spatiotemporal variations of precipitation over Luzon for the majority of the examined features with the exception of the extreme precipitation events, for which PERSIANN-CCS-CDR is superior to the other SPPs. These results highlight the usefulness of the addition of the cloud patch approach to PERSIANN-CDR to produce PERSIANN-CCS-CDR to depict the characteristics of extreme precipitation events over Luzon. A similar advantage of adopting the cloud patch approach in producing extreme precipitation estimates was also revealed from the comparison of PERSIANN, PERSIANN-CCS, and PDIR-Now. Our analyses also highlighted that all PERSIANN-series exhibit improved skills in regard to detecting precipitation characteristics over west Luzon compared to that over east Luzon. To overcome this weakness, we suggest that an adjustment in the cloud patch approach (e.g., using different cloud temperature thresholds or different brightness temperature and precipitation rate relationships) over east Luzon may be helpful. Full article
(This article belongs to the Special Issue Remote Sensing of Precipitation: Part III)
Show Figures

Graphical abstract

17 pages, 6074 KiB  
Article
Modeling and Analysis of Microwave Emission from Multiscale Soil Surfaces Using AIEM Model
by Ying Yang, Kun-Shan Chen and Rui Jiang
Remote Sens. 2022, 14(22), 5899; https://doi.org/10.3390/rs14225899 - 21 Nov 2022
Cited by 1 | Viewed by 1205
Abstract
Natural rough surfaces have inherent multiscale roughness. This article presents the modeling and analysis of microwave emission from a multiscale soil surface. Unlike the linear superposition of different correlation functions with various correlation lengths, we applied the frequency modulation concept to characterize the [...] Read more.
Natural rough surfaces have inherent multiscale roughness. This article presents the modeling and analysis of microwave emission from a multiscale soil surface. Unlike the linear superposition of different correlation functions with various correlation lengths, we applied the frequency modulation concept to characterize the multiscale roughness, in which the modulation does not destroy the surface’s curvature but only modifies it. The multiscale effect on emission under different observation geometries and surface parameters was examined using an AIEM model. The paper provides new insights into the dependence of polarized emissivity on multiscale roughness: V-polarized emissivity is much less sensitive to multiscale roughness across the moisture content from dry to wet (5–30%). The H-polarized is sensitive to multiscale roughness, especially at higher moisture content. The predicted emissivity will have considerable uncertainty, even for the same baseline correlation length, without accounting for the multiscale roughness effect. V-polarized emissivity is less sensitive to the multiscale effect than H-polarized and the higher modulation ratio indicates larger emissivity. The higher modulation ratio indicates larger emissivity. Multiscale roughness weakens the polarization difference, particularly in higher moisture conditions. In addition, ignoring the multiscale effect leads to underestimated emissivity to a certain extent, particularly at the larger RMS height region. Finally, when accounting for multiscale roughness, model predictions of emission from a soil surface are in good agreement with two independently measured data sets. Full article
(This article belongs to the Special Issue Advances on Radar Scattering of Terrain and Applications)
Show Figures

Figure 1

1 pages, 189 KiB  
Correction
Correction: Moghimi et al. Automatic Relative Radiometric Normalization of Bi-Temporal Satellite Images Using a Coarse-to-Fine Pseudo-Invariant Features Selection and Fuzzy Integral Fusion Strategies. Remote Sens. 2022, 14, 1777
by Armin Moghimi, Ali Mohammadzadeh, Turgay Celik, Brian Brisco and Meisam Amani
Remote Sens. 2022, 14(22), 5898; https://doi.org/10.3390/rs14225898 - 21 Nov 2022
Viewed by 858
Abstract
There was an error in the original publication [...] Full article
18 pages, 11144 KiB  
Article
Assimilation of Water Vapor Retrieved from Radar Reflectivity Data through the Bayesian Method
by Junjian Liu, Shuiyong Fan, Mamtimin Ali, Huoqing Li, Hailiang Zhang, Yu Wang and Ailiyaer Aihaiti
Remote Sens. 2022, 14(22), 5897; https://doi.org/10.3390/rs14225897 - 21 Nov 2022
Viewed by 2135
Abstract
This work describes the implementation of an updated radar reflectivity assimilation scheme with the three-dimensional variational (3D-Var) system of Weather Research and Forecast (WRF). The updated scheme, instead of the original scheme assuming the relative humidity to a fixed value where radar reflectivity [...] Read more.
This work describes the implementation of an updated radar reflectivity assimilation scheme with the three-dimensional variational (3D-Var) system of Weather Research and Forecast (WRF). The updated scheme, instead of the original scheme assuming the relative humidity to a fixed value where radar reflectivity is higher than a threshold, assimilates pseudo water vapor retrieved by the Bayesian method, which would be consistent with clouds/precipitations provided by the model in theory. To verify the effect of the updated scheme to the improvement of precipitation simulation, a convective case in Wenquan County and the continuous monthly simulation with contrasting experiments in Xinjiang were performed. The test of single reflectivity observation demonstrates that the water vapor retrieved by the Bayesian method is consistent with the meteorological situation around. In the convective case, both the updated and original scheme results show that the assimilation of pseudo water vapor can adjust to the environmental conditions of water vapor and temperature. This can improve the hourly precipitation forecast skill more than the contrasting experiment, which was designed to only assimilate conventional observations and radar radial velocity data. In the continuous monthly experiments, the updated scheme reveals that the analysis of water vapor is more reasonable, and obtains a better precipitation forecast skill for 6 h accumulated precipitation than the contrasting experiments. Full article
Show Figures

Figure 1

31 pages, 7102 KiB  
Article
Self-Organizing Control of Mega Constellations for Continuous Earth Observation
by Yun Xu, Yulin Zhang, Zhaokui Wang, Yunhan He and Li Fan
Remote Sens. 2022, 14(22), 5896; https://doi.org/10.3390/rs14225896 - 21 Nov 2022
Cited by 5 | Viewed by 1698
Abstract
This work presents a novel self-organizing control method for mega constellations to meet the continuous Earth observation requirements. In order to decrease the TT&C pressure caused by numerous satellites, constellation satellites are not controlled according to the designed configurations but are controlled with [...] Read more.
This work presents a novel self-organizing control method for mega constellations to meet the continuous Earth observation requirements. In order to decrease the TT&C pressure caused by numerous satellites, constellation satellites are not controlled according to the designed configurations but are controlled with respect to intersatellite constraints. By analyzing the street-of-coverage (SOC) of coplanar constellation satellites, the continuous coverage constraint of the mega constellation is transformed into constraints of the right ascension of ascending node (RAAN) and relative motion bound between every two adjacent coplanar satellites. The proposed continuous coverage constraint can be satisfied by most ongoing or planned mega constellations. Artificial potential functions (APFs) are used to realize self-organizing control. The scale-independent relative orbital elements (SIROEs) are innovatively presented as the self-organizing control variables. Using the Gaussian equations and Lyapunov’s theory, the stability of the APF control in quadratic form is proven, from which it can be concluded that the APF control variables of the controlled satellite should have the same time derivative as the target satellite states under two-body Keplerian motion condition, and SIROEs are ideal choices. The proposed controllers and self-organizing rules are verified in the sub-constellation of the GW-2 mega constellation by simulation. The results demonstrate the goodness in control effect and ground coverage performance. Full article
(This article belongs to the Special Issue CubeSats Applications and Technology)
Show Figures

Graphical abstract

18 pages, 4974 KiB  
Article
Ionospheric Oscillation with Periods of 6–30 Days at Middle Latitudes: A Response to Solar Radiative, Geomagnetic, and Lower Atmospheric Forcing
by Zhenlin Yang, Sheng-Yang Gu, Yusong Qin, Chen-Ke-Min Teng, Yafei Wei and Xiankang Dou
Remote Sens. 2022, 14(22), 5895; https://doi.org/10.3390/rs14225895 - 21 Nov 2022
Cited by 3 | Viewed by 1367
Abstract
This research studies the medium timescale (6–30 days) ionospheric response over the Wuhan area to solar radiative, recurrent geomagnetic, and lower atmospheric forcing. The ionospheric response is examined by wavelet analysis of the total electron content (TEC) over the Wuhan area from 2001 [...] Read more.
This research studies the medium timescale (6–30 days) ionospheric response over the Wuhan area to solar radiative, recurrent geomagnetic, and lower atmospheric forcing. The ionospheric response is examined by wavelet analysis of the total electron content (TEC) over the Wuhan area from 2001 to 2020. Ionospheric oscillations with periods centering at the harmonic oscillations of the 27-day solar rotation (e.g., 27 days, 13.5 days, 9 days, and 6.75 days) are focused upon. The results show that the quasi-27-day TEC oscillations at the middle latitude have a better overall correlation with solar radiation than recurrent geomagnetic activity, but the correlation between TEC and recurrent geomagnetic activity has a significant increase at the solar minimum stage. As for ionospheric oscillations with periods shorter than 15 days, these oscillations correlate better with recurrent geomagnetic activity. Moreover, a quasi-27-day TEC oscillation event at the middle latitude caused by convective activity from the lower atmosphere was studied. This suggests that lower atmospheric forcing is also an important factor causing ionospheric oscillations. In addition, the ionospheric oscillations over the Wuhan area also show unique regional characteristics, as the regional ionosphere does not respond well to the Kp oscillation with periods shorter than 20 days, particularly, 13.5 days. Full article
Show Figures

Figure 1

23 pages, 8412 KiB  
Article
Vine Canopy Reconstruction and Assessment with Terrestrial Lidar and Aerial Imaging
by Igor Petrović, Matej Sečnik, Marko Hočevar and Peter Berk
Remote Sens. 2022, 14(22), 5894; https://doi.org/10.3390/rs14225894 - 21 Nov 2022
Cited by 4 | Viewed by 1722
Abstract
For successful dosing of plant protection products, the characteristics of the vine canopies should be known, based on which the spray amount should be dosed. In the field experiment, we compared two optical experimental methods, terrestrial lidar and aerial photogrammetry, with manual defoliation [...] Read more.
For successful dosing of plant protection products, the characteristics of the vine canopies should be known, based on which the spray amount should be dosed. In the field experiment, we compared two optical experimental methods, terrestrial lidar and aerial photogrammetry, with manual defoliation of some selected vines. Like those of other authors, our results show that both terrestrial lidar and aerial photogrammetry were able to represent the canopy well with correlation coefficients around 0.9 between the measured variables and the number of leaves. We found that in the case of aerial photogrammetry, significantly more points were found in the point cloud, but this depended on the choice of the ground sampling distance. Our results show that in the case of aerial UAS photogrammetry, subdividing the vine canopy segments to 5 × 5 cm gives the best representation of the volume of vine canopies. Full article
(This article belongs to the Special Issue 3D Modelling and Mapping for Precision Agriculture)
Show Figures

Figure 1

19 pages, 1008 KiB  
Review
Recent Advances and Challenges in the Seismo-Electromagnetic Study: A Brief Review
by Hongyan Chen, Peng Han and Katsumi Hattori
Remote Sens. 2022, 14(22), 5893; https://doi.org/10.3390/rs14225893 - 21 Nov 2022
Cited by 23 | Viewed by 2736
Abstract
Due to their potential application in earthquake forecasting, seismo-electromagnetic phenomena were intensively studied for several decades all over the world. At present, measurements from ground to space have accumulated a large amount of observation data, proving an excellent opportunity for seismo-electromagnetic study. Using [...] Read more.
Due to their potential application in earthquake forecasting, seismo-electromagnetic phenomena were intensively studied for several decades all over the world. At present, measurements from ground to space have accumulated a large amount of observation data, proving an excellent opportunity for seismo-electromagnetic study. Using a variety of analytical methods to examine past earthquake events, many electromagnetic changes associated with earthquakes have been independently reported, supporting the existence of pre-earthquake anomalies. This study aimed to give a brief review of the seismo-electromagnetic studies preceding earthquakes and to discuss possible ways for the application of seismo-electromagnetic signals at the current stage. In general, seismo-electromagnetic signals can be classified into electric and magnetic changes in the lithosphere and perturbations in the atmosphere. We start with seismo-electromagnetic research in the lithosphere, and then we review the studies in the lower atmosphere and upper atmosphere, including some latest topics that aroused intense scholarly interest. The potential mechanisms of seismo-electromagnetic phenomena are also discussed. It was found that although a number of statistical tests show that electromagnetic anomalies may contain predictive information for major earthquakes, with probability gains of approximately 2–6, it is still difficult to make use of seismo-electromagnetic signals efficiently in practice. To address this, finally, we put forward some preliminary ideas about how to apply the seismo-electromagnetic information in earthquake forecasting. Full article
Show Figures

Figure 1

24 pages, 7365 KiB  
Article
A Recursive Hull and Signal-Based Building Footprint Generation from Airborne LiDAR Data
by Xiao Li, Fang Qiu, Fan Shi and Yunwei Tang
Remote Sens. 2022, 14(22), 5892; https://doi.org/10.3390/rs14225892 - 21 Nov 2022
Cited by 4 | Viewed by 1627
Abstract
Automatically generating a building footprint from an airborne LiDAR point cloud is an active research topic because of its widespread usage in numerous applications. This paper presents an efficient and automated workflow for generating building footprints from pre-classified LiDAR data. In this workflow, [...] Read more.
Automatically generating a building footprint from an airborne LiDAR point cloud is an active research topic because of its widespread usage in numerous applications. This paper presents an efficient and automated workflow for generating building footprints from pre-classified LiDAR data. In this workflow, LiDAR points that belong to the building category are first segmented into multiple clusters by applying the grid-based DBSCAN clustering algorithm. Each cluster contains the points of an individual building. Then, the outermost points of each building are extracted, on which the recursive convex hull algorithm is applied to generate the initial outline of each building. Since LiDAR points are irregularly distributed, the initial building outline contains irregular zig-zag shapes. In order to achieve a regularized building footprint that is close to the true building boundary, a signal-based regularization algorithm is developed. The initial outline is first transformed into a signal, which can reveal the wholistic geometric structure of the building outline after applying a denoising procedure. By analyzing the denoised signal, the locations of corners are identified, and the regularized building footprint is generated. The performance of the proposed workflow is tested and evaluated using two datasets that have different point densities and building types. The qualitative assessment reveals that the proposed workflow has a satisfying performance in generating building footprints even for building with complex structures. The quantitative assessment compares the performance of signal-based regularization with existing regularization methods using the 149 buildings contained in the test dataset. The experimental result shows the proposed method has achieved superior results based on a number of commonly used accuracy metrics. Full article
Show Figures

Figure 1

20 pages, 4361 KiB  
Article
A Prediction Model for the Outbreak Date of Spring Pollen Allergy in Beijing Based on Satellite-Derived Phenological Characteristics of Vegetation Greenness
by Xinyi Yang, Wenquan Zhu and Cenliang Zhao
Remote Sens. 2022, 14(22), 5891; https://doi.org/10.3390/rs14225891 - 21 Nov 2022
Cited by 2 | Viewed by 1869
Abstract
Pollen allergies have a serious impact on people’s physical and mental health. Accurate and efficient prediction of the outbreak date of pollen allergies plays an important role in the conservation of people sensitive to allergenic pollen. It is a frontier research to combine [...] Read more.
Pollen allergies have a serious impact on people’s physical and mental health. Accurate and efficient prediction of the outbreak date of pollen allergies plays an important role in the conservation of people sensitive to allergenic pollen. It is a frontier research to combine new social media data and satellite data to develop a model to forecast the outbreak date of pollen allergies. This study extracted the real outbreak dates of spring pollen allergies from Sina Weibo records from 2011 to 2021 in Beijing and calculated five vegetation indices of three vegetation types as phenological characteristics within the 30 days before the average outbreak date. The sensitivity coefficients and correlation coefficients were used to screen the phenological characteristics that best reflected the outbreak date of spring pollen allergy. Based on the best characteristic, two kinds of prediction models for the outbreak date of spring pollen allergy in Beijing were established (the linear fit prediction model and the cumulative linear fit prediction model), and the root mean square error (RMSE) was calculated as the prediction accuracy. The results showed that (1) the date of EVI2 (2-band enhanced vegetation index) in evergreen forest first reaching 0.138 can best reflect the outbreak date of pollen allergies in spring, and (2) the cumulative linear fit prediction model based on EVI2 in evergreen forests can obtain a high accuracy with an average RMSE of 3.6 days, which can predict the outbreak date of spring pollen allergies 30 days in advance. Compared with the existing indirect prediction models (which predict pollen concentrations rather than pollen allergies), this model provides a new direct way to predict pollen allergy outbreaks by using only remote sensing time-series data before pollen allergy outbreaks. The new prediction model also has better representativeness and operability and is capable of assisting public health management. Full article
Show Figures

Figure 1

18 pages, 8950 KiB  
Article
A Registration-Error-Resistant Swath Reconstruction Method of ZY1-02D Satellite Hyperspectral Data Using SRE-ResNet
by Mingyuan Peng, Guoyuan Li, Xiaoqing Zhou, Chen Ma, Lifu Zhang, Xia Zhang and Kun Shang
Remote Sens. 2022, 14(22), 5890; https://doi.org/10.3390/rs14225890 - 21 Nov 2022
Viewed by 1516
Abstract
ZY1-02D is a Chinese hyperspectral satellite, which is equipped with a visible near-infrared multispectral camera and a hyperspectral camera. Its data are widely used in soil quality assessment, mineral mapping, water quality assessment, etc. However, due to the limitations of CCD design, the [...] Read more.
ZY1-02D is a Chinese hyperspectral satellite, which is equipped with a visible near-infrared multispectral camera and a hyperspectral camera. Its data are widely used in soil quality assessment, mineral mapping, water quality assessment, etc. However, due to the limitations of CCD design, the swath of hyperspectral data is relatively smaller than multispectral data. In addition, stripe noise and collages exist in hyperspectral data. With the contamination brought by clouds appearing in the scene, the availability is further affected. In order to solve these problems, this article used a swath reconstruction method of a spectral-resolution-enhancement method using ResNet (SRE-ResNet), which is to use wide swath multispectral data to reconstruct hyperspectral data through modeling mappings between the two. Experiments show that the method (1) can effectively reconstruct wide swaths of hyperspectral data, (2) can remove noise existing in the hyperspectral data, and (3) is resistant to registration error. Comparison experiments also show that SRE-ResNet outperforms existing fusion methods in both accuracy and time efficiency; thus, the method is suitable for practical application. Full article
(This article belongs to the Section Remote Sensing Image Processing)
Show Figures

Figure 1

19 pages, 5284 KiB  
Article
A Novel Estimation Method of Water Surface Micro-Amplitude Wave Frequency for Cross-Media Communication
by Jianping Luo, Xingdong Liang, Qichang Guo, Tinggang Zhao, Jihao Xin and Xiangxi Bu
Remote Sens. 2022, 14(22), 5889; https://doi.org/10.3390/rs14225889 - 20 Nov 2022
Cited by 2 | Viewed by 1694
Abstract
Cross-media communication underpins many vital applications, especially in underwater resource exploration and the biological population monitoring domains. Water surface micro-amplitude wave (WSAW) frequency detection is the key to cross-media communication, where the WSAW frequency can invert the underwater sound source frequency. However, extracting [...] Read more.
Cross-media communication underpins many vital applications, especially in underwater resource exploration and the biological population monitoring domains. Water surface micro-amplitude wave (WSAW) frequency detection is the key to cross-media communication, where the WSAW frequency can invert the underwater sound source frequency. However, extracting the WSAW frequency information encounters many challenges in a real environment, such as low precision and symbol synchronization, leading to inaccurately estimating the WSAW frequency. Thus, this paper proposed a WSAW frequency estimation method based on an improved RELAX algorithm, incorporating two improvements. First, adding a nonlinear filter to the RELAX kernel function compensates for the filtered gain and enhances the WSAW frequency precision. Second, the improved RELAX kernel function is combined with the generalized inner product method to obtain the time distribution of the non-stationary signals, which is convenient for decoding. Several simulations and experiments applying our method on a Ka-band frequency modulated continuous wave (FMCW) radar demonstrate that our algorithm attains a better performance than traditional methods, e.g., periodogram and the RELAX algorithm. Using the improved algorithm affords to extract the frequency information of the WSAW signal accurately with a short sampling duration, further improving the performance indicators of the communication system, such as communication rate. Full article
Show Figures

Figure 1

19 pages, 23977 KiB  
Article
A Novel Echo Separation Scheme for Space-Time Waveform-Encoding SAR Based on the Second-Order Cone Programming (SOCP) Beamformer
by Shuo Han, Yunkai Deng, Wei Wang, Qingchao Zhao, Jinsong Qiu, Yongwei Zhang and Zhen Chen
Remote Sens. 2022, 14(22), 5888; https://doi.org/10.3390/rs14225888 - 20 Nov 2022
Viewed by 1493
Abstract
Space-time waveform-encoding (STWE)-synthetic aperture radar (SAR) is an effective way to accomplish high-resolution and wide-swath (HRWS) imaging. By designing the specific signal transmit mode, the echoes from several subswaths are received within a single receiving window and overlap each other in STWE-SAR. In [...] Read more.
Space-time waveform-encoding (STWE)-synthetic aperture radar (SAR) is an effective way to accomplish high-resolution and wide-swath (HRWS) imaging. By designing the specific signal transmit mode, the echoes from several subswaths are received within a single receiving window and overlap each other in STWE-SAR. In order to separate the overlapped echoes, the linear-constrained minimum variance (LCMV) beamformer, a single-null beamformer, is typically used. However, the LCMV beamformer has a very narrow and unstable notch depth, which is not sufficient to accurately separate the overlapped echoes with large signal energy differences between subswaths. The issue of signal energy differences in STWE-SAR is first raised in this paper. Moreover, a novel echo separation scheme based on a second-order cone programming (SOCP) beamformer is proposed. The beam pattern generated by the SOCP beamformer allows flexible adjustment of the notch width and depth, which effectively improves the quality of separation results compared to the LCMV beamformer. The simulation results illustrate that the scheme can greatly enhance the performance of echo separation. Furthermore, the experimental results based on the X-band STWE-SAR airborne system not only demonstrate the scheme’s effectiveness but also indicate that it holds great promise for future STWE-SAR missions. Full article
(This article belongs to the Special Issue SAR-Based Signal Processing and Target Recognition)
Show Figures

Graphical abstract

17 pages, 10699 KiB  
Article
Evaluating Satellite-Observed Ecosystem Function Changes and the Interaction with Drought in Songnen Plain, Northeast China
by Haiyan Li, Fang Huang, Xiuchao Hong and Ping Wang
Remote Sens. 2022, 14(22), 5887; https://doi.org/10.3390/rs14225887 - 20 Nov 2022
Cited by 4 | Viewed by 1383
Abstract
Drought is considered one of the devastating natural disasters worldwide. In the context of global climate change, the frequency and intensity of drought have increased, thereby affecting terrestrial ecosystems. To date, the interactions between ecosystem change and drought, especially their mutual lag and [...] Read more.
Drought is considered one of the devastating natural disasters worldwide. In the context of global climate change, the frequency and intensity of drought have increased, thereby affecting terrestrial ecosystems. To date, the interactions between ecosystem change and drought, especially their mutual lag and cumulative effects is unclear. The Songnen Plain in northeastern China is one of the three major black soil areas in the world and is highly sensitive to global change. Herein, to quantify the interaction between drought and ecosystem function changes in the Songnen Plain, integrating with time-series moderate resolution imaging spectroradiometer (MODIS), leaf area Index (LAI), evapotranspiration (ET), and gross primary productivity (GPP) data, we calculated the standardized precipitation and evapotranspiration index (SPEI) based on the meteorological data, diagnosed the causal relationship between SPEI and the ecosystem function indicators i.e., LAI, ET, and GPP, and analyzed the time-lag and cumulative effects between the degree of drought and three ecosystem function indicators using impulse response analysis. The results showed that the trend of SPEI (2000–2020) was positive in the Songnen Plain, indicating that the drought extent had eased towards wetness. LAI showed insignificant changes (taking up 88.34% of the total area), except for the decrease in LAI found in some forestland and grassland, accounting for 9.43%. The pixels showing a positive trend of ET and GPP occupied 24.86% and 54.94%, respectively. The numbers of pixels with Granger causality between LAI and SPEI (32.31%), SPEI and GPP (52.8%) were greater at the significance 0.05 level. Impulse responses between each variable pair were stronger mainly between the 6th and 8th months, but differed significantly between vegetation types. Grassland and cropland were more susceptible to drought than forest. The cumulative impulse response coefficients values indicated that the mutual impacts between all variables were mainly positive. The increased wetness positively contributed to ecosystem function, and in turn enhanced ecosystem function improved regional drought conditions to some extent. However, in the northeastern forest areas, the SPEI showed a significant negative response to increased ET and GPP, suggesting that the improved physiological functions of forest might lead to regional drought. There were regional differences in the interaction between drought conditions and ecosystem function in the Songnen Plain over the past 21 years. Full article
(This article belongs to the Special Issue Environmental Stress and Natural Vegetation Growth)
Show Figures

Graphical abstract

15 pages, 4250 KiB  
Article
Preflight Evaluation of the Environmental Trace Gases Monitoring Instrument with Nadir and Limb Modes (EMI-NL) Based on Measurements of Standard NO2 Sample Gas
by Taiping Yang, Fuqi Si, Haijin Zhou, Minjie Zhao, Fang Lin and Lei Zhu
Remote Sens. 2022, 14(22), 5886; https://doi.org/10.3390/rs14225886 - 20 Nov 2022
Cited by 2 | Viewed by 1142
Abstract
Hyperspectral observations are used to retrieve high-resolution horizontal distribution and vertical profiles of trace gases (O3, NO2, HCHO, and SO2), thereby playing a vital role in monitoring the spatio-temporal distribution and transportation of atmospheric pollutants. These observations [...] Read more.
Hyperspectral observations are used to retrieve high-resolution horizontal distribution and vertical profiles of trace gases (O3, NO2, HCHO, and SO2), thereby playing a vital role in monitoring the spatio-temporal distribution and transportation of atmospheric pollutants. These observations reflect air quality changes on global and regional scales, including China, thereby elucidating the impacts of anthropogenic and natural emissions on atmospheric composition and global climate change. The DaQi 02 (DQ02) satellite carries the Environmental Trace Gases Monitoring Instrument with Nadir and Limb modes (EMI-NL) onboard, which will simultaneously perform nadir and limb measurements of high-resolution ultraviolet and visible solar scattered light in the nadir and limb directions. Combined with the absorption of different trace gases in this wavelength band, this information can provide high-resolution horizontal and vertical distributions of trace gases. We examined the spectral measuring ability and instrument characteristics of both modules of EMI-NL by measuring different light sources and concentrations of the NO2 sample gas. In the nadir module test, when the NO2 sample gas concentration was 198 ppm and 513 ppm with scattered sunlight as the light source, the average relative errors of spatial pixels were 4.02% and 3.64%, respectively. At the NO2 sample gas concentration of 198 ppm with the integrating sphere as the light source, the average relative error of spatial pixels was −2.26%. In the limb module test, when the NO2 sample gas concentration was 198 ppm and 1000 ppm with the tungsten halogen lamp as the light source, the average relative errors of spatial pixels were −3.07% and 8.32%, respectively. When the NO2 sample gas concentration was 198 ppm and 1000 ppm with the integrating sphere as the light source, the spatial pixel average errors were −3.5% and 8.06%, respectively. The retrieved NO2 slant column density between different spatial pixels exhibited notable inconsistency in both modules, which could be used to estimate the stripe of spatial dimension. These results confirm the ability of EMI-NL to provide accurate spaceborne monitoring of NO2 globally. Full article
Show Figures

Graphical abstract

22 pages, 27308 KiB  
Article
Characterizing Spatiotemporal Patterns of Snowfall in the Kaidu River Basin from 2000–2020 Using MODIS Observations
by Jiangeng Wang, Linglong Zhu, Yonghong Zhang, Wei Huang, Kaida Song and Feng Tian
Remote Sens. 2022, 14(22), 5885; https://doi.org/10.3390/rs14225885 - 20 Nov 2022
Cited by 1 | Viewed by 1303
Abstract
Characterizing spatiotemporal patterns of snowfall is essential for understanding cryosphere responses to warming climate stress. The changes in snowfall and topographic controls in mountain regions still need to be clarified. This study proposes a general parsimonious methodology to obtain the frequency of snowfall [...] Read more.
Characterizing spatiotemporal patterns of snowfall is essential for understanding cryosphere responses to warming climate stress. The changes in snowfall and topographic controls in mountain regions still need to be clarified. This study proposes a general parsimonious methodology to obtain the frequency of snowfall in mountainous areas. The methodology employed is easily transferable to any other mountain region. Utilizing daily MODIS observations from June 2000 to May 2020 and the snowfall event detection algorithm, we monitored the frequency of snowfall in a long time series in the Kaidu river basin. The results are as follows: (1) The method for detecting the frequency of snowfall has high accuracy. The annual detected results agreed with surface observations, with an R2 of 0.65 and RMSE of 3.39. (2) The frequency of snowfall events increased monotonically with elevation. The influence of slope angle on snowfall gradually decreased with increasing elevation. (3) The frequency of snowfall events in the Kaidu river basin was dominated by an increasing trend. The trends showed a pronounced topographic dependence. This study reveals the distribution characteristics and changing snowfall trends in mountain regions. The results provide a reference for snowfall research in mountainous areas. Full article
Show Figures

Figure 1

22 pages, 2634 KiB  
Article
Predicting Nitrogen Efficiencies in Mature Maize with Parametric Models Employing In-Season Hyperspectral Imaging
by Monica B. Olson, Melba M. Crawford and Tony J. Vyn
Remote Sens. 2022, 14(22), 5884; https://doi.org/10.3390/rs14225884 - 20 Nov 2022
Cited by 2 | Viewed by 1431
Abstract
Overuse of nitrogen (N), an essential nutrient in food production systems, can lead to health issues and environmental degradation. Two parameters related to N efficiency, N Conversion Efficiency (NCE) and N Internal Efficiency (NIE), measure the amount of total biomass or grain produced, [...] Read more.
Overuse of nitrogen (N), an essential nutrient in food production systems, can lead to health issues and environmental degradation. Two parameters related to N efficiency, N Conversion Efficiency (NCE) and N Internal Efficiency (NIE), measure the amount of total biomass or grain produced, respectively, per unit of N in the plant. Utilizing remote sensing to improve these efficiency measures may positively impact the stewardship of agricultural N use in maize (Zea mays L.) production. We investigated in-season hyperspectral imaging for prediction of end-season whole-plant N concentration (pN), NCE, and NIE, using partial least squares regression (PLSR) models. Image data were collected at two mid-season growth stages (V16/V18 and R1/R2) from manned aircraft and unmanned aerial vehicles for three site years of 5 to 9 maize hybrids grown under 3 N treatments and 2 planting densities. PLSR models resulted in accurate predictions for pN at R6 (R2 = 0.73; R2 = 0.68) and NCE at R6 (R2 = 0.71; R2 = 0.73) from both imaging times. Additionally, the PLSR models based on the R1 images, the second imaging, accurately distinguished the highest and lowest ranked hybrids for pN and NCE across N rates. Neither timepoint resulted in accurate predictions for NIE. Genotype selection efficiency for end-season pN and NCE was increased through the use of the in-season PLSR imaging models, potentially benefiting early breeding screening methods. Full article
(This article belongs to the Special Issue Crop Biophysical Parameters Retrieval Using Remote Sensing Data)
Show Figures

Figure 1

20 pages, 22754 KiB  
Article
WDBSTF: A Weighted Dual-Branch Spatiotemporal Fusion Network Based on Complementarity between Super-Resolution and Change Prediction
by Shuai Fang, Qing Guo and Yang Cao
Remote Sens. 2022, 14(22), 5883; https://doi.org/10.3390/rs14225883 - 20 Nov 2022
Cited by 1 | Viewed by 1274
Abstract
Spatiotemporal fusion (STF) is a solution to generate satellite images with both high-spatial and high-temporal resolutions. The deep learning-based STF algorithms focus on spatial dimensions to build a super-resolution (SR) model or the temporal dimensions to build a change prediction (CP) model, or [...] Read more.
Spatiotemporal fusion (STF) is a solution to generate satellite images with both high-spatial and high-temporal resolutions. The deep learning-based STF algorithms focus on spatial dimensions to build a super-resolution (SR) model or the temporal dimensions to build a change prediction (CP) model, or the task itself to build a data-driven end-to-end model. The multi-source images used for STF usually have large spatial scale gaps and temporal spans. The large spatial scale gaps lead to poor spatial details based on a SR model; the large temporal spans make it difficult to accurately reconstruct changing areas based on a CP model. We propose a weighted dual-branch spatiotemporal fusion network based on complementarity between super-resolution and change prediction (WDBSTF), which includes the SR branch and CP branch, and a weight module representing the complementarity of the two branches. The SR branch makes full use of edge information and high-resolution reference images to obtain high-quality spatial features for image reconstruction. The CP branch decomposes complex problems via a two-layer cascaded network, changes features from the difference image, and selects high-quality spatial features through the attention mechanism. The fusion result of the CP branch has rich image details, but the fusion accuracy in the changing area is low due to the lack of detail. The SR branch has consistent and excellent fusion performances in the changing and no-changing areas, but the image details are not rich enough compared with the CP branch due to the large amplification factor. Next, a weighted network was designed to combine the advantages of the two branches to produce improved fusion results. We evaluated the performance of the WDBSTF in three representative scenarios, and both visual and quantitative evaluations demonstrate the state-of-the-art performance of our algorithm. (On the LGC dataset, our method outperforms the suboptimal method by 2.577% on SSIM. On the AHB dataset, our method outperforms the suboptimal method by 1.684% on SSIM. On the CIA dataset, our method outperforms the suboptimal method by 5.55% on SAM). Full article
Show Figures

Graphical abstract

19 pages, 4985 KiB  
Article
Monitoring of Atmospheric Carbon Dioxide over Pakistan Using Satellite Dataset
by Ning An, Farhan Mustafa, Lingbing Bu, Ming Xu, Qin Wang, Muhammad Shahzaman, Muhammad Bilal, Safi Ullah and Zhang Feng
Remote Sens. 2022, 14(22), 5882; https://doi.org/10.3390/rs14225882 - 20 Nov 2022
Cited by 9 | Viewed by 2873
Abstract
Satellites are an effective source of atmospheric carbon dioxide (CO2) monitoring; however, city-scale monitoring of atmospheric CO2 through space-borne observations is still a challenging task due to the trivial change in atmospheric CO2 concentration compared to its natural variability [...] Read more.
Satellites are an effective source of atmospheric carbon dioxide (CO2) monitoring; however, city-scale monitoring of atmospheric CO2 through space-borne observations is still a challenging task due to the trivial change in atmospheric CO2 concentration compared to its natural variability and background concentration. In this study, we attempted to evaluate the potential of space-based observations to monitor atmospheric CO2 changes at the city scale through simple data-driven analyses. We used the column-averaged dry-air mole fraction of CO2 (XCO2) from the Carbon Observatory 2 (OCO-2) and the anthropogenic CO2 emissions provided by the Open-Data Inventory for Anthropogenic Carbon dioxide (ODIAC) product to explain the scenario of CO2 over 120 districts of Pakistan. To study the anthropogenic CO2 through space-borne observations, XCO2 anomalies (MXCO2) were estimated from OCO-2 retrievals within the spatial boundary of each district, and then the overall spatial distribution pattern of the MXCO2 was analyzed with several datasets including the ODIAC emissions, NO2 tropospheric column, fire locations, cropland, nighttime lights and population density. All the datasets showed a similarity in the spatial distribution pattern. The satellite detected higher CO2 concentrations over the cities located along the China–Pakistan Economic Corridor (CPEC) routes. The CPEC is a large-scale trading partnership between Pakistan and China and large-scale development has been carried out along the CPEC routes over the last decade. Furthermore, the cities were ranked based on mean ODIAC emissions and MXCO2 estimates. The satellite-derived estimates showed a good consistency with the ODIAC emissions at higher values; however, deviations between the two datasets were observed at lower values. To further study the relationship of MXCO2 and ODIAC emissions with each other and with some other datasets such as population density and NO2 tropospheric column, statistical analyses were carried out among the datasets. Strong and significant correlations were observed among all the datasets. Full article
Show Figures

Figure 1

16 pages, 7232 KiB  
Article
Lidar- and V2X-Based Cooperative Localization Technique for Autonomous Driving in a GNSS-Denied Environment
by Min-Su Kang, Jae-Hoon Ahn, Ji-Ung Im and Jong-Hoon Won
Remote Sens. 2022, 14(22), 5881; https://doi.org/10.3390/rs14225881 - 20 Nov 2022
Cited by 5 | Viewed by 2806
Abstract
Autonomous vehicles are equipped with multiple heterogeneous sensors and drive while processing data from each sensor in real time. Among the sensors, the global navigation satellite system (GNSS) is essential to the localization of the vehicle itself. However, if a GNSS-denied situation occurs [...] Read more.
Autonomous vehicles are equipped with multiple heterogeneous sensors and drive while processing data from each sensor in real time. Among the sensors, the global navigation satellite system (GNSS) is essential to the localization of the vehicle itself. However, if a GNSS-denied situation occurs while driving, the accident risk may be high due to the degradation of the vehicle positioning performance. This paper presents a cooperative positioning technique based on the lidar sensor and vehicle-to-everything (V2X) communication. The ego-vehicle continuously tracks surrounding vehicles and objects, and localizes itself using tracking information from the surroundings, especially in GNSS-denied situations. We present the effectiveness of the cooperative positioning technique by constructing a GNSS-denied case during autonomous driving. A numerical simulation using a driving simulator is included in the paper to evaluate and verify the proposed method in various scenarios. Full article
(This article belongs to the Special Issue GNSS for Urban Transport Applications)
Show Figures

Graphical abstract

21 pages, 5912 KiB  
Article
Development of a Lightweight Single-Band Bathymetric LiDAR
by Guoqing Zhou, Xiang Zhou, Weihao Li, Dawei Zhao, Bo Song, Chao Xu, Haotian Zhang, Zhexian Liu, Jiasheng Xu, Gangchao Lin, Ronghua Deng, Haocheng Hu, Yizhi Tan, Jinchun Lin, Jiazhi Yang, Xueqin Nong, Chenyang Li, Yiqiang Zhao, Cheng Wang, Lieping Zhang and Liping Zouadd Show full author list remove Hide full author list
Remote Sens. 2022, 14(22), 5880; https://doi.org/10.3390/rs14225880 - 20 Nov 2022
Cited by 16 | Viewed by 3116
Abstract
Traditional bathymetry LiDAR (light detection and ranging) onboard manned and/or unmanned airborne systems cannot operate in the context of narrow rivers in urban areas with high buildings and in mountainous areas with high peaks. Therefore, this study presents a prototype of a lightweight [...] Read more.
Traditional bathymetry LiDAR (light detection and ranging) onboard manned and/or unmanned airborne systems cannot operate in the context of narrow rivers in urban areas with high buildings and in mountainous areas with high peaks. Therefore, this study presents a prototype of a lightweight bathymetry LiDAR onboard an unmanned shipborne vehicle (called “GQ-Cor 19”). The GQ-Cor 19 system primarily includes an emitting optical module, a receiving optical module, control module, detection module, high-speed A/D sampling module, and data processing system. Considering that the “GQ-Cor 19” is extremely close to the water surface, various new technical challenges are encountered, such as significant laser scattering energy from the surface of the water, which saturates signals received by the photomultiplier tube detector. Therefore, this study presents various new technical solutions, including (1) an improved Bresenham algorithm, (2) a small and lightweight receiving optical system with a split-field method, and (3) a data acquisition module with a high-speech A/D collector. Following a series of different experimental verifications, the results demonstrate that the new generation of single-band LiDAR onboard an unmanned shipborne vehicle can swiftly measure the underwater depth, and the maximum measurement depth is more than 25 m. The measurement accuracy is better than 30 cm and the weight is less than 12 kg. Full article
Show Figures

Graphical abstract

22 pages, 9099 KiB  
Article
A Fast and Robust Heterologous Image Matching Method for Visual Geo-Localization of Low-Altitude UAVs
by Haigang Sui, Jiajie Li, Junfeng Lei, Chang Liu and Guohua Gou
Remote Sens. 2022, 14(22), 5879; https://doi.org/10.3390/rs14225879 - 20 Nov 2022
Cited by 3 | Viewed by 2394
Abstract
Visual geo-localization can achieve UAVs (Unmanned Aerial Vehicles) position during GNSS (Global Navigation Satellite System) denial or restriction. However, The performance of visual geo-localization is seriously impaired by illumination variation, different scales, viewpoint difference, spare texture, and computer power of UAVs, etc. In [...] Read more.
Visual geo-localization can achieve UAVs (Unmanned Aerial Vehicles) position during GNSS (Global Navigation Satellite System) denial or restriction. However, The performance of visual geo-localization is seriously impaired by illumination variation, different scales, viewpoint difference, spare texture, and computer power of UAVs, etc. In this paper, a fast detector-free two-stage matching method is proposed to improve the visual geo-localization of low-altitude UAVs. A detector-free matching method and perspective transformation module are incorporated into the coarse and fine matching stages to improve the robustness of the weak texture and viewpoint data. The minimum Euclidean distance is used to accelerate the coarse matching, and the coordinate regression based on DSNT (Differentiable Spatial to Numerical) transform is used to improve the fine matching accuracy respectively. The experimental results show that the average localization precision of the proposed method is 2.24 m, which is 0.33 m higher than that of the current typical matching methods. In addition, this method has obvious advantages in localization robustness and inference efficiency on Jetson Xavier NX, which completed to match and localize all images in the dataset while the localization frequency reached the best. Full article
(This article belongs to the Special Issue Computer Vision and Image Processing)
Show Figures

Figure 1

17 pages, 3707 KiB  
Article
A Sequential Student’s t-Based Robust Kalman Filter for Multi-GNSS PPP/INS Tightly Coupled Model in the Urban Environment
by Sixiang Cheng, Jianhua Cheng, Nan Zang, Zhetao Zhang and Sicheng Chen
Remote Sens. 2022, 14(22), 5878; https://doi.org/10.3390/rs14225878 - 19 Nov 2022
Viewed by 1406
Abstract
The proper stochastic model of a global navigation satellite system (GNSS) makes a significant difference on the precise point positioning (PPP)/inertial navigation system (INS) tightly coupled solutions. The empirical Gaussian stochastic model is easily biased by massive gross errors, deteriorating the positioning precisions, [...] Read more.
The proper stochastic model of a global navigation satellite system (GNSS) makes a significant difference on the precise point positioning (PPP)/inertial navigation system (INS) tightly coupled solutions. The empirical Gaussian stochastic model is easily biased by massive gross errors, deteriorating the positioning precisions, especially in the severe GNSS blockage urban environment. In this paper, the distributional characteristics of the gross-error-contaminated observation noise are analyzed by the epoch-differenced (ED) geometry-free (GF) model. The Student’s t distribution is used to express the heavy tails of the gross-error-contaminated observation noise. Consequently, a novel sequential Student’s t-based robust Kalman filter (SSTRKF) is put forward to adjust the GNSS stochastic model in the urban environment. The proposed method pre-weights all the observations with the a priori residual-derived robust factors. The chi-square test is adopted to distinguish the unreasonable variances. The proposed sequential Student’s t-based Kalman filter is conducted for the PPP/INS solutions instead of the standard Kalman filter (KF) when the null hypothesis of the chi-square test is rejected. The results of the road experiments with urban environment simulations reveal that the SSTRKF improves the horizontal and vertical positioning precisions by 57.5% and 62.0% on average compared with the robust Kalman filter (RKF). Full article
Show Figures

Figure 1

24 pages, 23655 KiB  
Article
A Multi-Channel Descriptor for LiDAR-Based Loop Closure Detection and Its Application
by Gang Wang, Xiaomeng Wei, Yu Chen, Tongzhou Zhang, Minghui Hou and Zhaohan Liu
Remote Sens. 2022, 14(22), 5877; https://doi.org/10.3390/rs14225877 - 19 Nov 2022
Cited by 3 | Viewed by 1618
Abstract
Simultaneous localization and mapping (SLAM) algorithm is a prerequisite for unmanned ground vehicle (UGV) localization, path planning, and navigation, which includes two essential components: frontend odometry and backend optimization. Frontend odometry tends to amplify the cumulative error continuously, leading to ghosting and drifting [...] Read more.
Simultaneous localization and mapping (SLAM) algorithm is a prerequisite for unmanned ground vehicle (UGV) localization, path planning, and navigation, which includes two essential components: frontend odometry and backend optimization. Frontend odometry tends to amplify the cumulative error continuously, leading to ghosting and drifting on the mapping results. However, loop closure detection (LCD) can be used to address this technical issue by significantly eliminating the cumulative error. The existing LCD methods decide whether a loop exists by constructing local or global descriptors and calculating the similarity between descriptors, which attaches great importance to the design of discriminative descriptors and effective similarity measurement mechanisms. In this paper, we first propose novel multi-channel descriptors (CMCD) to alleviate the lack of point cloud single information in the discriminative power of scene description. The distance, height, and intensity information of the point cloud is encoded into three independent channels of the shadow-casting region (bin) and then compressed it into a two-dimensional global descriptor. Next, an ORB-based dynamic threshold feature extraction algorithm (DTORB) is designed using objective 2D descriptors to describe the distributions of global and local point clouds. Then, a DTORB-based similarity measurement method is designed using the rotation-invariance and visualization characteristic of descriptor features to overcome the subjective tendency of the constant threshold ORB algorithm in descriptor feature extraction. Finally, verification is performed over KITTI odometry sequences and the campus datasets of Jilin University collected by us. The experimental results demonstrate the superior performance of our method to the state-of-the-art approaches. Full article
(This article belongs to the Topic Artificial Intelligence in Sensors)
Show Figures

Graphical abstract

Previous Issue
Back to TopTop