Article

Remote Monitoring of Mediterranean Hurricanes Using Infrasound

1
CEA, DAM, DIF, 91297 Arpajon, France
2
ENSTA Paris—École Nationale Supérieure de Techniques Avancées, 91762 Palaiseau, France
3
National Observatory of Athens, Institute for Environmental Research and Sustainable Development, 15236 Athens, Greece
4
LMD/IPSL, CNRS UMR 8539, École Polytechnique, Université Paris Saclay, ENS, PSL Research University, Sorbonne Universités, UPMC Univ Paris 06, 91128 Palaiseau, France
5
Data4Risk, 75015 Paris, France
6
Univ Brest, CNRS, IFREMER, IRD, Laboratoire d’Océanographie Physique et Spatiale (LOPS), IUEM, 29280 Plouzané, France
7
ENSIM, Le Mans Univeristy, 72085 Le Mans, France
*
Author to whom correspondence should be addressed.
Remote Sens. 2022, 14(23), 6162; https://doi.org/10.3390/rs14236162
Submission received: 12 October 2022 / Revised: 17 November 2022 / Accepted: 18 November 2022 / Published: 5 December 2022
(This article belongs to the Special Issue Infrasound, Acoustic-Gravity Waves, and Atmospheric Dynamics)

Abstract

:
Mediterranean hurricanes, or medicanes, are tropical-like cyclones forming once or twice per year over the waters of the Mediterranean Sea. These mesocyclones pose a serious threat to coastal infrastructure and lives because of their strong winds and intense rainfall. Infrasound technology has already been employed to investigate the acoustic signatures of severe weather events, and this study aims at characterizing, for the first time, the infrasound detections that can be related to medicanes. This work also contributes to infrasound source discrimination efforts in the context of the Comprehensive Nuclear-Test-Ban Treaty. We use data from the infrasound station IS48 of the International Monitoring System in Tunisia to investigate the infrasound signatures of mesocyclones using a multi-channel correlation algorithm. We discuss the detections using meteorological fields to assess the presence of stratospheric waveguides favoring propagation. We corroborate the detections by considering other datasets, such as satellite observations, a surface lightning detection network, and products mapping the simulated intensity of the swell. High- and low-frequency detections are evidenced for three medicanes at distances ranging between 250 and 1100 km from the station. Several cases of non-detection are also discussed. While deep convective systems, and mostly lightning within them, seem to be the main source of detections above 1 Hz, hotspots of swell (microbarom) related to the medicanes are evidenced between 0.1 and 0.5 Hz. In the latter case, simulations of microbarom detections are consistent with the observations. Multi-source situations are highlighted, stressing the need for more resilient detection-estimation algorithms. Cloud-to-ground lightning seems not to explain all high-frequency detections, suggesting that additional sources of electrical or dynamical origin may be at play that are related to deep convective systems.

1. Introduction

Mediterranean tropical-like cyclones, known as Mediterranean hurricanes or medicanes, are meteorological hazards that happen on average once or twice per year almost exclusively during a period spanning from September to January in the Mediterranean Sea [1]. The landfall of such mesoscale cyclones (a few hundreds of kilometers in diameter) is responsible for numerous human casualties and severe damages to coastal infrastructure (flooding, landslides, debris flows, ect. [2,3]) due to strong winds and intense rainfall. Recent medicanes striking the Greek coasts led to ~640 mm of rainfall in less than 24 h, with gusts reaching up to 54 m/s [4]. The coasts of Sicily have also been strongly impacted by medicanes due to strong storm surge effects and big waves [5,6]. Preferred regions of formation are the western Mediterranean region (between the Balearic Ιslands and Sardinia) and the Ionian Sea [1], although medicanes are also known to have formed in other parts of the Mediterranean Basin, for instance in the Adriatic Sea [7,8]. More generally, medicanes did strike several coastal areas of southern Europe and northern Africa in the past, causing damages and fatalities that have been documented since the middle of the 20th century [2]. In the context of climate change, it is expected to observe an intensification of such cyclonic windstorms by the end of the century [9,10], although a warming ocean and a warming atmosphere may not lead to an increase in their frequency of occurrence [11].
Satellite observations are the primary tool for in-depth observational studies [4,8,12], which support modeling experiments for detailed investigation of the synoptic-to-micro-scale processes at play [7,10,13,14,15]. In-situ observations and ground-based meteorological stations also greatly support these investigations (e.g., [4]).
Formation processes of medicanes involve preconditioning of the upper troposphere with the presence of an upper-level potential vorticity streamer [16] (leading to a cut-off low or high-altitude cold low), followed by a combination of surface baroclinic instability and diabatic heating from convective processes (e.g., [17,18]). This leads to a warm core and builds the vertical and axisymmetric structure of the vortex, which is surrounded by convective clouds [8]. High sea surface temperature is another ingredient for fueling upward water vapor surface fluxes and transitioning the cyclone to a tropical-like structure [19,20]. In order to mitigate the destructive impacts related to these events, understanding, anticipating, and monitoring such hazards are necessary and complementary steps to one or several of which infrasound technology may contribute.
Infrasound waves are atmospheric longitudinal waves with frequencies ranging approximately between 0.01 Hz and 20 Hz, the latter being the lowest audible frequency of the human hearing. They can propagate over long distances with little attenuation, compared to audible sound, since absorption increases with the square of the frequency [21]. This property has made infrasound the technology for monitoring compliance with the Comprehensive Nuclear-Test-Ban Treaty (CTBT) in the atmosphere [22,23]. The infrasound network used for this purpose has more than 50 operational stations around the globe, and its objective is to detect and locate explosions of at least 1 kt eq. TNT (https://www.ctbto.org/, accessed on 28 November 2022). Aside from artificial sources, many natural sources emit infrasound (volcanoes, earthquakes, severe weather events, lightning, ocean waves, aurorae, and avalanches; see [24]). On the one hand, these sources need to be documented and understood in order to help signal discrimination in the context of the CTBT Organization’s surveillance activities. On the other hand, infrasound can provide information on the processes at play, as well as their intensity at the source location, and can allow tracking the source. Back-azimuth and trace velocity estimates of the coherent wave front crossing a multi-sensor array akin to the ones of the IMS [23] can be retrieved through the use of detection algorithms (e.g., [22]) like the Progressive Multi-Channel Correlation (PMCC) algorithm developed at CEA [25] and used in the present study.
Several studies have linked the detection of infrasound signatures to storms and more specifically cyclones, mesoscale convective systems, and mesocyclones. For instance, Blom and Waxler [26] have demonstrated the refraction of infrasound emitted by the swell (microbarom) around 0.2 Hz during cyclonic windstorms. Šindelářová et al. [27] demonstrated the detection of infrasound originating from a convective storm over central Europe in the 1–4 Hz range, relating it to increased lightning activity, while more recently, Chunchuzov et al. [28] showed how meteorological fronts could emit infrasound (0.05–1 Hz) modulated by gravity waves (0.001–0.004 Hz) triggered by the same meteorological system. Another study documented the split of a mesoscale convective system tracked in Ivory Coast using a mobile infrasound station in the 1–4 Hz range [29]. Several likely sources of infrasound detections related to convective storms have been listed and commented on by Georges [30]. Following this pioneering work, Bedard [31] identified vortices as a very likely candidate for infrasound emitted during thunderstorms, in frequency ranges depending on the vortex formation mechanism. The author also noticed a link between hail production and infrasound during storms, but only in the presence of rotation. However, rotation-related infrasound production would be mostly related to tornadoes and not so much to the large-scale rotation of a mesocyclone [32]. Finally, Petrin and Elbing [33] recall the importance of downdrafts for tornadogenesis and how the former are fueled by intense evaporation, sublimation, but, most importantly, melting [34]; hence, emphasizing how hail production, vortices, and infrasound production are related. Interestingly, however, Bedard [31] as well as Passner and Noble [35] did report evidence of infrasound detection in the 5–10 Hz band even for non-tornadic mesocyclones, without a clear explanation for the processes responsible for these tones. This suggests the possibility of infrasound emission from large-scale rotating systems even in the absence of tornadogenesis [35].
More onto theoretical grounds, Akhalkatsi and Gogoberidze [36] and Schecter [37] demonstrated, through calculations arising from the acoustic wave equation and simulation experiments, respectively, the role of heat production and condensation or melting as an infrasound source in convective storms at frequencies above 0.1 Hz. Schecter [38] subsequently discussed the importance of the thermal fluctuation of the columnar vortex induced by phase change through latent heating or cooling in order to be able to explain tornado-related infrasound emissions.
Lightning has also been well documented as an efficient source of infrasound above 1 Hz [39,40,41,42]. Farges and Blanc [39] showed that thunderstorm motion within 300 km could be followed by a single infrasound station detecting lightning produced in it. Farges et al. [42] have extended the range to 500 km, analyzing 15 years of IMS infrasound data recorded in Ivory Coast. They also found that the amplitude of the infrasound from lightning decayed with the distance d as d−0.717 in direct or tropospheric waveguide propagation. Gallin et al. [40] and Lacroix et al. [41] showed the capability of rebuilding the 3D geometry of a lightning flash using acoustic measurements when the lightning flash is close to the sensors (less than 20 km). A model of thunder, taking into account the 3D and tortuous shape of the flash discharges, has been suggested [41].
It is interesting to note, with respect to this brief review of the literature, that tornadoes can also form during medicanes [2,8], and that the intense precipitation caused by these cyclones is expectedly related to cold microphysics involving graupel and large ice particles [15,43], thus possibly gathering all the necessary ingredients for infrasound production. Additionally, lightning is commonly observed within medicanes [4,12,43,44], mostly in the intensification periods.
Finally, and closer to our meteorological objectives, Orbaek and Naustvik [45], followed by Claud et al. [46], reported the coherent detection of infrasound (in the 2–8 Hz and 0.5–4 Hz bands, respectively) coming from arctic mesocyclones (known as polar lows). They highlight the presence of convection to explain the emission of infrasound in the higher infrasound frequency range; however, without further working on investigating the actual source processes responsible for the detections.
Seismic signatures of tropical cyclones [47] and medicanes [48] have been investigated to demonstrate how microseismic ambient noise is generated and may be used to detect or track such meteorological hazards. To our knowledge, no investigation has been conducted to identify signatures of medicanes in infrasound recordings so far, in the microbarom frequency range and above. The present study brings the first evidence of infrasound detections related to the formation and displacement of mesocyclones across the Mediterranean Sea.
In Section 2, we describe the different cases of medicanes investigated along with the infrasound data and the other datasets used for our investigation on the origin of the infrasound detections. Section 3 documents the recorded infrasound signatures that can be related to the medicane events. A discussion explaining the detection or lack of detection and identifying the sources responsible for the detections is undertaken in Section 4. Section 5 summarizes the main findings and suggests future directions for improving our understanding of infrasound emission from Mediterranean cyclones.

2. Data, Tools and Medicanes Investigated

2.1. Infrasound Data and Processing Tool

The IMS station IS48 is located in Kesra, Tunisia (Figure 1), and has been updated with a new wind noise reduction system since 2017 [49], which significantly improved its detection capability. IS48 is an 8-element (MB2005 sensors) array with an aperture of ~2 km. It has been successfully involved in studies dealing with natural sources in the Mediterranean, such as the Etna (e.g., [50,51]) or the Stromboli [52], as well as the characterization of artificial sources [53]. Waveforms provided by the French National Data Centre (NDC) are processed using the Progressive Multi-Channel Correlation (PMCC) algorithm [25] between 0.05 and 8 Hz with a 1/3 octave band progression and 90% overlap between time windows. The latter follows a logarithmic progression to accommodate low frequencies with longer time periods. The criterion for detection (consistency) is set to 0.1 s and only time-frequency pixels verifying this condition and belonging to a family of pixels are considered. Families are groups of pixels sharing common wavefront parameters, namely backazimuth, trace velocity (horizontal projection of the wavefront celerity), frequency, and time. This allows one to easily filter out artifacts and outliers [22].

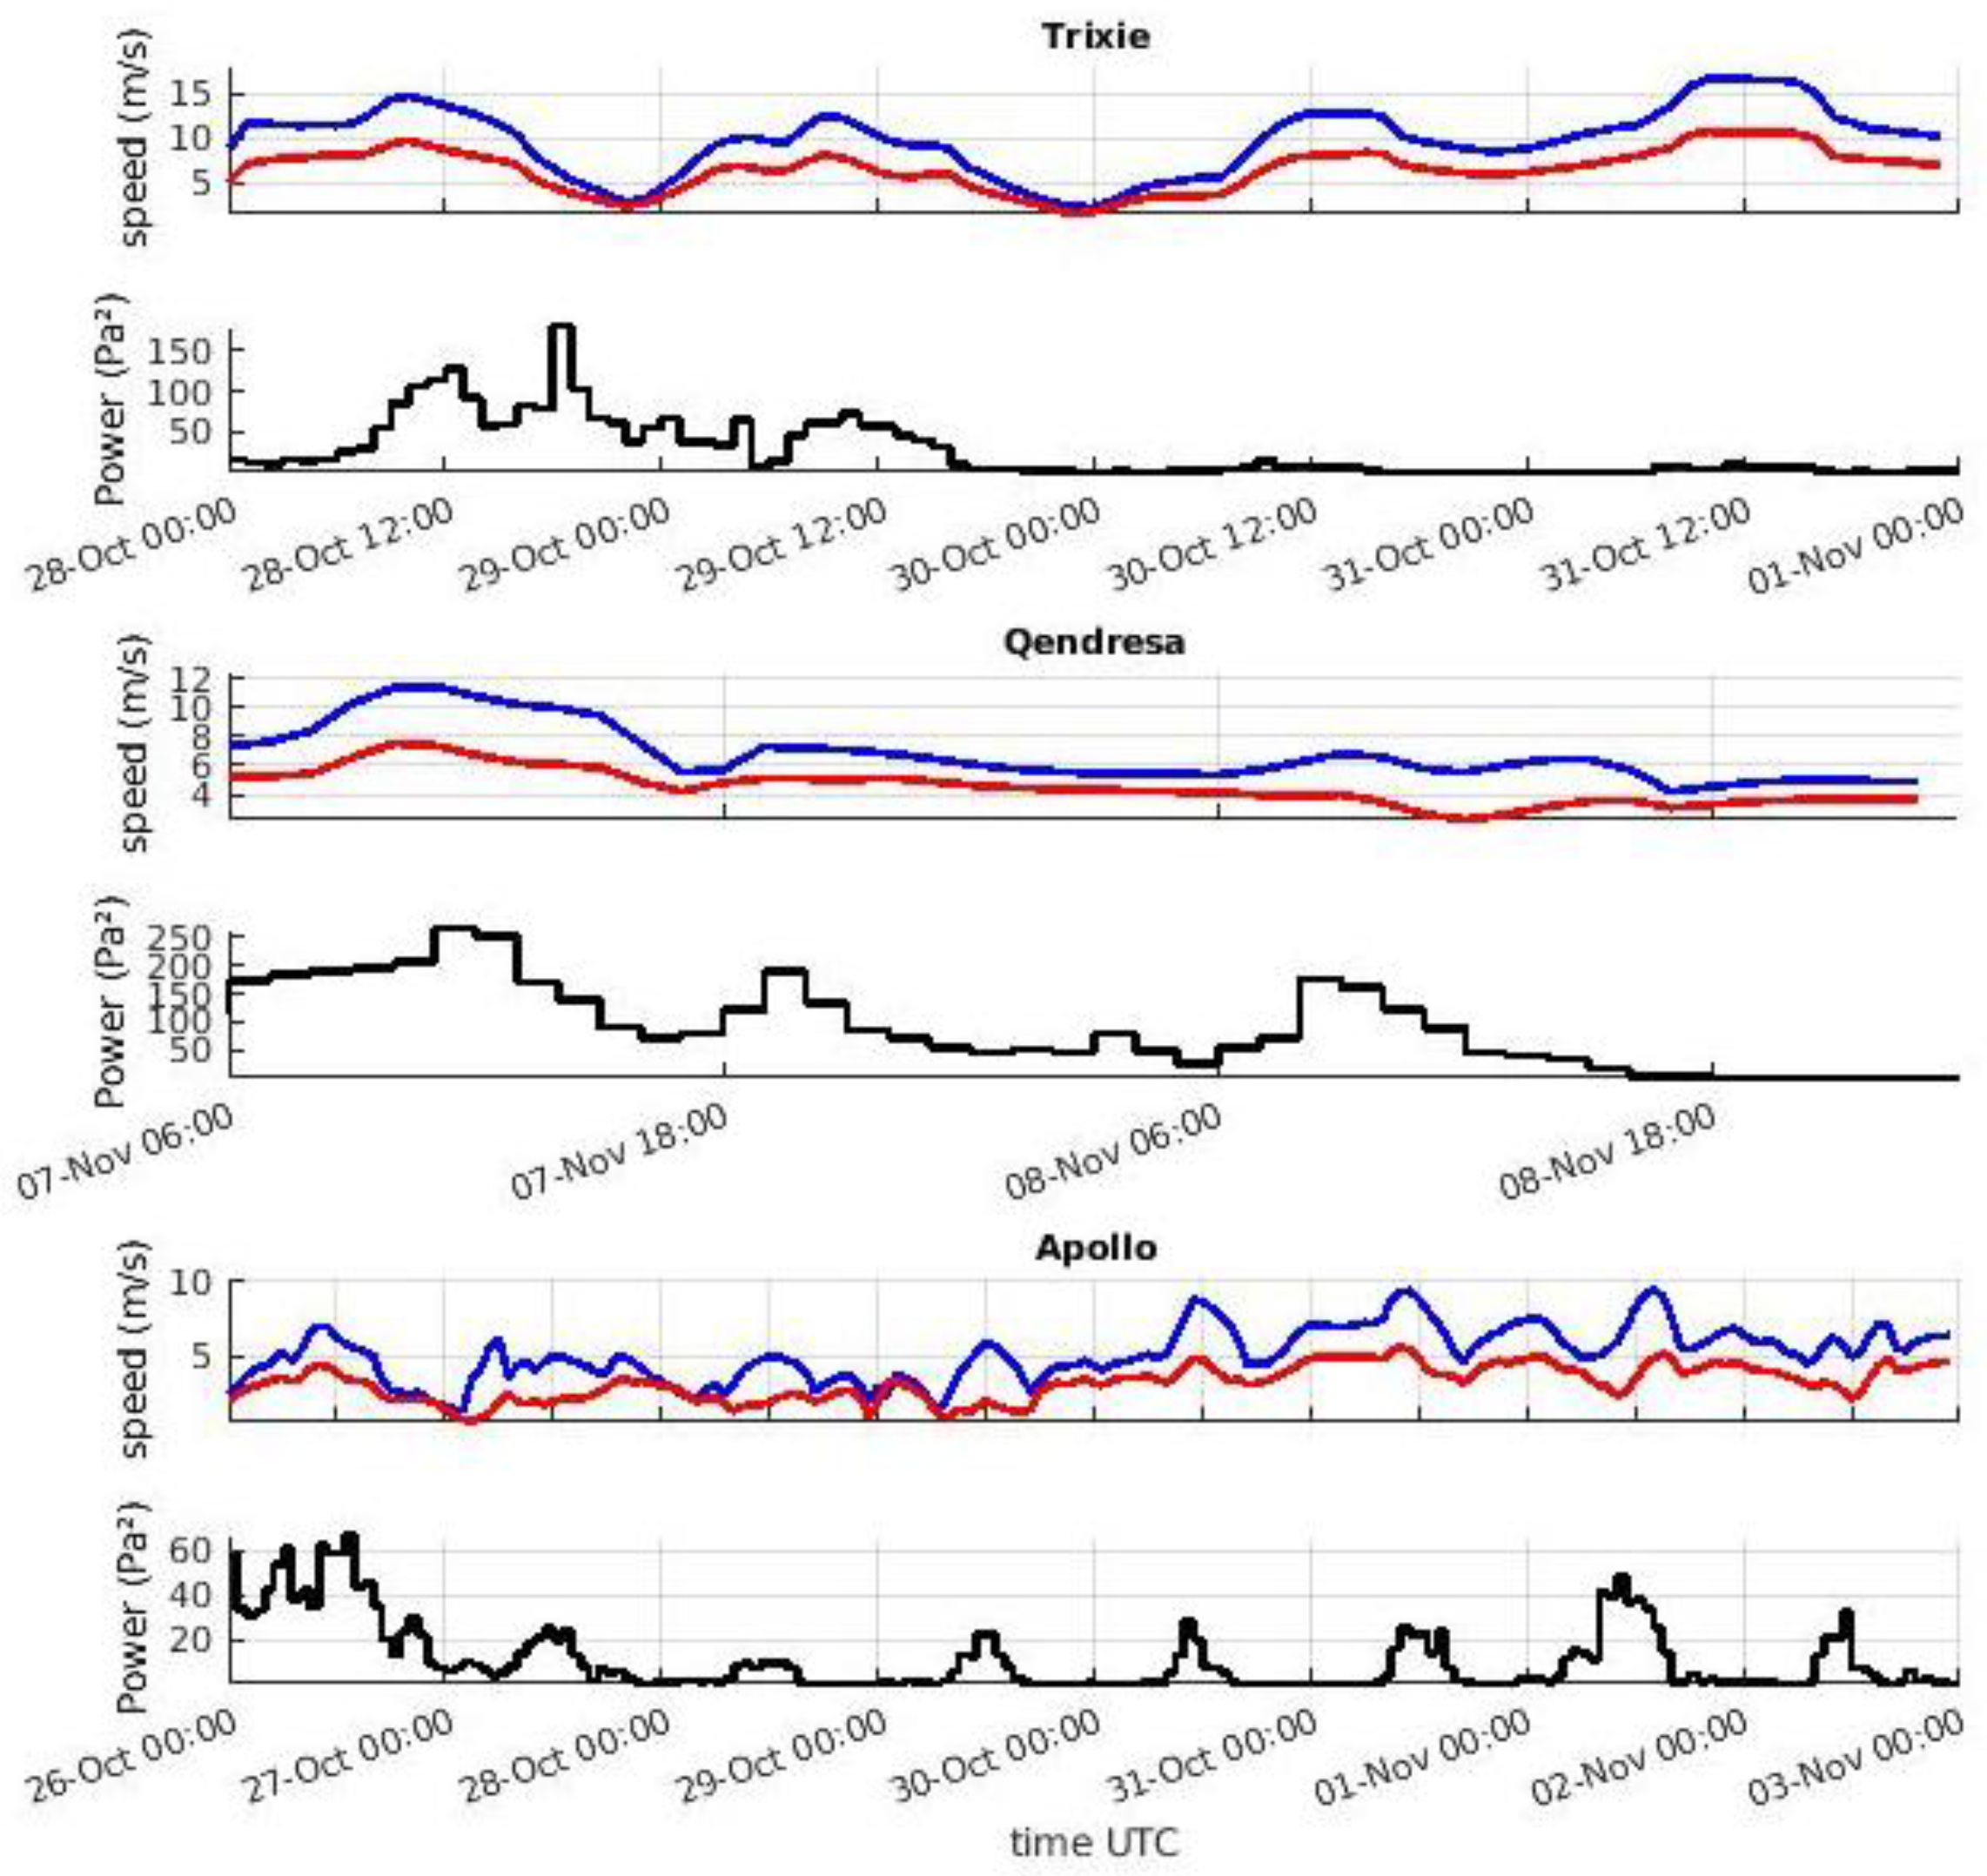
2.2. Meteorological Data

ECMWF (European Centre for Medium-Range Weather Forecasts) reanalysis products ERA5 [54] provide wind and temperature fields that are used to investigate infrasound guiding in the middle atmosphere. Fields are extracted from the Meteorological Archival and Retrieval System (MARS) of the ECMWF through the Copernicus Climate Change Service (C3S) above the Mediterranean region. The ERA5 fields are provided on a regular 0.25° by 0.25° horizontal grid and available at an hourly output from the surface of 0.01 hPa (~80 km altitude). These fields come from ECMWF’s Integrated Forecasting System (IFS) model simulations performed at a horizontal resolution of 30 km. The 2-m wind and gusts were also extracted at the station in order to check the ability of ERA5 fields to account for the local wind noise conditions affecting the sensors despite it being adapted to regional-scale dynamics considerations.

2.3. Satellite Data for Convection

In order to detect deep moist convection (DC) during medicanes, data from the Meteosat Second Generation (MSG) satellites were used, and more specifically, the brightness temperature (BT) from the Spinning Enhanced Visible and Infrared Imager (SEVIRI) [55]. A similar method to Olander and Velden [56] is used to differentiate convective clouds from other opaque clouds by using the difference between the water vapor (WV) channel WV6.2 and the window channel IR10.8 (ΔBT) of SEVIRI pixels at the native spatial resolution of 3 km. During clear-sky conditions, the IR10.8 channel has a peak spectral response close to or at the surface of the Earth, while the WV6.2 channel peaks at about 350 hPa, thus ΔBT is typically negative. In the presence of convective clouds, this spectral response can change significantly and even reverse to positive values. During intense DC, important amounts of WV can be transported in the upper troposphere or lower stratosphere, where it is reemitted at higher temperatures in the WV6.2 channel than in the window channel [57]. Positive ΔBT (WV6.2 − IR10.8 > 0) values are attributed to intense convection that penetrates the tropopause and is attributed to overshooting tops [58,59]. The DC pixels used in this work come from the work described in [8].

2.4. The World Wide Lightning Location Network

Very-low-frequency (VLF) electromagnetic waves are detected by the World Wide Lightning Location Network (WWLLN), which employs ~70 sensors that allow to locate lightning strokes with a 10 km location accuracy (e.g., [60]). This dataset has been used to study the evolution of lightning activity in tropical cyclones [61,62,63]. The WWLLN detection efficiency ranges from 10% to 20% for the cloud-to-ground flashes but rises to between 50% and 80% for intense flashes (defined with peak current > 50 kA), varying significantly over land and ocean [64], while being higher over oceans by a factor of 2–3 and will largely miss intra-cloud lightning [65]. Farges et al. [42] extensively used this dataset to explain infrasound detections of lightning from tropical storms in Western Africa.

2.5. Acoustic Source Model for Microbaroms: The ARROW Dataset

A new source model for microbaroms developed by De Carlo et al. [66] is used. In De Carlo et al. [67], this model was successfully compared to a previous source model [68], for which theoretical limitations were highlighted, and to IMS observations. This acoustic source model was also successfully used in case studies [69,70]. This led to the creation of the AtmospheRic InfRasound by Ocean Waves (ARROW) dataset [71], which is hosted by IFREMER and builds on the wave interaction products for which a hindcast covering the 1993–2020 period exists [72,73]. In short, the ARROW product offers global mapping of the wave interaction product and the related acoustic source product (microbaroms source model) on a three-hourly time step, both for past periods as well as in near-real time.

2.6. Medicanes Investigated

Six medicanes that developed between 2014 and 2021 were considered for this study by using infrasound data from the station IS48 in Tunisia (Figure 1 and Figure 2). The trajectories of Medicanes Qendresa, Trixie, and Zorbas were provided by the study of Dafis et al. [8], and for Trudy, Ianos, and Apollo, the same tracking method was applied based on brightness temperature (BT) from satellite observations.
Medicane Qendresa developed in southern Italy between the 6th and the 8th of November 2014. According to surface observations, the medicane reached the peak of its intensity on the 7th of November 2014 around 17:00 UTC without any deep convection (DC) observations close to the cyclone center, at least in the first 25 km from the cyclone center. The cyclone produced wind gusts up to 43 ms−1 and 978 hPa minimum sea-level pressure (SLP), one of the lowest in the Mediterranean records. Later, on the 8th of November 2014, DC activity started to increase and spread outward when the medicane was close to the eastern coasts of Sicily, but the overall medicane intensity started to weaken rapidly.
Medicane Trixie was a weak cyclone on the 29th of October 2016 southeast of Sicily, barely detected by satellite imagery and numerical reanalysis. In the following days, DC activity close to the cyclone center resulted in a diabatic intensification, reaching its maximum intensity close to the western coasts of Crete in southern Greece. Between 21:00 UTC on the 30th of October and 03:00 UTC on the 31st of October 2016, an “eye” was formed in the medicane center, surrounded by intense DC activity.
Medicane Zorbas first developed as an extratropical cyclone near the coasts of Libya on the 27th of September 2018 and was associated with a widespread area of DC activity on that day. Several Mesoscale Convective Systems (MCS) were detected to become wrapped around the medicane center during the 28th of September and early morning on the 29th of September 2018, while the cyclone was propagating northeast towards Greece. The medicane made a landfall in Greece at approximately 10:00 UTC on the 29th of September 2018, causing significant damage to infrastructure as hurricane-force winds, storm surge, big waves, and floods were reported in many places [8].
Medicane Trudy was a short-lasting tropical-like cyclone in the western Mediterranean, mostly affecting Algeria during landfall on the 11th of November 2019. It developed within a large cyclonic system on the 10th of November 2019 in the Gulf of Lion and travelled fast south towards the coasts of Algeria. In the morning on the 11th of November 2019, a dry slot was visible in the satellite imagery, resulting in asymmetric DC activity, but in the afternoon, convection was again wrapped around the medicane center.
Medicane Ianos emerged as a surface cyclone close to a MCS in the Gulf of Sidra on the 15th of September 2020, off the coasts of Libya. Ianos evolved into an intense medicane on the 17th of September 2020 and affected Greece with storm surge, high waves, torrential rainfall, and devastating winds that resulted in four fatalities and significant infrastructure damages by landslides and flooding in the Ionian Islands and in central Greece [3,74]. Ianos is probably the strongest medicane in the past 50 years [4].
Medicane Apollo was a long-lasting event that developed as an extratropical cyclone in the central Mediterranean during the night on the 24th of October 2021, affecting Italy, Tunisia, Malta, Libya, and Turkey with severe weather events. It showed tropical-like characteristics, namely the absence of weather fronts and a cloud-free “eye” surrounded by convection between the 28th and 30th of October 2021. It reached its maximum intensity on the 29th of October 2021, battering Sicily and Malta with gale-force wind gusts and heavy rainfall. Later, between the 30th of October and the 2nd of November 2021, Medicane Apollo travelled fast east, close to the coasts of Libya, and reached Turkey while DC was still attached close to its center, producing severe weather events in southern Turkey (https://eswd.eu/, accessed on 28 November 2022).

3. Results: Infrasound Detections

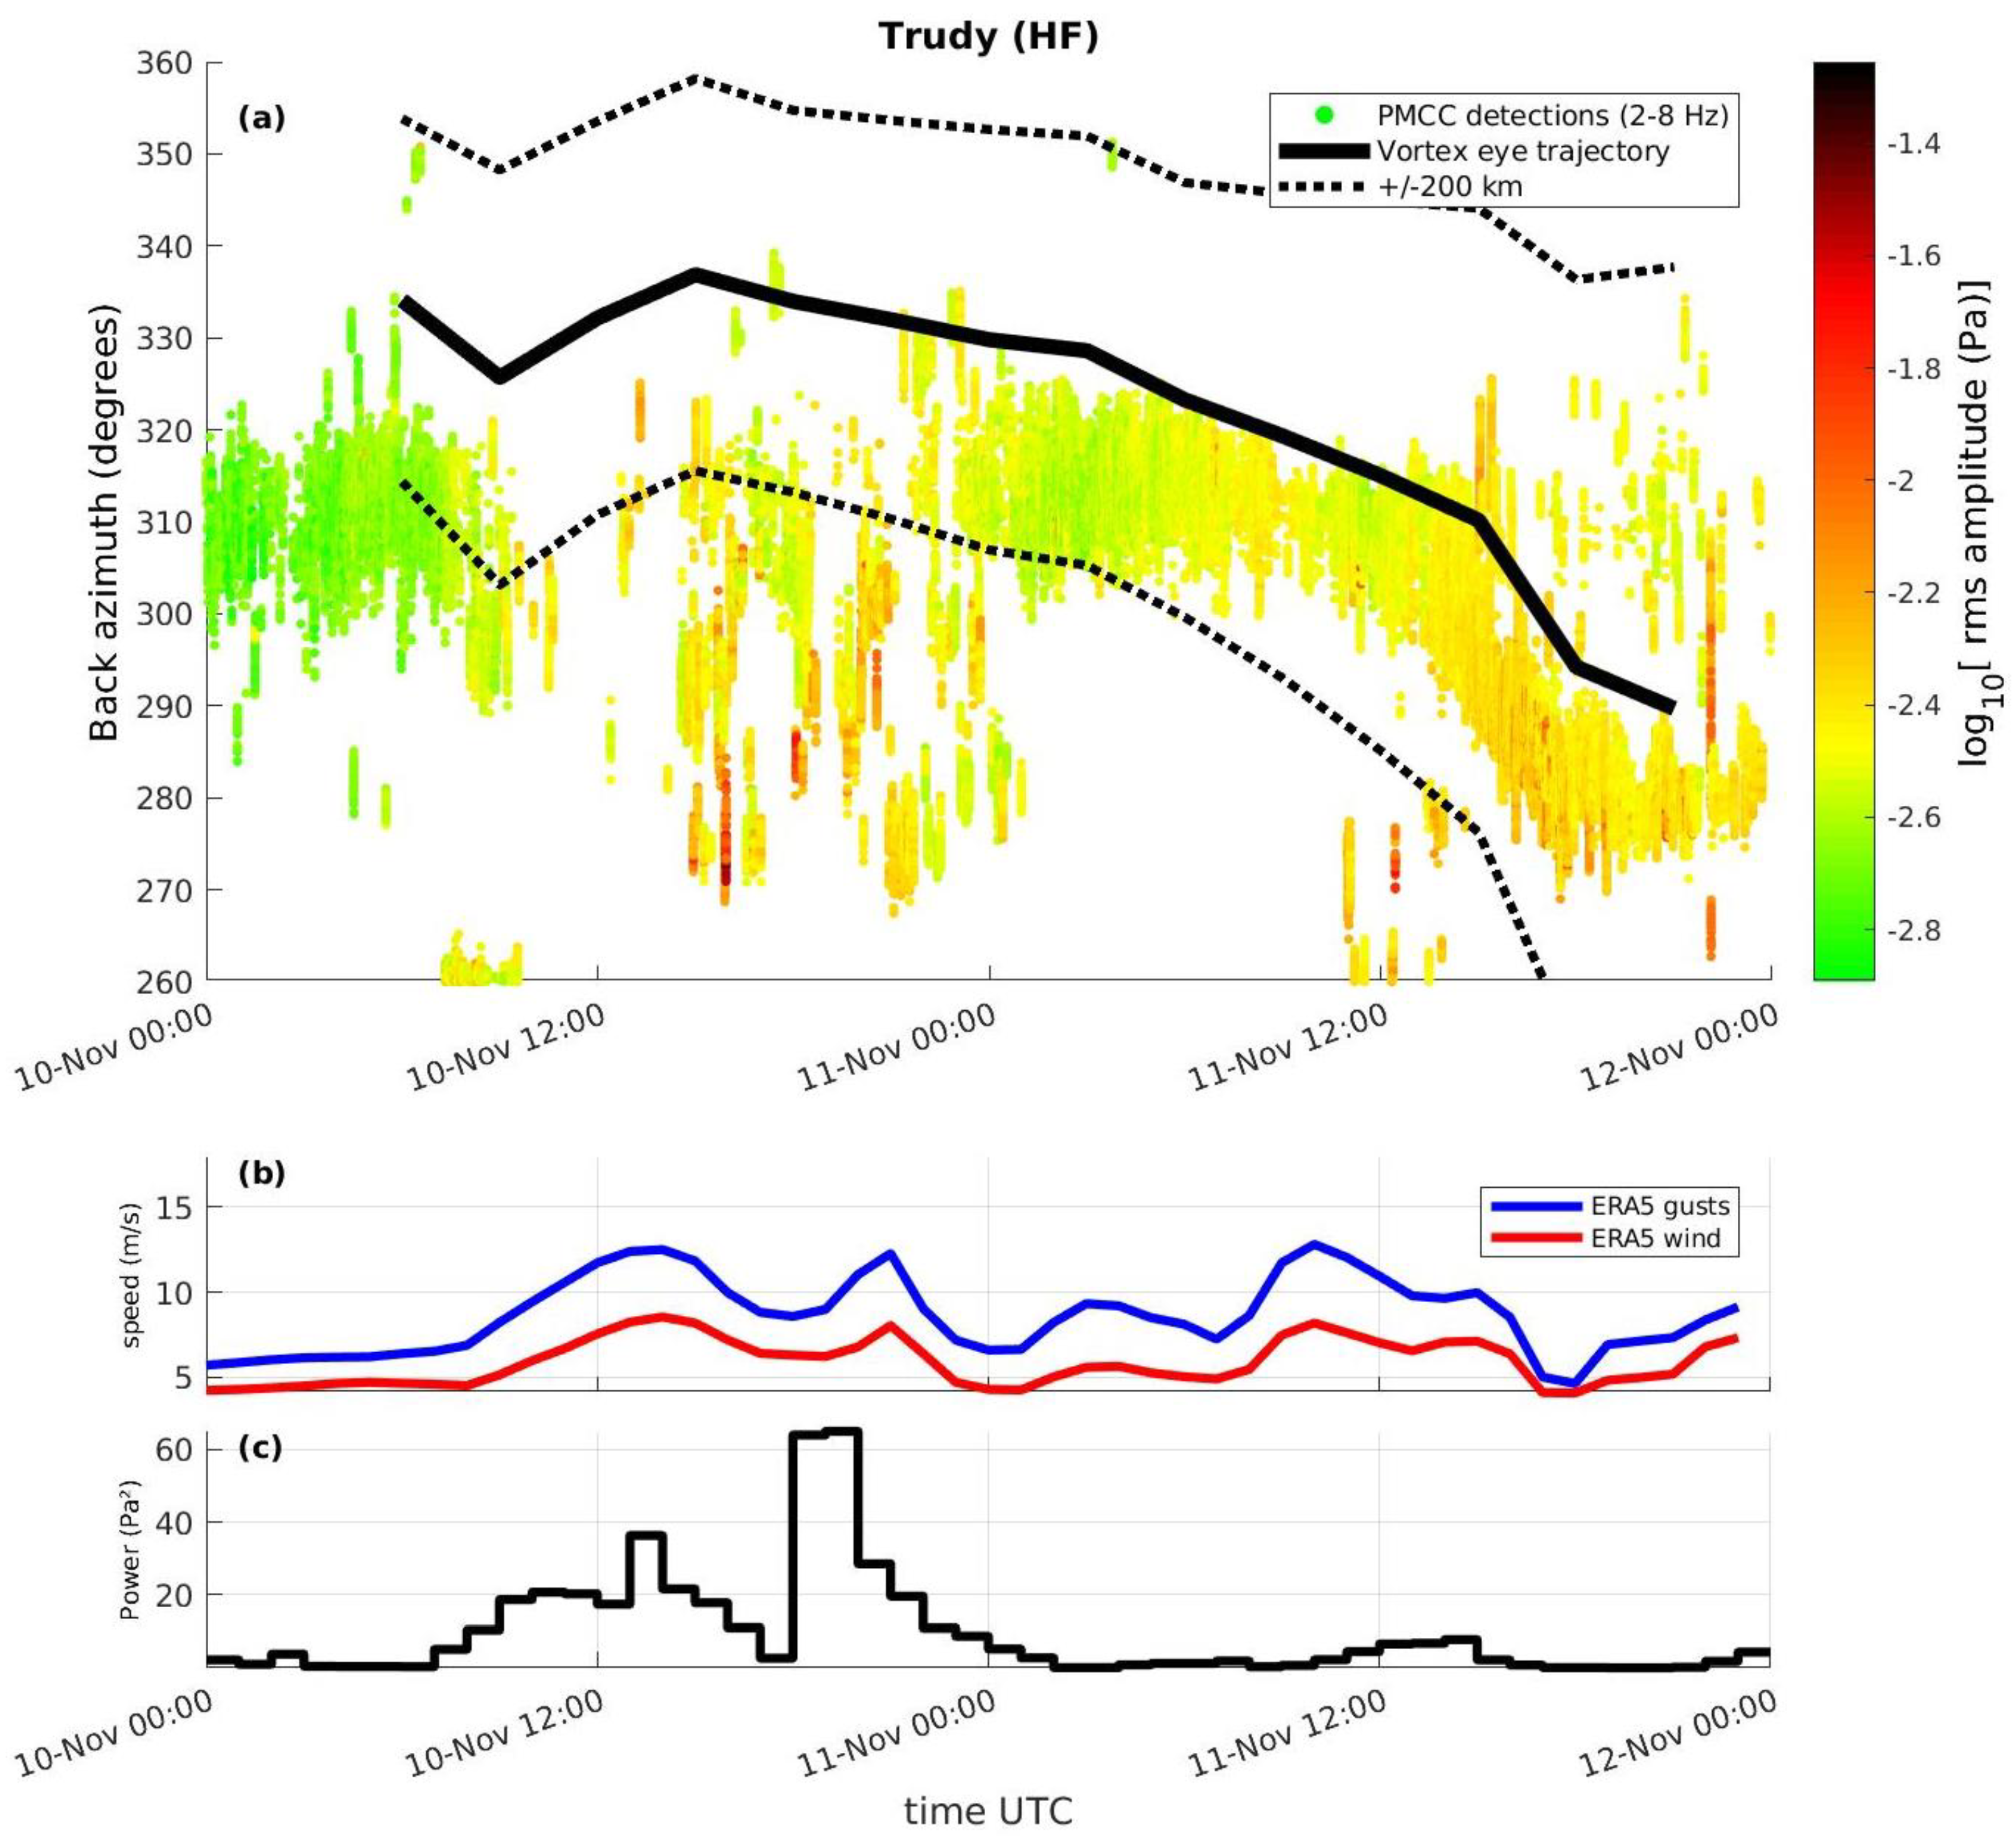
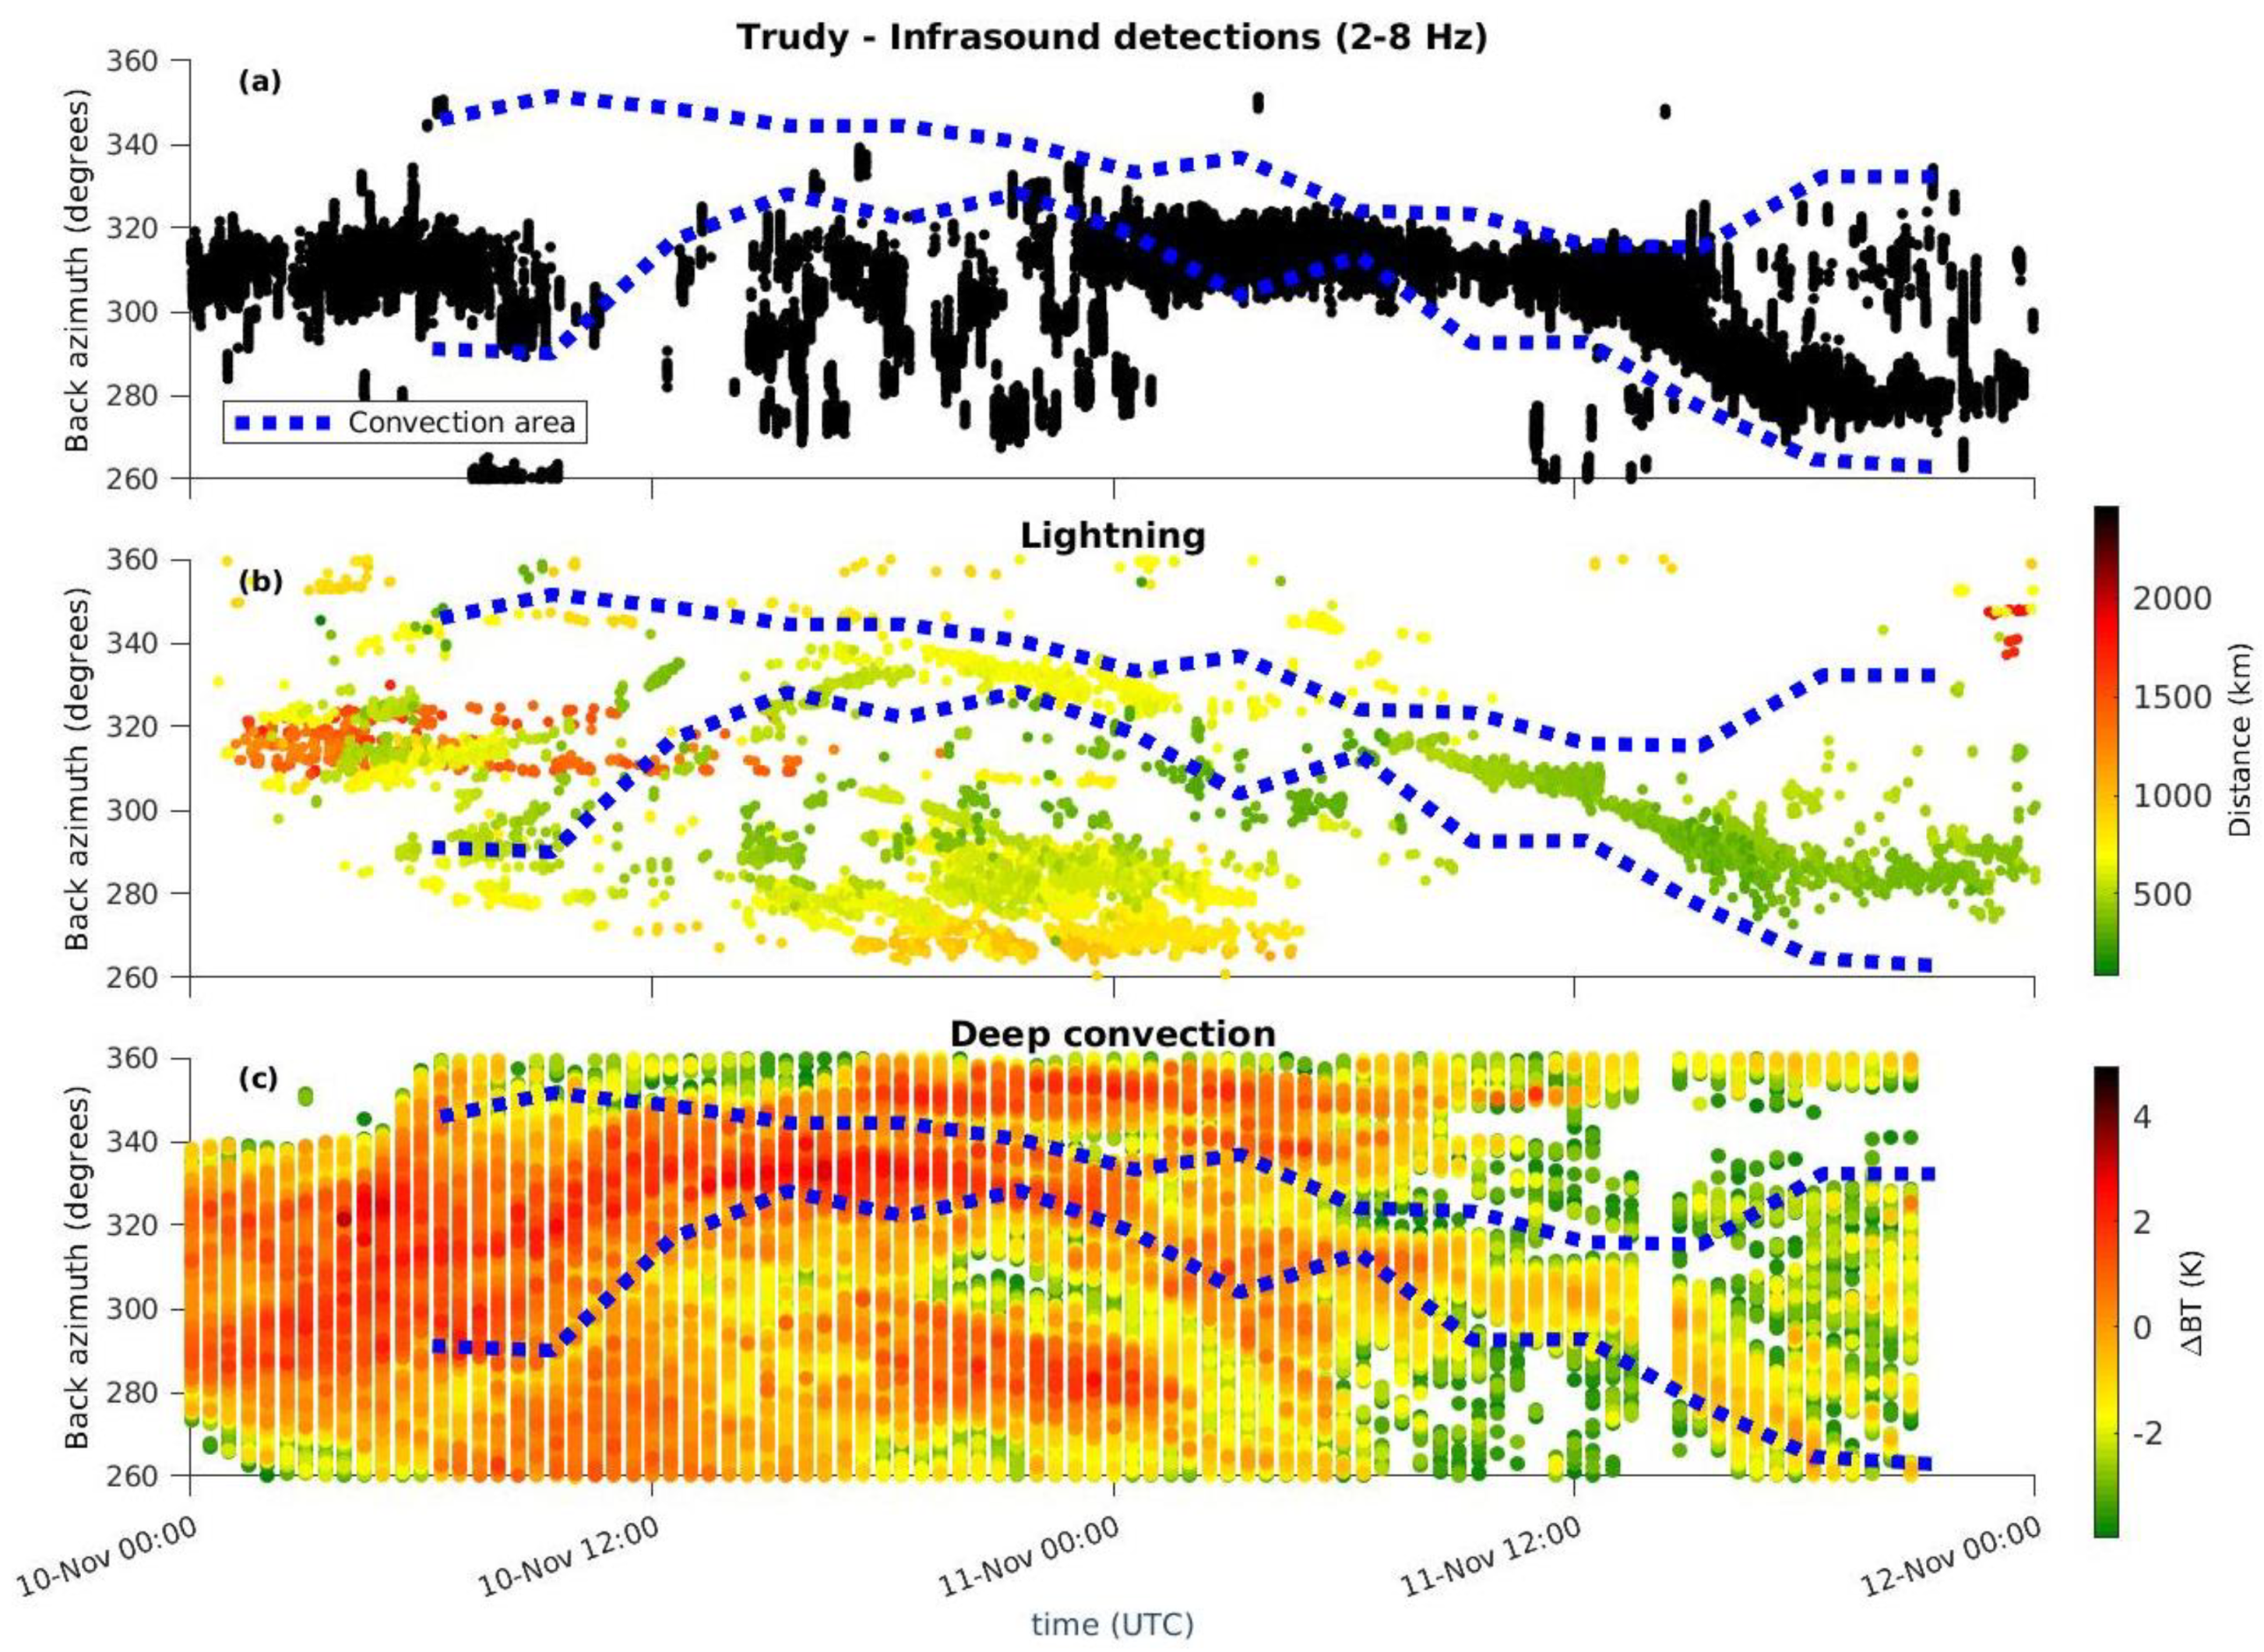
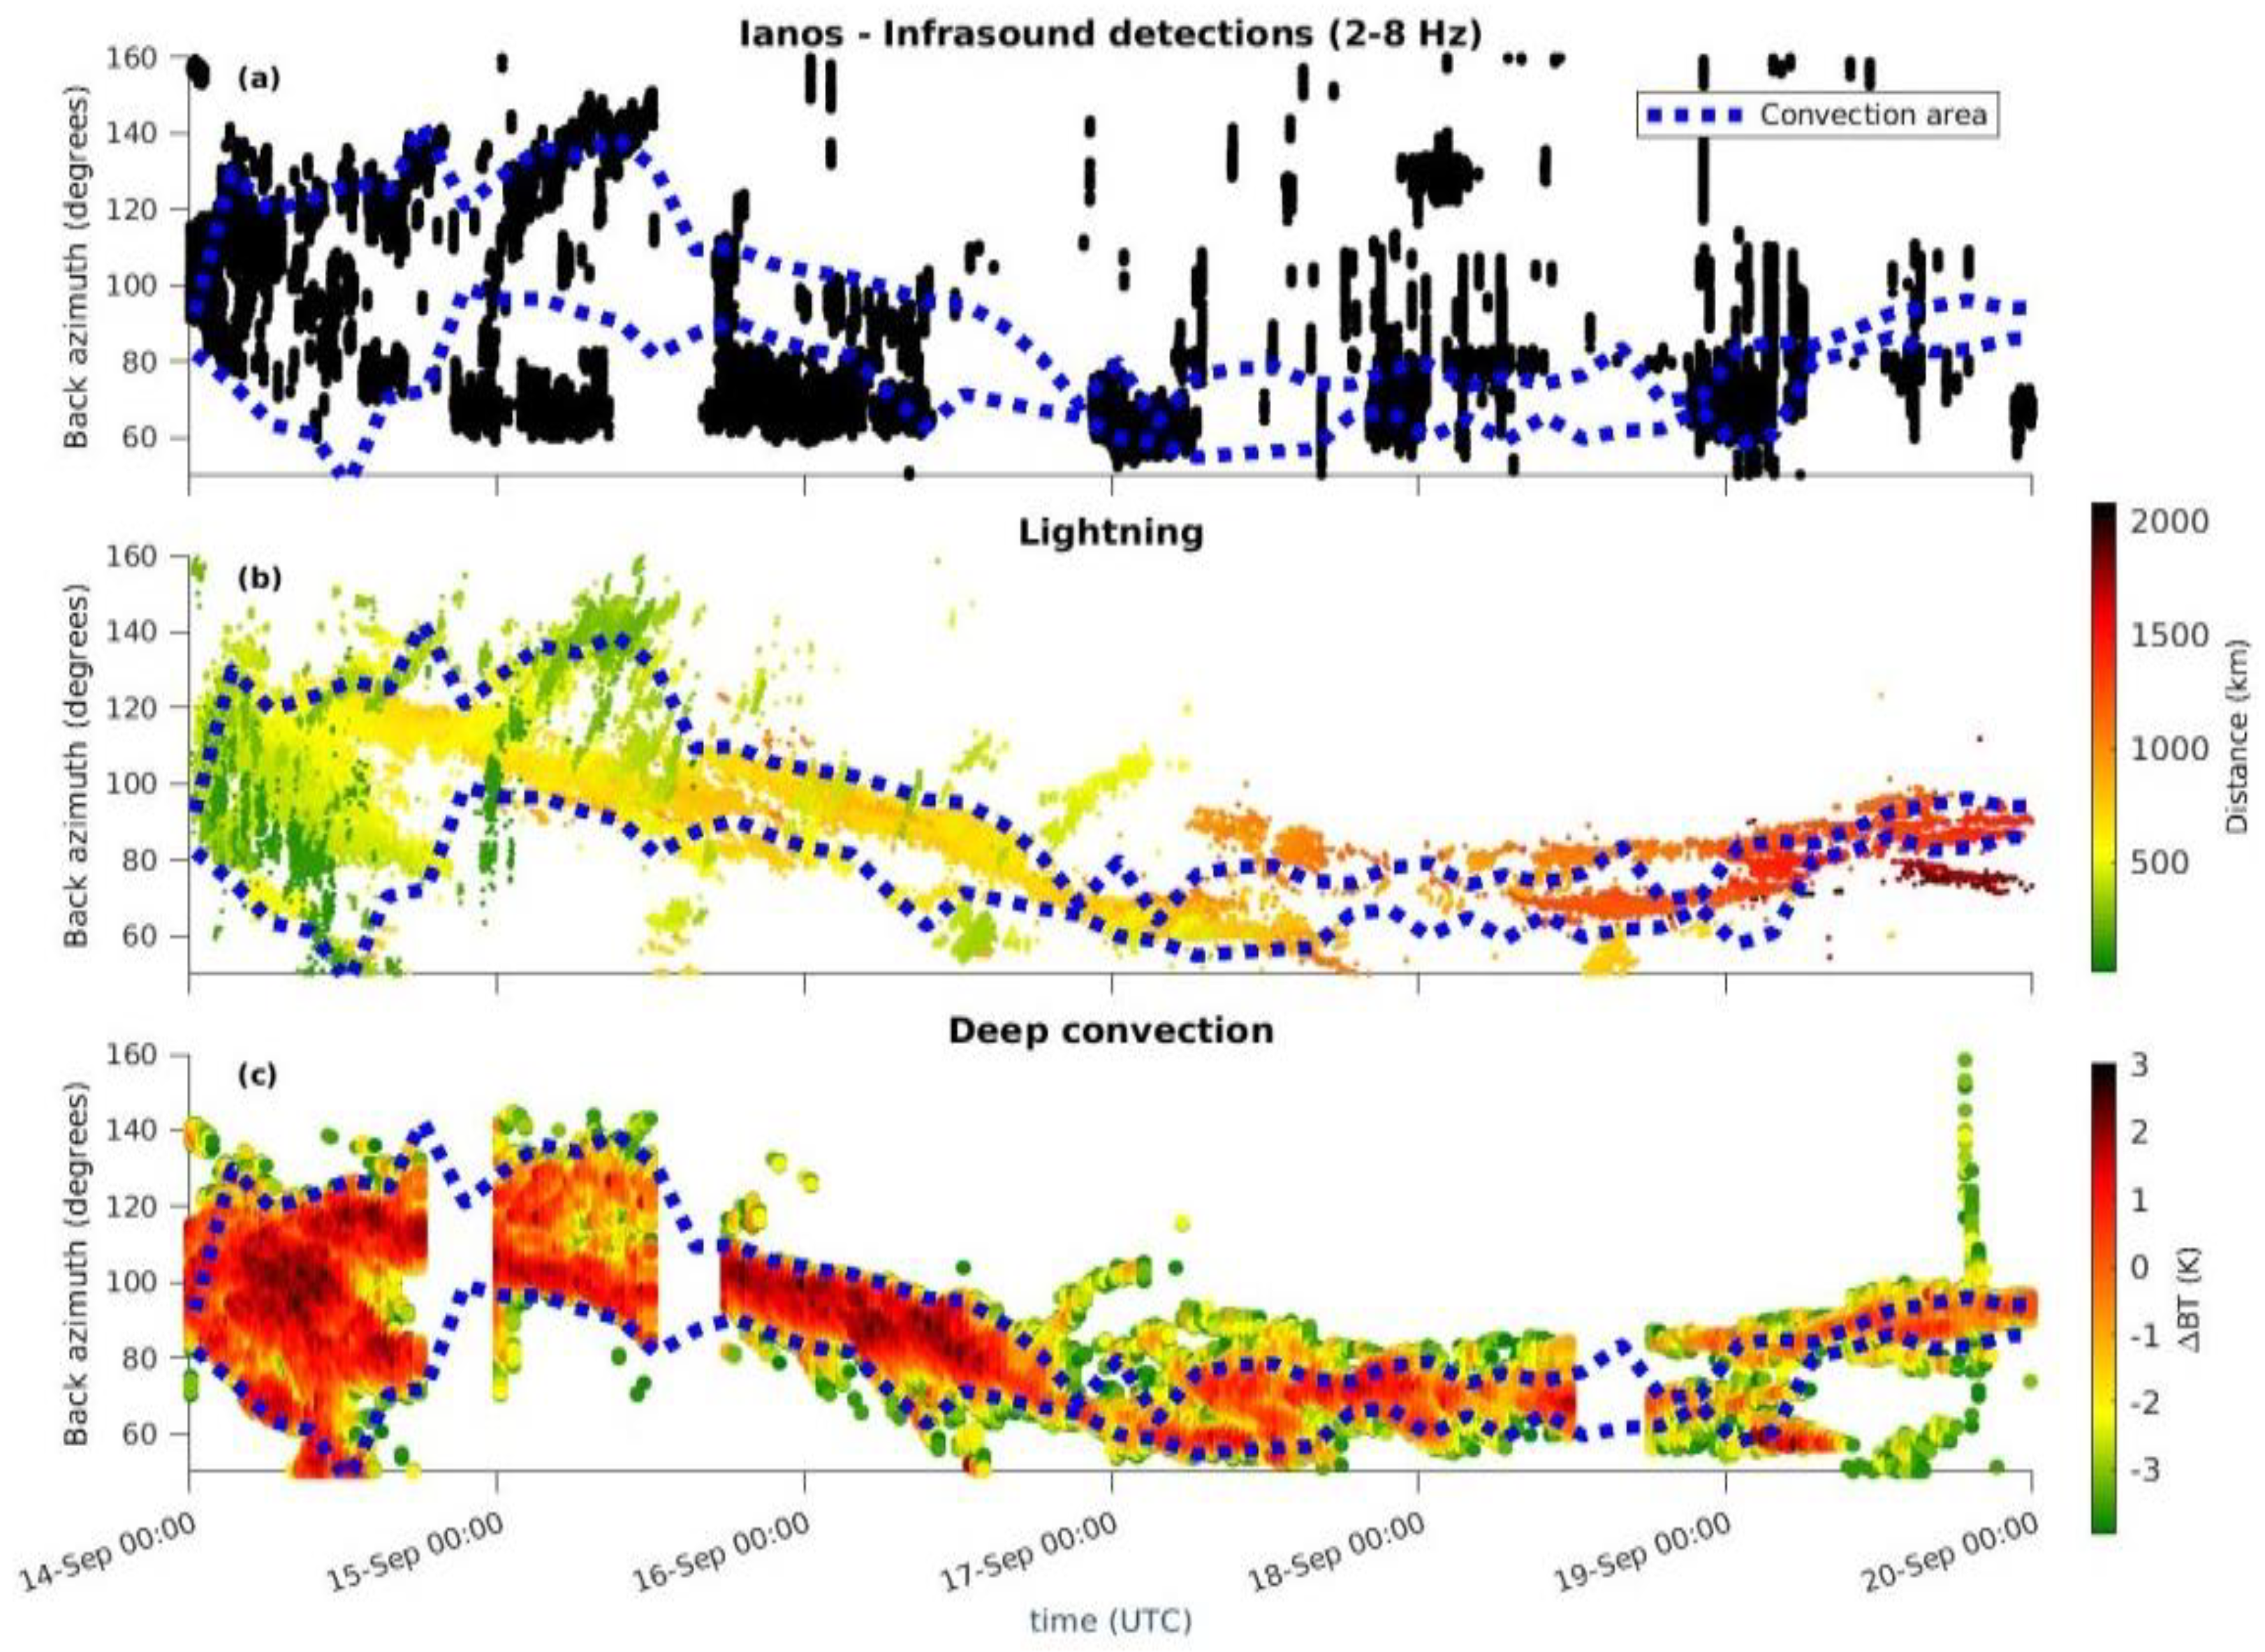
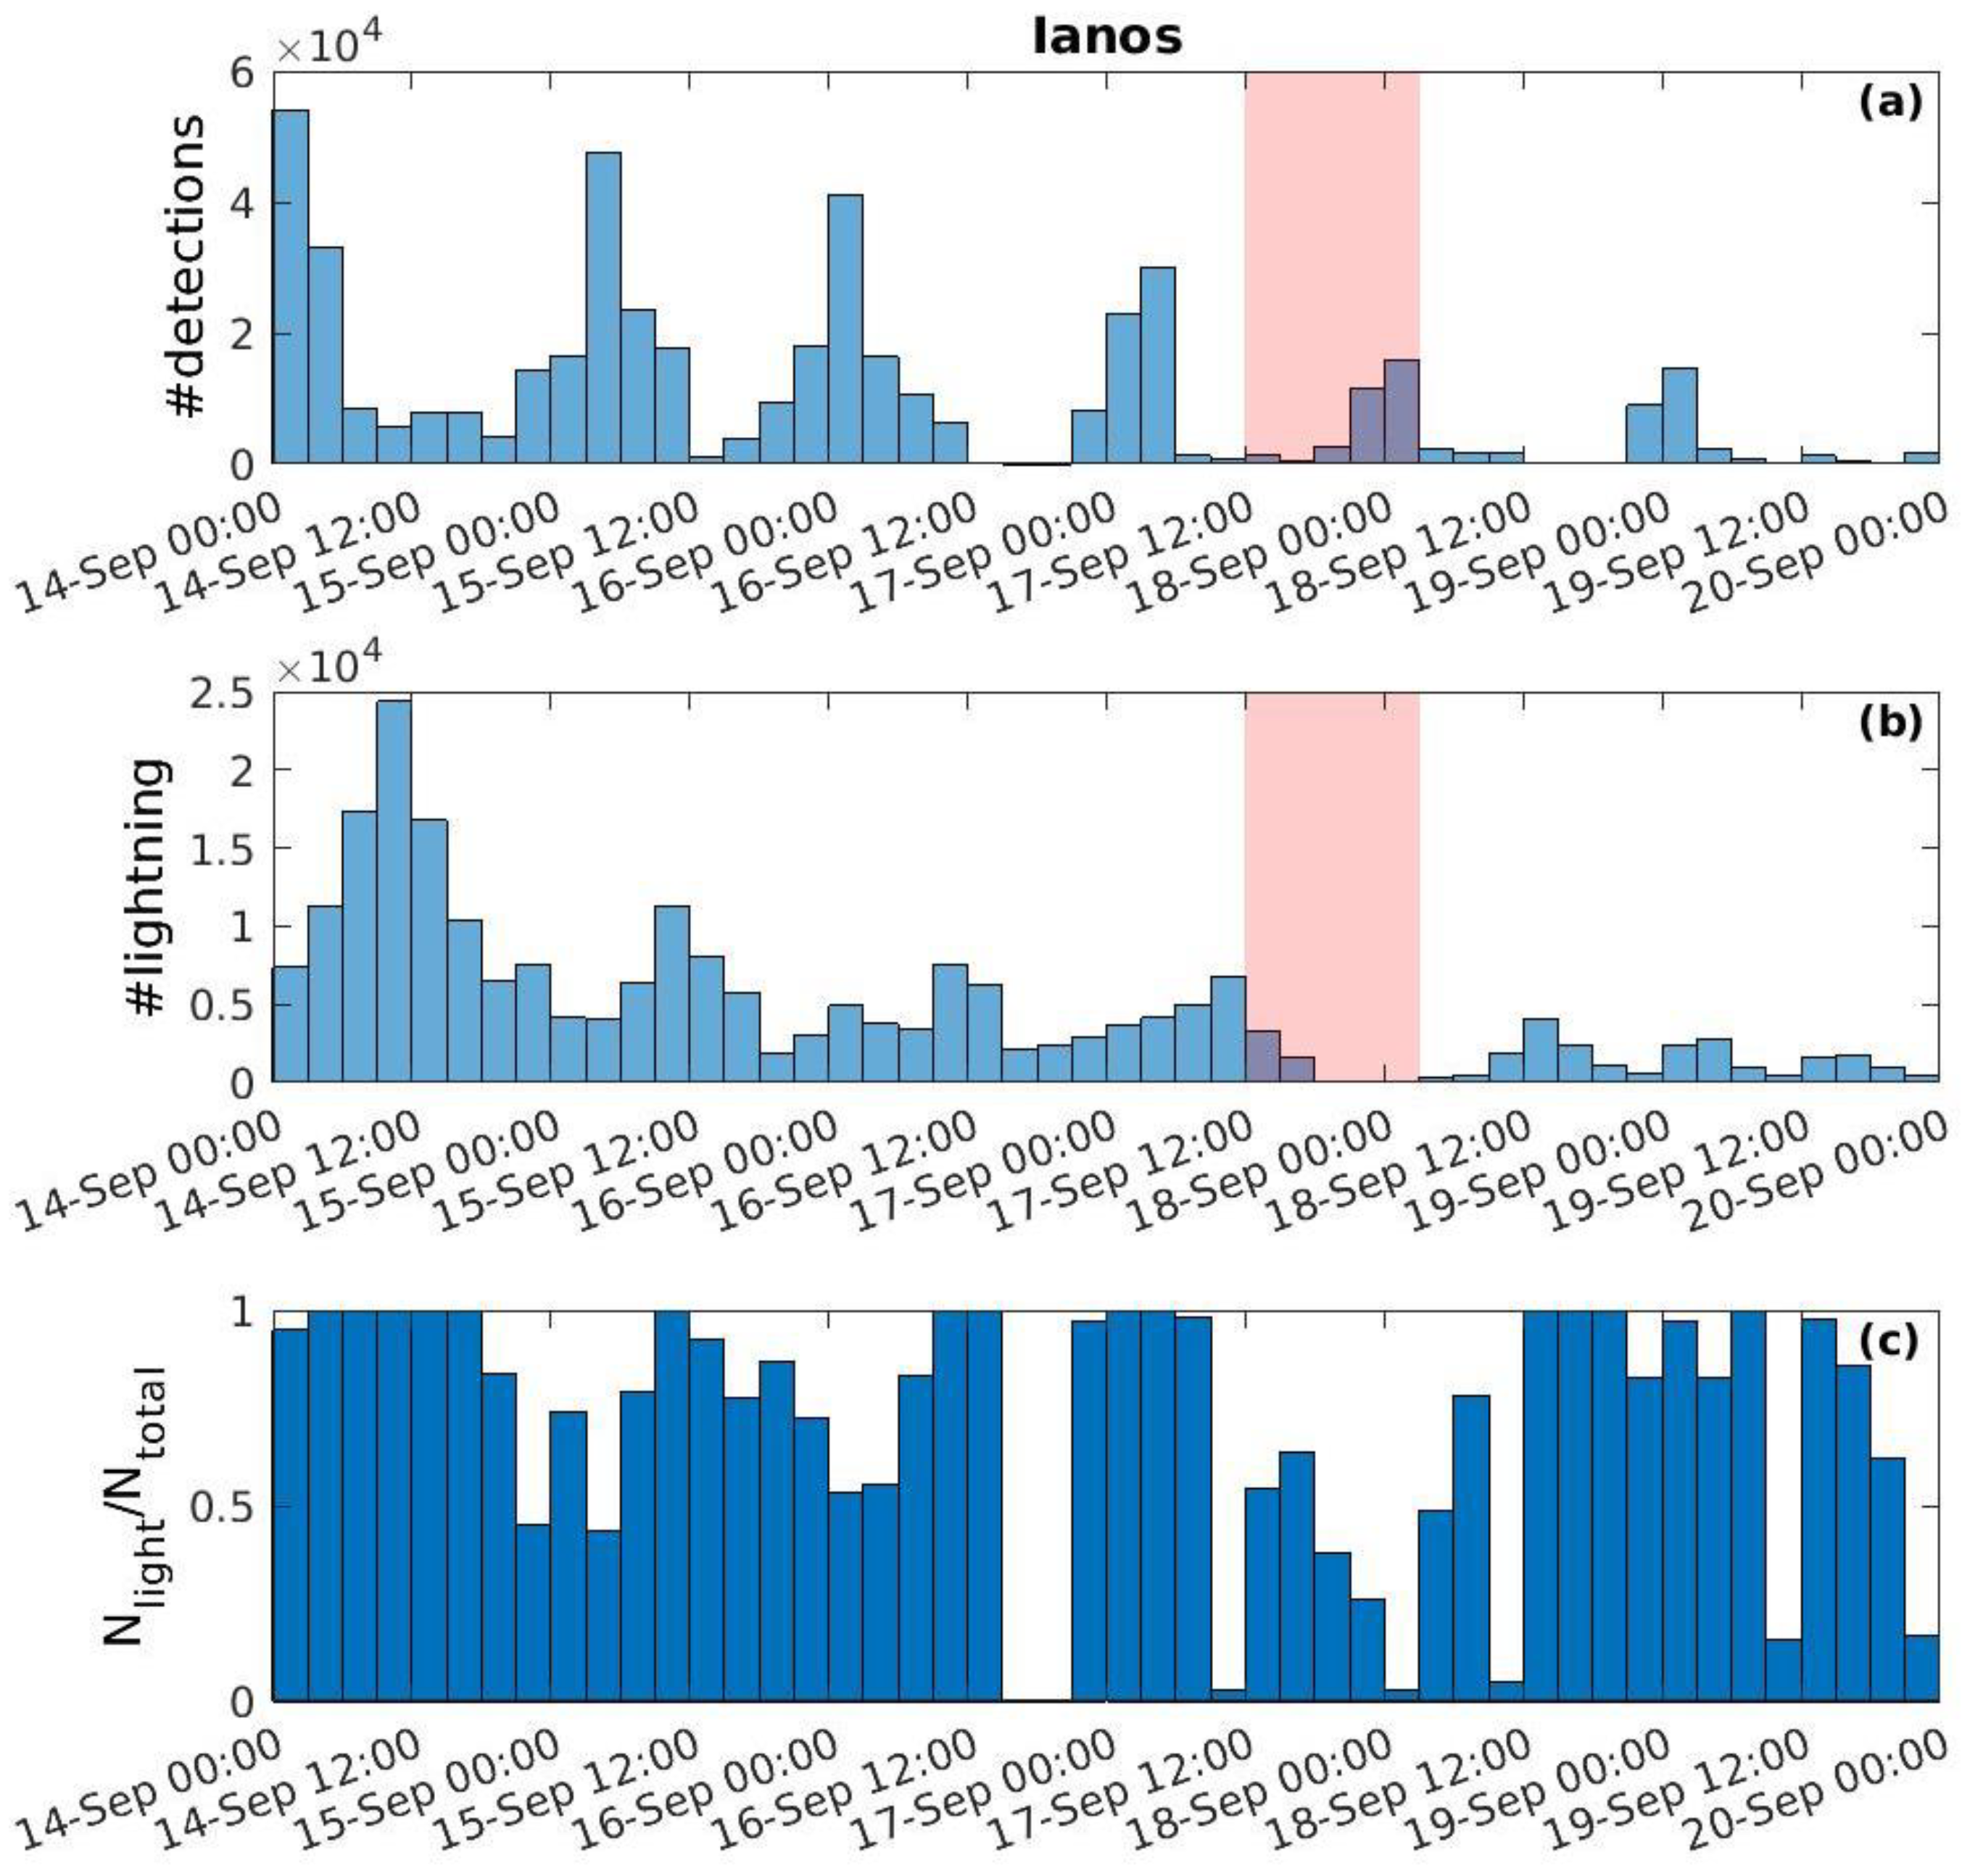
3.1. Higher Frequency Range: 2–8 Hz

PMCC processing on IS48 waveforms during Medicane Trudy shows continuous detections between the 10th and the 12th of November 2019 in the 2–8 Hz band (Figure 3a) when the vortex made landfall (Figure 2). The trajectory is determined with the help of satellite data, with the vortex being only discernable starting on the 10th of November 06:00 UTC. Coherent detections are obtained between 300° and 320° until the 11th of November 2019, when the vortex trajectory bends southward as infrasound detections do. This points to the actual detection of sources related to the medicane. The root mean square (rms) amplitudes lie in the range 0.001–0.01 Pa and increase through time (Figure 3a), in accordance with the cyclonic system nearing the coast. An exception occurs during the period between the 10th of November 12:00 UTC and the 11th of November 2019 00:00 UTC when detections are interrupted or scattered around lower azimuth values (270–300°). This is partly due to wind noise at the station in relation to high winds and gusts, as demonstrated by ERA5 reanalysis values extracted at the nearest grid point (Figure 3b), confirmed at a very local scale by the integral of the power spectral density (PSD) at a lower frequency range (0.01–0.1 Hz) on an hourly basis (Figure 3c). It is the part of the spectrum indicative of high wind at the station (Marty, 2019). ERA5′s gusts cannot systematically explain the presence or absence of wind noise at the station and for instance the absence of it around 12:00 on the 11th of November, due to the model resolution not being able to account for local conditions. Indeed, prohibitive values of gusts with respect to infrasound detection (~10 ms−1) are simulated (Figure 3b), while wind noise is almost absent at the sensor (Figure 3c). Another reason for the “noisy” detections covering a wide back-azimuth range between the 10th of November 12:00 UTC and the 11th of November 2019 00:00 UTC is the presence of another convective system and its associated lightning at lower back-azimuths (270–300°), as discussed in Section 4.
PMCC processing on IS48 waveforms during Medicane Ianos shows detections in the direction of the medicane’s vortex (Figure 4a), however, with a large spread around the trajectory of the eye. The lack of detections consistently occurs when wind noise at the station is significant (Figure 4c). Interestingly, ERA5 wind gusts are able to correctly explain the diurnal cycle of wind noise at the station computed locally (Figure 4b), despite its resolution being more prone to account for regional rather than local processes. In addition, the Etna volcano was active at that period [75], and its azimuth is reported (horizontal dashed line) (see the discussion in Section 4.2). When limiting oneself to the detections in between the dashed lines, the rms amplitude of the detections decreases as the vortex gets further away from IS48, from 0.003 Pa to 0.00025. In Section 4, we discuss how to further discriminate between Etna- and Ianos-related detections.
In the higher frequency range, no significant detections were obtained for the Μedicanes Zorbas (but for a very few hours, see Section 3.2), Apollo, Trixie, and Qendresa because of the absence of a stratospheric waveguide and, or, the presence of strong wind at the station (Section 4.1).
Distributions of the rms amplitudes and trace velocities of the detections plotted for the whole investigated periods for both Ianos and Trudy in the 2–8 Hz band are shown in Figure 5. The bimodal distribution of rms amplitudes for Ianos relates to the detections of lightning and the Etna volcano. Both are responsible for the lower amplitude recorded (~0.001 Pa), while the former is mainly responsible for the distribution mode around 0.002 Pa. Infrasound detections at back-azimuth lower than 80° made before the 17th of November 00:00 UTC are interpreted as coming only from Etna, as discussed in Section 4.2. The distribution obtained for the detections related to Trudy peaks around 0.004 Pa. This is consistent with the medicane being closer to the station than Ianos. Trace velocities related to both medicane episodes show values consistent with stratospheric phases (340–370 m/s) [53,76].

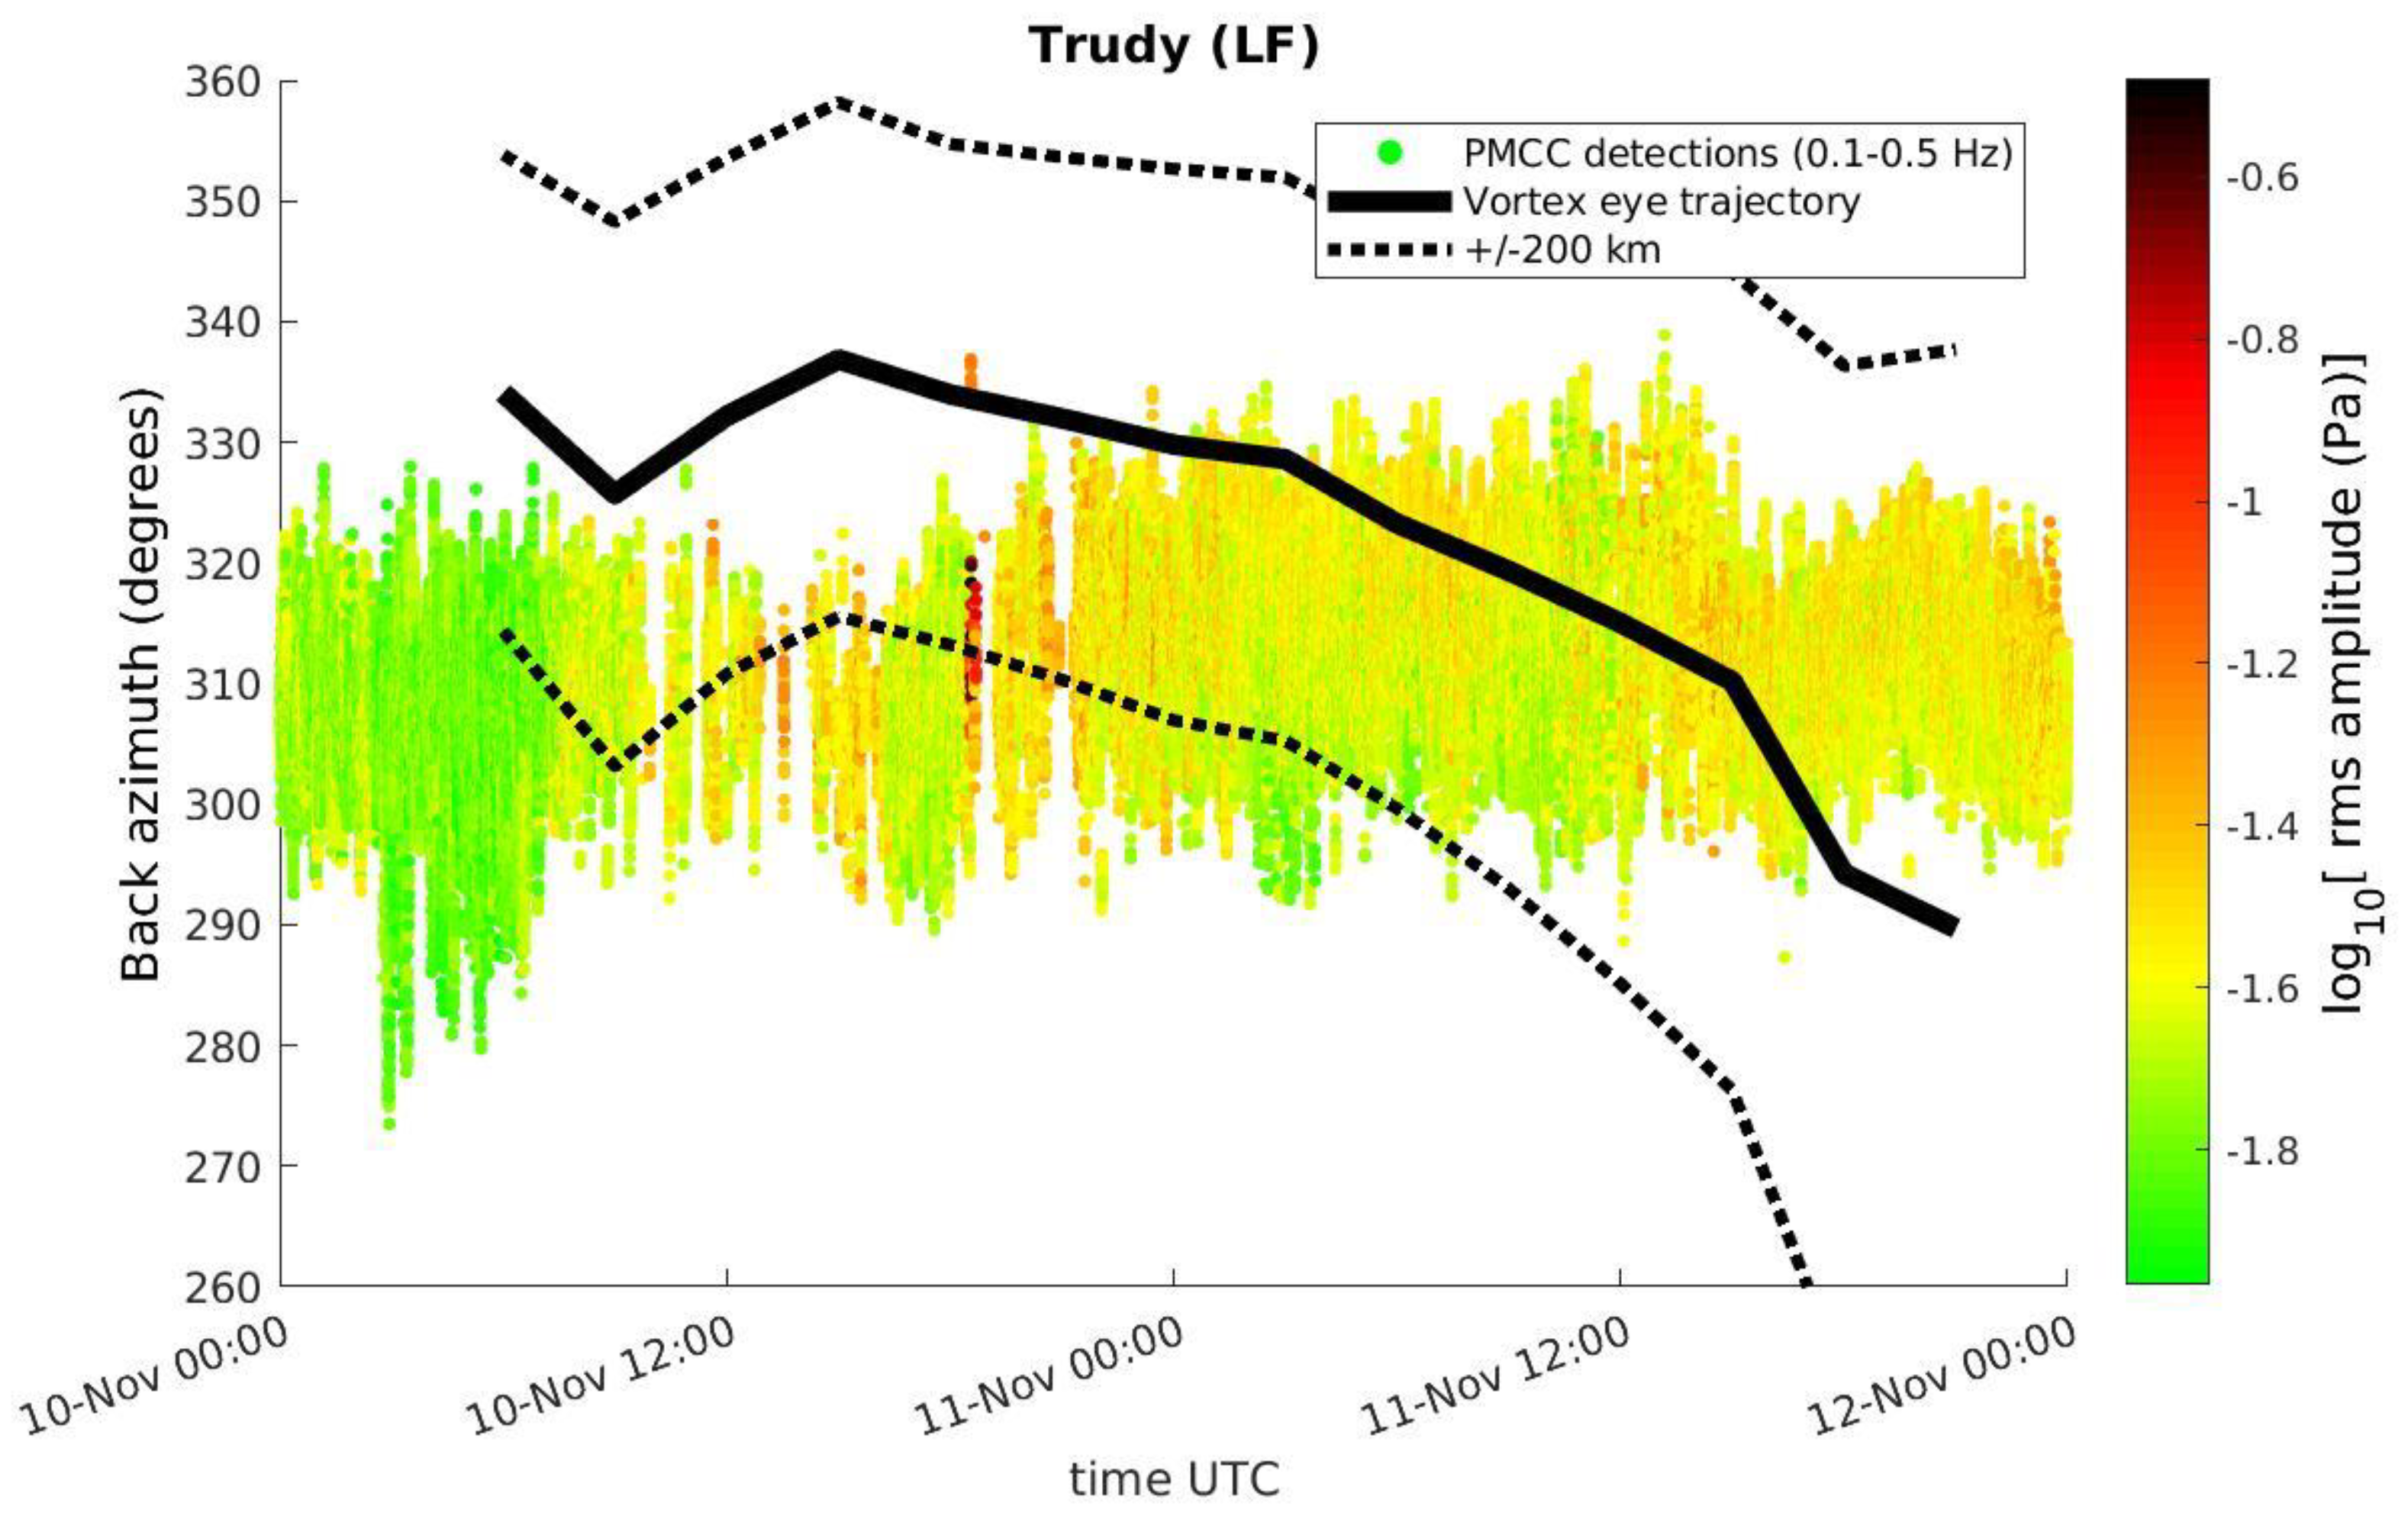
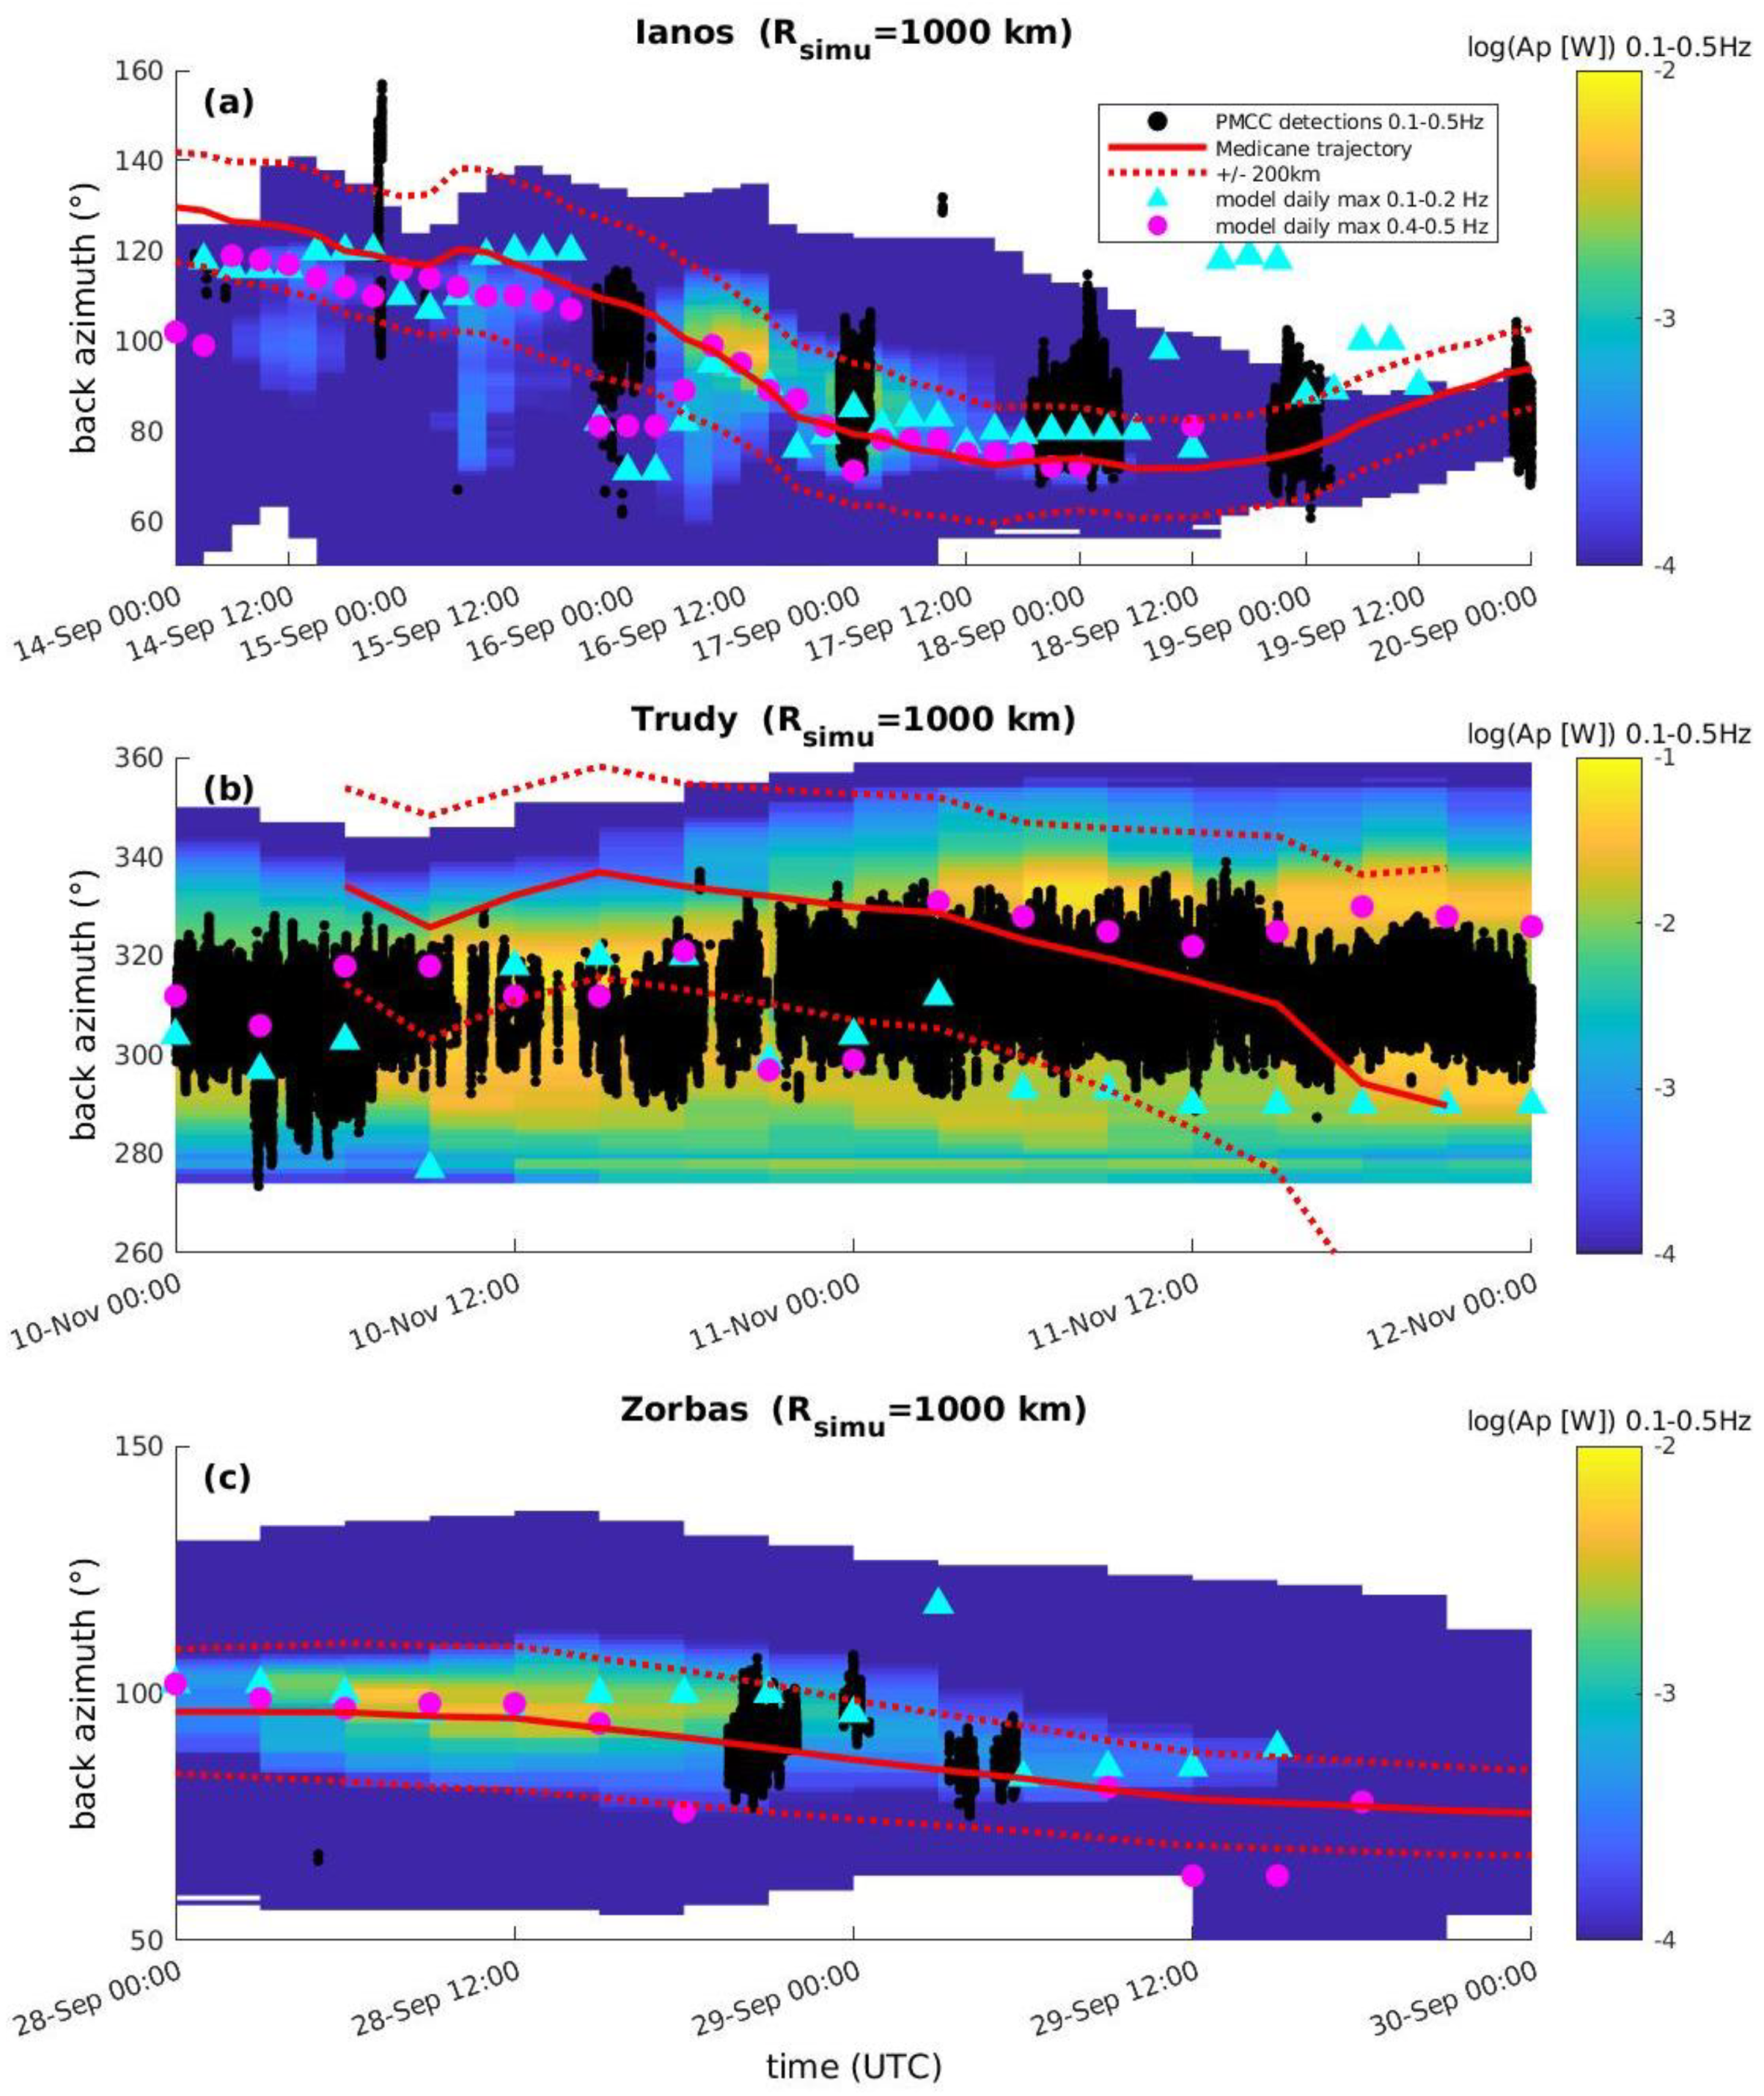
3.2. Low Frequency Detections: 0.1–0.5 Hz

At a lower frequency in the 0.1–0.5 Hz range, which is characteristic of microbarom emission, Medicanes Trudy, Ianos, and Zorbas show coherent detections, which are illustrated in Figure 6, Figure 7 and Figure 8, respectively. Figure 6 shows detections during Trudy with no particular evolution that can be correlated with the medicane’s eye trajectory, as opposed to the low-frequency detections obtained during Ianos, where the detections in the microbarom range clearly follow the vortex eye path (Figure 7).
The main reason for this difference between both sets of medicanes’ detections is possibly the fact that the back-azimuths also correspond to the north Atlantic swell in the case of Trudy, which is a constant hotspot for microbarom emission [66]. This will be further discussed in Section 4.3. An additional likely explanation is that the medicane is too close for the infrasound antenna to be able to resolve the progression of the wave activity of an extended source at the surface of the sea as the medicane progresses towards the coast (see discussion in Section 4.3).
Microbaroms induced by Ianos’ winds and related waves are well detected by the infrasound station, with back-azimuths corresponding to the eye’s trajectory (Figure 7). Moreover, the amplitude of the microbarom signal is consistently decreasing from ~0.01 to ~0.001 Pa as the medicane becomes more distant, from 600 km to 1300 km away from IS48. As opposed to the higher frequency range, no detections occur in the direction of the Etna volcano. The apparent diurnal cycle of microbarom detections is due to the local wind noise conditions, which are degraded during the day when turbulence and convection maximize (Figure 4c).
During Medicane Zorbas, detections are obtained in the microbarom frequency range in the direction of the mesocyclone’s eye at times when winds and noise at the station are the lowest, between the 28 September 18:00 UTC and the 29 September 06:00 UTC (Figure 8c). The amplitude is decreasing from ~0.015 Pa to ~0.005 Pa. This trend suggests it is indeed the detections of the swell triggered by the medicane that are observed when Zorbas moves from 850 to 1000 km away from the station (Figure 2). It is worth pointing out that no clear stratospheric waveguide is established during Medicane Zorbas (see Section 4.1 and Figure 10), compared to the other two medicanes so that the attenuation is more pronounced than for Ianos. However, the fact that higher frequency detections occured for a few hours only on the 29th of September 2018 at 00:00 UTC in the direction of the medicane (not shown) actually suggests the temporary formation of a favorable stratospheric guide. It could also be that thermospheric guiding is occurring to explain the microbarom detections and the small amount of higher frequency detections. This guiding relies mainly on the temperature increase, which characterizes the thermosphere, and is the most persistent guide [77]. However, the longer paths needed for these (thermospheric) trajectories should result in larger attenuations and then less thermospheric detections at the surface on average (even in the 0.1–0.5 Hz range) [21].
We present distributions of the rms amplitudes and trace velocities related to detections made during the three medicanes in the low-frequency range (Figure 9). We consider three different frequency sub-ranges (0.1–0.2 Hz, 0.2–0.4 Hz, 0.4–0.5 Hz) to highlight the complexity of the sources at play. In general, and as expected, larger amplitudes are observed in the 0.2–0.4 Hz band than in the 0.4–0.5 Hz band, where acoustic energy is more attenuated. For Medicane Ianos, the amplitudes are 5 to 10 times lower than for Medicane Trudy, and amplitudes related to Zorbas have intermediate values. The similar distance to the station for Ianos and for Zorbas, respectively, suggests that the differences in amplitudes are related to the infrasound guiding being less efficient during Zorbas, resulting in a larger attenuation of the signal (Section 4.1). The higher amplitudes recorded during Trudy can be related to the fact that the medicane—hence the associated swell—is closer to the station.
The North Atlantic (NA) Ocean is a well-known permanent hot spot for microbarom emissions [67]. Detections in the 0.1–0.2 Hz band are hardly present during Medicanes Ianos and Zorbas, suggesting their main origin is the NA since the infrasound guide at play is westward for these cyclones that are to the east of IS48. The back-azimuths related to these detections confirm this (see the discussion in Section 4.3 also). These observations suggest that the detections in the 0.1–0.2 Hz band during Medicane Trudy also have a large contribution from the NA swell. This explains the fewer detections in that band because the source is more distant and so more attenuated.
As in Figure 5, derived trace velocities are consistent with stratospheric phases (Figure 9, bottom). During Medicane Zorbas, velocities in the 0.2–0.4 Hz band (~365 m/s) are larger than those in the 0.4–0.5 Hz band (~355 m/s), suggesting a likely contribution from higher altitudes for the former case (as opposed to Medicanes Ianos and Trudy) as larger trace velocities mean higher incidence angles. This seems consistent with the weaker stratospheric guiding during Zorbas (Section 4.1) compared to that during Trudy and Ianos, when propagation conditions are well established at a given altitude range for both frequency bands. Values above ~380 m/s may suggest the presence of thermospheric phases; however, their contribution is relatively minor, so the contribution from these highest layers, as mentioned above (related to Figure 8), should be marginal.
During the lifetimes of Μedicanes Qendresa, Trixie, and Apollo, no detections were obtained in the 0.1–0.5 Hz range due to wind noise being too large at the station and/or infrasound guiding not being favorable to westward propagation (see discussion Section 4.1).

4. Discussion: Propagation Conditions, Wind Noise Effect, Source Identification

4.1. Middle Atmospheric Waveguide and Noise Effect

Figure 10 and Figure 11 illustrate the presence and absence of stratospheric waveguide in the medicane-to-station direction, respectively, as derived above from IS48 and based on ERA5 data. Vertical profiles of cratio are plotted at different times, where cratio is the ratio of the effective sound speed at the altitude z, ceff (z), to its value at the surface, ceff (z = 0). Both effective wind speeds are derived assuming propagation between the Medicane’s eye and the station, updating the position of the eye at every considered time step. Values of cratio > 1 are a necessary condition to obtain detection from the medicane at the station in the geometric acoustics (high frequency) approximation. It is evident from both figures that a clear stratospheric waveguide was established only during the lifetimes of Medicanes Ianos and Trudy. Vertical profiles of cratio were also investigated at mid-distances between the station and the medicane and also at the medicane location, leading to similar conclusions (not shown). This demonstrates that the middle atmospheric waveguide is homogeneous, distance-wise.
The used definition of the cratio assumes an infrasound source located at the surface. While this holds true for microbaroms, it does not for other tropospheric sources, such as lightning. The exact altitude of infrasound emission that is caused by each lightning stroke in the troposphere is not known: pressure waves are emitted all along the return stroke channel for cloud-to-ground flashes and along the intra-cloud discharges [40,78]; different mechanisms of infrasound generation have been suggested by several authors (e.g., [41,79]). The derived cratio used here is thus a lower limit of the actual value in the troposphere: ceff (z) tends to decrease with altitude, and, as a consequence, ceff (z) values for a source located above the surface in the troposphere will be lower and the corresponding cratio will be larger. We thus underestimate the strength of the stratospheric guide for infrasound sources such as lightning.
For Trudy (Figure 10, middle), the ERA5 fields indicate a permanent waveguide (cratio > 1), while it is more episodic for Ianos. During Medicane Ianos, the maximum of cratio remains often close to one at times when it is not above one. To this respect, one needs to recall the fact that reanalysis fields are biased because of the limited ability to correctly represent small-scale perturbations such as gravity waves in the IFS model, leading to wind and temperature low biases in the middle atmosphere on instantaneous profiles as well as on average profiles [80]. Thus, it is often needed to consider an additional wavefield to account for these perturbations in infrasound propagation simulations (e.g., [81]). It is thus likely that values of cratio lower than, but close to, one actually correspond to the guiding of infrasound due to unresolved variability. This would help explain the continuous detection coming from the direction of Ianos (when local wind noise does not prevent from detecting), although the infrasound guide is not strictly permanent (cratio > 1) throughout Ianos’ lifetime. Due to these unresolved internal gravity waves in the IFS model, slightly smaller than one values of cratio are still indicative of favorable guiding conditions. Hence, a value of 0.95 is also considered favorable to guiding, as in previous infrasound studies (e.g., [42]). Figure 10 then shows that for Ianos the guiding is also permanent. Stratospheric guiding is hardly established during Zorbas, explaining the lack of high-frequency detections except for a few hours at the time when microbarom emissions from Zorbas are detected (Section 3.2). The poor stratospheric guiding leads to infrasound detection during Zorbas only when wind noise gets to its lowest level (Figure 8c).
For the other medicanes, Apollo, Trixie, and Qendresa (Figure 11), no stratospheric waveguide is established at any time, explaining the lack of detections coming from their respective directions.
Additionally, the fact that no detections seem to be coming from the latter three medicanes at lower frequencies through thermospheric paths can also be the result of wind noise at the station. This is demonstrated by local wind noise levels being significantly higher for Trixie and Qendresa than for the other medicanes. This is the case for at least half of their lifetime or their entire lifetime, respectively (Figure 12), when they are the closest to the station (i.e., less than 600 km away from the station). For Qendresa, PSD integrated values between 0.01 and 0.1 Hz are constantly above the value of 50 Pa2, which is the absolute maximum reached during Trudy (Figure 3c) and Ianos (Figure 4c). Recall that Qendresa and Trixie both occurred prior to the upgrade of IS48′s wind noise reduction system (Section 2.1). During Apollo, the wind noise bears similarities with that during Ianos (and the diurnal wind noise cycle is also observed). In the case of Apollo, only the absence of guiding (leading to strong attenuation) explains the absence of significant infrasound detections from stratospheric phases.

4.2. Discussion on the Sources Responsible for the Higher Frequency Infrasound

Convective systems are known to generate infrasound, and this is at least partly due to the electrical activity, although other mechanisms appear robust, as recalled in the introduction [36,37]. In order to explore the likely infrasound sources responsible for detections at 2–8 Hz, we compare these observations with the lightning detections by the WWLLN (Section 2.4) and the direction of deep convective clouds (DC pixels, Section 2.3) with respect to the station. Figure 13 illustrates these comparisons for Medicane Trudy. WWLLN detections within 1000 km of the medicane’s eye are mapped in the azimuth-time framework, with the colormap indicating the distance of lightning to the station (Figure 13b). The dashed blue line in all subplots indicates the edges of the convective system that are the closest to the station and related to the medicane. These edges were manually picked up by using the online tool by EUMeTrain, where 10.8 μm BTs are provided (http://resources.eumetrain.org/ePort_MapViewer/index.html, accessed on 28 November 2022). Independently, the azimuths of the DC pixels were mapped in all directions relative to the station (Figure 13c). The DC pixels with larger values of ΔBT are plotted on top of the DC pixels with lower values. Recall that a larger ΔBT indicates deeper convection. It is clear that the manual picking of convective systems’ edges is consistent with the mapping of DC pixels. However, the latter provides enhanced information, which allows us to better explain the westward noisy PMCC detections observed between the 10th of November 12:00 UTC and the 11th of November 00:00 UTC, for instance (Figure 13a). Indeed, another convective system is present at that time in the 270–300° back-azimuth range (Figure 13c). This leads to coherent PMCC detections appearing noisy and covering the gap (300–320°) between the detections from the medicane convective system (320–340°) and those from the secondary convective system (270–300°). This demonstrates how delicate the tracking of a single convective cell is and how multi-source issues need to be tackled for explaining PMCC detections in such meteorological scenes. Local wind noise is relatively larger at this period (Figure 3c), challenging the PMCC detector as well.
The most obvious feature when considering the three datasets together remains the variation of back-azimuths from 330° to 280° for PMCC detections, DC pixels, and lightning from the 11th of November onward, demonstrating the tracking of the medicane. The distance to the station of the detected lightning also consistently decreases through time (Figure 13b) as the mesocyclone approaches the coast and IS48. On the 11th of November 2019, lightning was clearly detected during Medicane Trudy and the other aforementioned convective system (between 270° and 300°). The similar distance of the lightning to the station (500–700 km) in both systems backs up the idea that both areas may be equivalent sources of infrasound. This can explain why no system takes over the other in the infrasound detections, leading to the noisy cluster of detections on that day (Figure 3a and Figure 13a). PMCC, as a mono-source algorithm, cannot handle multi-source detections. Note that the area considered to look for lightning around the medicane’s eye is larger than the area where DC pixels were mapped before being projected in the azimuth-time framework. Thus, DC pixels devoid of simultaneous WWLLN detections are indeed convective areas without electrical activity according to WWLLN. No systematic WWLLN detections occur where deep convection is present; clouds will be the source of lightning depending on their microphysical properties [82,83]. Moreover, WWLLN detection efficiency (Section 2.4) suggests that part of the cloud-to-ground (CG) lightning activity will be missed by the network [65]. Interestingly, PMCC detections (Figure 13a) mainly follow the pattern of WWLLN detections, suggesting the prevalence of cloud-to-ground (CG) lightning in PMCC detections and the much smaller contribution of deep convection [37] or of the rotating deep convective system [35] as an infrasound source per se (at least at distances larger than a few hundreds of kilometers). The largest spread of the PMCC detections in back-azimuths compared to the narrower spread of lightning back-azimuths (Figure 13c) has no obvious explanation. It can likely be related to azimuths’ deviation (see, e.g., [42], where up to 15° deviation is considered). Inter- and intra-cloud lightning (IG), which is largely missed by the WWLLN, can also generate infrasound [78]. Lacroix et al. [78] measured that ICs have significantly lower acoustic energy than CGs (20–30 dB lower), but this difference almost vanishes in the infrasound domain for a few Hz (see Figure 10 of [78]). A combination of IC lightning and CG lightning that is missed by the WWLLN could explain the additional infrasound detections not associated with WWLLN detections, and this will be explored further below.
Figure 14 displays the same observations as in Figure 13, but for Ianos. As with Trudy, the distance of lightning to the station decreases through time (Figure 15c), which is consistent with the decrease in signal amplitude of the infrasound detections (Figure 4a) related to the medicane moving away from the station (Figure 2), however, not weakening (Section 2.6).
The combination of the different datasets allows to clearly identify the Etna detections (Figure 14a) in the direction of which (~66°) neither convective cells (Figure 14b) nor lightning (Figure 14c) are observed, and more generally, between 60° and 80° azimuths in the time period 15th of September 00:00 UTC—16th of September 12:00 UTC. Additionally, near-field Etna infrasound observations, which constantly monitor the Etna activity [84,85], confirm the enhanced activity of the Etna on the 15–16th of September (highest amplitudes reached in the period covering the 14th to the 20th of September) and the lesser activity on the 17th, with another intensification by the end of the 18th and onwards (not shown, Emanuele Marchetti personal communication). Possible multi-source effects are affecting the infrasound detections on the 15th of September between 00:00 UTC and 12:00 UTC in the azimuth range 80–120°. Indeed, no infrasound detections occur but for larger azimuths (~120–150°) or lower azimuths (~60–80°). However, deep convection and lightning are indeed observed in the direction 100–120°. The lightning strokes in the higher azimuth range are two to three times closer to the station than the ones in the 100–120° range (Figure 14c). Hence, the detections of the former are favored at the expense of the latter, which are more distant. The PMCC algorithm picks up the strongest arrivals since it does not handle multi-source scenarios and detects alternatively the closest lightning (~120–150°), and the Etna (Figure 14a).
We further investigate the explicit link between lightning and infrasound for Medicanes Trudy and Ianos by associating infrasound detections to WWLLN lightning observations. We consider all the detection pixels shown in Figure 3a and Figure 4a, respectively. Figure 15a,b show the time series of the number of PMMC detections and the number of WWLLN detections on a 6-hourly basis during Medicane Trudy, respectively. Both time series have similar trends: an increase on the 10th of November 2019 at 06:00 UTC with a dearth of infrasound detections at noon due to wind noise (Figure 3c), followed by an increase in the number of infrasound detections, which is only later followed by an increase in lightning detections. During the mature phase of Trudy (red shaded area in Figure 15a,b), there is an increase in the number of lightning, which is initiated 3h before, and an increase in infrasound detections until three hours after the mature phase. Then, the lightning activity remains constant, and relatively intense. The fact the lightning activity remains high can be related to Medicane Trudy having reached the coast; land is known to foster the production of lightning [86] and more particularly in tropical cyclones [63]. However, the number of detections decreases, and by that time the medicane is at around 250–300 km from IS48 (Figure 2). This means that the station may typically find itself in the second shadow zone, which is delimited by the first and second stratospheric return, given that the first stratospheric return generally meets the ground at ~200 km on average. No particular increase in lightning activity (as seen by the WWLLN) occurs 24 h to 18 h before the mature phase, as has been observed for medicanes in the past [12,43]. This is known to happen in tropical cyclones [87], where convective activity bears similarities with that of medicanes [12]. Only the number of infrasound detections reaches a somewhat relative maximum 6 h before the mature phase (Figure 15a), and this is further discussed below.
The timing and location of each WWLLN lightning strike is known, and we aim at associating PMCC infrasound detections with WWLLN lightning strike detections. Following Farges et al. [42], we use an average celerity for stratospheric phases of 310 m/s (calculated as the ratio of distance as the crow flies between the flash and the station and the time of propagation), and we add a tolerance on the timing and the azimuth of the PMCC pixel when looking for a relevant infrasound detection for each WWLLN lightning stroke. Numerous PMCC detections (time-frequency pixels) can be related to a single lightning strike. We use ±1 min 30 sec for time tolerance and ±15° for azimuth tolerance. The time tolerance on the time of arrival calculation corresponds to approximately +/− 20 m/s uncertainty on the average celerity at a distance of 500 km and approximately +/− 10 m/s at 1000 km, thus remaining in the range of stratospheric phase celerities suggested by Blom et al. [88]. Note that more than one lightning strike can be attached to a PMCC detection through this method. Hence, our method provides a conservative upper limit on the percentage of infrasound detections that may be explained by lightning.
Figure 15c shows the ratios of the number of PMCC detections, which are attached to at least one lightning strike following the method explained above (Nlight), to the total number of PMCC detections (Ntotal). During Medicane Trudy, 80–90% of the detections can generally be explained by lightning. A drop in the ratio occurs on the 11th of November between 00:00 UTC and 12:00 UTC, when an increased number of infrasound detections is observed but there is hardly any increase in the number of lightning strokes. This may point towards alternative infrasound sources acting within the convective systems (convection or rotation-related dynamics), and this occurs when lightning activity appears weaker and less spatially extended during the mature phase of the cyclone (Figure 13c). Still, there is the possibility that missed CG lightning is detected with infrasound, in addition to IC lightning, which is also missed by the WWLLN [77]. We rule out the possibility of having a distinct infrasound continuous source in the same direction by double-checking the absence of such sources in the azimuth range 300–320° in the days preceding and following the medicane event (not shown).
During Medicane Ianos, the time lag between lightning activity maxima (Figure 16b) and the maximum number of infrasound detections (Figure 16a) can be explained by the diurnal cycle of local wind noise (Figure 4c), which peaks around noon (hence preventing efficient infrasound detections), when the lightning activity registered by WWLLN actually appears to maximize. The ratio of PMCC detections that can be related to at least one lightning strike often reaches 100% (Figure 16c), so that the lightning often seems to be the only infrasound source causing detections. Interestingly, the mature phase goes along with a drastic reduction of the lightning activity, while deep convection is still observed (Figure 14b) and PMCC detections are observed (Figure 14a and Figure 16a). This picture fits with the decreasing convective (hence lightning) activity in the outer part of Ianos during its mature stage and the remaining deep convection around the medicane’s core with an absence of lightning, as described by Lagouvardos et al. [4]. Hence, these infrasound detections may be due to other infrasound sources related to the dynamics of convective systems recalled in the introduction or to IC lightning missed by the ground networks such as the WWLLN. They could also be coming from the Etna volcano as well. However, when considering the 4–8 Hz band, PMCC detections are still present for the same azimuth range (60–80°). Assink et al. [89] noted the almost exclusive emission of the Etna volcano in the 0.8–2.2 Hz range during the 2006–2012 period, suggesting that these detections are indeed coming from the medicane. We also recall that Etna’s activity was relatively lower at this time. Clear drops in the ratio occur around the 15th of September 2020 00:00 UTC and around the 16th of September 2020 00:00 UTC (due to the Etna volcano activity as discussed in Section 3.1) and between the 17th of September 12:00 UTC and the 18th of September 12:00 UTC (the mature phase period discussed above). Interestingly, for Medicanes Trudy and Ianos, it is during, or 3 to 6 h before, the mature phase that a dearth of lightning detection occurs with respect to infrasound detections.
Both for Trudy and Ianos, to our knowledge, no tornadogenesis (waterspouts or landspouts) has been reported, whereas tornadoes have formed during other medicane events in the past [2,8]. Hence, this alternate source of infrasound cannot be invoked to explain the higher-frequency observations.

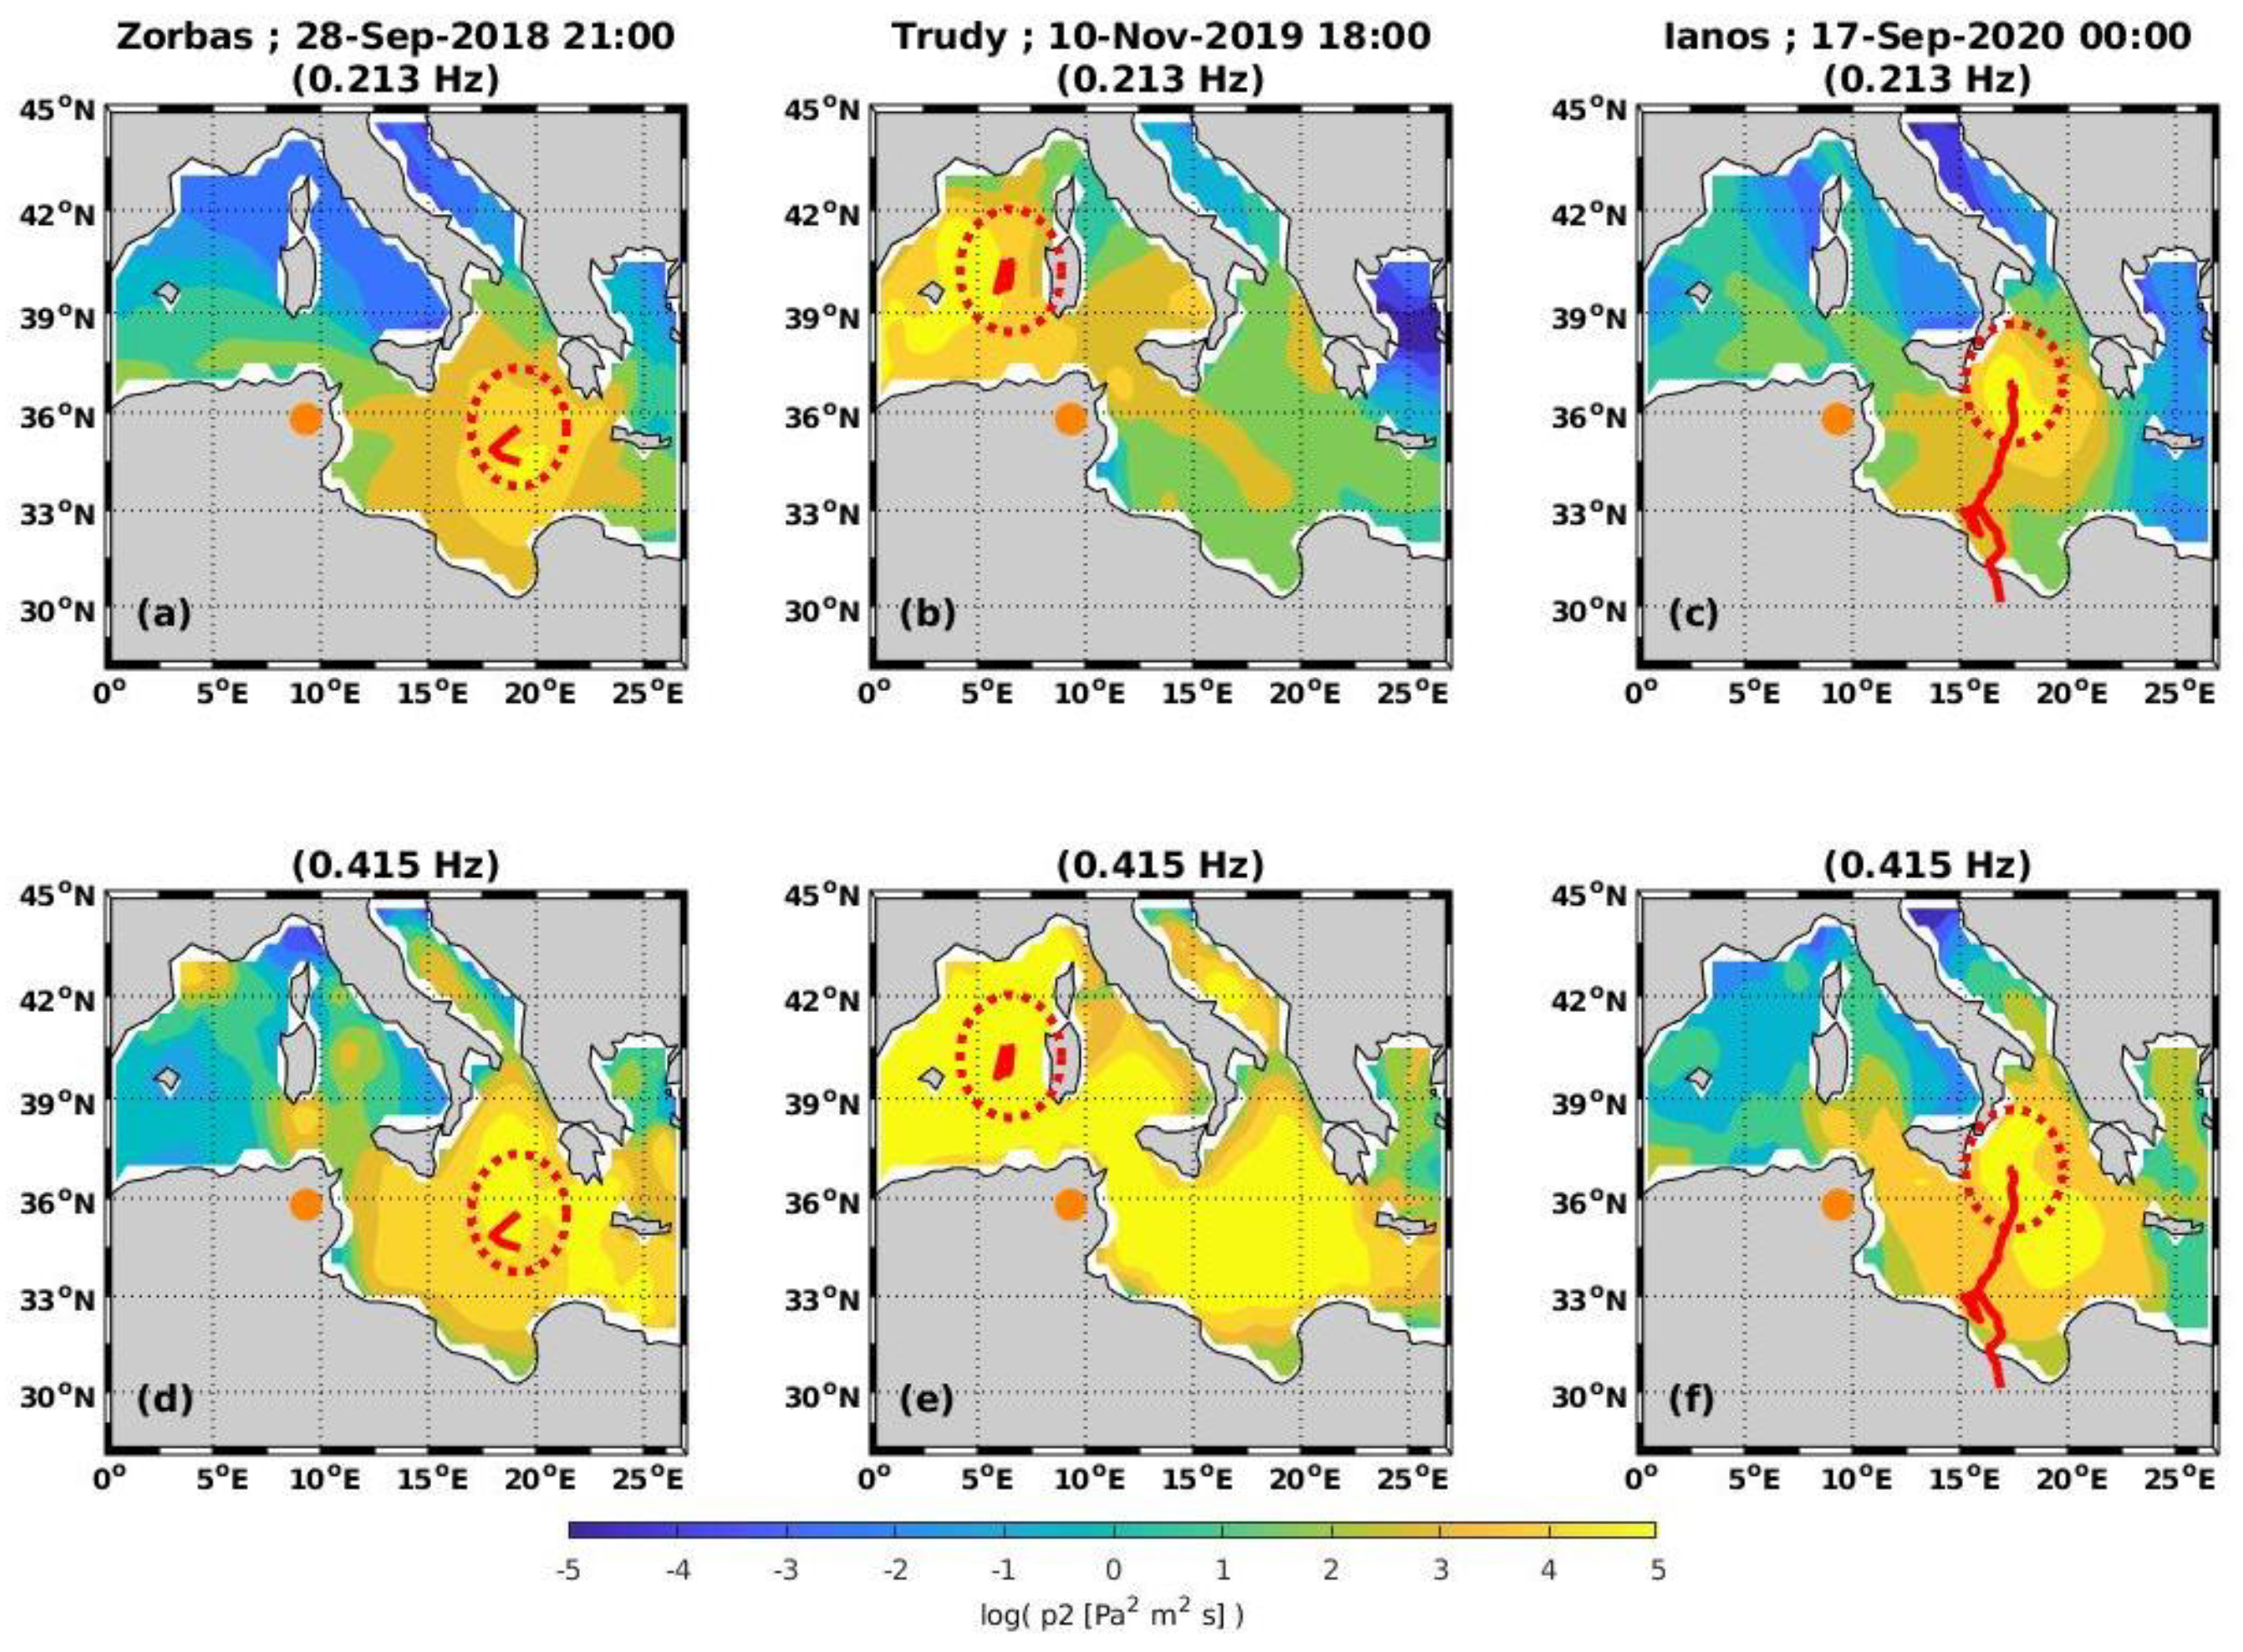
4.3. Discussion on the Detections in the Microbarom Frequency Range

Simulations of infrasound detections at IS48 in the lower frequency range were performed using the microbarom source model ARROW (Section 2.5), combined with the parameterization developed by Le Pichon et al. [90], to account for propagation effects between the source and the station. These effects include the contribution of realistic small-scale atmospheric perturbations of the horizontal wind field through the use of a gravity wave parameterization, as explained in [90]. Le Pichon et al.’s parameterization is based on thousands of parabolic equation simulations, which resulted in a multi-parametric relationship. This relationship includes a dependency on distance (geometrical spreading), frequency (variable atmospheric absorption), and efficiency of the middle atmospheric waveguide (cratio introduced in Section 4.1). It allows us to compute attenuations of the acoustic signal propagating from the Mediterranean Sea or beyond to IS48 in the 0–360° azimuth range, across thousands of kilometers. This method was already used to simulate microbarom detections across the whole IMS [67], detections at IS37 during sudden stratospheric warmings [69], and across the Central and Eastern European Infrasound Network [70].
Figure 17 shows the wave interaction products (the source) expressed in the form of the power spectral density of equivalent surface pressure, which is proportional to the Hasselmann integral [66] for two acoustic frequencies, 0.2 Hz and 0.4 Hz. The figure illustrates the fact that the wave model (Section 2.5) used to build the ARROW product does capture the impact of the medicane winds on the sea surface. Of course, this also depends on the ability of the simulated surface winds used by the wave model (ECMWF’s ERA-5 reanalysis winds) to account for the medicane dynamics. Given the spatial extension of the microbarom source and its distance from IS48 in the case of Trudy (Figure 17, middle), it seems logical for PMCC not to be able to follow the medicane eye trajectory (Figure 3a) as opposed to the other two medicanes. The latter two are responsible for more distant wave interaction maxima, allowing the infrasound antenna to better resolve the microbaroms’ hotspot displacement, particularly for Ianos (Figure 6). An additional matter of concern is the broadening of the sector where the detections originate from because the acoustic ray paths are refracted by the velocity vortex field [26,91]. This can cause the focusing or defocusing of microbaroms, which are generated by the interaction of the storm-generated wavefield with the ambient wavefield [92]. This is especially true for a moving system where dominant microbarom generation occurs in the wake of the cyclone ([93]). This detailed investigation should be addressed in a future study allowing for the use of additional stations from national networks in order to locate the microbarom sources in the vicinity of medicanes. Meanwhile, the comparisons between observations and simulations presented below show a good agreement, suggesting that the spread of back-azimuths is, at least to first order, related to the spatial extension of the source, which is accounted for in the simulation by using a realistic microbarom source model.
Following the modelling framework explained above, we derive acoustic directional spectra (acoustic power, Ap, in W, as a function of back azimuth) for each time step of the model (3-hourly) in the 0.1–0.5 Hz band. We also consider the 3-hourly maxima of Ap across the 0–360° range in the 0.1–0.2 Hz and 0.4–0.5 Hz bands, respectively, to demonstrate the different behavior of the microbarom source when considering only the lower (respectively higher) end of the spectrum. The integration of acoustic energy reaching the station is first performed over 1000 km in order to discard the North Atlantic (NA) source and focus on Mediterranean sources.
In Figure 18a–c, comparisons between PMCC detections and acoustic directional spectra (in W, color-shaded) in the 0.1–0.5 Hz band are shown for Ianos, Trudy, and Zorbas, respectively. The daily maxima of acoustic directional spectra computed only in the 0.1–0.2 Hz range and in the 0.4–0.5 Hz range, respectively, are also shown. Generally, the medicane trajectory, PMCC detections, and the modelled acoustic power distribution at the station coincide. Microbarom detection simulations are able to explain the observations; PMCC detections do occur in the azimuth ranges where the maxima of Ap occur. The main discrepancies are due to local wind noise and/or to the distance chosen to integrate the acoustic sources (as discussed further below). The diurnal cycle of wind noise at IS48 during Ianos (Figure 4c) and the wind noise maximum during Zorbas (Figure 8c) explain why PMCC detections are missing at these times when Ap maxima are simulated, respectively, in Figure 18a,c. Wind noise is not accounted for in the model used to simulate infrasound detections. Wind noise is at its highest between the 14th and the 15th of September 2020, during Ianos, and on the 28th of September 2018 between 06:00 and 18:00 UTC, during Zorbas. For instance, Zorbas’ PMCC detections are observed by the end of the period where the simulated acoustic directional spectrum is at its highest level (Figure 18c). This is because wind noise has decreased since then.
During Medicane Trudy (Figure 18b), a clear gap between the 0.4–0.5 Hz band (~320°) and the 0.1–0.2 Hz band (~290°) occurs after the 11th of November 2019 at 03:00 UTC, suggesting that distinct microbarom sources can be at play in the Mediterranean basin. Generally, subtle differences can be seen between the simulated maxima of the 0.1–0.2 Hz band and the 0.4–0.5 Hz band, respectively, but they tend to follow each other.
Integrating the acoustic energy over 5000 km instead of artificially limiting the considered distances to 1000 km generally shifts the largest amplitudes of the simulated directional spectra to back azimuths pointing to the NA ocean (Figure 19). However, this shift only occurs in the 0.1–0.2 Hz band for Ianos (Figure 19a). In the 0.4–0.5 Hz band, the daily maximum of the directional spectrum generally remains in the direction of the medicane until the 17th of September at 12:00 UTC, when the NA becomes the largest contributor. These observations demonstrate the importance of discretizing the 0.1–0.5 Hz generic microbarom band into narrower ranges, especially for dealing with multi-source issues. Here, the simulation confirms the dominant contribution of the NA to the 0.1–0.2 Hz band as discussed when introducing Figure 9.
Simulating acoustic power received at the station over 5000 km during Medicane Trudy (Figure 19b), clear differences in back-azimuths for daily maxima in the 0.1–0.2 Hz range (~320°) and in the 0.4–0.5 Hz range (~300°) arise, respectively. Consistently, both daily maxima fall into the cluster of PMCC detections. However, when distinguishing frequency bands for PMCC detections, one cannot observe a similar shift between the back azimuth of the lower and larger frequency detections (not shown). It may be a combined effect of the angular resolution of the station, the large extension of the NA source and of the medicane-related source, as well as azimuth deviations occurring along the propagation path (see discussion related to Figure 17), which makes it difficult to separate the source maxima predicted by the model around 300° and 320° of back azimuth, respectively. Given what was discussed above for Ianos and given the detections that are characterized in Figure 9, it is likely that the simulated daily maximum in the 0.1–0.2 Hz band targets the NA swell during Trudy and the 0.4–0.5 Hz band the medicane-induced swell. Interestingly, PMCC detections in the 0.4–0.5 Hz band largely dominate observations achieved in Ianos’ direction with respect to the detections in the 0.1–0.2 Hz band (Figure 9). This is consistent with the largest (northward) simulated back azimuth obtained in the 0.1–0.2 Hz band (~320°, Figure 19b).
Zorbas’ detections simulation with the 5000 km integration distance (Figure 19c) readily explains the lack of detections emphasized for this case since the largest values of the acoustic directional spectrum occur in the direction of the NA, whatever the considered frequency range is. This is mainly due to the already discussed poor infrasound guiding during this time. This comes in addition to the high wind noise observed before the 28th of September 2019 18:00 UTC. The PMCC detections around the 29th of September (explainable by the 1000 km simulation, Figure 18c) are not simulated. The reason may be that the simplified assumption of constant winds across the 5000 km-radius domain does not allow to simulate this temporary cluster of detections when considering a much larger area of microbarom sources. Meanwhile, PMCC detections do occur in the direction of the NA during Medicane Zorbas when Ap is maximum (around 300° in back-azimuth, Figure 19c). Consistently, PMCC Zorbas’ detections are much more numerous in the 0.4–0.5 Hz band, compared to the 0.1–0.2 Hz band (Figure 9). The latter band would rather depend on the NA contributions, according to the above discussion.
We note that PMCC detections are made in the NA direction in alternance with the detections in the medicane’s direction during Ianos (Figure 19a) and Zorbas (Figure 19c), but not continuously. Wind noise at the station limits continuous detection of microbaroms at IS48.

5. Conclusions

In this paper we have demonstrated and explained the infrasound detections coming from medicanes documented in the recent literature. The Tunisian station IS48 of the IMS was used for this purpose. For the first time, such meteorological hazards were investigated through atmospheric acoustic waves propagating over long distances. Among the six targeted medicanes, two gave rise to detections which were related to lightning in the 2–8 Hz band (namely Ianos, and Trudy), and three to the swell induced by the cyclones in the microbarom frequency range 0.1–0.5 Hz (Ianos, Trudy, and Zorbas). Three other medicanes (Qendresa, Trixie, Apollo) showed no significant infrasound detections essentially because of the lack of middle atmospheric guiding. Wind noise at the station was also documented to explain the presence or lack of detections. Interestingly, wind gusts provided by ERA5 seemed able to provide some proxy of local wind noise conditions despite the relative coarse 30-km horizontal resolution used for the IFS model to produce the reanalysis. Medicanes’ infrasound was detected at distances of 250–600 km for Trudy and 600–1200 km for Ianos in both frequency ranges, and at distances of 850–1100 km for Zorbas (in the microbarom frequency range). PMCC back-azimuths were shown to correspond well to documented trajectories of the medicanes and the amplitudes of the detections are consistent with the evolution of the cyclones’ location through time, decreasing or increasing accordingly.
Additional datasets describing the presence of deep convection and lightning were used to discuss the sources at play. In favorable conditions (little wind noise, no perturbing source like the Etna) between 80% and 100% of the detections (upper estimates) can be explained by lightning. There is room for additional sources related to deep convection processes to explain infrasound detections. However and importantly, as WWLLN efficiency is reduced for weak cloud-to-ground lightning, it could be that infrasound technology serves the purposes of documenting lightning activity in medicanes, and more particularly IC lightning. This remains to be further documented through more detailed case-studies using infrasound propagation simulations. It is interesting to highlight that a dearth of lightning occurred along with maintained infrasound detections, before and during the mature phase of Trudy and Ianos, respectively. Thus, acoustics may help to better characterize the dynamical and electrical activities of such hazards throughout their lifetime.
Multi-source situations were highlighted both in the higher frequency range and in the lower frequency range. In the former case, competing convective systems at similar distances from the station act as equivalent acoustic sources in a case where wind noise was increased. PMCC processing showed noisy detections in that case while the deep convection database and the lightning database clearly separated these sources. Improved detection and estimation algorithms would facilitate future attempts to track such hazards in real time in a more resilient way with respect to degraded conditions [94] as well as with respect to multi-source considerations [95]. Similarly, different microbaroms sources were highlighted (North Atlantic swell in the 0.1–0.2 Hz, and medicane-related Mediterranean wave activity mainly above 0.2 Hz). This highlights the need to consider different microbarom frequency bands when investigating this global source, especially for tracking maritime storms as medicanes.
Future investigations would benefit from the inclusion of additional infrasound stations from national networks in the Mediterranean basin as the average inter-station distance of the IMS network is ~2000 km and IS48 appears as the only IMS station allowing such a study. One could then easily discard volcanic sources like the Etna. One could also probably increase the database of medicanes that can be investigated with infrasound technology since propagation conditions of the middle atmosphere would be less limiting as in the present study. Additional stations would also allow for the consideration of localizing and tracking the mesocyclones, while better constraining the exact origin of the sources responsible for generating infrasound (lightning, deep convection, or other dynamics-related mechanisms), and also pointing at possible effects of microbaroms’ (or higher frequency infrasound’s) refraction caused by the vortex wind structure with the additional help of propagation simulations.

Author Contributions

Conceptualization, C.L. and C.C.; methodology, C.L., E.F., S.D., T.F., A.L.P. and C.C.; software, J.V., E.F., S.D., M.D.C. and F.G.; formal analysis, C.L. and E.F.; investigation, C.L. and E.F.; data curation, J.V., C.L., S.D., T.F., M.D.C. and F.G.; writing—original draft preparation, C.L., S.D., T.F., A.L.P. and M.D.C.; writing—review and editing, C.L., E.F., S.D., T.F., M.D.C., A.L.P., J.V. and P.H.; visualization, C.L. and E.F. All authors have read and agreed to the published version of the manuscript.

Funding

This research received no external funding.

Data Availability Statement

ERA5 data were obtained through the Meteorological Archival and Retrieval System (MARS) of the ECMWF thanks to the Copernicus Climate Change Service (C3S) API provided on the cds website. We wish to thank the World Wide Lightning Location Network (http://wwlln.net (accessed on 23 August 2022)), a collaboration among over 50 universities and institutions, for providing the lightning location data used in this paper. Meteosat data were retrieved from the Earth Observational Portal of EUMETSAT and the DC pixels data are available from the authors upon request. Satellite observations of convection were also obtained using the tool EUMeTrain (http://resources.eumetrain.org/ePort_MapViewer/index.html, accessed on 28 November 2022) where 10.8 μm BTs are provided and where values of coordinates can be manually picked up. The authors are grateful to the CTBT Organization and IMS station operators for guaranteeing the high-quality infrasound data. IMS data are available from the CTBTO for scientific purposes through the virtual Data Exploitation Centre (vDEC): https://www.ctbto.org/specials/vdec/ (accessed on 28 November 2022). The hindcast (1993–2021) wave interaction product of the ARROW dataset provided by IFREMER can be found here: ftp://ftp.ifremer.fr/ifremer/dataref/ww3/GLOBMULTI_ERA5_GLOBCUR_01/GLOB-30M/YYYY/FIELD_NC/*_p2L.nc (accessed on 28 November 2022). The acoustic factor used to convert the wave interaction product to an acoustic source field (in W m−2) can be made available by the authors upon request.

Acknowledgments

This work is dedicated to our missed colleague Chantal Claud whose extended previous works on low pressure systems in various regions of the world inspired this investigation. The authors thank the joint (CEA/ENS/CNRS) laboratory (Laboratoire de recherche conventionnée—LRC) Yves Rocard for its support. CL thanks R. Trivière and L. Bourdon for the additional impetus given to this project thanks to their seriousness during their student project. The authors thank Emanuele Marchetti for detailed insights into Etna’s activity in September 2020. This work was supported by computational time granted from the National Infrastructures for Research and Technology S.A. (GRNET S.A.) in the Greek National HPC facility—ARIS under project adapt2CC. The authors thank the anonymous reviewers for their careful reading of the manuscript and their constructive comments.

Conflicts of Interest

The authors declare no conflict of interest.

References

  1. Cavicchia, L.; von Storch, H.; Gualdi, S. A long-term climatology of medicanes. Clim. Dyn. 2013, 43, 1183–1195. [Google Scholar] [CrossRef]
  2. Nastos, P.; Papadimou, K.K.; Matsangouras, I. Mediterranean tropical-like cyclones: Impacts and composite daily means and anomalies of synoptic patterns. Atmospheric Res. 2018, 208, 156–166. [Google Scholar] [CrossRef]
  3. Zekkos, D.; Zalachoris, G.; Alvertos, A.E.; Amatya, P.M.; Blunts, P.; Clark, M.; Dafis, S.; Farmakis, I.; Ganas, A.; Hille, M.; et al. The September 18-20 2020 Medicane Iaonos Impact on Greece—Phase I Reconnaissance Report. Geotech. Extrem. Events Re-connaiss. Rep. 2020, GEER-068. [Google Scholar] [CrossRef]
  4. Lagouvardos, K.; Karagiannidis, A.; Dafis, S.; Kalimeris, A.; Kotroni, V. Ianos—A hurricane in the Mediterranean. Bull. Am. Meteorol. Soc. 2021, 1, E1621–E1636. [Google Scholar] [CrossRef]
  5. Scicchitano, G.; Scardino, G.; Monaco, C.; Piscitelli, A.; Milella, M.; De Giosa, F.; Mastronuzzi, G. Comparing impact effects of common storms and Medicanes along the coast of south-eastern Sicily. Mar. Geol. 2021, 439, 106556. [Google Scholar] [CrossRef]
  6. Patlakas, P.; Stathopoulos, C.; Tsalis, C.; Kallos, G. Wind and wave extremes associated with tropical-like cyclones in the Mediterranean basin. Int. J. Clim. 2020, 41, E1623–E1644. [Google Scholar] [CrossRef]
  7. Chaboureau, J.-P.; Pantillon, F.; Lambert, D.; Richard, E.; Claud, C. Tropical transition of a Mediterranean storm by jet crossing. Q. J. R. Meteorol. Soc. 2011, 138, 596–611. [Google Scholar] [CrossRef]
  8. Dafis, S.; Claud, C.; Kotroni, V.; Lagouvardos, K.; Rysman, J. Insights into the convective evolution of Mediterranean tropical-like cyclones. Q. J. R. Meteorol. Soc. 2020, 146, 4147–4169. [Google Scholar] [CrossRef]
  9. Romero, R.; Emanuel, K. Medicane risk in a changing climate. J. Geophys. Res. Atmos. 2013, 118, 5992–6001. [Google Scholar] [CrossRef]
  10. Koseki, S.; Mooney, P.A.; Cabos, W.; Gaertner, M.; de la Vara, A.; González-Alemán, J.J. Modelling a tropical-like cyclone in the Mediterranean Sea under present and warmer climate. Nat. Hazards Earth Syst. Sci. 2021, 21, 53–71. [Google Scholar] [CrossRef]
  11. González-Alemán, J.J.; Pascale, S.; Gutierrez-Fernandez, J.; Murakami, H.; Gaertner, M.A.; Vecchi, G.A. Potential Increase in Hazard From Mediterranean Hurricane Activity With Global Warming. Geophys. Res. Lett. 2019, 46, 1754–1764. [Google Scholar] [CrossRef]
  12. Dafis, S.; Rysman, J.; Claud, C.; Flaounas, E. Remote sensing of deep convection within a tropical-like cyclone over the Mediterranean Sea. Atmospheric Sci. Lett. 2018, 19, e823. [Google Scholar] [CrossRef]
  13. Fita, L.; Romero, R.; Luque, A.; Emanuel, K.; Ramis, C. Analysis of the environments of seven Mediterranean tropical-like storms using an axisymmetric, nonhydrostatic, cloud resolving model. Nat. Hazards Earth Syst. Sci. 2007, 7, 41–56. [Google Scholar] [CrossRef]
  14. Cioni, G.; Malguzzi, P.; Buzzi, A. Thermal structure and dynamical precursor of a Mediterranean tropical-like cyclone. Q. J. R. Meteorol. Soc. 2016, 142, 1757–1766. [Google Scholar] [CrossRef]
  15. Prat, A.C.; Federico, S.; Torcasio, R.C.; D’Adderio, L.P.; Dietrich, S.; Panegrossi, G. Evaluation of the Sensitivity of Medicane Ianos to Model Microphysics and Initial Conditions Using Satellite Measurements. Remote Sens. 2021, 13, 4984. [Google Scholar] [CrossRef]
  16. Miglietta, M.M.; Cerrai, D.; Laviola, S.; Cattani, E.; Levizzani, V. Potential vorticity patterns in Mediterranean “hurricanes”. Geophys. Res. Lett. 2017, 44, 2537–2545. [Google Scholar] [CrossRef]
  17. Fita, L.; Flaounas, E. Medicanes as subtropical cyclones: The December 2005 case from the perspective of surface pressure tendency diagnostics and atmospheric water budget. Q. J. R. Meteorol. Soc. 2018, 144, 1028–1044. [Google Scholar] [CrossRef]
  18. Flaounas, E.; Davolio, S.; Raveh-Rubin, S.; Pantillon, F.; Miglietta, M.M.; Gaertner, M.A.; Hatzaki, M.; Homar, V.; Khodayar, S.; Korres, G.; et al. Mediterranean cyclones: Current knowledge and open questions on dynamics, prediction, climatology and impacts. Weather Clim. Dynam. 2022, 3, 173–208. [Google Scholar] [CrossRef]
  19. Miglietta, M.M.; Rotunno, R. Development mechanisms for Mediterranean tropical-like cyclones (medicanes). Q. J. R. Meteorol. Soc. 2019, 145, 1444–1460. [Google Scholar] [CrossRef] [Green Version]
  20. Noyelle, R.; Ulbrich, U.; Becker, N.; Meredith, E.P. Assessing the impact of sea surface temperatures on a simulated medicane using ensemble simulations. Nat. Hazards Earth Syst. Sci. 2019, 19, 941–955. [Google Scholar] [CrossRef]
  21. Sutherland, L.C.; Bass, H.E. Atmospheric absorption in the atmosphere up to 160 km. J. Acoust. Soc. Am. 2004, 115, 1012–1032. [Google Scholar] [CrossRef]
  22. Brachet, N.; Brown, D.D.; Le Bras, R.; Cansi, Y.; Mialle, P.; Coyne, J. Monitoring the Earth’s Atmosphere with the Global IMS Infrasound Network. In Infrasound Monitoring for Atmospheric Studies; Le Pichon, A., Blanc, E., Hauchecorne, A., Eds.; Springer: Berlin/Heidelberg, Germany, 2009; pp. 77–118. [Google Scholar] [CrossRef]
  23. Marty, J. The IMS Infrasound Network: Current Status and Technological Developments. In Infrasound Monitoring for Atmospheric Studies; Springe: Cham, Switzerland, 2018; pp. 3–62. [Google Scholar] [CrossRef]
  24. Christie, D.R.; Campus, P. The IMS Infrasound Network: Design and Establishment of Infrasound Stations. In Infrasound Monitoring for Atmospheric Studies; Le Pichon, A., Blanc, E., Hauchecorne, A., Eds.; Springer: Berlin/Heidelberg, Germany, 2009; pp. 29–75. [Google Scholar] [CrossRef]
  25. Cansi, Y. An automatic seismic event processing for detection and location: The P.M.C.C. Method. Geophys. Res. Lett. 1995, 22, 1021–1024. [Google Scholar] [CrossRef]
  26. Blom, P.; Waxler, R. Modeling the refraction of microbaroms by the winds of a large maritime storm. J. Acoust. Soc. Am. 2017, 142, 3520–3529. [Google Scholar] [CrossRef] [PubMed]
  27. Sindelarova, T.; Chum, J.; Skripnikova, K.; Base, J. Atmospheric infrasound observed during intense convective storms on 9–10 July 2011. J. Atmospheric Solar-Terrestrial Phys. 2015, 122, 66–74. [Google Scholar] [CrossRef]
  28. Chunchuzov, I.; Kulichkov, S.; Popov, O.; Perepelkin, V. Infrasound generation by meteorological fronts and its propagation in the atmosphere. J. Atmospheric Sci. 2021, 78, 1673–1686. [Google Scholar] [CrossRef]
  29. Kouassi, K.B.; Yoroba, F.; Madu, U.O.; Diawara, A.; Kouadio, K.; Yao, P.A. Understanding the Split Characteristics of the Tropical Mesoscale Convective System (MCS) of April 9, 2018, in Northern Ghana Using Infrasound Data. Atmospheric Clim. Sci. 2021, 11, 1. [Google Scholar] [CrossRef]
  30. Georges, T.M. Infrasound from convective storms. Part II: A critique of source candidates. NOAA Tech. Rep. 1976, 49, 59. [Google Scholar]
  31. Bedard, A.J. Low-Frequency Atmospheric Acoustic Energy Associated with Vortices Produced by Thunderstorms. Mon. Weather. Rev. 2005, 133, 241–263. [Google Scholar] [CrossRef]
  32. Elbing, B.R.; Petrin, C.E.; Broeke, M.S.V.D. Measurement and characterization of infrasound from a tornado producing storm. J. Acoust. Soc. Am. 2019, 146, 1528–1540. [Google Scholar] [CrossRef] [Green Version]
  33. Petrin, C.E.; Elbing, B.R. Infrasound emissions from tornadoes and severe storms compared to potential tornadic generation mechanisms. Proc. Meet. Acoust. Acoust. Soc. Am. 2019, 36, 045005. [Google Scholar] [CrossRef] [Green Version]
  34. Fernández-González, S.; Wang, P.; Gascón, E.; Valero, F.; Sánchez, J. Latent cooling and microphysics effects in deep convection. Atmospheric Res. 2016, 180, 189–199. [Google Scholar] [CrossRef]
  35. Passner, J.E.; Noble, J.M. Acoustic energy measured in severe storms during a field study in June 2003. Army Res. Lab. Tech. Rep. 2006, ARL-TR-3749, 34. [Google Scholar]
  36. Akhalkatsi, M.; Gogoberidze, G. Spectrum of infrasound radiation from supercell storms. Q. J. R. Meteorol. Soc. 2011, 137, 229–235. [Google Scholar] [CrossRef] [Green Version]
  37. Schecter, D.A. A Method for Diagnosing the Sources of Infrasound in Convective Storm Simulations. J. Appl. Meteorol. Clim. 2011, 50, 2526–2542. [Google Scholar] [CrossRef] [Green Version]
  38. Schecter, D.A. In search of discernible infrasound emitted by numerically simulated tornadoes. Dyn. Atmos. Oceans 2012, 57, 27–44. [Google Scholar] [CrossRef]
  39. Farges, T.; Blanc, E. Characteristics of infrasound from lightning and sprites near thunderstorm areas. J. Geophys. Res. Earth Surf. 2010, 115. [Google Scholar] [CrossRef] [Green Version]
  40. Gallin, L.; Farges, T.; Marchiano, R.; Coulouvrat, F.; Defer, E.; Rison, W.; Schulz, W.; Nuret, M. Statistical analysis of storm electrical discharges reconstituted from a lightning mapping system, a lightning location system, and an acoustic array. J. Geophys. Res. Atmos. 2016, 121, 3929–3953. [Google Scholar] [CrossRef] [Green Version]
  41. Lacroix, A.; Coulouvrat, F.; Marchiano, R.; Farges, T.; Ripoll, J. Acoustical Energy of Return Strokes: A Comparison Between a Statistical Model and Measurements. Geophys. Res. Lett. 2019, 46, 11479–11489. [Google Scholar] [CrossRef]
  42. Farges, T.; Hupe, P.; Le Pichon, A.; Ceranna, L.; Listowski, C.; Diawara, A. Infrasound Thunder Detections across 15 Years over Ivory Coast: Localization, Propagation, and Link with the Stratospheric Semi-Annual Oscillation. Atmosphere 2021, 12, 1188. [Google Scholar] [CrossRef]
  43. Marra, A.C.; Federico, S.; Montopoli, M.; Avolio, E.; Baldini, L.; Casella, D.; D’Adderio, L.P.; Dietrich, S.; Sanò, P.; Torcasio, R.C.; et al. The Precipitation Structure of the Mediterranean Tropical-Like Cyclone Numa: Analysis of GPM Observations and Numerical Weather Prediction Model Simulations. Remote Sens. 2019, 11, 1690. [Google Scholar] [CrossRef] [Green Version]
  44. Miglietta, M.M.; Laviola, S.; Malvaldi, A.; Conte, D.; Levizzani, V.; Price, C. Analysis of tropical-like cyclones over the Mediterranean Sea through a combined modeling and satellite approach. Geophys. Res. Lett. 2013, 40, 2400–2405. [Google Scholar] [CrossRef]
  45. Orbaek, J.B.; Naustvik, M. Infrasonic signatures of a Polar Low in the Norwegian and Barents Sea on 23-27 March 1992. Tellus A Dyn. Meteorol. Oceanogr. 1995, 47, 921–940. [Google Scholar] [CrossRef]
  46. Claud, C.; Dalaudier, F.; Kero, J.; Le Pichon, A.; Hauchecorne, A.; Rojo, M.; Blanc, E.; Liszka, L. Exploring the signature of polar lows in infrasound: The 19–20 November 2008 cases. Tellus A: Dyn. Meteorol. Oceanogr. 2017, 69, 1338885. [Google Scholar] [CrossRef] [Green Version]
  47. Davy, C.; Barruol, G.; Fontaine, F.R.; Sigloch, K.; Stutzmann, E. Tracking major storms from microseismic and hydroacoustic observations on the seafloor. Geophys. Res. Lett. 2014, 41, 8825–8831. [Google Scholar] [CrossRef] [Green Version]
  48. Vallianatos, F.; Koutalonis, I.; Chatzopoulos, G. Evidence of Tsallis entropy signature on medicane induced ambient seismic signals. Phys. A Stat. Mech. its Appl. 2019, 520, 35–43. [Google Scholar] [CrossRef]
  49. Mejri, C. Study of the performance of the infrasound Station IS48TN during the period 2011-2017. In Proceedings of the EGU General Assembly Conference Abstracts, Vienna, Austria, 23–28 April 2017; p. 9060. [Google Scholar]
  50. Vanderbecken, P.J.; Mahfouf, J.-F. Bayesian selection of atmospheric profiles from an ensemble data assimilation system using infrasonic observations of May 2016 Mount Etna eruptions. J. Geophys. Res. Atmos. 2020, 125, e2019JD031168. [Google Scholar] [CrossRef]
  51. Marchetti, E.; Ripepe, M.; Campus, P.; Le Pichon, A.; Vergoz, J.; Lacanna, G.; Mialle, P.; Héreil, P.; Husson, P. Long range infrasound monitoring of Etna volcano. Sci. Rep. 2019, 9, 18015. [Google Scholar] [CrossRef] [Green Version]
  52. Le Pichon, A.; Pilger, C.; Ceranna, L.; Marchetti, E.; Lacanna, G.; Souty, V.; Vergoz, J.; Listowski, C.; Hernandez, B.; Mazet-Roux, G.; et al. Using dense seismo-acoustic network to provide timely warning of the 2019 paroxysmal Stromboli eruptions. Sci. Rep. 2021, 11, 14464. [Google Scholar] [CrossRef]
  53. Pilger, C.; Gaebler, P.; Hupe, P.; Kalia, A.C.; Schneider, F.M.; Steinberg, A.; Sudhaus, H.; Ceranna, L. Yield estimation of the 2020 Beirut explosion using open access waveform and remote sensing data. Sci. Rep. 2021, 11, 14144. [Google Scholar] [CrossRef]
  54. Hersbach, H.; Bell, B.; Berrisford, P.; Hirahara, S.; Horanyi, A.; Muñoz-Sabater, J.; Nicolas, J.; Peubey, C.; Radu, R.; Schepers, D.; et al. The ERA5 global reanalysis. Q. J. R. Meteorol. Soc. 2020, 146, 1999–2049. [Google Scholar] [CrossRef]
  55. Sobrino, J.; Romaguera, M. Land surface temperature retrieval from MSG1-SEVIRI data. Remote Sens. Environ. 2004, 92, 247–254. [Google Scholar] [CrossRef]
  56. Olander, T.L.; Velden, C.S. Tropical Cyclone Convection and Intensity Analysis Using Differenced Infrared and Water Vapor Imagery. Weather Forecast. 2009, 24, 1558–1572. [Google Scholar] [CrossRef] [Green Version]
  57. Schmetz, J.; Tjemkes, S.; Gube, M.; van de Berg, L. Monitoring deep convection and convective overshooting with METEOSAT. Adv. Space Res. 1997, 19, 433–441. [Google Scholar] [CrossRef]
  58. Setvák, M.; Rabin, R.M.; Wang, P.K. Contribution of the MODIS instrument to observations of deep convective storms and stratospheric moisture detection in GOES and MSG imagery. Atmos. Res. 2007, 83, 505–518. [Google Scholar] [CrossRef]
  59. Bedka, K.; Brunner, J.; Dworak, R.; Feltz, W.; Otkin, J.; Greenwald, T. Objective Satellite-Based Detection of Overshooting Tops Using Infrared Window Channel Brightness Temperature Gradients. J. Appl. Meteorol. Clim. 2010, 49, 181–202. [Google Scholar] [CrossRef]
  60. Dowden, R.L.; Brundell, J.B.; Rodger, C.J. VLF lightning location by time of group arrival (TOGA) at multiple sites. J. Atmospheric Solar-Terrestrial Phys. 2002, 64, 817–830. [Google Scholar] [CrossRef]
  61. Stevenson, S.N.; Corbosiero, K.L.; Abarca, S.F. Lightning in Eastern North Pacific Tropical Cyclones: A Comparison to the North Atlantic. Mon. Weather Rev. 2015, 144, 225–239. [Google Scholar] [CrossRef]
  62. Stevenson, S.N.; Corbosiero, K.L.; DeMaria, M.; Vigh, J. A 10-Year Survey of Tropical Cyclone Inner-Core Lightning Bursts and Their Relationship to Intensity Change. Weather Forecast. 2017, 33, 23–36. [Google Scholar] [CrossRef]
  63. Lin, S.-J.; Chou, K.-H. The Lightning Distribution of Tropical Cyclones over the Western North Pacific. Mon. Weather Rev. 2020, 148, 4415–4434. [Google Scholar] [CrossRef]
  64. Rudlosky, S.D.; Shea, D.T. Evaluating WWLLN performance relative to TRMM/LIS. Geophys. Res. Lett. 2013, 40, 2344–2348. [Google Scholar] [CrossRef]
  65. Bürgesser, R.E. Assessment of the World Wide Lightning Location Network (WWLLN) detection efficiency by comparison to the Lightning Imaging Sensor (LIS). Q. J. R. Meteorol. Soc. 2017, 143, 2809–2817. [Google Scholar] [CrossRef]
  66. De Carlo, M.; Ardhuin, F.; Le Pichon, A. Atmospheric infrasound generation by ocean waves in finite depth: Unified theory and application to radiation patterns. Geophys. J. Int. 2020, 221, 569–585. [Google Scholar] [CrossRef]
  67. De Carlo, M.; Hupe, P.; Le Pichon, A.; Ceranna, L.; Ardhuin, F. Global Microbarom Patterns: A First Confirmation of the Theory for Source and Propagation. Geophys. Res. Lett. 2021, 48, e2020GL090163. [Google Scholar] [CrossRef]
  68. Waxler, R.; Gilbert, K.; Talmadge, C.; Hetzer, C. The effect of the finite depth of the ocean on microbarom signals. In Proceedings of the 8th International Conference on Theoretical and Computational Acoustics (ICTCA), Crete, Greece, 2–6 July 2007. [Google Scholar]
  69. Vorobeva, E.; De Carlo, M.; Le Pichon, A.; Espy, P.J.; Näsholm, S.P. Benchmarking microbarom radiation and propagation model against infrasound recordings: A vespagram-based approach. Ann. Geophys. 2021, 39, 515–531. [Google Scholar] [CrossRef]
  70. Šindelářová, T.; De Carlo, M.; Czanik, C.; Ghica, D.; Kozubek, M.; Podolská, K.; Baše, J.; Chum, J.; Mitterbauer, U. Infrasound signature of the post-tropical storm Ophelia at the Central and Eastern European Infrasound Network. J. Atmospheric Solar-Terrestrial Phys. 2021, 217, 105603. [Google Scholar] [CrossRef]
  71. De Carlo, M.; Accensi, M.; Ardhuin, F.; Le Pichon, A. ARROW (AtmospheRic InfRasound by Ocean Waves): A new real-time product for global ambient noise monitoring. In Proceedings of the EGU General Assembly 2022, Vienna, Austria, 23–27 May 2022. [Google Scholar] [CrossRef]
  72. Mickael, A. GLOBMULTI_ERA5_GLOBCUR_01. Available online: https://doi.org/10.12770/857a3337-f59a-481a-bf98-5561e8b61e7b (accessed on 28 November 2022).
  73. Alday, M.; Accensi, M.; Ardhuin, F.; Dodet, G. A global wave parameter database for geophysical applications. Part 3: Improved forcing and spectral resolution. Ocean Model. 2021, 166, 101848. [Google Scholar] [CrossRef]
  74. Loli, M.; Kefalas, G.; Dafis, S.; Mitoulis, S.A.; Schmidt, F. Bridge-specific flood risk assessment of transport networks using GIS and remotely sensed data. Sci. Total Environ. 2022, 850, 157976. [Google Scholar] [CrossRef]
  75. Global Volcanism Program. 2020. Report on Etna (Italy). Available online: https://volcano.si.edu/showreport.cfm?wvar=GVP.WVAR20200916-211060 (accessed on 28 November 2022).
  76. Ceranna, L.; Le Pichon, A.; Green, D.N.; Mialle, P. The Buncefield explosion: A benchmark for infrasound analysis across Central Europe. Geophys. J. Int. 2009, 177, 491–508. [Google Scholar] [CrossRef]
  77. Drob, D.P.; Garcés, M.; Hedlin, M.; Brachet, N. The Temporal Morphology of Infrasound Propagation. Pure Appl. Geophys. 2010, 167, 437–453. [Google Scholar] [CrossRef]
  78. Lacroix, A.; Farges, T.; Marchiano, R.; Coulouvrat, F. Acoustical Measurement of Natural Lightning Flashes: Reconstructions and Statistical Analysis of Energy Spectra. J. Geophys. Res. Atmos. 2018, 123, 12040–12065. [Google Scholar] [CrossRef]
  79. Pasko, V.P. Mechanism of lightning-associated infrasonic pulses from thunderclouds. J. Geophys. Res. Earth Surf. 2009, 114, D08205. [Google Scholar] [CrossRef] [Green Version]
  80. Le Pichon, A.; Assink, J.D.; Heinrich, P.; Blanc, E.; Charlton-Perez, A.; Lee, C.F.; Keckhut, P.; Hauchecorne, A.; Rüfenacht, R.; Kämpfer, N.; et al. Comparison of co-located independent ground-based middle atmospheric wind and temperature measurements with numerical weather prediction models. J. Geophys. Res. Atmos. 2015, 120, 8318–8331. [Google Scholar] [CrossRef] [Green Version]
  81. Vallage, A.; Bollinger, L.; Champenois, J.; Duverger, C.; Trilla, A.G.; Hernandez, B.; Le Pichon, A.; Listowski, C.; Mazet-Roux, G.; Menager, M.; et al. Multitechnology characterization of an unusual surface rupturing intraplate earthquake: The ML 5.4 2019 Le Teil event in France. Geophys. J. Int. 2021, 226, 803–813. [Google Scholar] [CrossRef]
  82. Heymsfield, A.J.; Bansemer, A.; Heymsfield, G.; Fierro, A.O. Microphysics of Maritime Tropical Convective Updrafts at Temperatures from −20° to −60°. J. Atmos. Sci. 2009, 66, 3530–3562. Available online: https://journals.ametsoc.org/view/journals/atsc/66/12/2009jas3107.1 (accessed on 1 September 2022). [CrossRef] [Green Version]
  83. Ribaud, J.-F.; Bousquet, O.; Coquillat, S. Relationships between total lightning activity, microphysics andkinematics during the 24 September 2012 HyMeX bow-echo system. Q. J. R. Meteorol. Soc. 2016, 142 (Suppl. 1), 298–309. [Google Scholar] [CrossRef] [Green Version]
  84. Ulivieri, G.; Ripepe, M.; Marchetti, E. Infrasound reveals transition to oscillatory discharge regime during lava fountaining: Implication for early warning. Geophys. Res. Lett. 2013, 40, 3008–3013. [Google Scholar] [CrossRef]
  85. Ripepe, M.; Marchetti, E.; Delle Donne, D.; Genco, R.; Innocenti, L.; Lacanna, G.; Valade, S. Infrasonic Early Warning System for Explosive Eruptions. J. Geophys. Res. Solid Earth 2018, 123, 9570–9585. [Google Scholar] [CrossRef]
  86. Christian, H.J.; Blakeslee, R.; Boccippio, D.J.; Boeck, W.L.; Buechler, D.E.; Driscoll, K.T.; Goodman, S.J.; Hall, J.M.; Koshak, W.J.; Mach, D.M.; et al. Global frequency and distribution of lightning as observed from space by the Optical Transient Detector. J. Geophys. Res. Atmos. 2003, 108, ACL 4-1–ACL 4-15. [Google Scholar] [CrossRef]
  87. DeMaria, M.; DeMaria, R.T.; Knaff, J.; Molenar, D. Tropical Cyclone Lightning and Rapid Intensity Change. Mon. Weather Rev. 2012, 140, 1828–1842. [Google Scholar] [CrossRef]
  88. Blom, P.S.; Marcillo, O.; Arrowsmith, S.J. Improved Bayesian Infrasonic Source Localization for regional infrasound. Geophys. J. Int. 2015, 203, 1682–1693. [Google Scholar] [CrossRef] [Green Version]
  89. Assink, J.D.; Le Pichon, A.; Blanc, E.; Kallel, M.; Khemiri, L. Evaluation of wind and temperature profiles from ECMWF analysis on two hemispheres using volcanic infrasound. J. Geophys. Res. Atmos. 2014, 119, 8659–8683. [Google Scholar] [CrossRef]
  90. Le Pichon, A.; Ceranna, L.; Vergoz, J. Incorporating numerical modeling into estimates of the detection capability of the IMS infrasound network. J. Geophys. Res. Earth Surf. 2012, 117. [Google Scholar] [CrossRef]
  91. Bedard, A.J.; Jones, R.M. Infrasonic ray tracing applied to mesoscale atmospheric structures: Refraction by hurricanes. J. Acoust. Soc. Am. 2013, 134, 3446–3451. [Google Scholar] [CrossRef] [PubMed]
  92. Hetzer, C.H.; Waxler, R.; Gilbert, K.E.; Talmadge, C.L.; Bass, H.E. Infrasound from hurricanes: Dependence on the ambient ocean surface wave field. Geophys. Res. Lett. 2008, 35. [Google Scholar] [CrossRef]
  93. Stopa, J.E.; Cheung, K.F.; Garcés, M.A.; Badger, N. Atmospheric infrasound from nonlinear wave interactions during Hurricanes Felicia and Neki of 2009. J. Geophys. Res. Earth Surf. 2012, 117, 12017. [Google Scholar] [CrossRef]
  94. 94. Poste, B.; Charbit, M.; le Pichon, A.; Listowski, C.; Roueff, F.; Vergoz, J. The multichannel maximum-likelihood (MCML) method: A new approach for infrasound detection and wave parameter estimation. Geophys. J. Int. 2023, 232, 1099–1112. [Google Scholar] [CrossRef]
  95. Ouden, O.F.C.D.; Assink, J.; Smets, P.S.M.; Shani-Kadmiel, S.; Averbuch, G.; Evers, L.G. CLEAN beamforming for the enhanced detection of multiple infrasonic sources. Geophys. J. Int. 2020, 221, 305–317. [Google Scholar] [CrossRef]
Figure 1. Trajectories of the medicanes considered in the study and presented in Section 2.6. Markers indicate the beginning of the recorded trajectory (triangle) as well as the end of it (square). The black cross shows the location of the infrasound station IS48 in Tunisia. The trajectories drawn with a solid (resp. dotted) line indicate medicanes for which significant infrasound detections could (resp. not) be observed at the station, at least in one of both frequency ranges considered in the paper.
Remotesensing 14 06162 g001
Figure 2. Distance of the medicane’s eye to the station IS48. The same color and line code is applied as in Figure 1.
Remotesensing 14 06162 g002
Figure 3. Time series (a) of the detection azimuths obtained with PMCC processing in the higher frequency (HF) range (28 Hz) applied to IS48 data when Μedicane Trudy was active, (b) of the wind fields at the surface obtained from ERA5 (blue for wind gust and red for wind), and (c) of a proxy indicative of wind noise (see text for detail). In the top plot, the colors code for the rms amplitude of the signal on a logarithmic scale (log10). The dotted lines indicate a +/−200 km distance to the vortex center in order to guide the eye.
Remotesensing 14 06162 g003
Figure 4. Same as Figure 3, but for Medicane Ianos.
Remotesensing 14 06162 g004
Figure 5. Distributions of rms amplitudes (top) and trace velocity (bottom) for detections related to Tudy (left) and to Ianos (right) in the higher frequency range 2–8 Hz. For Ianos, detections likely to be related to the Etna Volcano (see text for details) are plotted in red in transparency, on top of the detections thought to be only related to the medicane (in blue) (“#detections” means “number of infrasound detections”).
Remotesensing 14 06162 g005
Figure 6. As in Figure 3 in the lower frequency (LF) range (0.1–0.5 Hz).
Remotesensing 14 06162 g006
Figure 7. As in Figure 6, but for Ianos.
Remotesensing 14 06162 g007
Figure 8. As in Figure 6, but for the Medicane Zorbas and in the 0.1–0.5 Hz range. The bottom plots showing the winds (b) and the proxy for wind noise (c) are the same as in Figure 3 or Figure 4.
Remotesensing 14 06162 g008
Figure 9. Distributions of rms amplitudes (top) and trace velocities (bottom) for detections related to Trudy (left), Ianos (middle), and Zorbas (right) in the microbarom frequency range. Red color relates to the 0.1–0.2 Hz range, yellow to the 0.2–0.4 Hz range, and blue to the 0.4–0.5 Hz range. Where blue bars are superimposed to yellow bars the transparency leads to the green color. Transparency also darkens the red color. (“#detections” means “number of infrasound detections”).
Remotesensing 14 06162 g009
Figure 10. Vertical profiles of cratio derived using ERA5 fields at the infrasound station IS48 during Medicane Ianos in 2020 (left), Medicane Trudy in 2019 (middle), and Medicane Zorbas in 2018 (right). The vertical dashed line indicates the value cratio = 1, which is a necessary condition for infrasound guiding in the geometric acoustics approximation. The dotted line indicates cratio = 0.95.
Remotesensing 14 06162 g010
Figure 11. Same as Figure 10, but for Apollo in 2021 (left), Trixie in 2016 (middle), and Qendresa in 2014 (right).
Remotesensing 14 06162 g011
Figure 12. Time-series of ERA5 10-m wind (red line) and gusts (blue) (m/s) at IS48 during Trixie (top), Qendresa (middle), and Apollo (bottom), along with acoustic power integrated between 0.01 and 0.1 Hz (black line), as presented in Figure 3b and c for Trudy, for instance.
Remotesensing 14 06162 g012
Figure 13. Time series related to Trudy. (a) PMCC detections in the 2–8 Hz band, as shown in Figure 3a. The dashed blue line indicates the edges of the main convective system related to the medicane (see text for details). (b) Deep convection (DC) pixels color-coded by the difference in brightness temperature (BT) introduced in Section 2.3. Positive values of ΔBT indicate deep convection, and larger values relate to stronger deep convection (c) WWLLN detections of lightning related to Trudy color-coded by the distance of the lightning to IS48.
Remotesensing 14 06162 g013
Figure 14. Same as Figure 13, but for Ianos.
Remotesensing 14 06162 g014
Figure 15. (a) Number of 6-hourly PMCC detections shown in Figure 3a as a function of time during Trudy. (b) Number of WWLLN lightning detections within 1000 km around the medicane eye as a function of time. The red shaded area represents the mature phase of the cyclone when it reaches its highest intensity. (c) Ratio Nlight/Ntotal as a function of time, where Nlight is the number of PMCC detections (pixels) linked to at least one WWLLN lightning detection (see text for details) and Ntotal the total number of PMCC detections shown in (a) (recall that several PMCC detections will be related to a single lightning) (#detections and #lightning refer to the number of detections and to the number of lightning strokes, respectively).
Remotesensing 14 06162 g015
Figure 16. Same as Figure 15, but for Ianos.
Remotesensing 14 06162 g016
Figure 17. Maps of the equivalent surface pressure spectral density (proportional to the Hasselmann integral) in Pa2 m2 s for Zorbas (a,d), Trudy (b,e), and Ianos (c,f) at two different acoustic frequencies: 0.213 Hz (top row) and 0.415 Hz (bottom row). The orange circle shows the position of the IS48 station in Tunisia.
Remotesensing 14 06162 g017
Figure 18. Simulation of infrasound detections at IS48 in the form of the acoustic directional spectrum (acoustic power in W as a function of back azimuth) in the 0.1–0.5 Hz band shown with the colormap for sources within 1000 km of IS48, for Ianos (a), Trudy (b), and Zorbas (c); Black dots are the PMCC detections in the 0.1–0.5 Hz band. Cyan triangles and purple circles are the daily maxima of the acoustic directional spectrum in the 0.1–0.2 Hz band and the 0.4–0.5 Hz band, respectively. The red solid line marks the medicane eye trajectory, while the dashed lines correspond to the eye trajectory +/−200 km.
Remotesensing 14 06162 g018
Figure 19. Same as Figure 18 but for detection simulations performed for sources within a distance of 5000 km from the station IS48.
Remotesensing 14 06162 g019
Publisher’s Note: MDPI stays neutral with regard to jurisdictional claims in published maps and institutional affiliations.

