Next Issue
Volume 7, June
Previous Issue
Volume 6, December


Big Data Cogn. Comput., Volume 7, Issue 1 (March 2023) – 56 articles

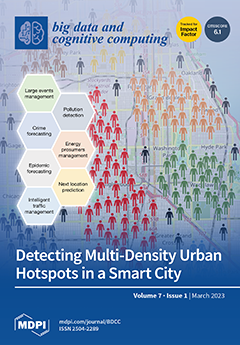
Cover Story (view full-size image): Detecting city hotspots can support planners, scientists, and policymakers to deal with challenges related to city management. Since metropolitan areas are heavily characterized by variable densities, multi-density clustering seems more appropriate than the classic techniques for discovering city hotspots. This paper discusses research issues and challenges for analyzing urban data, aimed at discovering multi-density hotspots in metropolitan areas. The study compares several approaches proposed in the literature for clustering urban data and analyzes their performance on both state-of-the-art and real-world datasets, showing that multi-density clustering algorithms generally achieve better results on urban data than the classic density-based algorithms. View this paper
  • Issues are regarded as officially published after their release is announced to the table of contents alert mailing list.
  • You may sign up for e-mail alerts to receive table of contents of newly released issues.
  • PDF is the official format for papers published in both, html and pdf forms. To view the papers in pdf format, click on the "PDF Full-text" link, and use the free Adobe Reader to open them.
Order results
Result details
Select all
Export citation of selected articles as:
18 pages, 500 KiB  
Article
Candidate Set Expansion for Entity and Relation Linking Based on Mutual Entity–Relation Interaction
by Botao Zhang, Yong Feng, Lin Fu, Jinguang Gu and Fangfang Xu
Big Data Cogn. Comput. 2023, 7(1), 56; https://doi.org/10.3390/bdcc7010056 - 22 Mar 2023
Cited by 1 | Viewed by 1491
Abstract
Entity and relation linking are the core tasks in knowledge base question answering (KBQA). They connect natural language questions with triples in the knowledge base. In most studies, researchers perform these two tasks independently, which ignores the interplay between the entity and relation [...] Read more.
Entity and relation linking are the core tasks in knowledge base question answering (KBQA). They connect natural language questions with triples in the knowledge base. In most studies, researchers perform these two tasks independently, which ignores the interplay between the entity and relation linking. To address the above problems, some researchers have proposed a framework for joint entity and relation linking based on feature joint and multi-attention. In this paper, based on their method, we offer a candidate set generation expansion model to improve the coverage of correct candidate words and to ensure that the correct disambiguation objects exist in the candidate list as much as possible. Our framework first uses the initial relation candidate set to obtain the entity nodes in the knowledge graph related to this relation. Second, the filtering rule filters out the less-relevant entity candidates to obtain the expanded entity candidate set. Third, the relation nodes directly connected to the nodes in the expanded entity candidate set are added to the initial relation candidate set. Finally, a ranking algorithm filters out the less-relevant relation candidates to obtain the expanded relation candidate set. An empirical study shows that this model improves the recall and correctness of the entity and relation linking for KBQA. The candidate set expansion method based on entity–relation interaction proposed in this paper is highly portable and scalable. The method in this paper considers the connections between question subgraphs in knowledge graphs and provides new ideas for the candidate set expansion. Full article
Show Figures

Figure 1

19 pages, 8780 KiB  
Article
Effect of Missing Data Types and Imputation Methods on Supervised Classifiers: An Evaluation Study
by Menna Ibrahim Gabr, Yehia Mostafa Helmy and Doaa Saad Elzanfaly
Big Data Cogn. Comput. 2023, 7(1), 55; https://doi.org/10.3390/bdcc7010055 - 22 Mar 2023
Cited by 3 | Viewed by 2023
Abstract
Data completeness is one of the most common challenges that hinder the performance of data analytics platforms. Different studies have assessed the effect of missing values on different classification models based on a single evaluation metric, namely, accuracy. However, accuracy on its own [...] Read more.
Data completeness is one of the most common challenges that hinder the performance of data analytics platforms. Different studies have assessed the effect of missing values on different classification models based on a single evaluation metric, namely, accuracy. However, accuracy on its own is a misleading measure of classifier performance because it does not consider unbalanced datasets. This paper presents an experimental study that assesses the effect of incomplete datasets on the performance of five classification models. The analysis was conducted with different ratios of missing values in six datasets that vary in size, type, and balance. Moreover, for unbiased analysis, the performance of the classifiers was measured using three different metrics, namely, the Matthews correlation coefficient (MCC), the F1-score, and accuracy. The results show that the sensitivity of the supervised classifiers to missing data differs according to a set of factors. The most significant factor is the missing data pattern and ratio, followed by the imputation method, and then the type, size, and balance of the dataset. The sensitivity of the classifiers when data are missing due to the Missing Completely At Random (MCAR) pattern is less than their sensitivity when data are missing due to the Missing Not At Random (MNAR) pattern. Furthermore, using the MCC as an evaluation measure better reflects the variation in the sensitivity of the classifiers to the missing data. Full article
(This article belongs to the Special Issue Machine Learning in Data Mining for Knowledge Discovery)
Show Figures

Figure 1

19 pages, 10184 KiB  
Article
Recognizing Road Surface Traffic Signs Based on Yolo Models Considering Image Flips
by Christine Dewi, Rung-Ching Chen, Yong-Cun Zhuang, Xiaoyi Jiang and Hui Yu
Big Data Cogn. Comput. 2023, 7(1), 54; https://doi.org/10.3390/bdcc7010054 - 22 Mar 2023
Cited by 6 | Viewed by 2673
Abstract
In recent years, there have been significant advances in deep learning and road marking recognition due to machine learning and artificial intelligence. Despite significant progress, it often relies heavily on unrepresentative datasets and limited situations. Drivers and advanced driver assistance systems rely on [...] Read more.
In recent years, there have been significant advances in deep learning and road marking recognition due to machine learning and artificial intelligence. Despite significant progress, it often relies heavily on unrepresentative datasets and limited situations. Drivers and advanced driver assistance systems rely on road markings to help them better understand their environment on the street. Road markings are signs and texts painted on the road surface, including directional arrows, pedestrian crossings, speed limit signs, zebra crossings, and other equivalent signs and texts. Pavement markings are also known as road markings. Our experiments briefly discuss convolutional neural network (CNN)-based object detection algorithms, specifically for Yolo V2, Yolo V3, Yolo V4, and Yolo V4-tiny. In our experiments, we built the Taiwan Road Marking Sign Dataset (TRMSD) and made it a public dataset so other researchers could use it. Further, we train the model to distinguish left and right objects into separate classes. Furthermore, Yolo V4 and Yolo V4-tiny results can benefit from the “No Flip” setting. In our case, we want the model to distinguish left and right objects into separate classes. The best model in the experiment is Yolo V4 (No Flip), with a test accuracy of 95.43% and an IoU of 66.12%. In this study, Yolo V4 (without flipping) outperforms state-of-the-art schemes, achieving 81.22% training accuracy and 95.34% testing accuracy on the TRMSD dataset. Full article
Show Figures

Figure 1

16 pages, 4964 KiB  
Article
Deep Learning for Highly Accurate Hand Recognition Based on Yolov7 Model
by Christine Dewi, Abbott Po Shun Chen and Henoch Juli Christanto
Big Data Cogn. Comput. 2023, 7(1), 53; https://doi.org/10.3390/bdcc7010053 - 22 Mar 2023
Cited by 17 | Viewed by 4700
Abstract
Hand detection is a key step in the pre-processing stage of many computer vision tasks because human hands are involved in the activity. Some examples of such tasks are hand posture estimation, hand gesture recognition, human activity analysis, and other tasks such as [...] Read more.
Hand detection is a key step in the pre-processing stage of many computer vision tasks because human hands are involved in the activity. Some examples of such tasks are hand posture estimation, hand gesture recognition, human activity analysis, and other tasks such as these. Human hands have a wide range of motion and change their appearance in a lot of different ways. This makes it hard to identify some hands in a crowded place, and some hands can move in a lot of different ways. In this investigation, we provide a concise analysis of CNN-based object recognition algorithms, more specifically, the Yolov7 and Yolov7x models with 100 and 200 epochs. This study explores a vast array of object detectors, some of which are used to locate hand recognition applications. Further, we train and test our proposed method on the Oxford Hand Dataset with the Yolov7 and Yolov7x models. Important statistics, such as the quantity of GFLOPS, the mean average precision (mAP), and the detection time, are tracked and monitored via performance metrics. The results of our research indicate that Yolov7x with 200 epochs during the training stage is the most stable approach when compared to other methods. It achieved 84.7% precision, 79.9% recall, and 86.1% mAP when it was being trained. In addition, Yolov7x accomplished the highest possible average mAP score, which was 86.3%, during the testing stage. Full article
Show Figures

Figure 1

24 pages, 7711 KiB  
Article
Analysis of the Numerical Solutions of the Elder Problem Using Big Data and Machine Learning
by Roman Khotyachuk and Klaus Johannsen
Big Data Cogn. Comput. 2023, 7(1), 52; https://doi.org/10.3390/bdcc7010052 - 20 Mar 2023
Viewed by 1592
Abstract
In this study, the numerical solutions to the Elder problem are analyzed using Big Data technologies and data-driven approaches. The steady-state solutions to the Elder problem are investigated with regard to Rayleigh numbers (Ra), grid sizes, perturbations, and other parameters [...] Read more.
In this study, the numerical solutions to the Elder problem are analyzed using Big Data technologies and data-driven approaches. The steady-state solutions to the Elder problem are investigated with regard to Rayleigh numbers (Ra), grid sizes, perturbations, and other parameters of the system studied. The complexity analysis is carried out for the datasets containing different solutions to the Elder problem, and the time of the highest complexity of numerical solutions is estimated. An approach to the identification of transient fingers and the visualization of large ensembles of solutions is proposed. Predictive models are developed to forecast steady states based on early-time observations. These models are classified into three possible types depending on the features (predictors) used in a model. The numerical results of the prediction accuracy are given, including the estimated confidence intervals for the accuracy, and the estimated time of 95% predictability. Different solutions, their averages, principal components, and other parameters are visualized. Full article
(This article belongs to the Topic Big Data and Artificial Intelligence)
Show Figures

Figure 1

12 pages, 2067 KiB  
Article
Classification of Microbiome Data from Type 2 Diabetes Mellitus Individuals with Deep Learning Image Recognition
by Juliane Pfeil, Julienne Siptroth, Heike Pospisil, Marcus Frohme, Frank T. Hufert, Olga Moskalenko, Murad Yateem and Alina Nechyporenko
Big Data Cogn. Comput. 2023, 7(1), 51; https://doi.org/10.3390/bdcc7010051 - 17 Mar 2023
Viewed by 2576
Abstract
Microbiomic analysis of human gut samples is a beneficial tool to examine the general well-being and various health conditions. The balance of the intestinal flora is important to prevent chronic gut infections and adiposity, as well as pathological alterations connected to various diseases. [...] Read more.
Microbiomic analysis of human gut samples is a beneficial tool to examine the general well-being and various health conditions. The balance of the intestinal flora is important to prevent chronic gut infections and adiposity, as well as pathological alterations connected to various diseases. The evaluation of microbiome data based on next-generation sequencing (NGS) is complex and their interpretation is often challenging and can be ambiguous. Therefore, we developed an innovative approach for the examination and classification of microbiomic data into healthy and diseased by visualizing the data as a radial heatmap in order to apply deep learning (DL) image classification. The differentiation between 674 healthy and 272 type 2 diabetes mellitus (T2D) samples was chosen as a proof of concept. The residual network with 50 layers (ResNet-50) image classification model was trained and optimized, providing discrimination with 96% accuracy. Samples from healthy persons were detected with a specificity of 97% and those from T2D individuals with a sensitivity of 92%. Image classification using DL of NGS microbiome data enables precise discrimination between healthy and diabetic individuals. In the future, this tool could enable classification of different diseases and imbalances of the gut microbiome and their causative genera. Full article
Show Figures

Figure 1

16 pages, 2013 KiB  
Article
A Hybrid Deep Learning Framework with Decision-Level Fusion for Breast Cancer Survival Prediction
by Nermin Abdelhakim Othman, Manal A. Abdel-Fattah and Ahlam Talaat Ali
Big Data Cogn. Comput. 2023, 7(1), 50; https://doi.org/10.3390/bdcc7010050 - 16 Mar 2023
Cited by 5 | Viewed by 2544
Abstract
Because of technological advancements and their use in the medical area, many new methods and strategies have been developed to address complex real-life challenges. Breast cancer, a particular kind of tumor that arises in breast cells, is one of the most prevalent types [...] Read more.
Because of technological advancements and their use in the medical area, many new methods and strategies have been developed to address complex real-life challenges. Breast cancer, a particular kind of tumor that arises in breast cells, is one of the most prevalent types of cancer in women and is. Early breast cancer detection and classification are crucial. Early detection considerably increases the likelihood of survival, which motivates us to contribute to different detection techniques from a technical standpoint. Additionally, manual detection requires a lot of time and effort and carries the risk of pathologist error and inaccurate classification. To address these problems, in this study, a hybrid deep learning model that enables decision making based on data from multiple data sources is proposed and used with two different classifiers. By incorporating multi-omics data (clinical data, gene expression data, and copy number alteration data) from the Molecular Taxonomy of Breast Cancer International Consortium (METABRIC) dataset, the accuracy of patient survival predictions is expected to be improved relative to prediction utilizing only one modality of data. A convolutional neural network (CNN) architecture is used for feature extraction. LSTM and GRU are used as classifiers. The accuracy achieved by LSTM is 97.0%, and that achieved by GRU is 97.5, while using decision fusion (LSTM and GRU) achieves the best accuracy of 98.0%. The prediction performance assessed using various performance indicators demonstrates that our model outperforms currently used methodologies. Full article
(This article belongs to the Special Issue Deep Network Learning and Its Applications)
Show Figures

Figure 1

31 pages, 7425 KiB  
Article
Evaluating Task-Level CPU Efficiency for Distributed Stream Processing Systems
by Johannes Rank, Jonas Herget, Andreas Hein and Helmut Krcmar
Big Data Cogn. Comput. 2023, 7(1), 49; https://doi.org/10.3390/bdcc7010049 - 10 Mar 2023
Viewed by 2181
Abstract
Big Data and primarily distributed stream processing systems (DSPSs) are growing in complexity and scale. As a result, effective performance management to ensure that these systems meet the required service level objectives (SLOs) is becoming increasingly difficult. A key factor to consider when [...] Read more.
Big Data and primarily distributed stream processing systems (DSPSs) are growing in complexity and scale. As a result, effective performance management to ensure that these systems meet the required service level objectives (SLOs) is becoming increasingly difficult. A key factor to consider when evaluating the performance of a DSPS is CPU efficiency, which is the ratio of the workload processed by the system to the CPU resources invested. In this paper, we argue that developing new performance tools for creating DSPSs that can fulfill SLOs while using minimal resources is crucial. This is especially significant in edge computing situations where resources are limited and in large cloud deployments where conserving power and reducing computing expenses are essential. To address this challenge, we present a novel task-level approach for measuring CPU efficiency in DSPSs. Our approach supports various streaming frameworks, is adaptable, and comes with minimal overheads. This enables developers to understand the efficiency of different DSPSs at a granular level and provides insights that were not previously possible. Full article
(This article belongs to the Special Issue Distributed Applications and Services for Future Internet)
Show Figures

Figure 1

17 pages, 12591 KiB  
Article
Real-Time Attention Monitoring System for Classroom: A Deep Learning Approach for Student’s Behavior Recognition
by Zouheir Trabelsi, Fady Alnajjar, Medha Mohan Ambali Parambil, Munkhjargal Gochoo and Luqman Ali
Big Data Cogn. Comput. 2023, 7(1), 48; https://doi.org/10.3390/bdcc7010048 - 09 Mar 2023
Cited by 15 | Viewed by 11949
Abstract
Effective classroom instruction requires monitoring student participation and interaction during class, identifying cues to simulate their attention. The ability of teachers to analyze and evaluate students’ classroom behavior is becoming a crucial criterion for quality teaching. Artificial intelligence (AI)-based behavior recognition techniques can [...] Read more.
Effective classroom instruction requires monitoring student participation and interaction during class, identifying cues to simulate their attention. The ability of teachers to analyze and evaluate students’ classroom behavior is becoming a crucial criterion for quality teaching. Artificial intelligence (AI)-based behavior recognition techniques can help evaluate students’ attention and engagement during classroom sessions. With rapid digitalization, the global education system is adapting and exploring emerging technological innovations, such as AI, the Internet of Things, and big data analytics, to improve education systems. In educational institutions, modern classroom systems are supplemented with the latest technologies to make them more interactive, student centered, and customized. However, it is difficult for instructors to assess students’ interest and attention levels even with these technologies. This study harnesses modern technology to introduce an intelligent real-time vision-based classroom to monitor students’ emotions, attendance, and attention levels even when they have face masks on. We used a machine learning approach to train students’ behavior recognition models, including identifying facial expressions, to identify students’ attention/non-attention in a classroom. The attention/no-attention dataset is collected based on nine categories. The dataset is given the YOLOv5 pre-trained weights for training. For validation, the performance of various versions of the YOLOv5 model (v5m, v5n, v5l, v5s, and v5x) are compared based on different evaluation measures (precision, recall, mAP, and F1 score). Our results show that all models show promising performance with 76% average accuracy. Applying the developed model can enable instructors to visualize students’ behavior and emotional states at different levels, allowing them to appropriately manage teaching sessions by considering student-centered learning scenarios. Overall, the proposed model will enhance instructors’ performance and students at an academic level. Full article
Show Figures

Figure 1

25 pages, 616 KiB  
Article
Modeling, Evaluating, and Applying the eWoM Power of Reddit Posts
by Gianluca Bonifazi, Enrico Corradini, Domenico Ursino and Luca Virgili
Big Data Cogn. Comput. 2023, 7(1), 47; https://doi.org/10.3390/bdcc7010047 - 09 Mar 2023
Cited by 5 | Viewed by 2448
Abstract
Electronic Word of Mouth (eWoM) has been largely studied for social platforms, such as Yelp and TripAdvisor, which are highly investigated in the context of digital marketing. However, it can also have interesting applications in other contexts. Therefore, it can be challenging to [...] Read more.
Electronic Word of Mouth (eWoM) has been largely studied for social platforms, such as Yelp and TripAdvisor, which are highly investigated in the context of digital marketing. However, it can also have interesting applications in other contexts. Therefore, it can be challenging to investigate this phenomenon on generic social platforms, such as Facebook, Twitter, and Reddit. In the past literature, many authors analyzed eWoM on Facebook and Twitter, whereas it was little considered in Reddit. In this paper, we focused exactly on this last platform. In particular, we first propose a model for representing and evaluating the eWoM Power of Reddit posts. Then, we illustrate two possible applications, namely the definition of lifespan templates and the construction of profiles for Reddit posts. Lifespan templates and profiles are ultimately orthogonal to each other and can be jointly employed in several applications. Full article
(This article belongs to the Special Issue Graph-Based Data Mining and Social Network Analysis)
Show Figures

Figure 1

18 pages, 2033 KiB  
Article
Machine Learning-Based Identifications of COVID-19 Fake News Using Biomedical Information Extraction
by Faizi Fifita, Jordan Smith, Melissa B. Hanzsek-Brill, Xiaoyin Li and Mengshi Zhou
Big Data Cogn. Comput. 2023, 7(1), 46; https://doi.org/10.3390/bdcc7010046 - 07 Mar 2023
Cited by 3 | Viewed by 3743
Abstract
The spread of fake news related to COVID-19 is an infodemic that leads to a public health crisis. Therefore, detecting fake news is crucial for an effective management of the COVID-19 pandemic response. Studies have shown that machine learning models can detect COVID-19 [...] Read more.
The spread of fake news related to COVID-19 is an infodemic that leads to a public health crisis. Therefore, detecting fake news is crucial for an effective management of the COVID-19 pandemic response. Studies have shown that machine learning models can detect COVID-19 fake news based on the content of news articles. However, the use of biomedical information, which is often featured in COVID-19 news, has not been explored in the development of these models. We present a novel approach for predicting COVID-19 fake news by leveraging biomedical information extraction (BioIE) in combination with machine learning models. We analyzed 1164 COVID-19 news articles and used advanced BioIE algorithms to extract 158 novel features. These features were then used to train 15 machine learning classifiers to predict COVID-19 fake news. Among the 15 classifiers, the random forest model achieved the best performance with an area under the ROC curve (AUC) of 0.882, which is 12.36% to 31.05% higher compared to models trained on traditional features. Furthermore, incorporating BioIE-based features improved the performance of a state-of-the-art multi-modality model (AUC 0.914 vs. 0.887). Our study suggests that incorporating biomedical information into fake news detection models improves their performance, and thus could be a valuable tool in the fight against the COVID-19 infodemic. Full article
Show Figures

Figure 1

23 pages, 4426 KiB  
Article
Textual Feature Extraction Using Ant Colony Optimization for Hate Speech Classification
by Shilpa Gite, Shruti Patil, Deepak Dharrao, Madhuri Yadav, Sneha Basak, Arundarasi Rajendran and Ketan Kotecha
Big Data Cogn. Comput. 2023, 7(1), 45; https://doi.org/10.3390/bdcc7010045 - 06 Mar 2023
Cited by 6 | Viewed by 2651
Abstract
Feature selection and feature extraction have always been of utmost importance owing to their capability to remove redundant and irrelevant features, reduce the vector space size, control the computational time, and improve performance for more accurate classification tasks, especially in text categorization. These [...] Read more.
Feature selection and feature extraction have always been of utmost importance owing to their capability to remove redundant and irrelevant features, reduce the vector space size, control the computational time, and improve performance for more accurate classification tasks, especially in text categorization. These feature engineering techniques can further be optimized using optimization algorithms. This paper proposes a similar framework by implementing one such optimization algorithm, Ant Colony Optimization (ACO), incorporating different feature selection and feature extraction techniques on textual and numerical datasets using four machine learning (ML) models: Logistic Regression (LR), K-Nearest Neighbor (KNN), Stochastic Gradient Descent (SGD), and Random Forest (RF). The aim is to show the difference in the results achieved on both datasets with the help of comparative analysis. The proposed feature selection and feature extraction techniques assist in enhancing the performance of the machine learning model. This research article considers numerical and text-based datasets for stroke prediction and detecting hate speech, respectively. The text dataset is prepared by extracting tweets consisting of positive, negative, and neutral sentiments from Twitter API. A maximum improvement in accuracy of 10.07% is observed for Random Forest with the TF-IDF feature extraction technique on the application of ACO. Besides, this study also highlights the limitations of text data that inhibit the performance of machine learning models, justifying the difference of almost 18.43% in accuracy compared to that of numerical data. Full article
(This article belongs to the Special Issue Big Data and Cognitive Computing in 2023)
Show Figures

Figure 1

19 pages, 800 KiB  
Systematic Review
Disclosing Edge Intelligence: A Systematic Meta-Survey
by Vincenzo Barbuto, Claudio Savaglio, Min Chen and Giancarlo Fortino
Big Data Cogn. Comput. 2023, 7(1), 44; https://doi.org/10.3390/bdcc7010044 - 02 Mar 2023
Cited by 19 | Viewed by 3445
Abstract
The Edge Intelligence (EI) paradigm has recently emerged as a promising solution to overcome the inherent limitations of cloud computing (latency, autonomy, cost, etc.) in the development and provision of next-generation Internet of Things (IoT) services. Therefore, motivated by its increasing popularity, relevant [...] Read more.
The Edge Intelligence (EI) paradigm has recently emerged as a promising solution to overcome the inherent limitations of cloud computing (latency, autonomy, cost, etc.) in the development and provision of next-generation Internet of Things (IoT) services. Therefore, motivated by its increasing popularity, relevant research effort was expended in order to explore, from different perspectives and at different degrees of detail, the many facets of EI. In such a context, the aim of this paper was to analyze the wide landscape on EI by providing a systematic analysis of the state-of-the-art manuscripts in the form of a tertiary study (i.e., a review of literature reviews, surveys, and mapping studies) and according to the guidelines of the PRISMA methodology. A comparison framework is, hence, provided and sound research questions outlined, aimed at exploring (for the benefit of both experts and beginners) the past, present, and future directions of the EI paradigm and its relationships with the IoT and the cloud computing worlds. Full article
Show Figures

Figure 1

16 pages, 3458 KiB  
Article
An Obstacle-Finding Approach for Autonomous Mobile Robots Using 2D LiDAR Data
by Lesia Mochurad, Yaroslav Hladun and Roman Tkachenko
Big Data Cogn. Comput. 2023, 7(1), 43; https://doi.org/10.3390/bdcc7010043 - 01 Mar 2023
Cited by 10 | Viewed by 2783
Abstract
Obstacle detection is crucial for the navigation of autonomous mobile robots: it is necessary to ensure their presence as accurately as possible and find their position relative to the robot. Autonomous mobile robots for indoor navigation purposes use several special sensors for various [...] Read more.
Obstacle detection is crucial for the navigation of autonomous mobile robots: it is necessary to ensure their presence as accurately as possible and find their position relative to the robot. Autonomous mobile robots for indoor navigation purposes use several special sensors for various tasks. One such study is localizing the robot in space. In most cases, the LiDAR sensor is employed to solve this problem. In addition, the data from this sensor are critical, as the sensor is directly related to the distance of objects and obstacles surrounding the robot, so LiDAR data can be used for detection. This article is devoted to developing an obstacle detection algorithm based on 2D LiDAR sensor data. We propose a parallelization method to speed up this algorithm while processing big data. The result is an algorithm that finds obstacles and objects with high accuracy and speed: it receives a set of points from the sensor and data about the robot’s movements. It outputs a set of line segments, where each group of such line segments describes an object. The two proposed metrics assessed accuracy, and both averages are high: 86% and 91% for the first and second metrics, respectively. The proposed method is flexible enough to optimize it for a specific configuration of the LiDAR sensor. Four hyperparameters are experimentally found for a given sensor configuration to maximize the correspondence between real and found objects. The work of the proposed algorithm has been carefully tested on simulated and actual data. The authors also investigated the relationship between the selected hyperparameters’ values and the algorithm’s efficiency. Potential applications, limitations, and opportunities for future research are discussed. Full article
(This article belongs to the Special Issue Quality and Security of Critical Infrastructure Systems)
Show Figures

Figure 1

10 pages, 1071 KiB  
Article
Adoption Case of IIoT and Machine Learning to Improve Energy Consumption at a Process Manufacturing Firm, under Industry 5.0 Model
by Andrés Redchuk, Federico Walas Mateo, Guadalupe Pascal and Julian Eloy Tornillo
Big Data Cogn. Comput. 2023, 7(1), 42; https://doi.org/10.3390/bdcc7010042 - 24 Feb 2023
Cited by 3 | Viewed by 2392
Abstract
Considering the novel concept of Industry 5.0 model, where sustainability is aimed together with integration in the value chain and centrality of people in the production environment, this article focuses on a case where energy efficiency is achieved. The work presents a food [...] Read more.
Considering the novel concept of Industry 5.0 model, where sustainability is aimed together with integration in the value chain and centrality of people in the production environment, this article focuses on a case where energy efficiency is achieved. The work presents a food industry case where a low-code AI platform was adopted to improve the efficiency and lower environmental footprint impact of its operations. The paper describes the adoption process of the solution integrated with an IIoT architecture that generates data to achieve process optimization. The case shows how a low-code AI platform can ease energy efficiency, considering people in the process, empowering them, and giving a central role in the improvement opportunity. The paper includes a conceptual framework on issues related to Industry 5.0 model, the food industry, IIoT, and machine learning. The adoption case’s relevancy is marked by how the business model looks to democratize artificial intelligence in industrial firms. The proposed model delivers value to ease traditional industries to obtain better operational results and contribute to a better use of resources. Finally, the work intends to go through opportunities that arise around artificial intelligence as a driver for new business and operating models considering the role of people in the process. By empowering industrial engineers with data driven solutions, organizations can ensure that their domain expertise can be applied to data insights to achieve better outcomes. Full article
Show Figures

Figure 1

18 pages, 5142 KiB  
Article
Analyzing the Performance of Transformers for the Prediction of the Blood Glucose Level Considering Imputation and Smoothing
by Edgar Acuna, Roxana Aparicio and Velcy Palomino
Big Data Cogn. Comput. 2023, 7(1), 41; https://doi.org/10.3390/bdcc7010041 - 23 Feb 2023
Cited by 1 | Viewed by 2139
Abstract
In this paper we investigate the effect of two preprocessing techniques, data imputation and smoothing, in the prediction of blood glucose level in type 1 diabetes patients, using a novel deep learning model called Transformer. We train three models: XGBoost, a one-dimensional convolutional [...] Read more.
In this paper we investigate the effect of two preprocessing techniques, data imputation and smoothing, in the prediction of blood glucose level in type 1 diabetes patients, using a novel deep learning model called Transformer. We train three models: XGBoost, a one-dimensional convolutional neural network (1D-CNN), and the Transformer model to predict future blood glucose levels for a 30-min horizon using a 60-min time series history in the OhioT1DM dataset. We also compare four methods of handling missing time series data during the model training: hourly mean, linear interpolation, cubic interpolation, and spline interpolation; and two smoothing techniques: Kalman smoothing and smoothing splines. Our experiments show that the Transformer performs better than XGBoost and 1D-CNN when only continuous glucose monitoring (CGM) is used as a predictor, and that it is very competitive against XGBoost when CGM and carbohydrate intake from the meal are used to predict blood glucose level. Overall, our results are more accurate than those appearing in the literature. Full article
Show Figures

Figure 1

28 pages, 4156 KiB  
Article
Heterogeneous Traffic Condition Dataset Collection for Creating Road Capacity Value
by Surya Michrandi Nasution, Emir Husni, Kuspriyanto Kuspriyanto and Rahadian Yusuf
Big Data Cogn. Comput. 2023, 7(1), 40; https://doi.org/10.3390/bdcc7010040 - 22 Feb 2023
Cited by 1 | Viewed by 1850
Abstract
Indonesia has the third highest number of motorcycles, which means the traffic flow in Indonesia is heterogeneous. Traffic flow can specify its condition, whether it is a free flow or very heavy traffic. Traffic condition is the most important criterion used to find [...] Read more.
Indonesia has the third highest number of motorcycles, which means the traffic flow in Indonesia is heterogeneous. Traffic flow can specify its condition, whether it is a free flow or very heavy traffic. Traffic condition is the most important criterion used to find the best route from an origin to a destination. This paper collects the traffic condition for several road segments which are calculated based on the degree of saturation by using two methods, namely, (1) by counting the number of vehicles using object detection in the public closed-circuit television (CCTV) stream, and (2) by requesting the traffic information (vehicle’s speed) using TomTom. Both methods deliver the saturation degree and calculate the traffic condition for each road segment. Based on the experiments, the average error rate obtained by counting the number of vehicles on Pramuka–Cihapit and Trunojoyo was 0–2 cars, 2–3 motorcycles, and 0–1 for others. Meanwhile, the average error on Merdeka-Aceh Intersection reached 6 cars, 11 motorcycles, and 1 for other vehicles. The average speed calculation for the left side of the road is more accurate than the right side, and the average speed on the left side is less than 3.3 km/h. Meanwhile, on the right side, the differences between actual and calculated vehicle speeds are between 11.088 and 22.222 km/h. This high error rate is caused by (1) the low resolution of the public CCTV, (2) some obstacles interfering with the view of CCTV, (3) the misdetection of the type of vehicles, and by (4) the vehicles moving too fast. The collected dataset can be used in further studies to solve the congestion problem, especially in Indonesia. Full article
(This article belongs to the Special Issue Applied Artificial Intelligence for Sustainability)
Show Figures

Figure 1

23 pages, 3933 KiB  
Article
Deep Clustering-Based Anomaly Detection and Health Monitoring for Satellite Telemetry
by Muhamed Abdulhadi Obied, Fayed F. M. Ghaleb, Aboul Ella Hassanien, Ahmed M. H. Abdelfattah and Wael Zakaria
Big Data Cogn. Comput. 2023, 7(1), 39; https://doi.org/10.3390/bdcc7010039 - 22 Feb 2023
Cited by 4 | Viewed by 2486
Abstract
Satellite telemetry data plays an ever-important role in both the safety and the reliability of a satellite. These two factors are extremely significant in the field of space systems and space missions. Since it is challenging to repair space systems in orbit, health [...] Read more.
Satellite telemetry data plays an ever-important role in both the safety and the reliability of a satellite. These two factors are extremely significant in the field of space systems and space missions. Since it is challenging to repair space systems in orbit, health monitoring and early anomaly detection approaches are crucial for the success of space missions. A large number of efficient and accurate methods for health monitoring and anomaly detection have been proposed in aerospace systems but without showing enough concern for the patterns that can be mined from normal operational telemetry data. Concerning this, the present paper proposes DCLOP, an intelligent Deep Clustering-based Local Outlier Probabilities approach that aims at detecting anomalies alongside extracting realistic and reasonable patterns from the normal operational telemetry data. The proposed approach combines (i) a new deep clustering method that uses a dynamically weighted loss function with (ii) the adapted version of Local Outlier Probabilities based on the results of deep clustering. The DCLOP approach effectively monitors the health status of a spacecraft and detects the early warnings of its on-orbit failures. Therefore, this approach enhances the validity and accuracy of anomaly detection systems. The performance of the suggested approach is assessed using actual cube satellite telemetry data. The experimental findings prove that the suggested approach is competitive to the currently used techniques in terms of effectiveness, viability, and validity. Full article
(This article belongs to the Special Issue Machine Learning in Data Mining for Knowledge Discovery)
Show Figures

Figure 1

23 pages, 736 KiB  
Article
Performing Wash Trading on NFTs: Is the Game Worth the Candle?
by Gianluca Bonifazi, Francesco Cauteruccio, Enrico Corradini, Michele Marchetti, Daniele Montella, Simone Scarponi, Domenico Ursino and Luca Virgili
Big Data Cogn. Comput. 2023, 7(1), 38; https://doi.org/10.3390/bdcc7010038 - 21 Feb 2023
Cited by 9 | Viewed by 2823
Abstract
Wash trading is considered a highly inopportune and illegal behavior in regulated markets. Instead, it is practiced in unregulated markets, such as cryptocurrency or NFT (Non-Fungible Tokens) markets. Regarding the latter, in the past many researchers have been interested in this phenomenon from [...] Read more.
Wash trading is considered a highly inopportune and illegal behavior in regulated markets. Instead, it is practiced in unregulated markets, such as cryptocurrency or NFT (Non-Fungible Tokens) markets. Regarding the latter, in the past many researchers have been interested in this phenomenon from an “ex-ante” perspective, aiming to identify and classify wash trading activities before or at the exact time they happen. In this paper, we want to investigate the phenomenon of wash trading in the NFT market from a completely different perspective, namely “ex-post”. Our ultimate goal is to analyze wash trading activities in the past to understand whether the game is worth the candle, i.e., whether these illicit activities actually lead to a significant profit for their perpetrators. To the best of our knowledge, this is the first paper in the literature that attempts to answer this question in a “structured” way. The efforts to answer this question have enabled us to make some additional contributions to the literature in this research area. They are: (i) a framework to support future “ex-post” analyses of the NFT wash trading phenomenon; (ii) a new dataset on wash trading transactions involving NFTs that can support further future investigations of this phenomenon; (iii) a set of insights of the NFT wash trading phenomenon extracted at the end of an experimental campaign. Full article
(This article belongs to the Special Issue Big Data and Cognitive Computing in 2023)
Show Figures

Figure 1

35 pages, 4618 KiB  
Review
Face Liveness Detection Using Artificial Intelligence Techniques: A Systematic Literature Review and Future Directions
by Smita Khairnar, Shilpa Gite, Ketan Kotecha and Sudeep D. Thepade
Big Data Cogn. Comput. 2023, 7(1), 37; https://doi.org/10.3390/bdcc7010037 - 17 Feb 2023
Cited by 5 | Viewed by 7360
Abstract
Biometrics has been evolving as an exciting yet challenging area in the last decade. Though face recognition is one of the most promising biometrics techniques, it is vulnerable to spoofing threats. Many researchers focus on face liveness detection to protect biometric authentication systems [...] Read more.
Biometrics has been evolving as an exciting yet challenging area in the last decade. Though face recognition is one of the most promising biometrics techniques, it is vulnerable to spoofing threats. Many researchers focus on face liveness detection to protect biometric authentication systems from spoofing attacks with printed photos, video replays, etc. As a result, it is critical to investigate the current research concerning face liveness detection, to address whether recent advancements can give solutions to mitigate the rising challenges. This research performed a systematic review using the PRISMA approach by exploring the most relevant electronic databases. The article selection process follows preset inclusion and exclusion criteria. The conceptual analysis examines the data retrieved from the selected papers. To the author, this is one of the foremost systematic literature reviews dedicated to face-liveness detection that evaluates existing academic material published in the last decade. The research discusses face spoofing attacks, various feature extraction strategies, and Artificial Intelligence approaches in face liveness detection. Artificial intelligence-based methods, including Machine Learning and Deep Learning algorithms used for face liveness detection, have been discussed in the research. New research areas such as Explainable Artificial Intelligence, Federated Learning, Transfer learning, and Meta-Learning in face liveness detection, are also considered. A list of datasets, evaluation metrics, challenges, and future directions are discussed. Despite the recent and substantial achievements in this field, the challenges make the research in face liveness detection fascinating. Full article
Show Figures

Figure 1

25 pages, 6265 KiB  
Article
COVID-19 Classification through Deep Learning Models with Three-Channel Grayscale CT Images
by Maisarah Mohd Sufian, Ervin Gubin Moung, Mohd Hanafi Ahmad Hijazi, Farashazillah Yahya, Jamal Ahmad Dargham, Ali Farzamnia, Florence Sia and Nur Faraha Mohd Naim
Big Data Cogn. Comput. 2023, 7(1), 36; https://doi.org/10.3390/bdcc7010036 - 16 Feb 2023
Cited by 3 | Viewed by 3138
Abstract
COVID-19, an infectious coronavirus disease, has triggered a pandemic that has claimed many lives. Clinical institutes have long considered computed tomography (CT) as an excellent and complementary screening method to reverse transcriptase-polymerase chain reaction (RT-PCR). Because of the limited dataset available on COVID-19, [...] Read more.
COVID-19, an infectious coronavirus disease, has triggered a pandemic that has claimed many lives. Clinical institutes have long considered computed tomography (CT) as an excellent and complementary screening method to reverse transcriptase-polymerase chain reaction (RT-PCR). Because of the limited dataset available on COVID-19, transfer learning-based models have become the go-to solutions for automatic COVID-19 detection. However, CT images are typically provided in grayscale, thus posing a challenge for automatic detection using pre-trained models, which were previously trained on RGB images. Several methods have been proposed in the literature for converting grayscale images to RGB (three-channel) images for use with pre-trained deep-learning models, such as pseudo-colorization, replication, and colorization. The most common method is replication, where the one-channel grayscale image is repeated in the three-channel image. While this technique is simple, it does not provide new information and can lead to poor performance due to redundant image features fed into the DL model. This study proposes a novel image pre-processing method for grayscale medical images that utilize Histogram Equalization (HE) and Contrast Limited Adaptive Histogram Equalization (CLAHE) to create a three-channel image representation that provides different information on each channel. The effectiveness of this method is evaluated using six other pre-trained models, including InceptionV3, MobileNet, ResNet50, VGG16, ViT-B16, and ViT-B32. The results show that the proposed image representation significantly improves the classification performance of the models, with the InceptionV3 model achieving an accuracy of 99.60% and a recall (also referred as sensitivity) of 99.59%. The proposed method addresses the limitation of using grayscale medical images for COVID-19 detection and can potentially improve the early detection and control of the disease. Additionally, the proposed method can be applied to other medical imaging tasks with a grayscale image input, thus making it a generalizable solution. Full article
Show Figures

Figure 1

10 pages, 1754 KiB  
Article
“What Can ChatGPT Do?” Analyzing Early Reactions to the Innovative AI Chatbot on Twitter
by Viriya Taecharungroj
Big Data Cogn. Comput. 2023, 7(1), 35; https://doi.org/10.3390/bdcc7010035 - 16 Feb 2023
Cited by 126 | Viewed by 30165
Abstract
In this study, the author collected tweets about ChatGPT, an innovative AI chatbot, in the first month after its launch. A total of 233,914 English tweets were analyzed using the latent Dirichlet allocation (LDA) topic modeling algorithm to answer the question “what can [...] Read more.
In this study, the author collected tweets about ChatGPT, an innovative AI chatbot, in the first month after its launch. A total of 233,914 English tweets were analyzed using the latent Dirichlet allocation (LDA) topic modeling algorithm to answer the question “what can ChatGPT do?”. The results revealed three general topics: news, technology, and reactions. The author also identified five functional domains: creative writing, essay writing, prompt writing, code writing, and answering questions. The analysis also found that ChatGPT has the potential to impact technologies and humans in both positive and negative ways. In conclusion, the author outlines four key issues that need to be addressed as a result of this AI advancement: the evolution of jobs, a new technological landscape, the quest for artificial general intelligence, and the progress-ethics conundrum. Full article
(This article belongs to the Special Issue Artificial Intelligence and Natural Language Processing)
Show Figures

Figure 1

22 pages, 1122 KiB  
Article
Refining Preference-Based Recommendation with Associative Rules and Process Mining Using Correlation Distance
by Mohd Anuaruddin Bin Ahmadon, Shingo Yamaguchi, Abd Kadir Mahamad and Sharifah Saon
Big Data Cogn. Comput. 2023, 7(1), 34; https://doi.org/10.3390/bdcc7010034 - 10 Feb 2023
Cited by 2 | Viewed by 1821
Abstract
Online services, ambient services, and recommendation systems take user preferences into data processing so that the services can be tailored to the customer’s preferences. Associative rules have been used to capture combinations of frequently preferred items. However, for some item sets X and [...] Read more.
Online services, ambient services, and recommendation systems take user preferences into data processing so that the services can be tailored to the customer’s preferences. Associative rules have been used to capture combinations of frequently preferred items. However, for some item sets X and Y, only the frequency of occurrences is taken into consideration, and most of the rules have weak correlations between item sets. In this paper, we proposed a method to extract associative rules with a high correlation between multivariate attributes based on intuitive preference settings, process mining, and correlation distance. The main contribution of this paper is the intuitive preference that is optimized to extract newly discovered preferences, i.e., implicit preferences. As a result, the rules output from the methods has around 70% of improvement in correlation value even if customers do not specify their preference at all. Full article
(This article belongs to the Special Issue Semantic Web Technology and Recommender Systems)
Show Figures

Figure 1

22 pages, 31579 KiB  
Article
The Art of the Masses: Overviews on the Collective Visual Heritage through Convolutional Neural Networks
by Pilar Rosado-Rodrigo and Ferran Reverter
Big Data Cogn. Comput. 2023, 7(1), 33; https://doi.org/10.3390/bdcc7010033 - 10 Feb 2023
Viewed by 1720
Abstract
In the context of a society saturated in images, convolutional neural networks (CNNs), pre-trained using from the visual information contained in many thousands of images, constitute a tool that is of great use in helping us to organize the visual heritage, thus offering [...] Read more.
In the context of a society saturated in images, convolutional neural networks (CNNs), pre-trained using from the visual information contained in many thousands of images, constitute a tool that is of great use in helping us to organize the visual heritage, thus offering a route of entry that would otherwise be impossible. One of the responsibilities of the contemporary artist is to adopt a position that will help to provide sense, to project meaning onto the accumulation of images that we are faced with. The artificial neuronal network ResNet-50 has been used in order to extract the visual characteristics of large sets of images from the internet. Textual searches have been carried out on social issues such as climate change, the COVID-19 pandemic, demonstrations around the world, and manifestations of popular culture, and the image descriptors obtained have been the input for the algorithm t-SNE. In this way, we produce large visual maps composed of thousands of images and arranged following the criteria of formal similitude, displaying the visual patterns of the archetypes of specific semantic categories. The method of filing and recovering our collective memory must have a correlation with the technological and scientific advances of our time, in order for us to progressively discover new horizons of knowledge. Full article
Show Figures

Figure 1

18 pages, 661 KiB  
Review
Prediction of Preeclampsia Using Machine Learning and Deep Learning Models: A Review
by Sumayh S. Aljameel, Manar Alzahrani, Reem Almusharraf, Majd Altukhais, Sadeem Alshaia, Hanan Sahlouli, Nida Aslam, Irfan Ullah Khan, Dina A. Alabbad and Albandari Alsumayt
Big Data Cogn. Comput. 2023, 7(1), 32; https://doi.org/10.3390/bdcc7010032 - 09 Feb 2023
Cited by 8 | Viewed by 5596
Abstract
Preeclampsia is one of the illnesses associated with placental dysfunction and pregnancy-induced hypertension, which appears after the first 20 weeks of pregnancy and is marked by proteinuria and hypertension. It can affect pregnant women and limit fetal growth, resulting in low birth weights, [...] Read more.
Preeclampsia is one of the illnesses associated with placental dysfunction and pregnancy-induced hypertension, which appears after the first 20 weeks of pregnancy and is marked by proteinuria and hypertension. It can affect pregnant women and limit fetal growth, resulting in low birth weights, a risk factor for neonatal mortality. Approximately 10% of pregnancies worldwide are affected by hypertensive disorders during pregnancy. In this review, we discuss the machine learning and deep learning methods for preeclampsia prediction that were published between 2018 and 2022. Many models have been created using a variety of data types, including demographic and clinical data. We determined the techniques that successfully predicted preeclampsia. The methods that were used the most are random forest, support vector machine, and artificial neural network (ANN). In addition, the prospects and challenges in preeclampsia prediction are discussed to boost the research on artificial intelligence systems, allowing academics and practitioners to improve their methods and advance automated prediction. Full article
Show Figures

Figure 1

18 pages, 744 KiB  
Article
An Improved Link Prediction Approach for Directed Complex Networks Using Stochastic Block Modeling
by Lekshmi S. Nair, Swaminathan Jayaraman and Sai Pavan Krishna Nagam
Big Data Cogn. Comput. 2023, 7(1), 31; https://doi.org/10.3390/bdcc7010031 - 09 Feb 2023
Cited by 4 | Viewed by 2997
Abstract
Link prediction finds the future or the missing links in a social–biological complex network such as a friendship network, citation network, or protein network. Current methods to link prediction follow the network properties, such as the node’s centrality, the number of edges, or [...] Read more.
Link prediction finds the future or the missing links in a social–biological complex network such as a friendship network, citation network, or protein network. Current methods to link prediction follow the network properties, such as the node’s centrality, the number of edges, or the weights of the edges, among many others. As the properties of the networks vary, the link prediction methods also vary. These methods are inaccurate since they exploit limited information. This work presents a link prediction method based on the stochastic block model. The novelty of our approach is the three-step process to find the most-influential nodes using the m-PageRank metric, forming blocks using the global clustering coefficient and, finally, predicting the most-optimized links using maximum likelihood estimation. Through the experimental analysis of social, ecological, and biological datasets, we proved that the proposed model outperforms the existing state-of-the-art approaches to link prediction. Full article
(This article belongs to the Topic Social Computing and Social Network Analysis)
Show Figures

Figure 1

17 pages, 343 KiB  
Article
A Reasonable Effectiveness of Features in Modeling Visual Perception of User Interfaces
by Maxim Bakaev, Sebastian Heil and Martin Gaedke
Big Data Cogn. Comput. 2023, 7(1), 30; https://doi.org/10.3390/bdcc7010030 - 08 Feb 2023
Viewed by 1508
Abstract
Training data for user behavior models that predict subjective dimensions of visual perception are often too scarce for deep learning methods to be applicable. With the typical datasets in HCI limited to thousands or even hundreds of records, feature-based approaches are still widely [...] Read more.
Training data for user behavior models that predict subjective dimensions of visual perception are often too scarce for deep learning methods to be applicable. With the typical datasets in HCI limited to thousands or even hundreds of records, feature-based approaches are still widely used in visual analysis of graphical user interfaces (UIs). In our paper, we benchmarked the predictive accuracy of the two types of neural network (NN) models, and explored the effects of the number of features, and the dataset volume. To this end, we used two datasets that comprised over 4000 webpage screenshots, assessed by 233 subjects per the subjective dimensions of Complexity, Aesthetics and Orderliness. With the experimental data, we constructed and trained 1908 models. The feature-based NNs demonstrated 16.2%-better mean squared error (MSE) than the convolutional NNs (a modified GoogLeNet architecture); however, the CNNs’ accuracy improved with the larger dataset volume, whereas the ANNs’ did not: therefore, provided that the effect of more data on the models’ error improvement is linear, the CNNs should become superior at dataset sizes over 3000 UIs. Unexpectedly, adding more features to the NN models caused the MSE to somehow increase by 1.23%: although the difference was not significant, this confirmed the importance of careful feature engineering. Full article
(This article belongs to the Topic Machine and Deep Learning)
Show Figures

Figure 1

18 pages, 3389 KiB  
Article
Detecting Multi-Density Urban Hotspots in a Smart City: Approaches, Challenges and Applications
by Eugenio Cesario, Paolo Lindia and Andrea Vinci
Big Data Cogn. Comput. 2023, 7(1), 29; https://doi.org/10.3390/bdcc7010029 - 08 Feb 2023
Cited by 4 | Viewed by 2067
Abstract
Leveraged by a large-scale diffusion of sensing networks and scanning devices in modern cities, huge volumes of geo-referenced urban data are collected every day. Such an amount of information is analyzed to discover data-driven models, which can be exploited to tackle the major [...] Read more.
Leveraged by a large-scale diffusion of sensing networks and scanning devices in modern cities, huge volumes of geo-referenced urban data are collected every day. Such an amount of information is analyzed to discover data-driven models, which can be exploited to tackle the major issues that cities face, including air pollution, virus diffusion, human mobility, crime forecasting, traffic flows, etc. In particular, the detection of city hotspots is de facto a valuable organization technique for framing detailed knowledge of a metropolitan area, providing high-level summaries for spatial datasets, which are a valuable support for planners, scientists, and policymakers. However, while classic density-based clustering algorithms show to be suitable for discovering hotspots characterized by homogeneous density, their application on multi-density data can produce inaccurate results. In fact, a proper threshold setting is very difficult when clusters in different regions have considerably different densities, or clusters with different density levels are nested. For such a reason, since metropolitan cities are heavily characterized by variable densities, multi-density clustering seems to be more appropriate for discovering city hotspots. Indeed, such algorithms rely on multiple minimum threshold values and are able to detect multiple pattern distributions of different densities, aiming at distinguishing between several density regions, which may or may not be nested and are generally of a non-convex shape. This paper discusses the research issues and challenges for analyzing urban data, aimed at discovering multi-density hotspots in urban areas. In particular, the study compares the four approaches (DBSCAN, OPTICS-xi, HDBSCAN, and CHD) proposed in the literature for clustering urban data and analyzes their performance on both state-of-the-art and real-world datasets. Experimental results show that multi-density clustering algorithms generally achieve better results on urban data than classic density-based algorithms. Full article
Show Figures

Figure 1

12 pages, 3698 KiB  
Communication
Analyzing the Effect of COVID-19 on Education by Processing Users’ Sentiments
by Mohadese Jamalian, Hamed Vahdat-Nejad, Wathiq Mansoor, Abigail Copiaco and Hamideh Hajiabadi
Big Data Cogn. Comput. 2023, 7(1), 28; https://doi.org/10.3390/bdcc7010028 - 30 Jan 2023
Cited by 1 | Viewed by 1957
Abstract
COVID-19 infection has been a major topic of discussion on social media platforms since its pandemic outbreak in the year 2020. From daily activities to direct health consequences, COVID-19 has undeniably affected lives significantly. In this paper, we especially analyze the effect of [...] Read more.
COVID-19 infection has been a major topic of discussion on social media platforms since its pandemic outbreak in the year 2020. From daily activities to direct health consequences, COVID-19 has undeniably affected lives significantly. In this paper, we especially analyze the effect of COVID-19 on education by examining social media statements made via Twitter. We first propose a lexicon related to education. Then, based on the proposed dictionary, we automatically extract the education-related tweets and also the educational parameters of learning and assessment. Afterwards, by analyzing the content of the tweets, we determine the location of each tweet. Then the sentiments of the tweets are analyzed and examined to extract the frequency trends of positive and negative tweets for the whole world, and especially for countries with a significant share of COVID-19 cases. According to the analysis of the trends, individuals were globally concerned about education after the COVID-19 outbreak. By comparing between the years 2020 and 2021, we discovered that due to the sudden shift from traditional to electronic education, people were significantly more concerned about education within the first year of the pandemic. However, these concerns decreased in 2021. The proposed methodology was evaluated using quantitative performance metrics, such as the F1-score, precision, and recall. Full article
(This article belongs to the Topic Social Computing and Social Network Analysis)
Show Figures

Figure 1

18 pages, 4196 KiB  
Article
Context-Based Patterns in Machine Learning Bias and Fairness Metrics: A Sensitive Attributes-Based Approach
by Tiago P. Pagano, Rafael B. Loureiro, Fernanda V. N. Lisboa, Gustavo O. R. Cruz, Rodrigo M. Peixoto, Guilherme A. de Sousa Guimarães, Ewerton L. S. Oliveira, Ingrid Winkler and Erick G. Sperandio Nascimento
Big Data Cogn. Comput. 2023, 7(1), 27; https://doi.org/10.3390/bdcc7010027 - 30 Jan 2023
Cited by 5 | Viewed by 2564
Abstract
The majority of current approaches for bias and fairness identification or mitigation in machine learning models are applications for a particular issue that fails to account for the connection between the application context and its associated sensitive attributes, which contributes to the recognition [...] Read more.
The majority of current approaches for bias and fairness identification or mitigation in machine learning models are applications for a particular issue that fails to account for the connection between the application context and its associated sensitive attributes, which contributes to the recognition of consistent patterns in the application of bias and fairness metrics. This can be used to drive the development of future models, with the sensitive attribute acting as a connecting element to these metrics. Hence, this study aims to analyze patterns in several metrics for identifying bias and fairness, applying the gender-sensitive attribute as a case study, for three different areas of applications in machine learning models: computer vision, natural language processing, and recommendation systems. The gender attribute case study has been used in computer vision, natural language processing, and recommendation systems. The method entailed creating use cases for facial recognition in the FairFace dataset, message toxicity in the Jigsaw dataset, and movie recommendations in the MovieLens100K dataset, then developing models based on the VGG19, BERT, and Wide Deep architectures and evaluating them using the accuracy, precision, recall, and F1-score classification metrics, as well as assessing their outcomes using fourteen fairness metrics. Certain metrics disclosed bias and fairness, while others did not, revealing a consistent pattern for the same sensitive attribute across different application domains, and similarities for the statistical parity, PPR disparity, and error disparity metrics across domains, indicating fairness related to the studied sensitive attribute. Some attributes, on the other hand, did not follow this pattern. As a result, we conclude that the sensitive attribute may play a crucial role in defining the fairness metrics for a specific context. Full article
Show Figures

Figure 1

Previous Issue
Next Issue
Back to TopTop