
Real-Time Attention Monitoring System for Classroom: A Deep Learning Approach for Student’s Behavior Recognition
 ,
,  , and
, and
Abstract
:1. Introduction
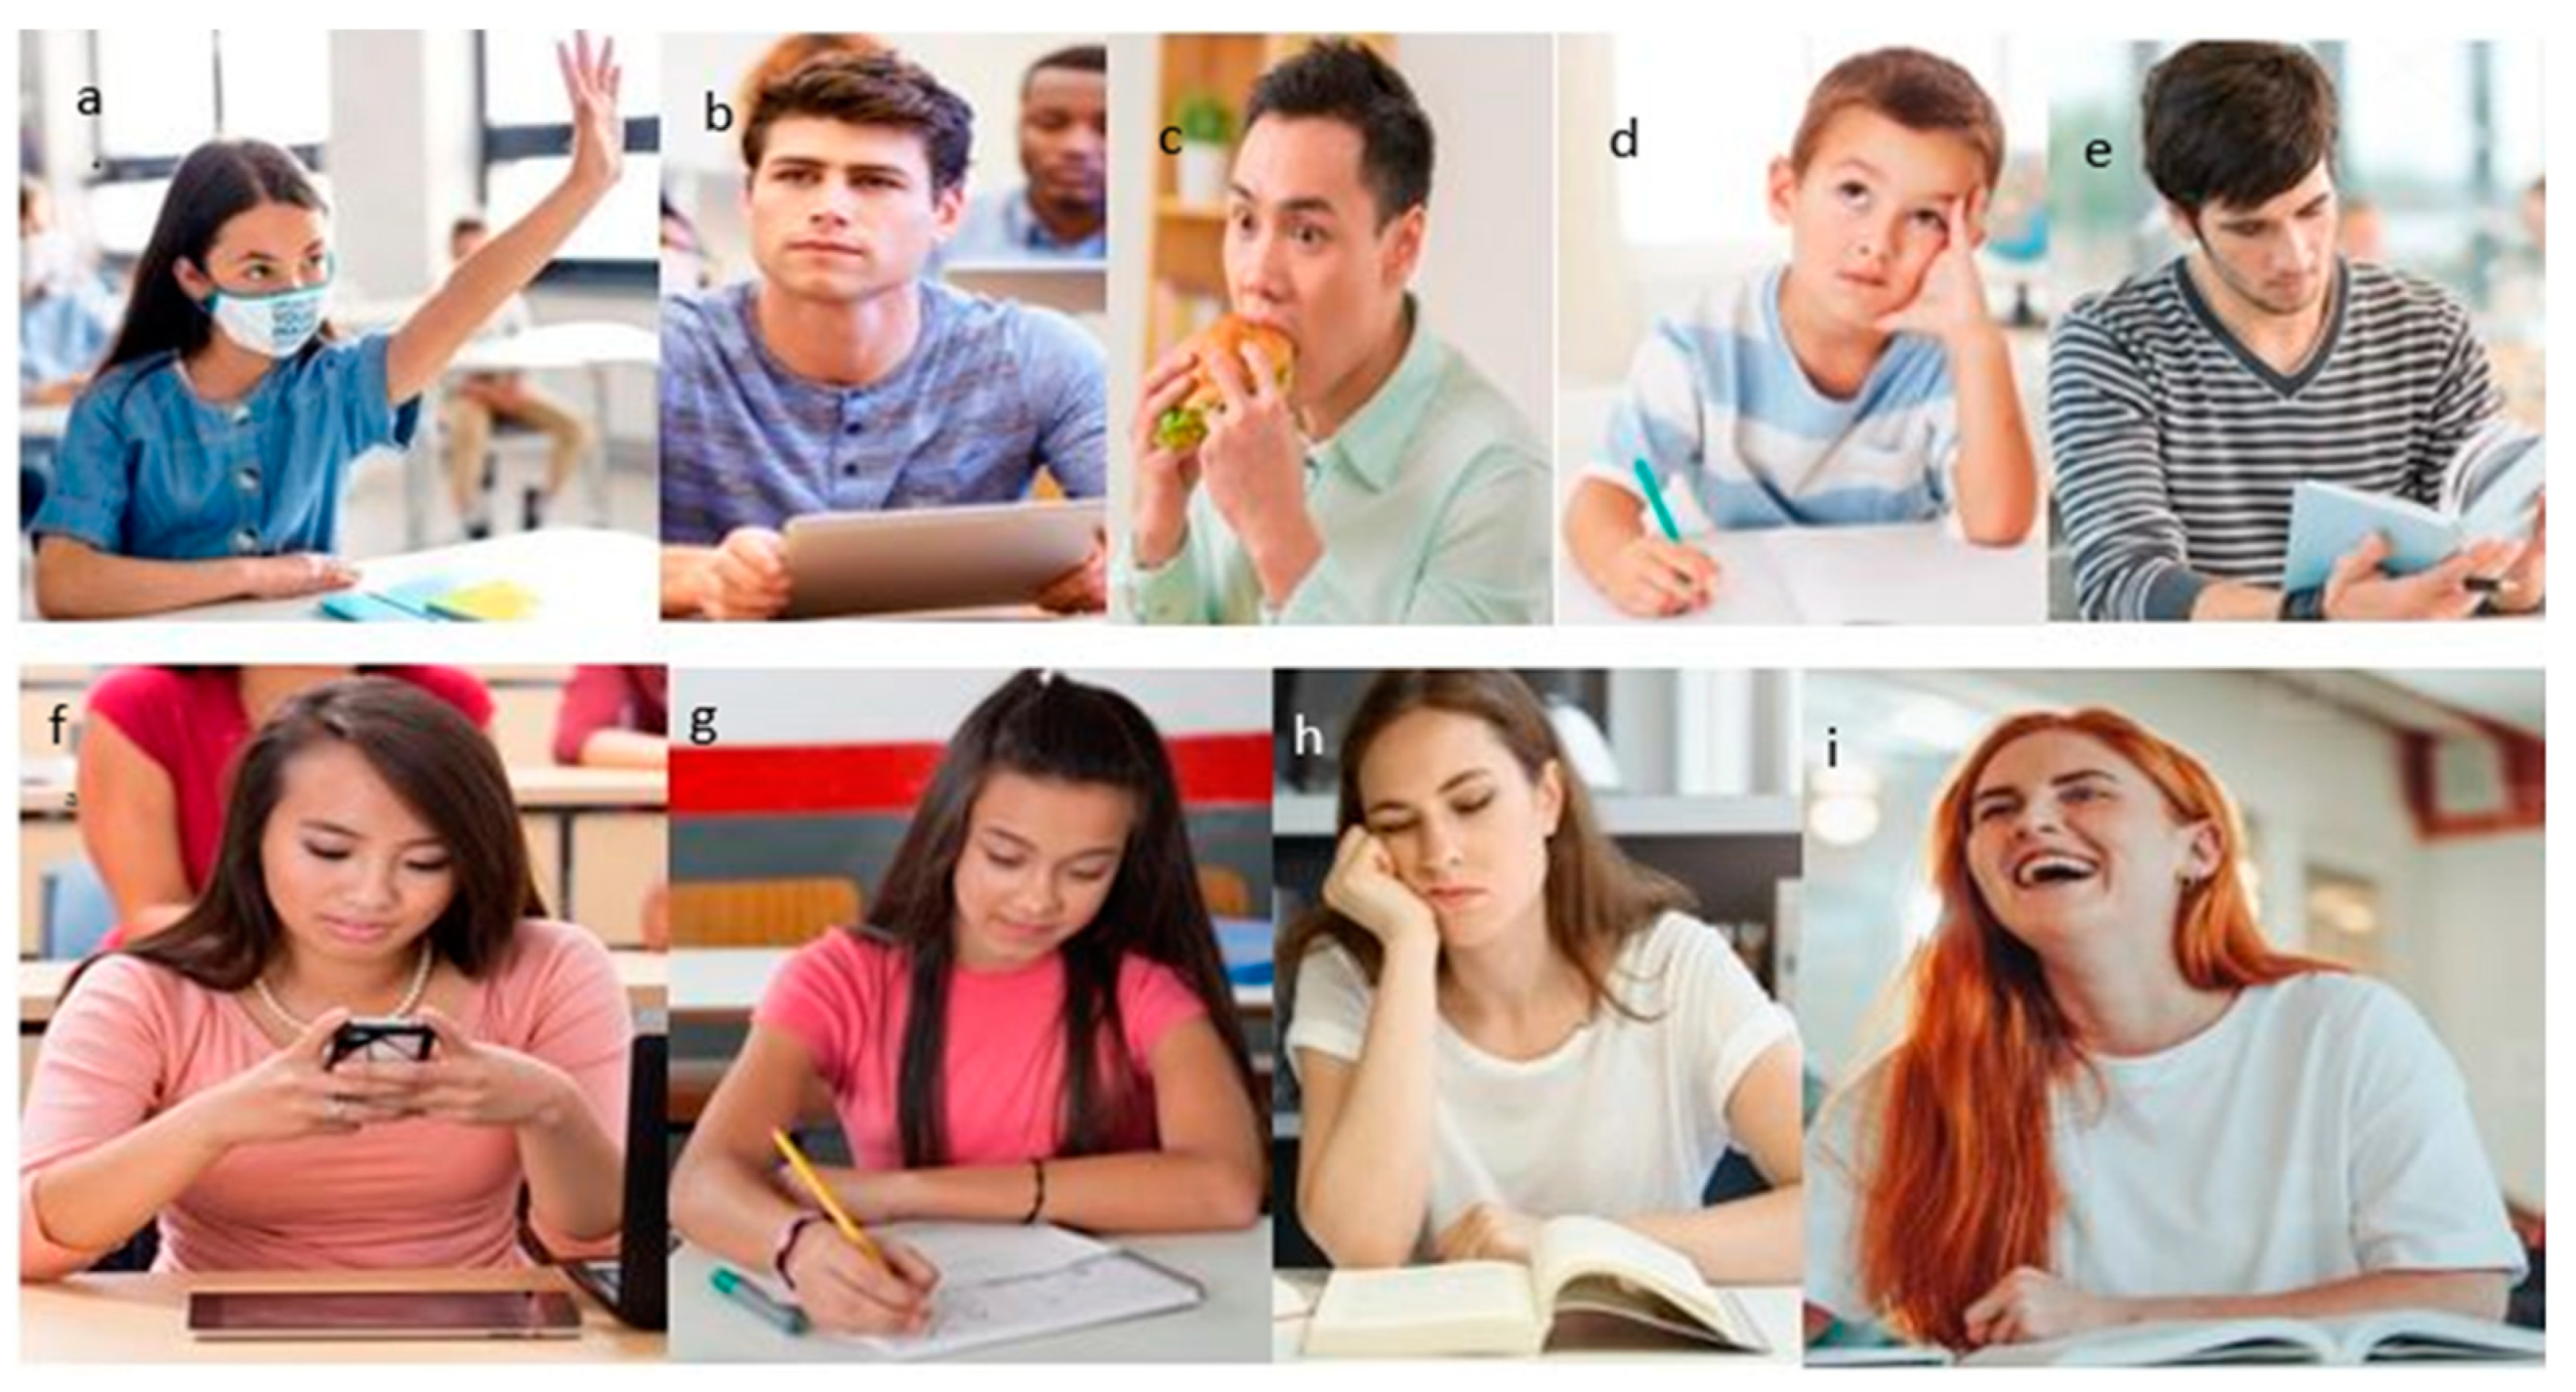
- A labeled image dataset of student actions and behaviors in a classroom has been built.
- The performance of the proposed dataset has been examined using different versions of YOLOv5.
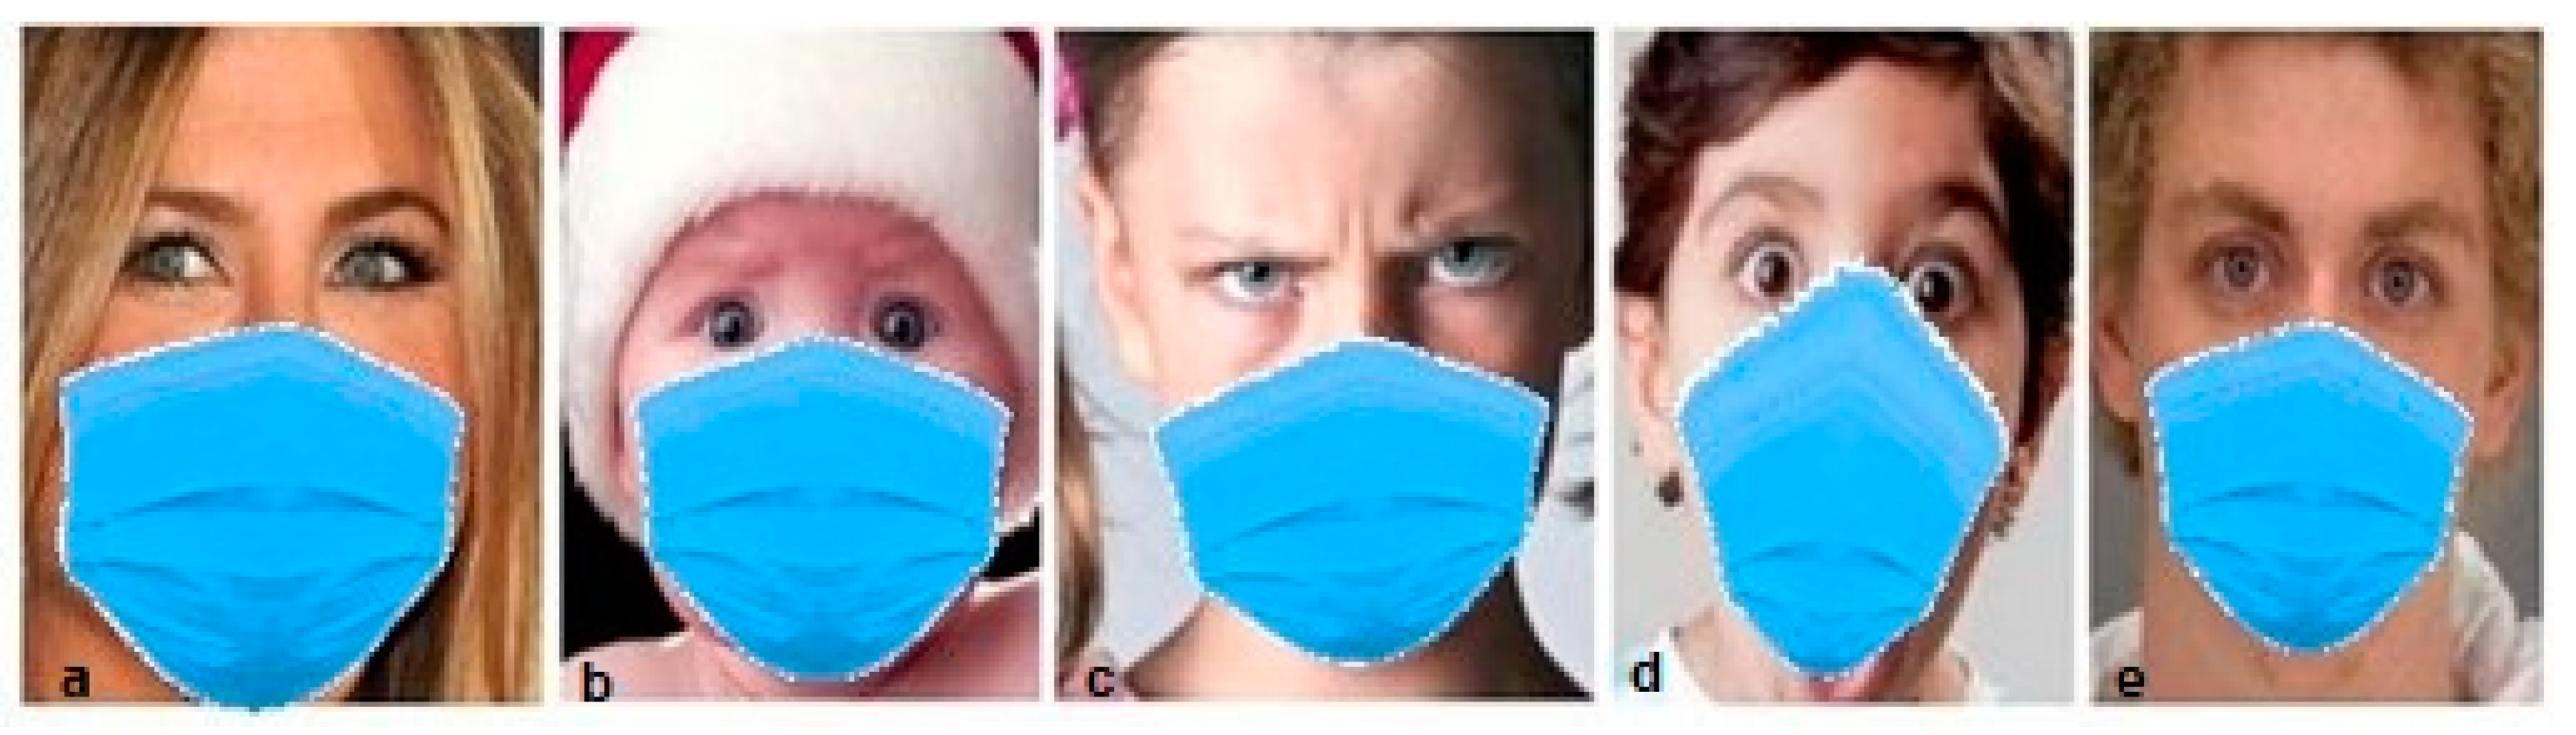
- A low-cost, user-friendly, and efficient attention assessment system for behavior recognition has been developed, which can detect emotions (with and without face masks).
- The methods for applying the system in a classroom, as well as the limitations and recommendations based on the experimental results, will be discussed.
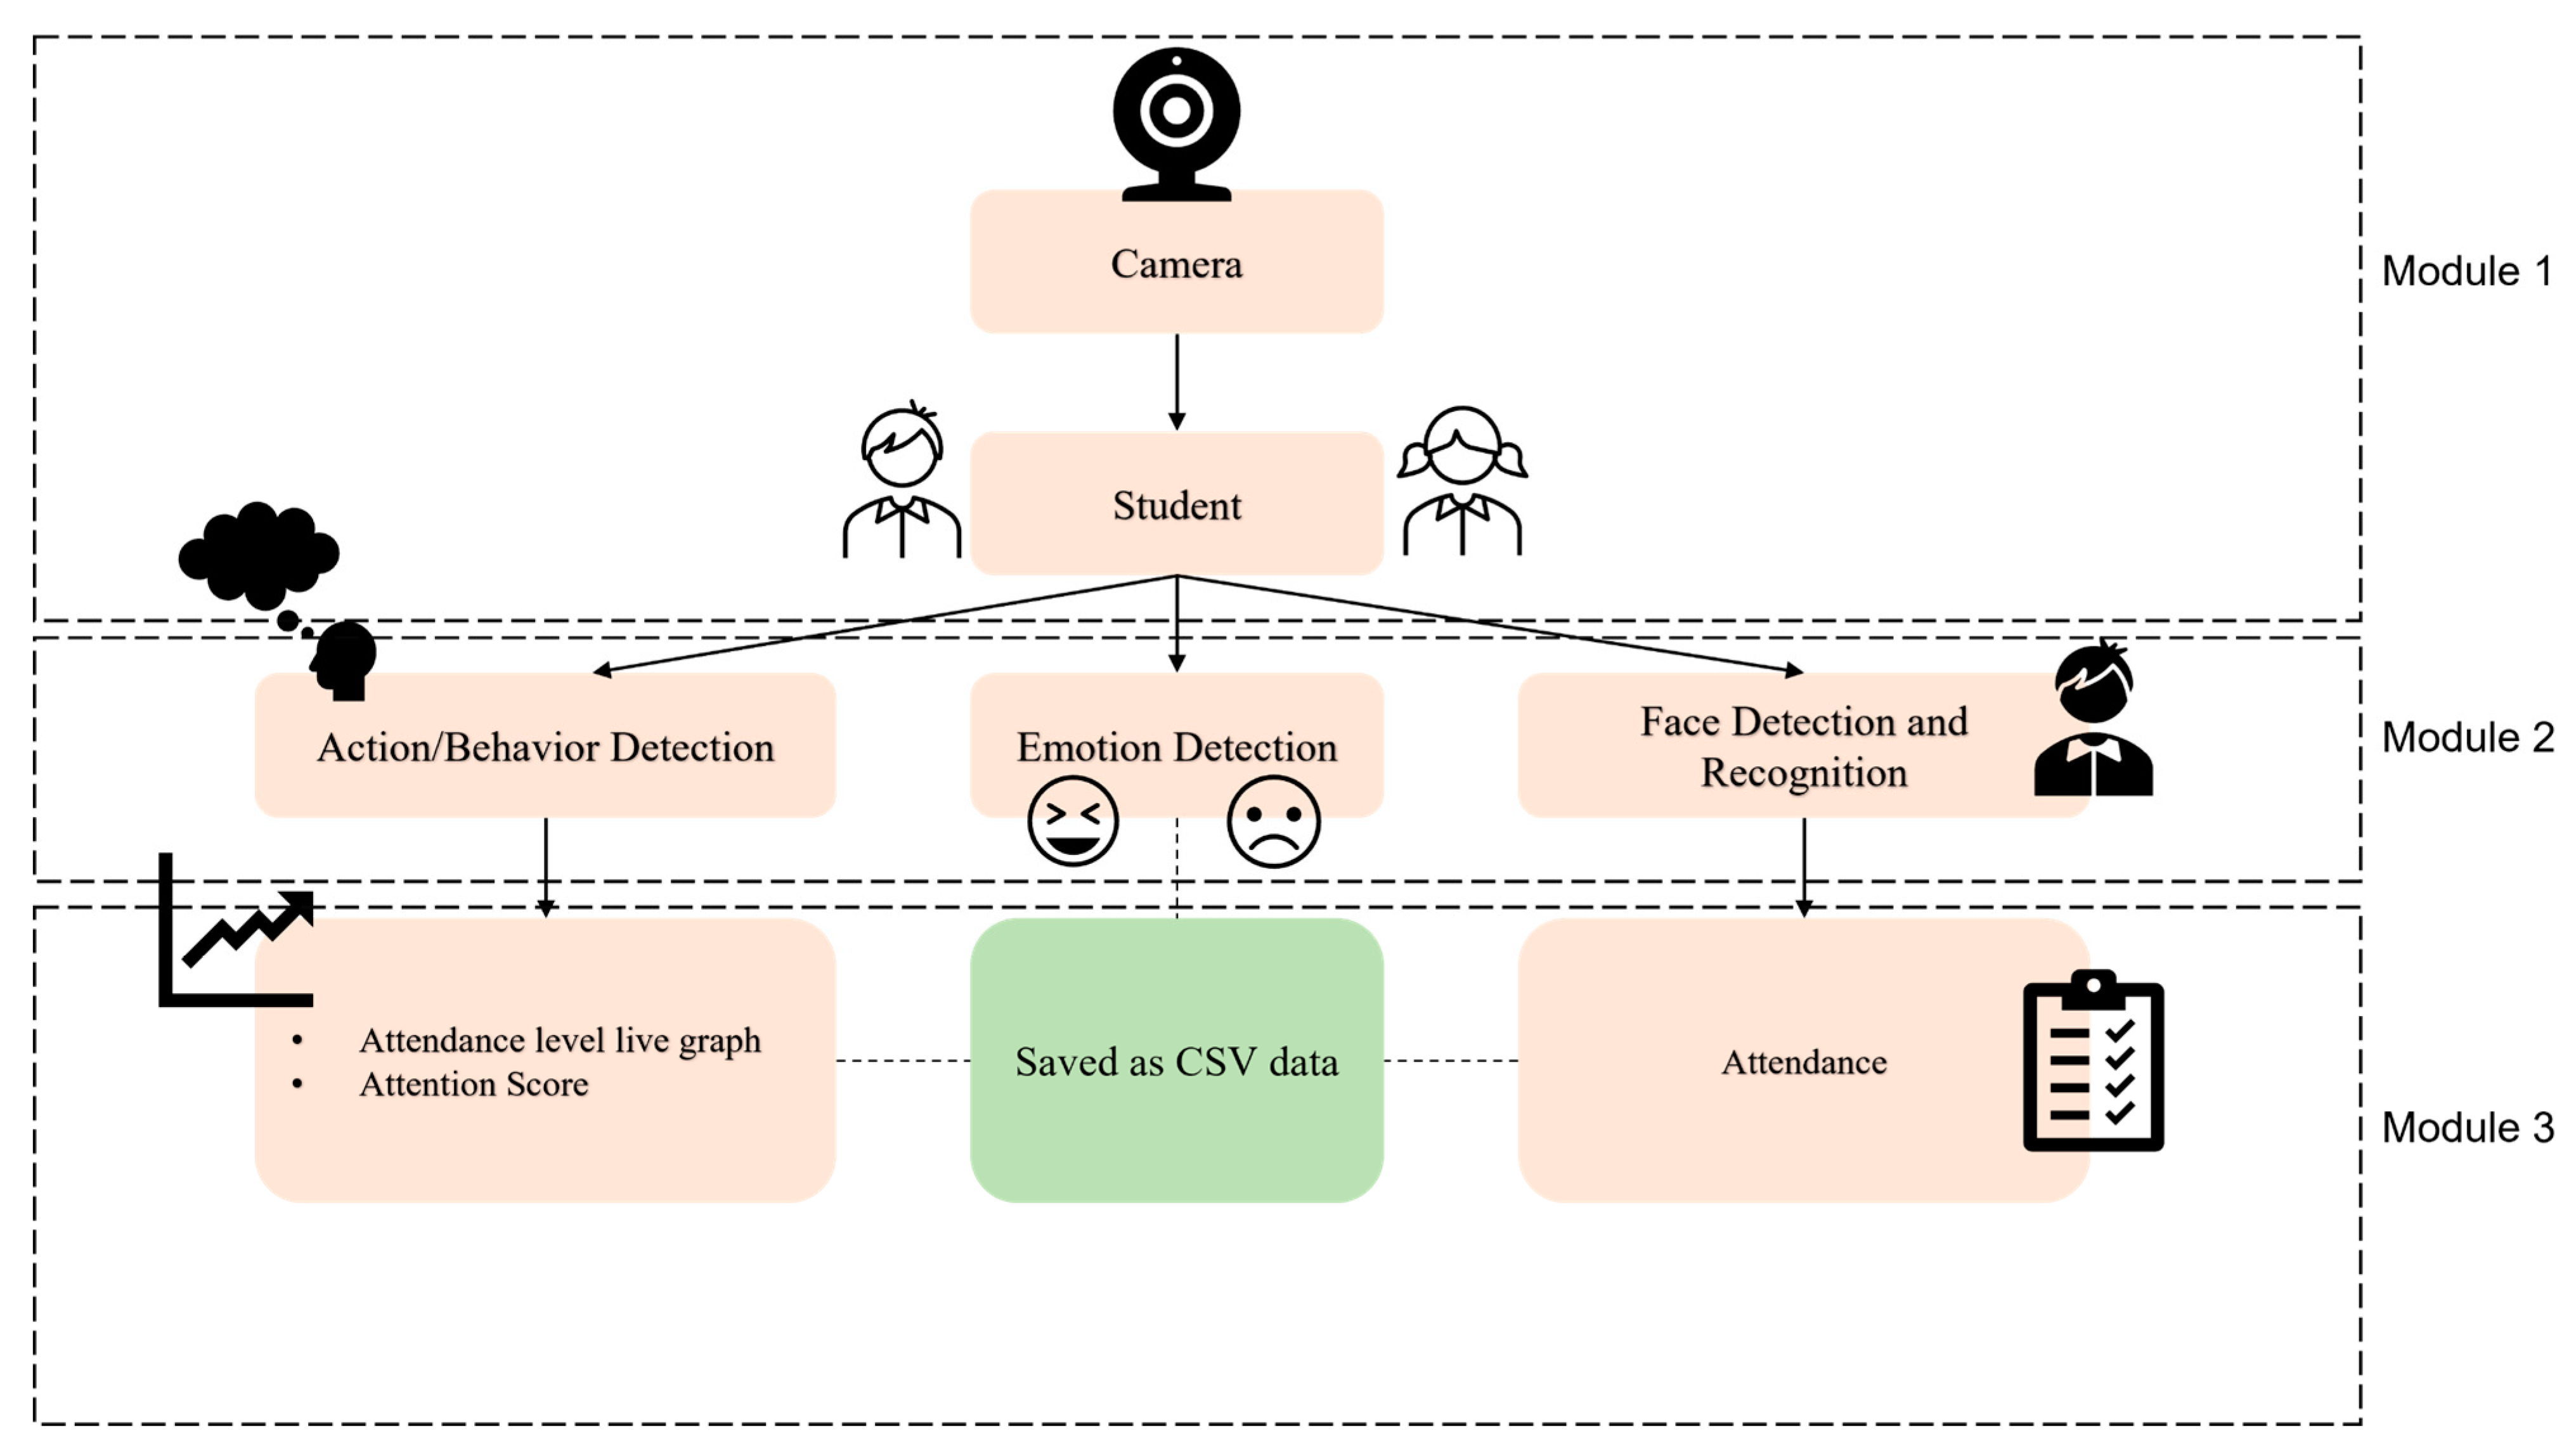
2. Methodology
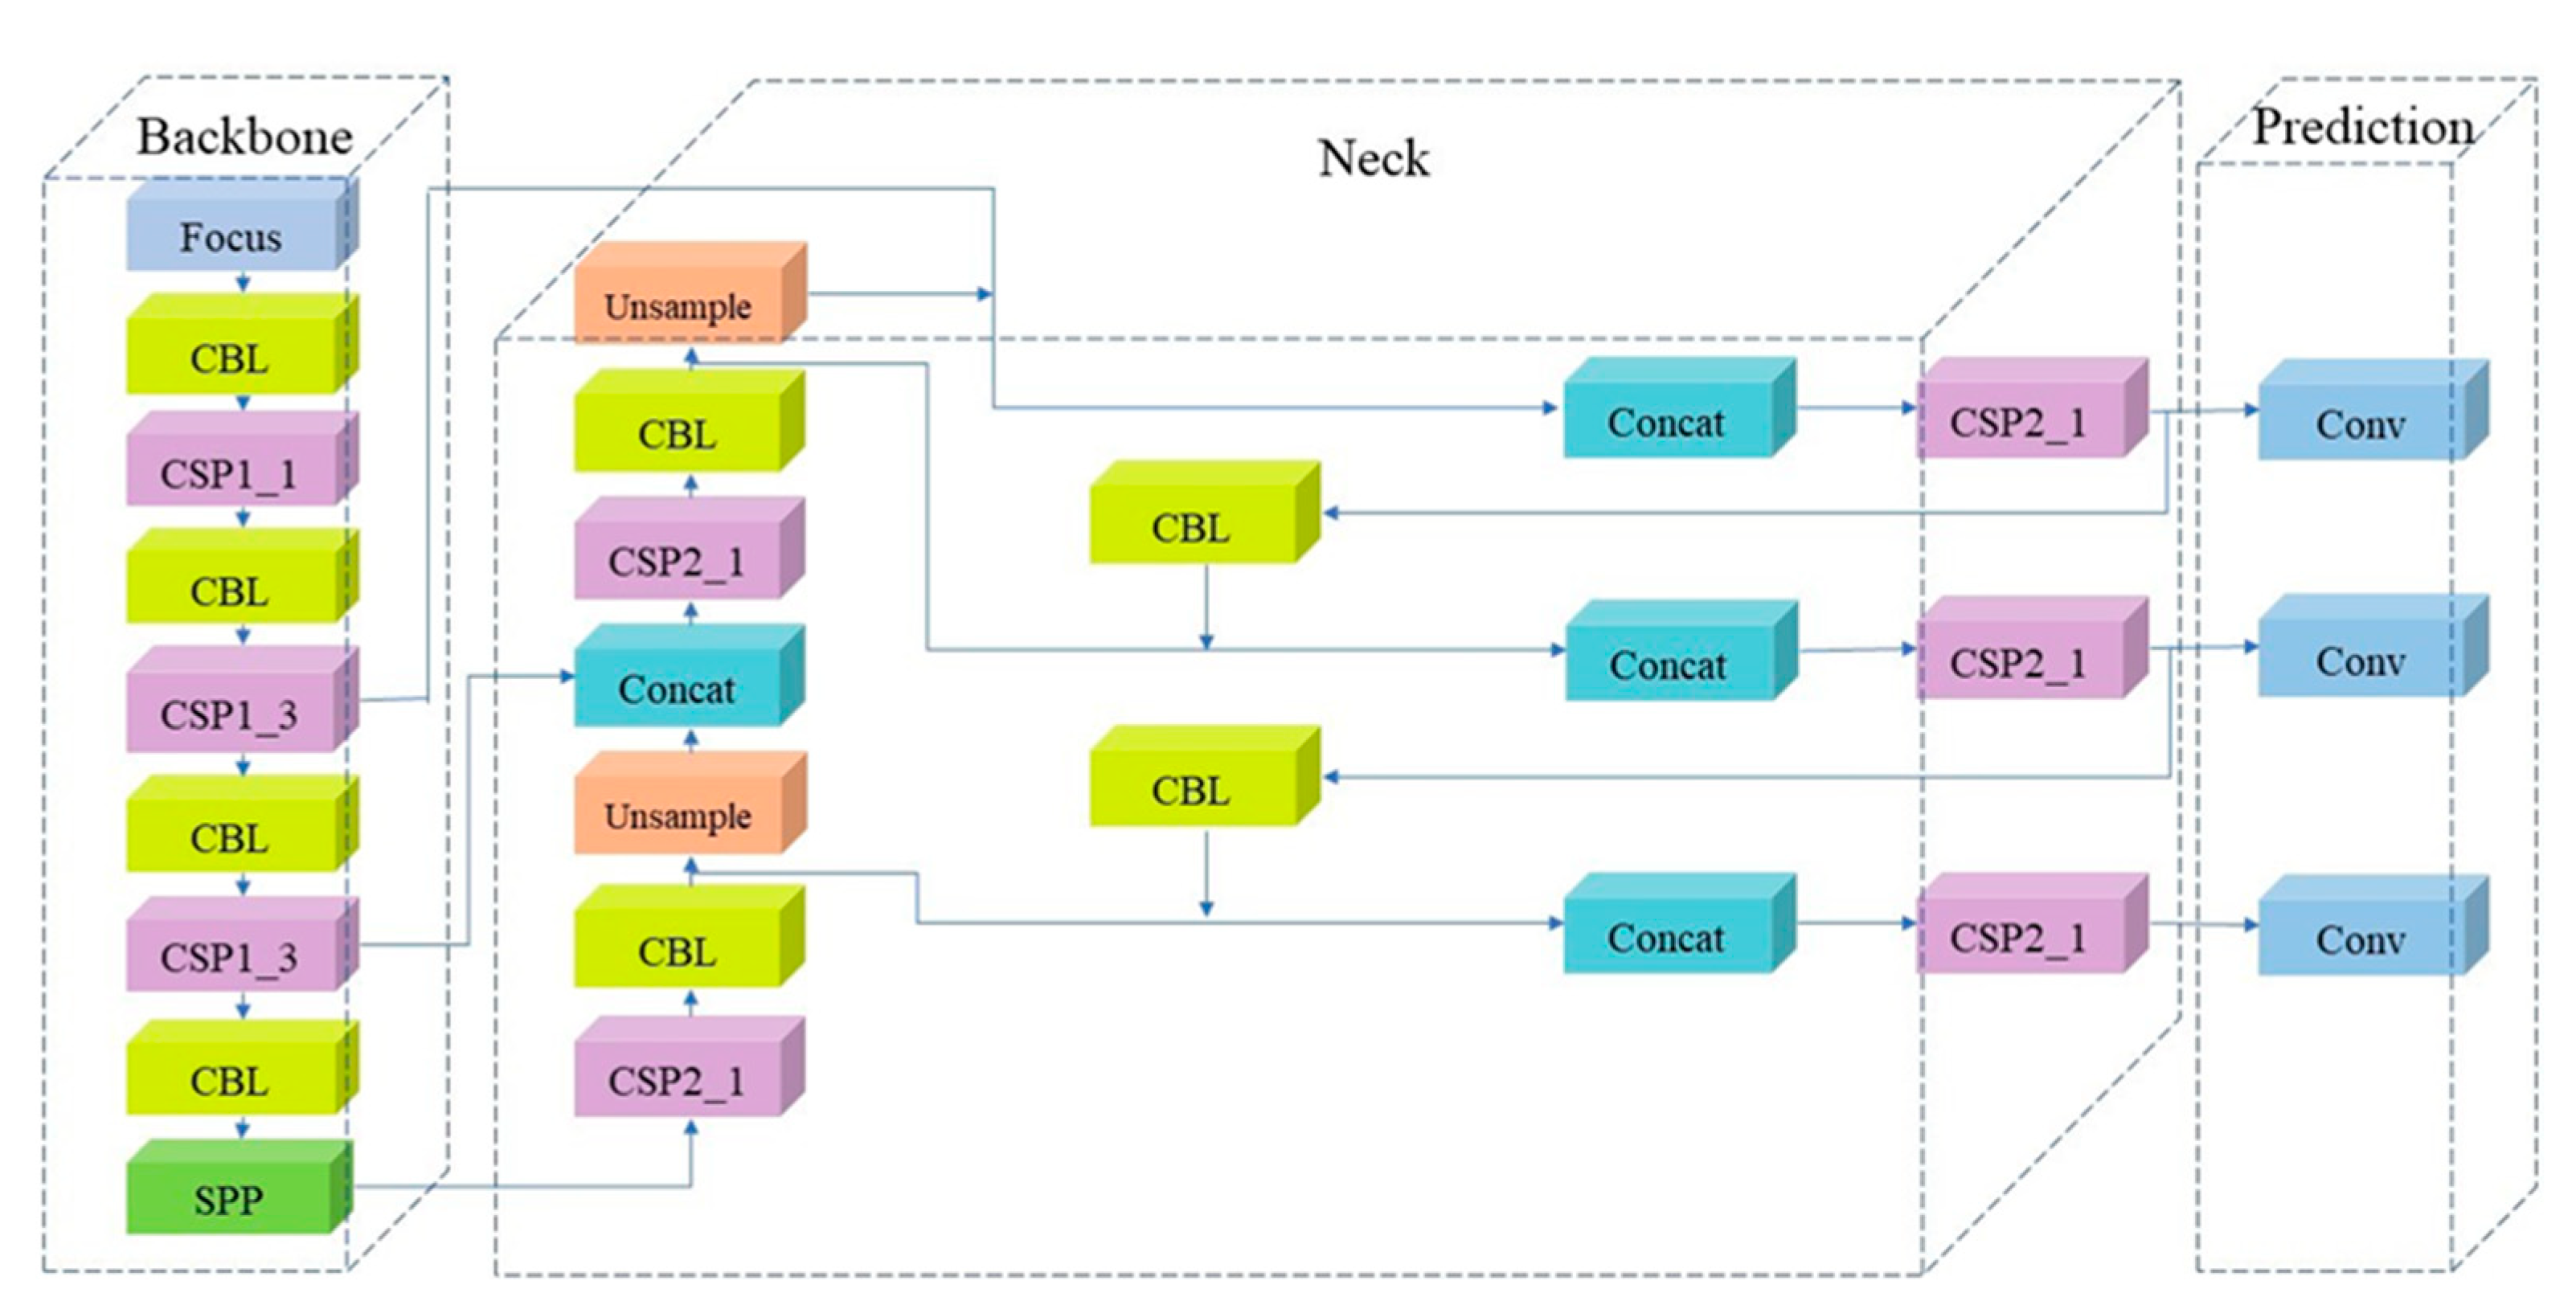
2.1. YOLOv5 Model
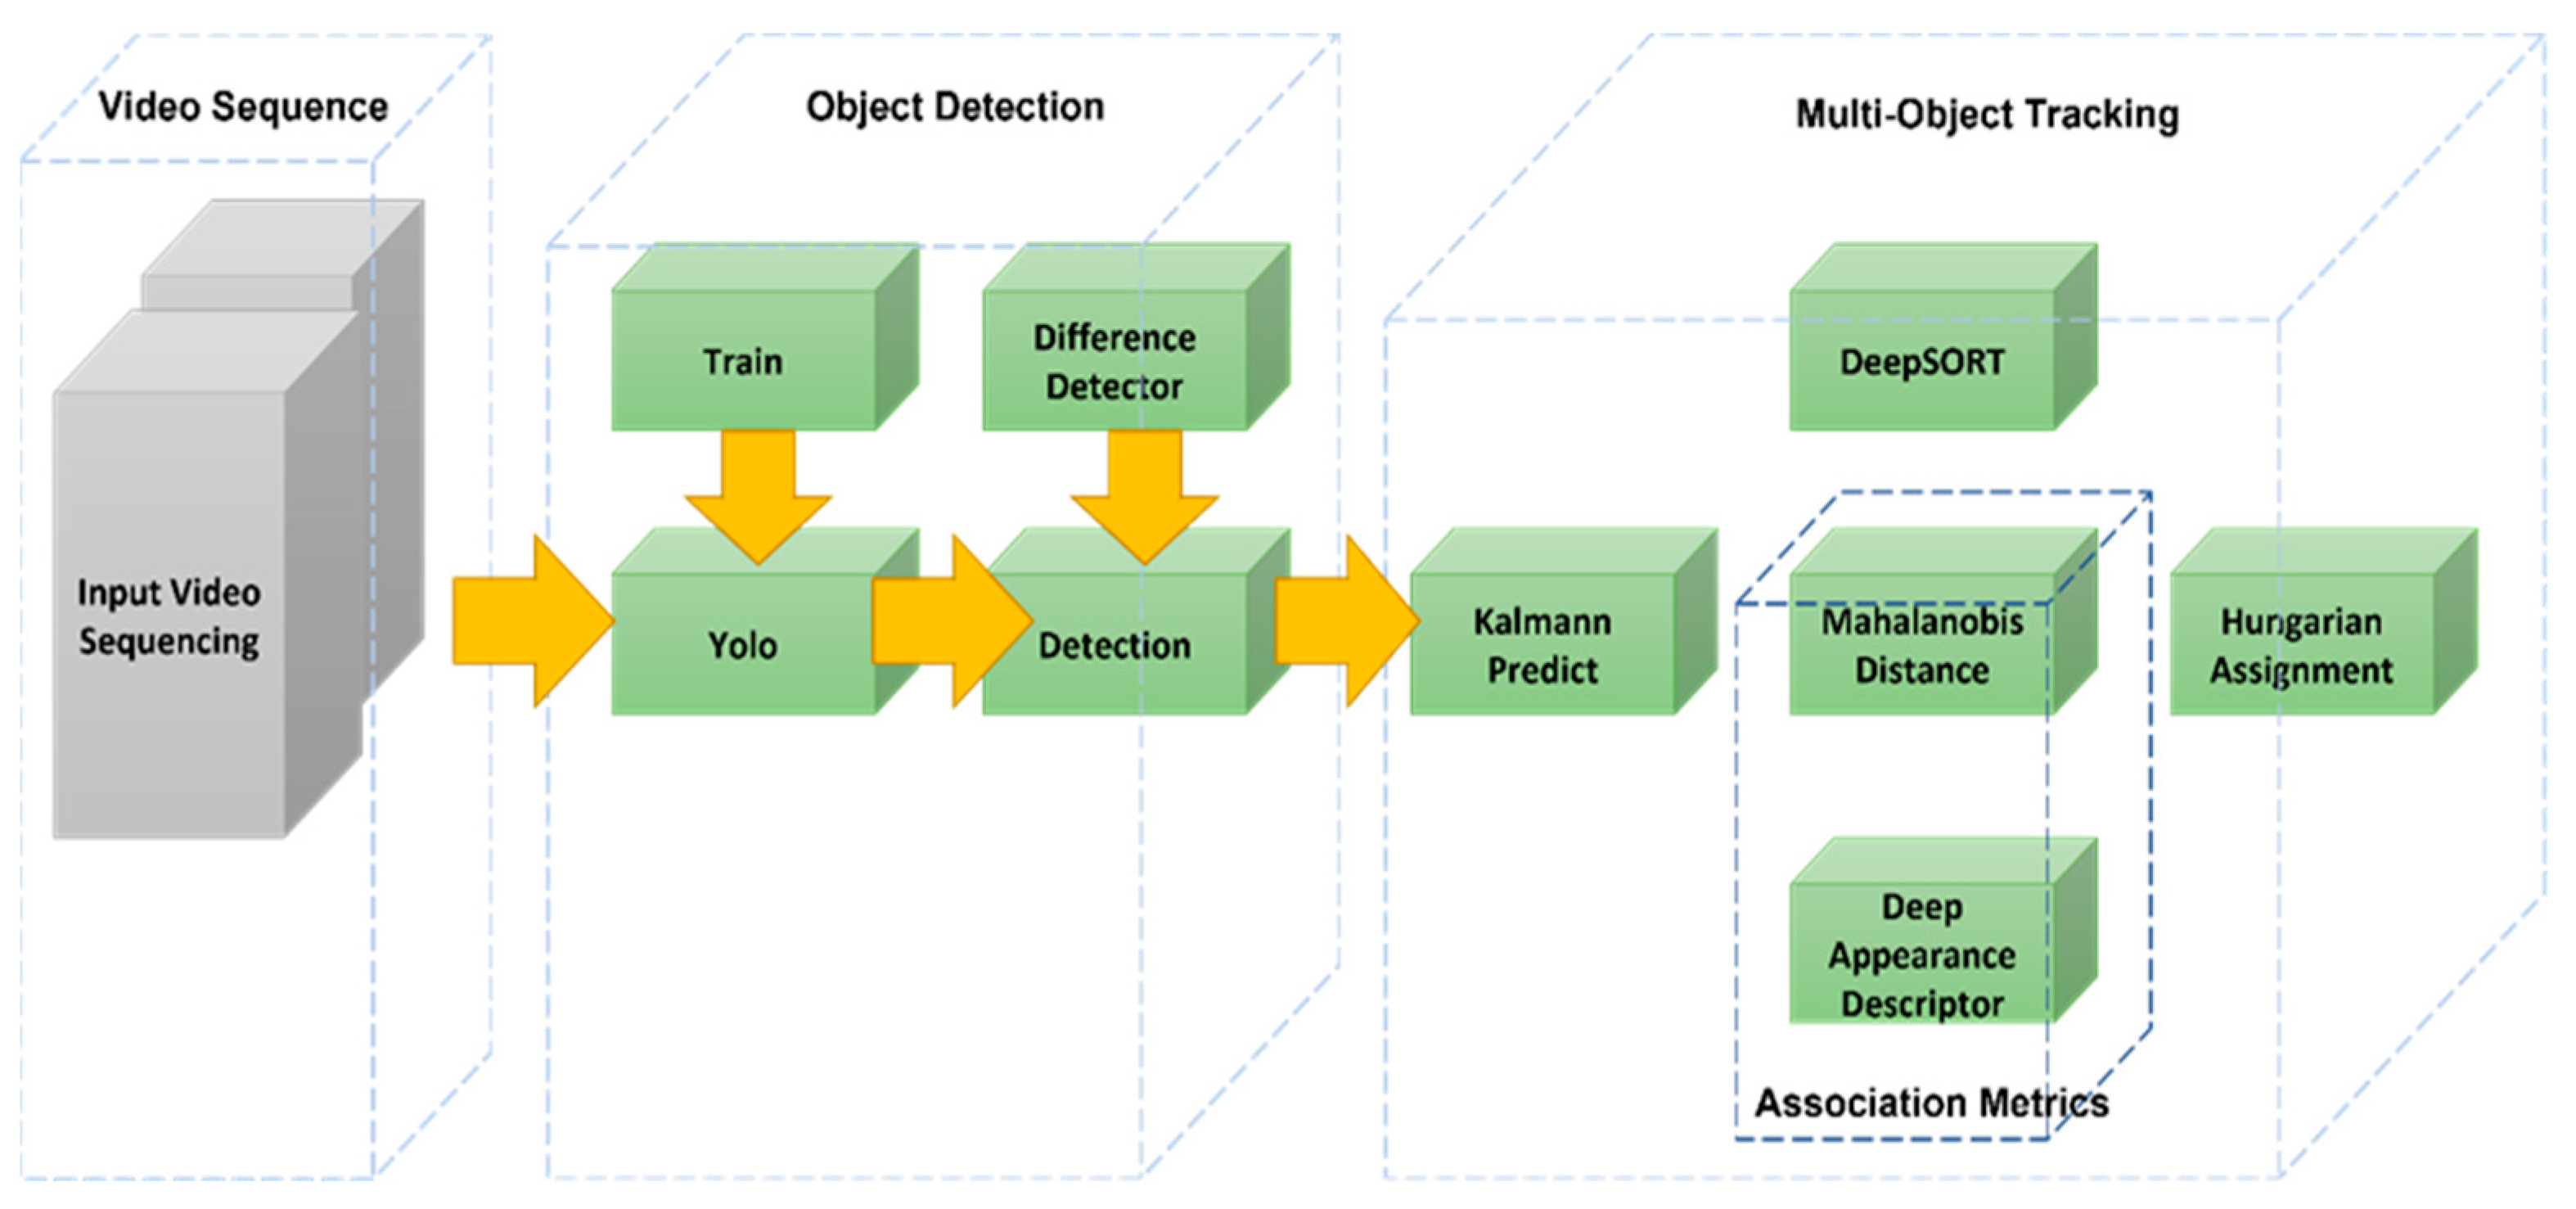
2.2. DeepSORT Algorithm
2.3. Attendance Monitoring Algorithms
2.4. Data Preparation
2.4.1. The Action Dataset
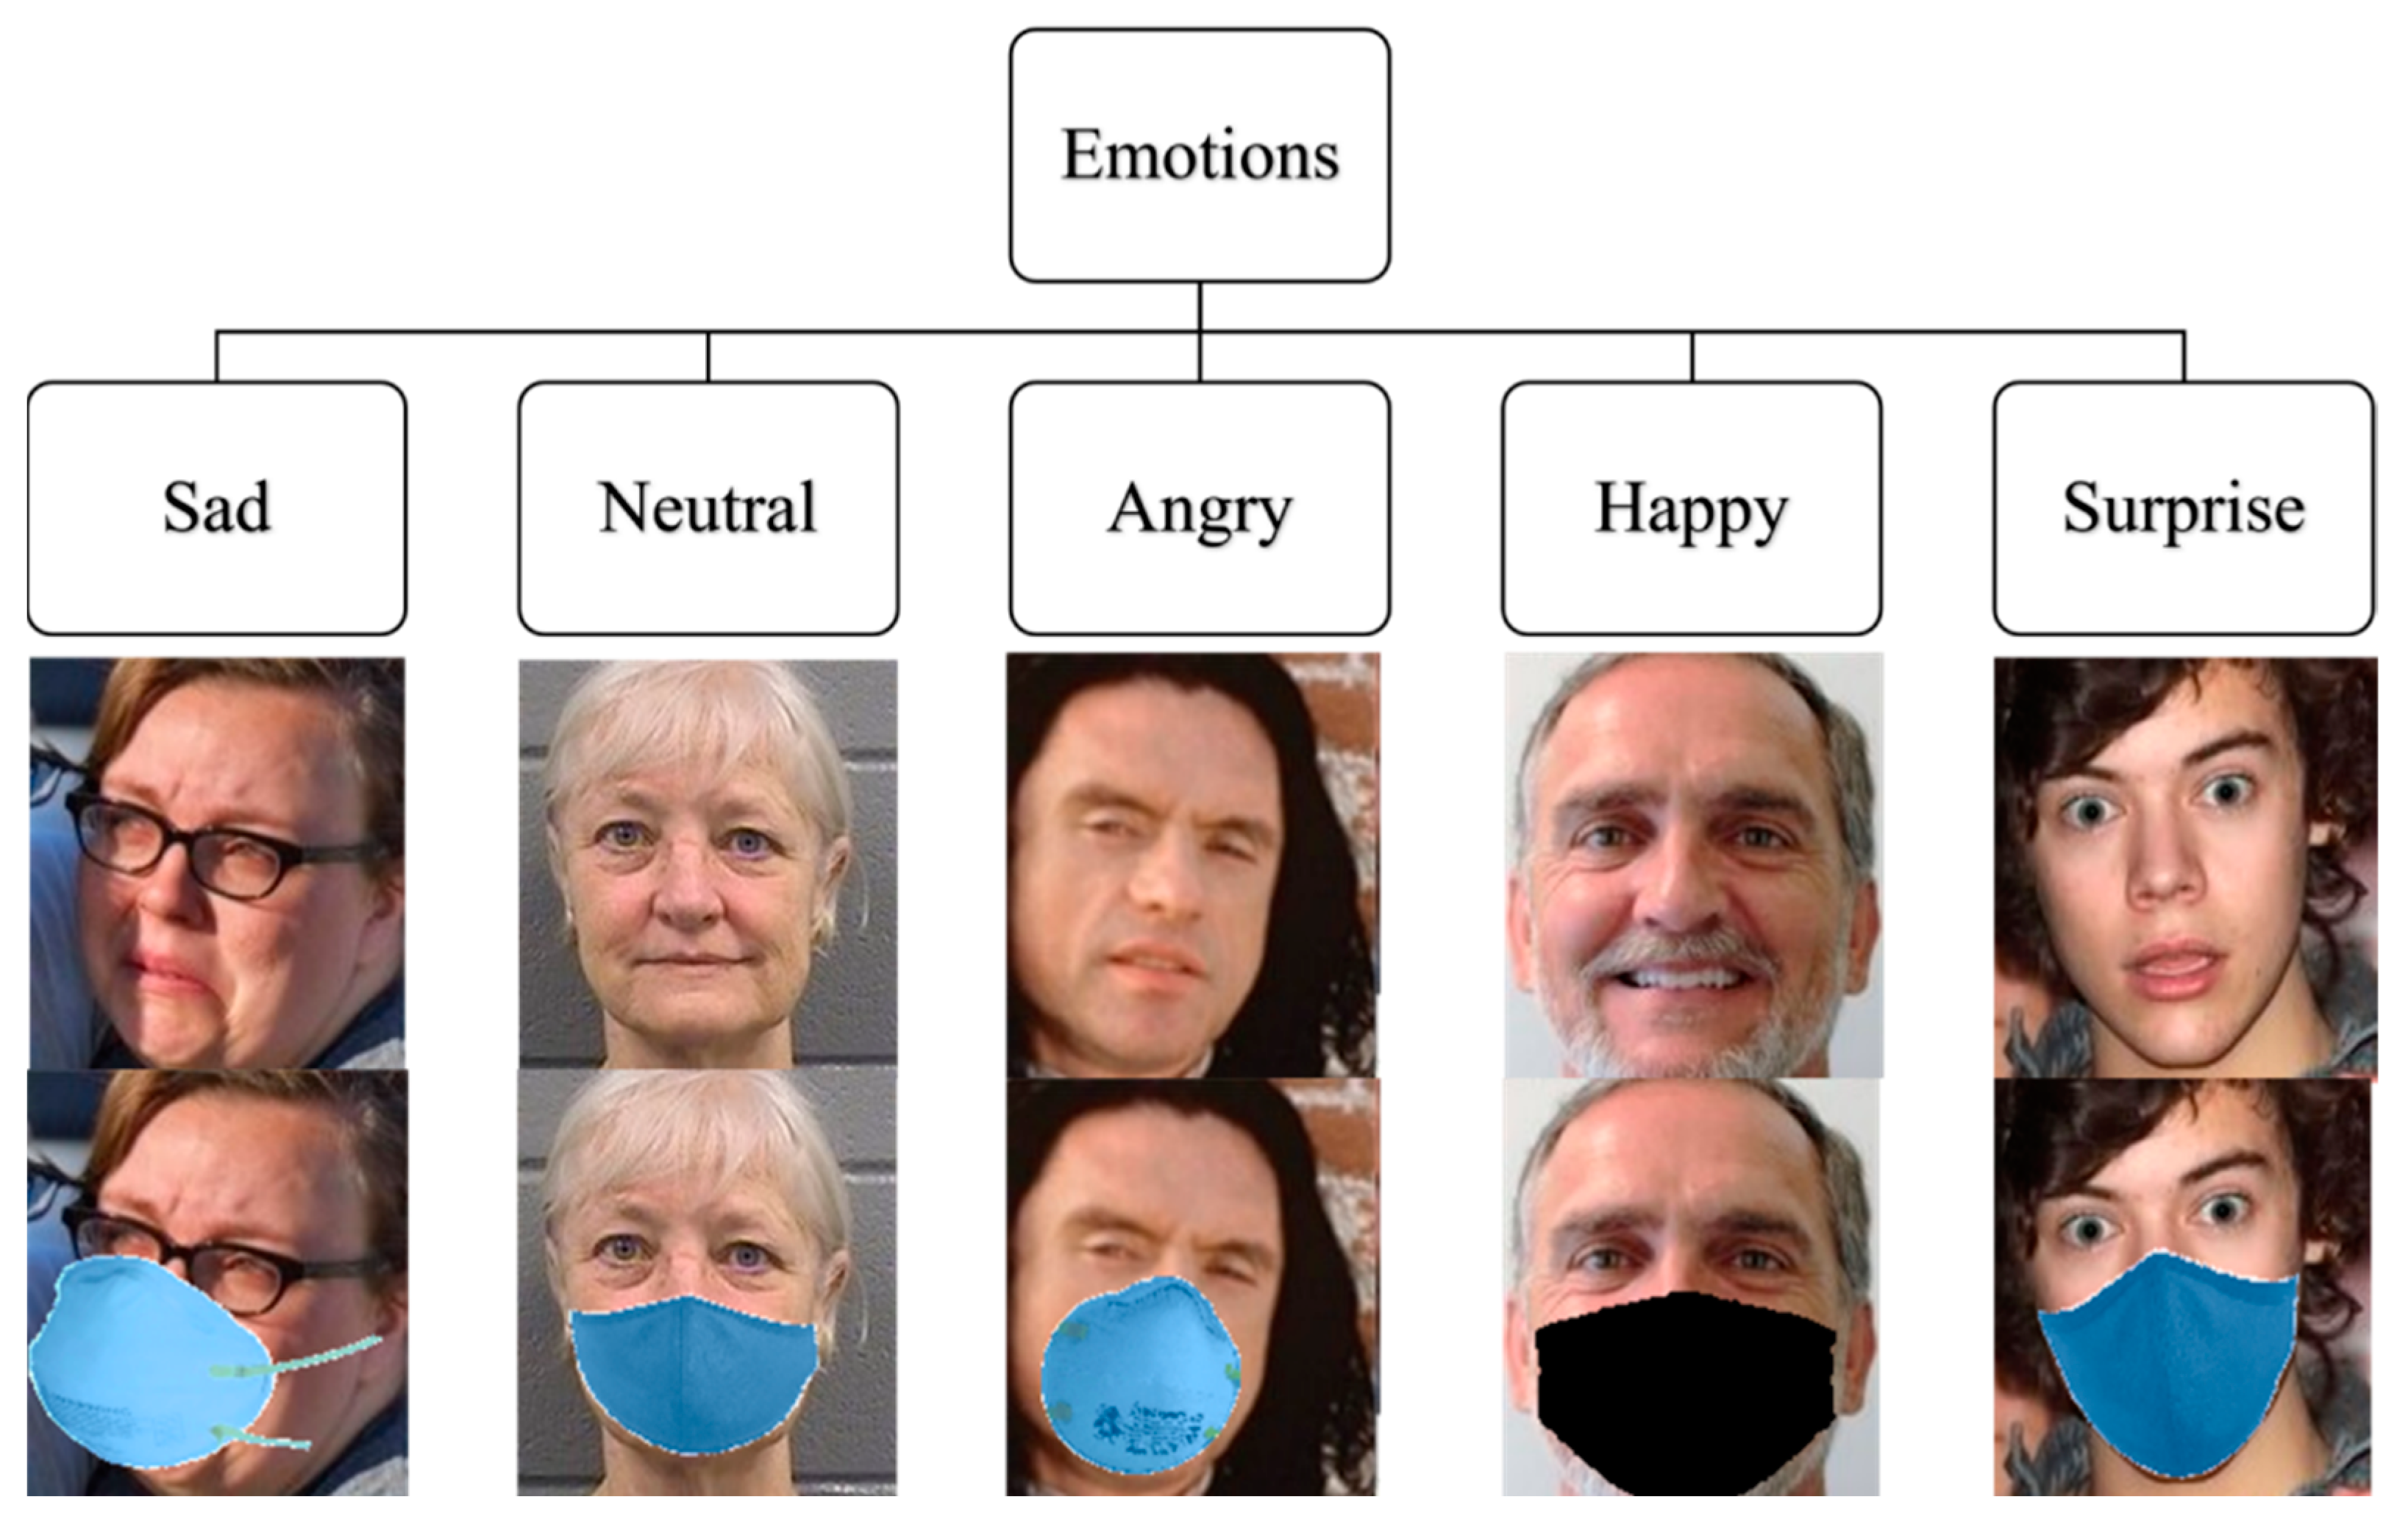
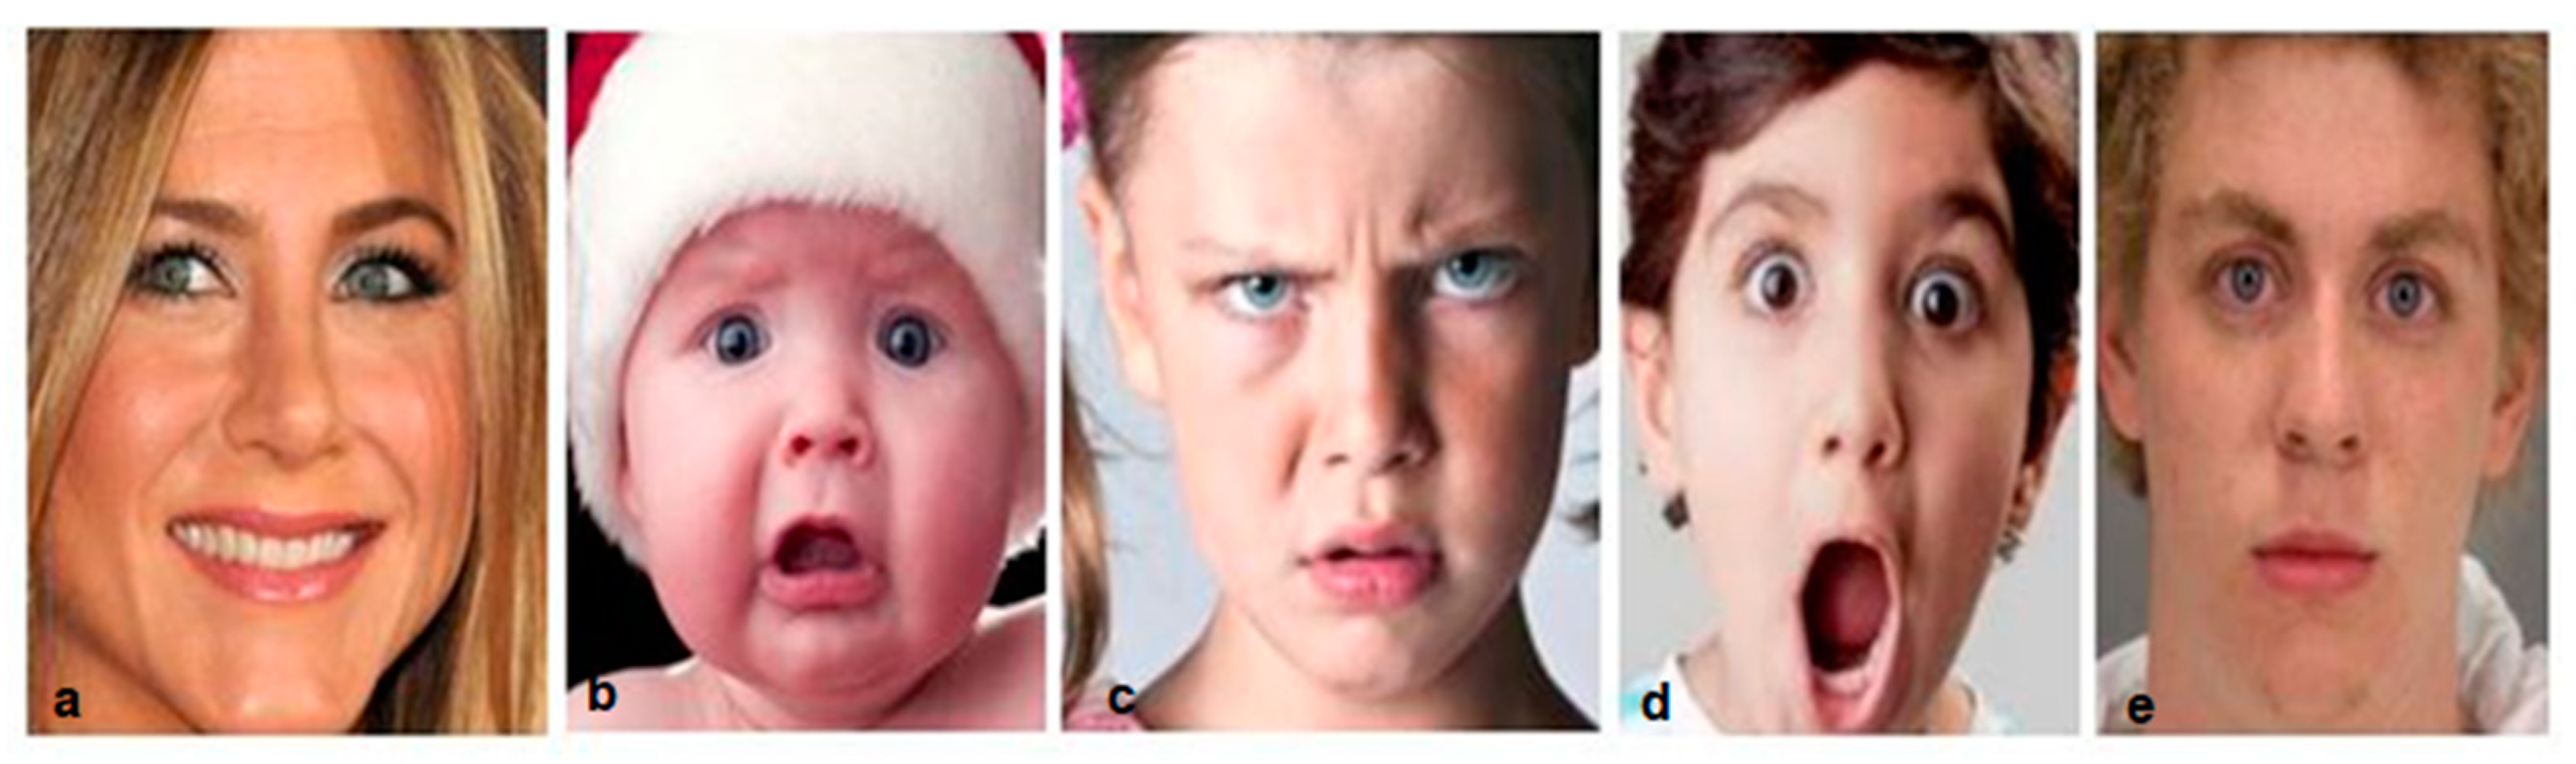
2.4.2. The Emotion Dataset
3. Experiments
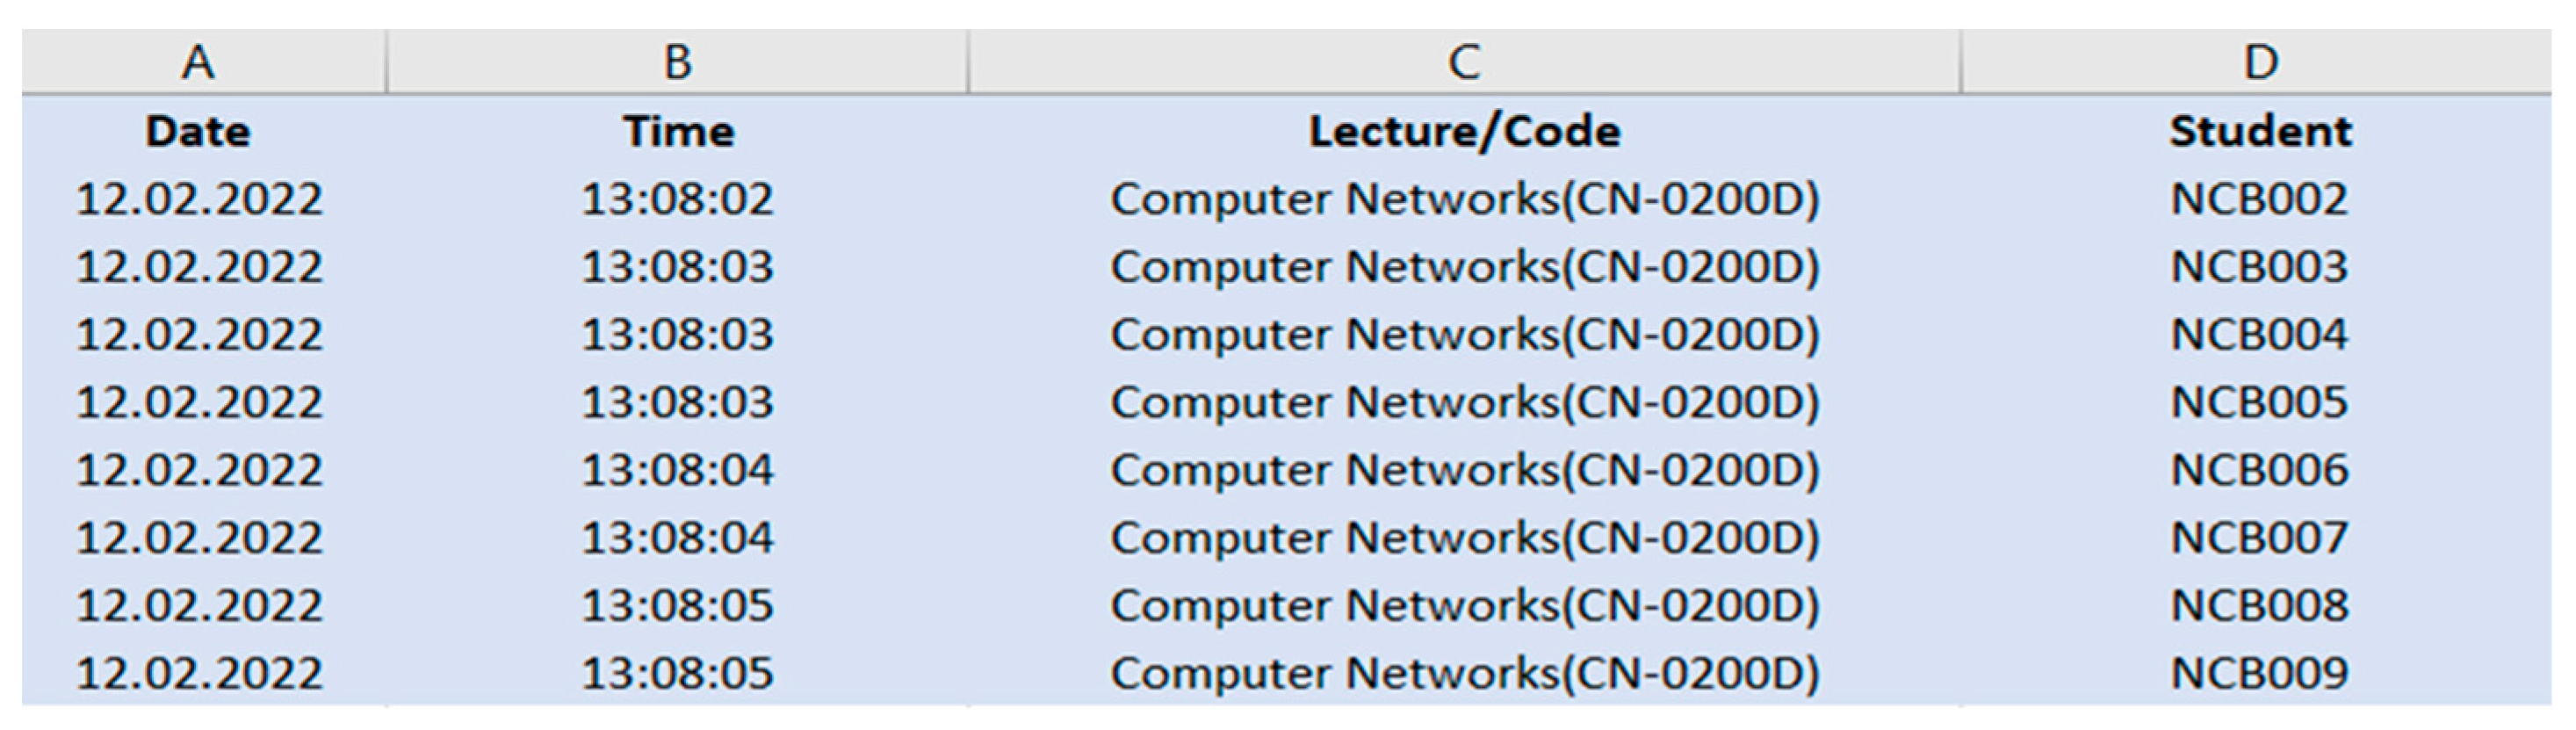
3.1. Attendance Monitoring Algorithms
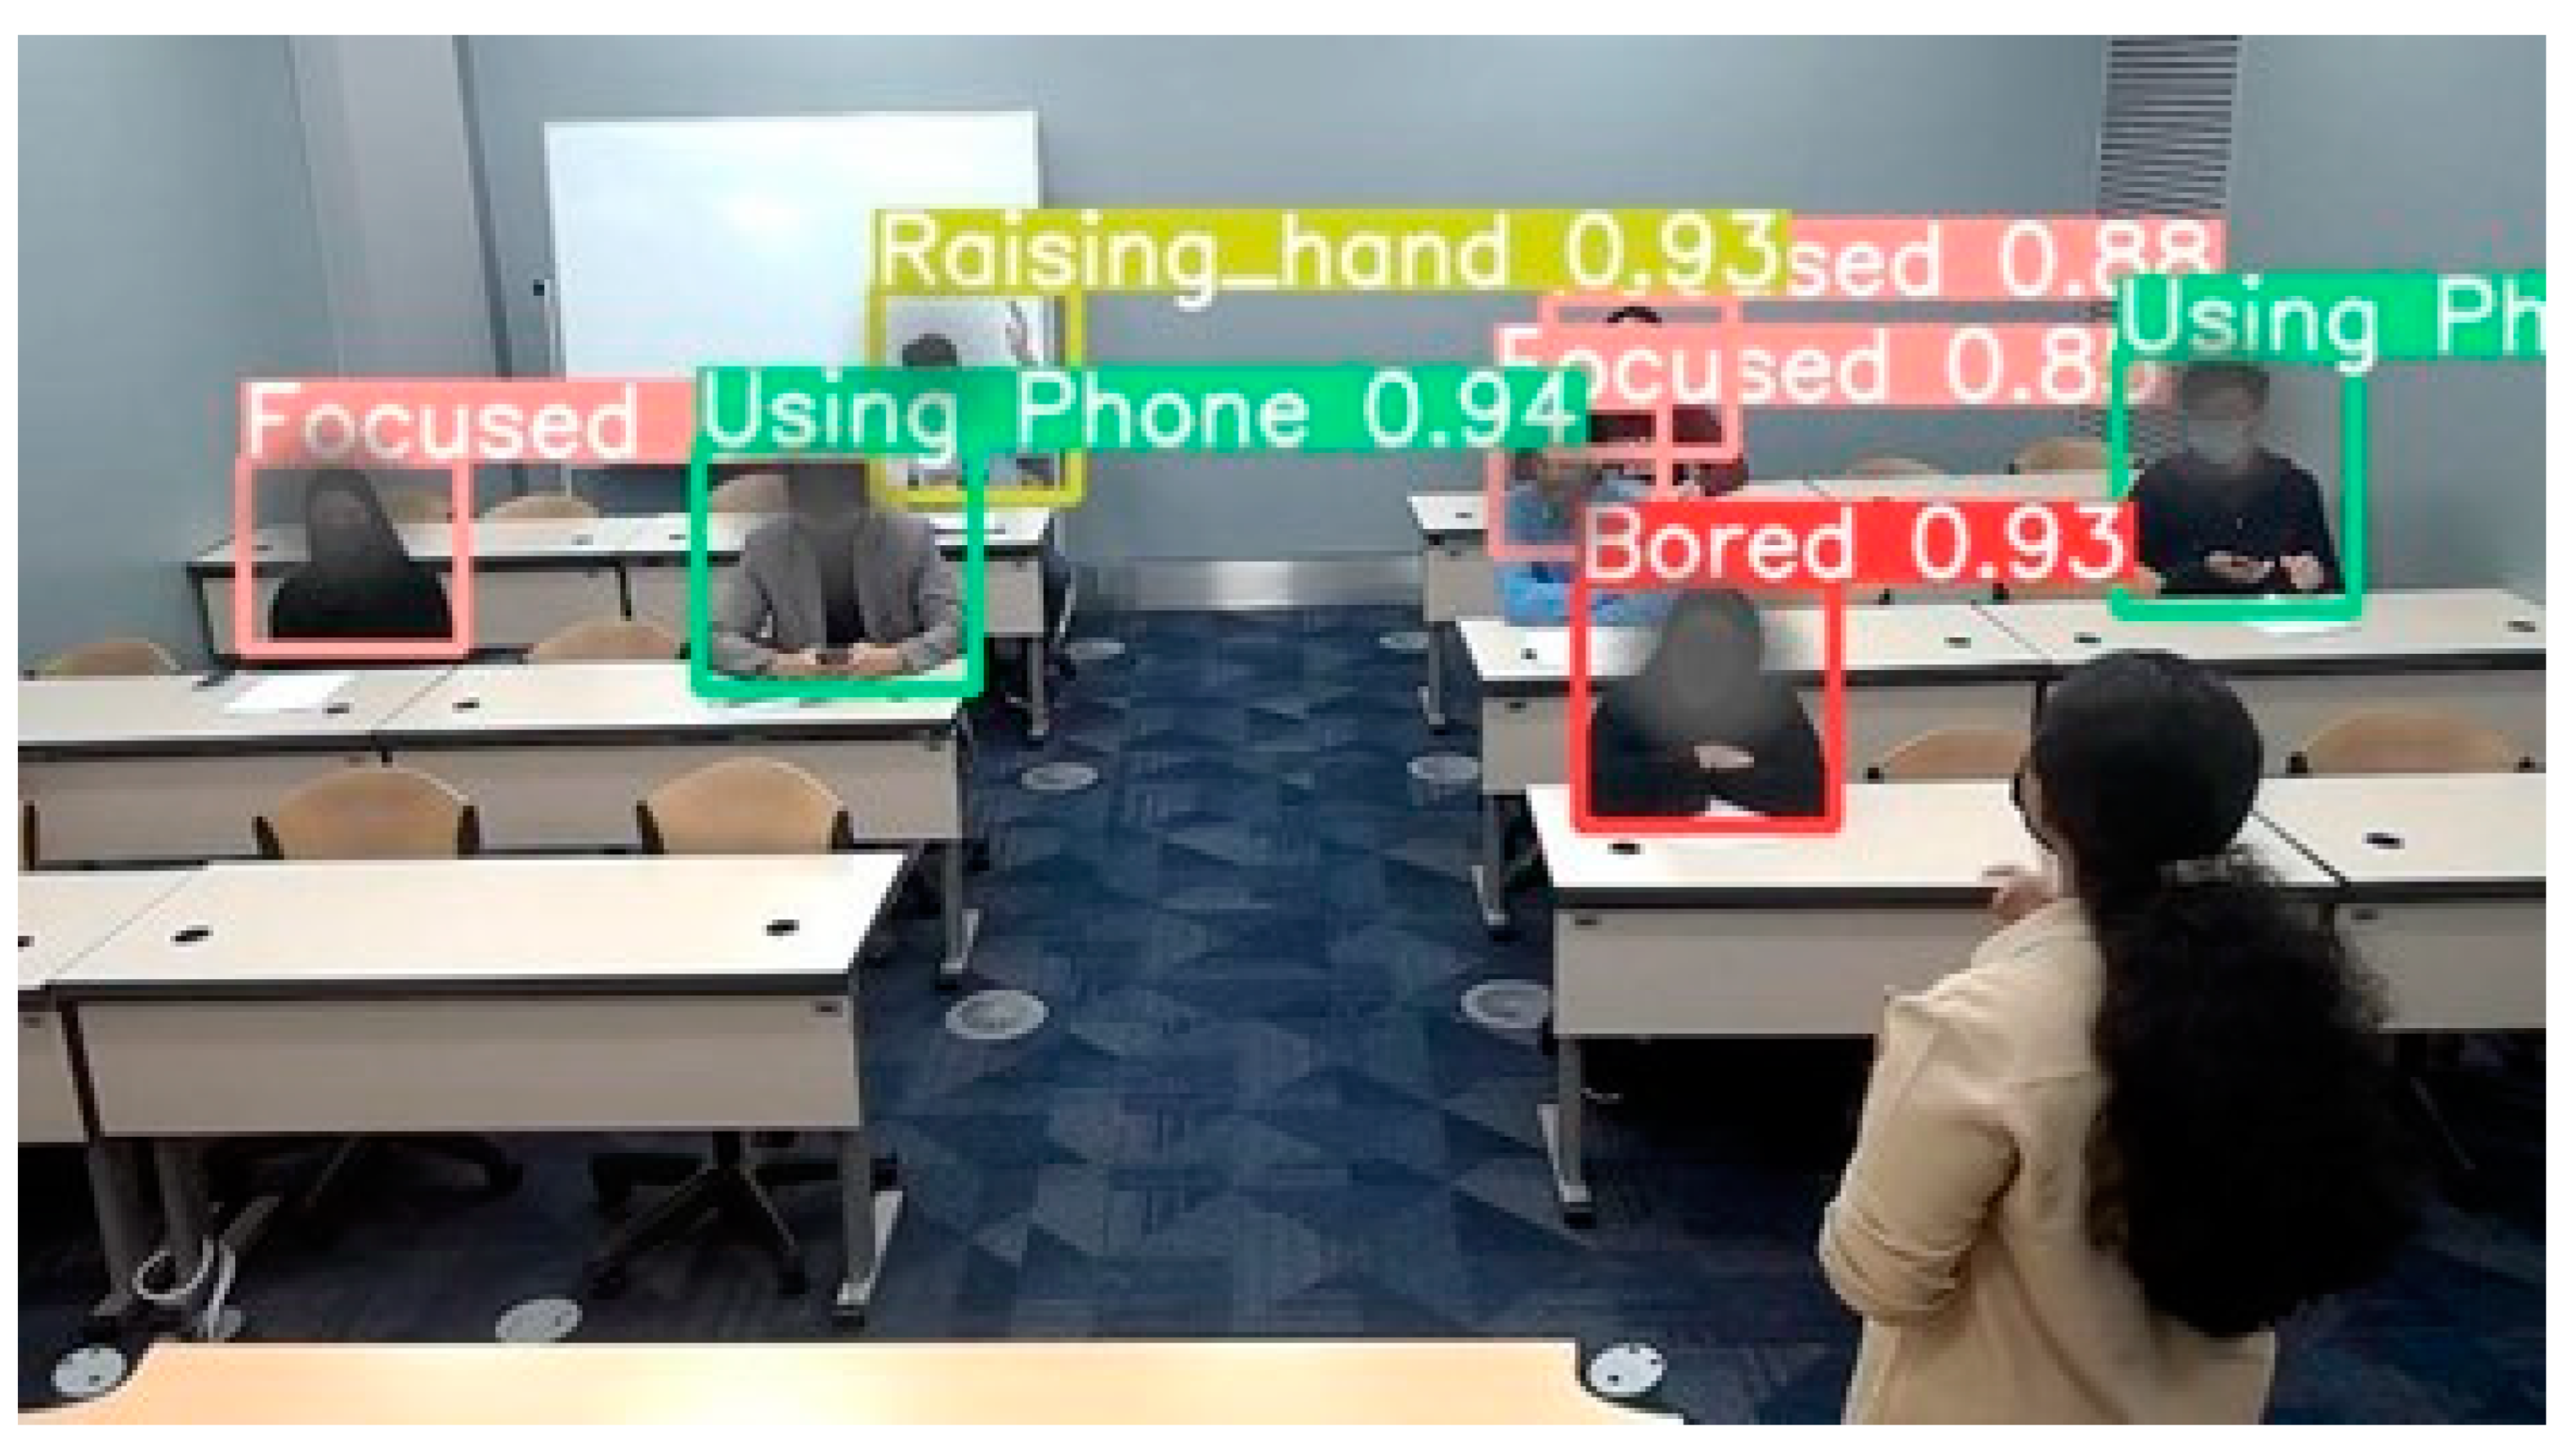
3.2. Model Testing in a Real Classroom Environment
4. Results
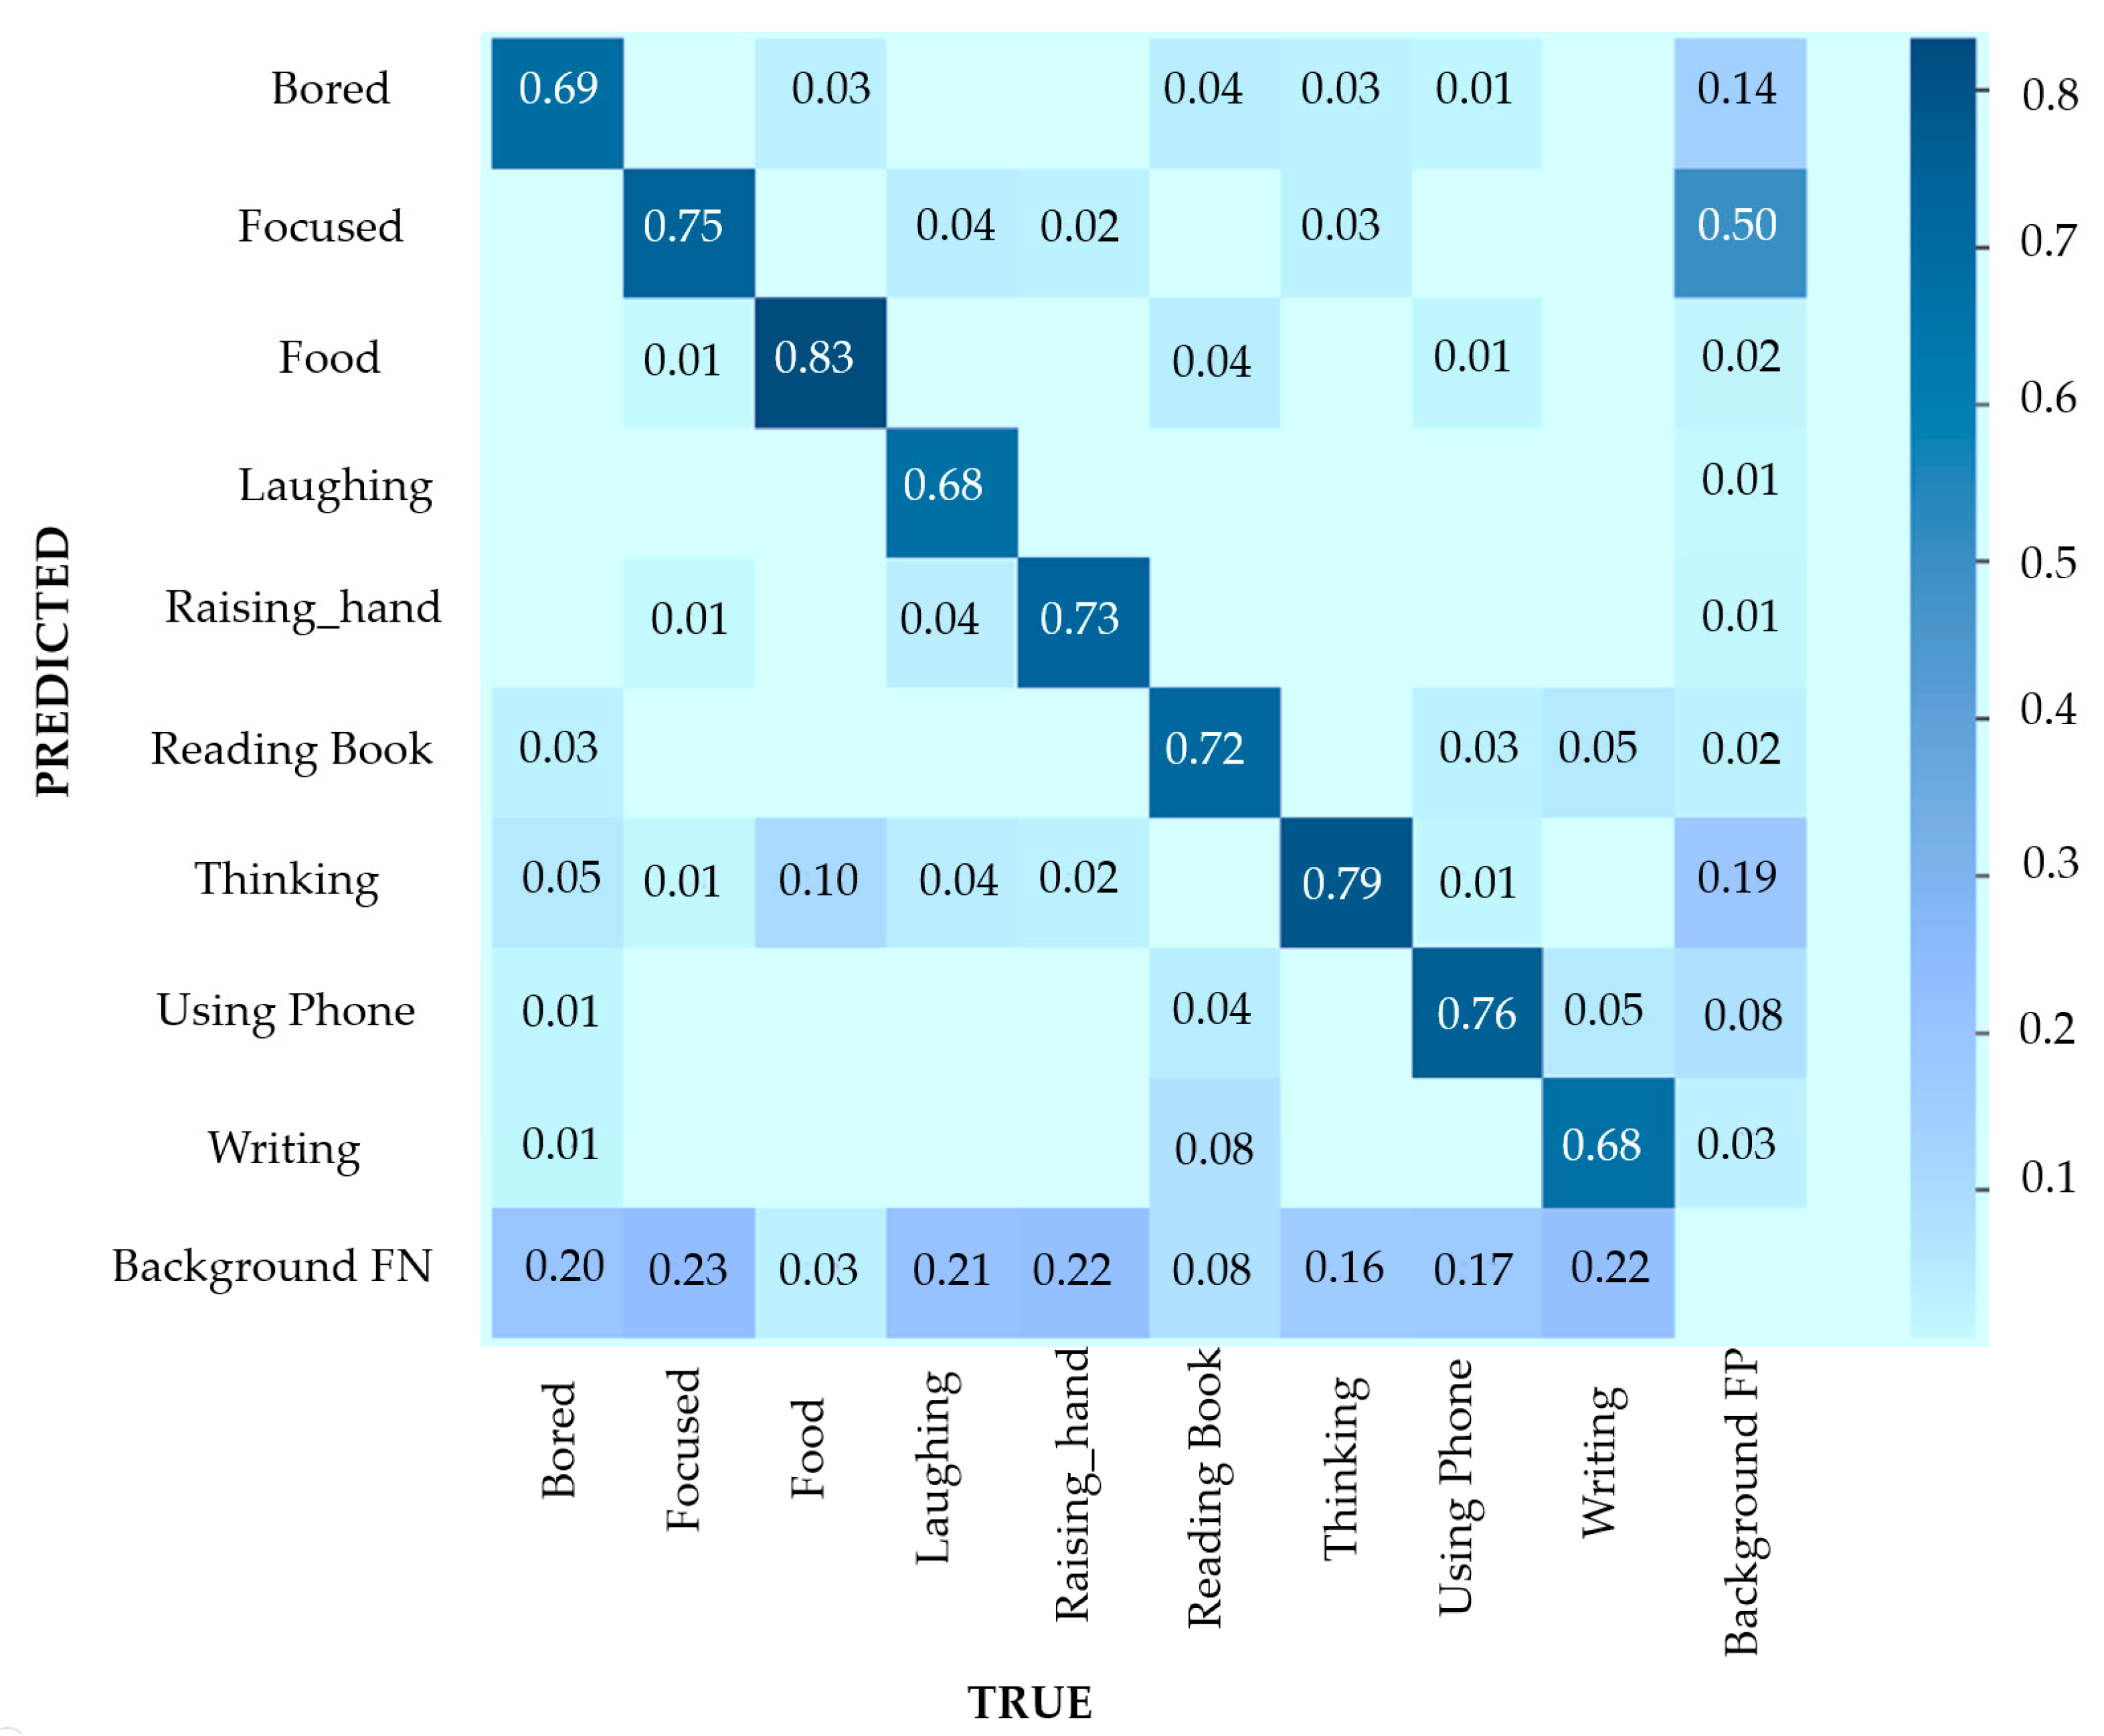
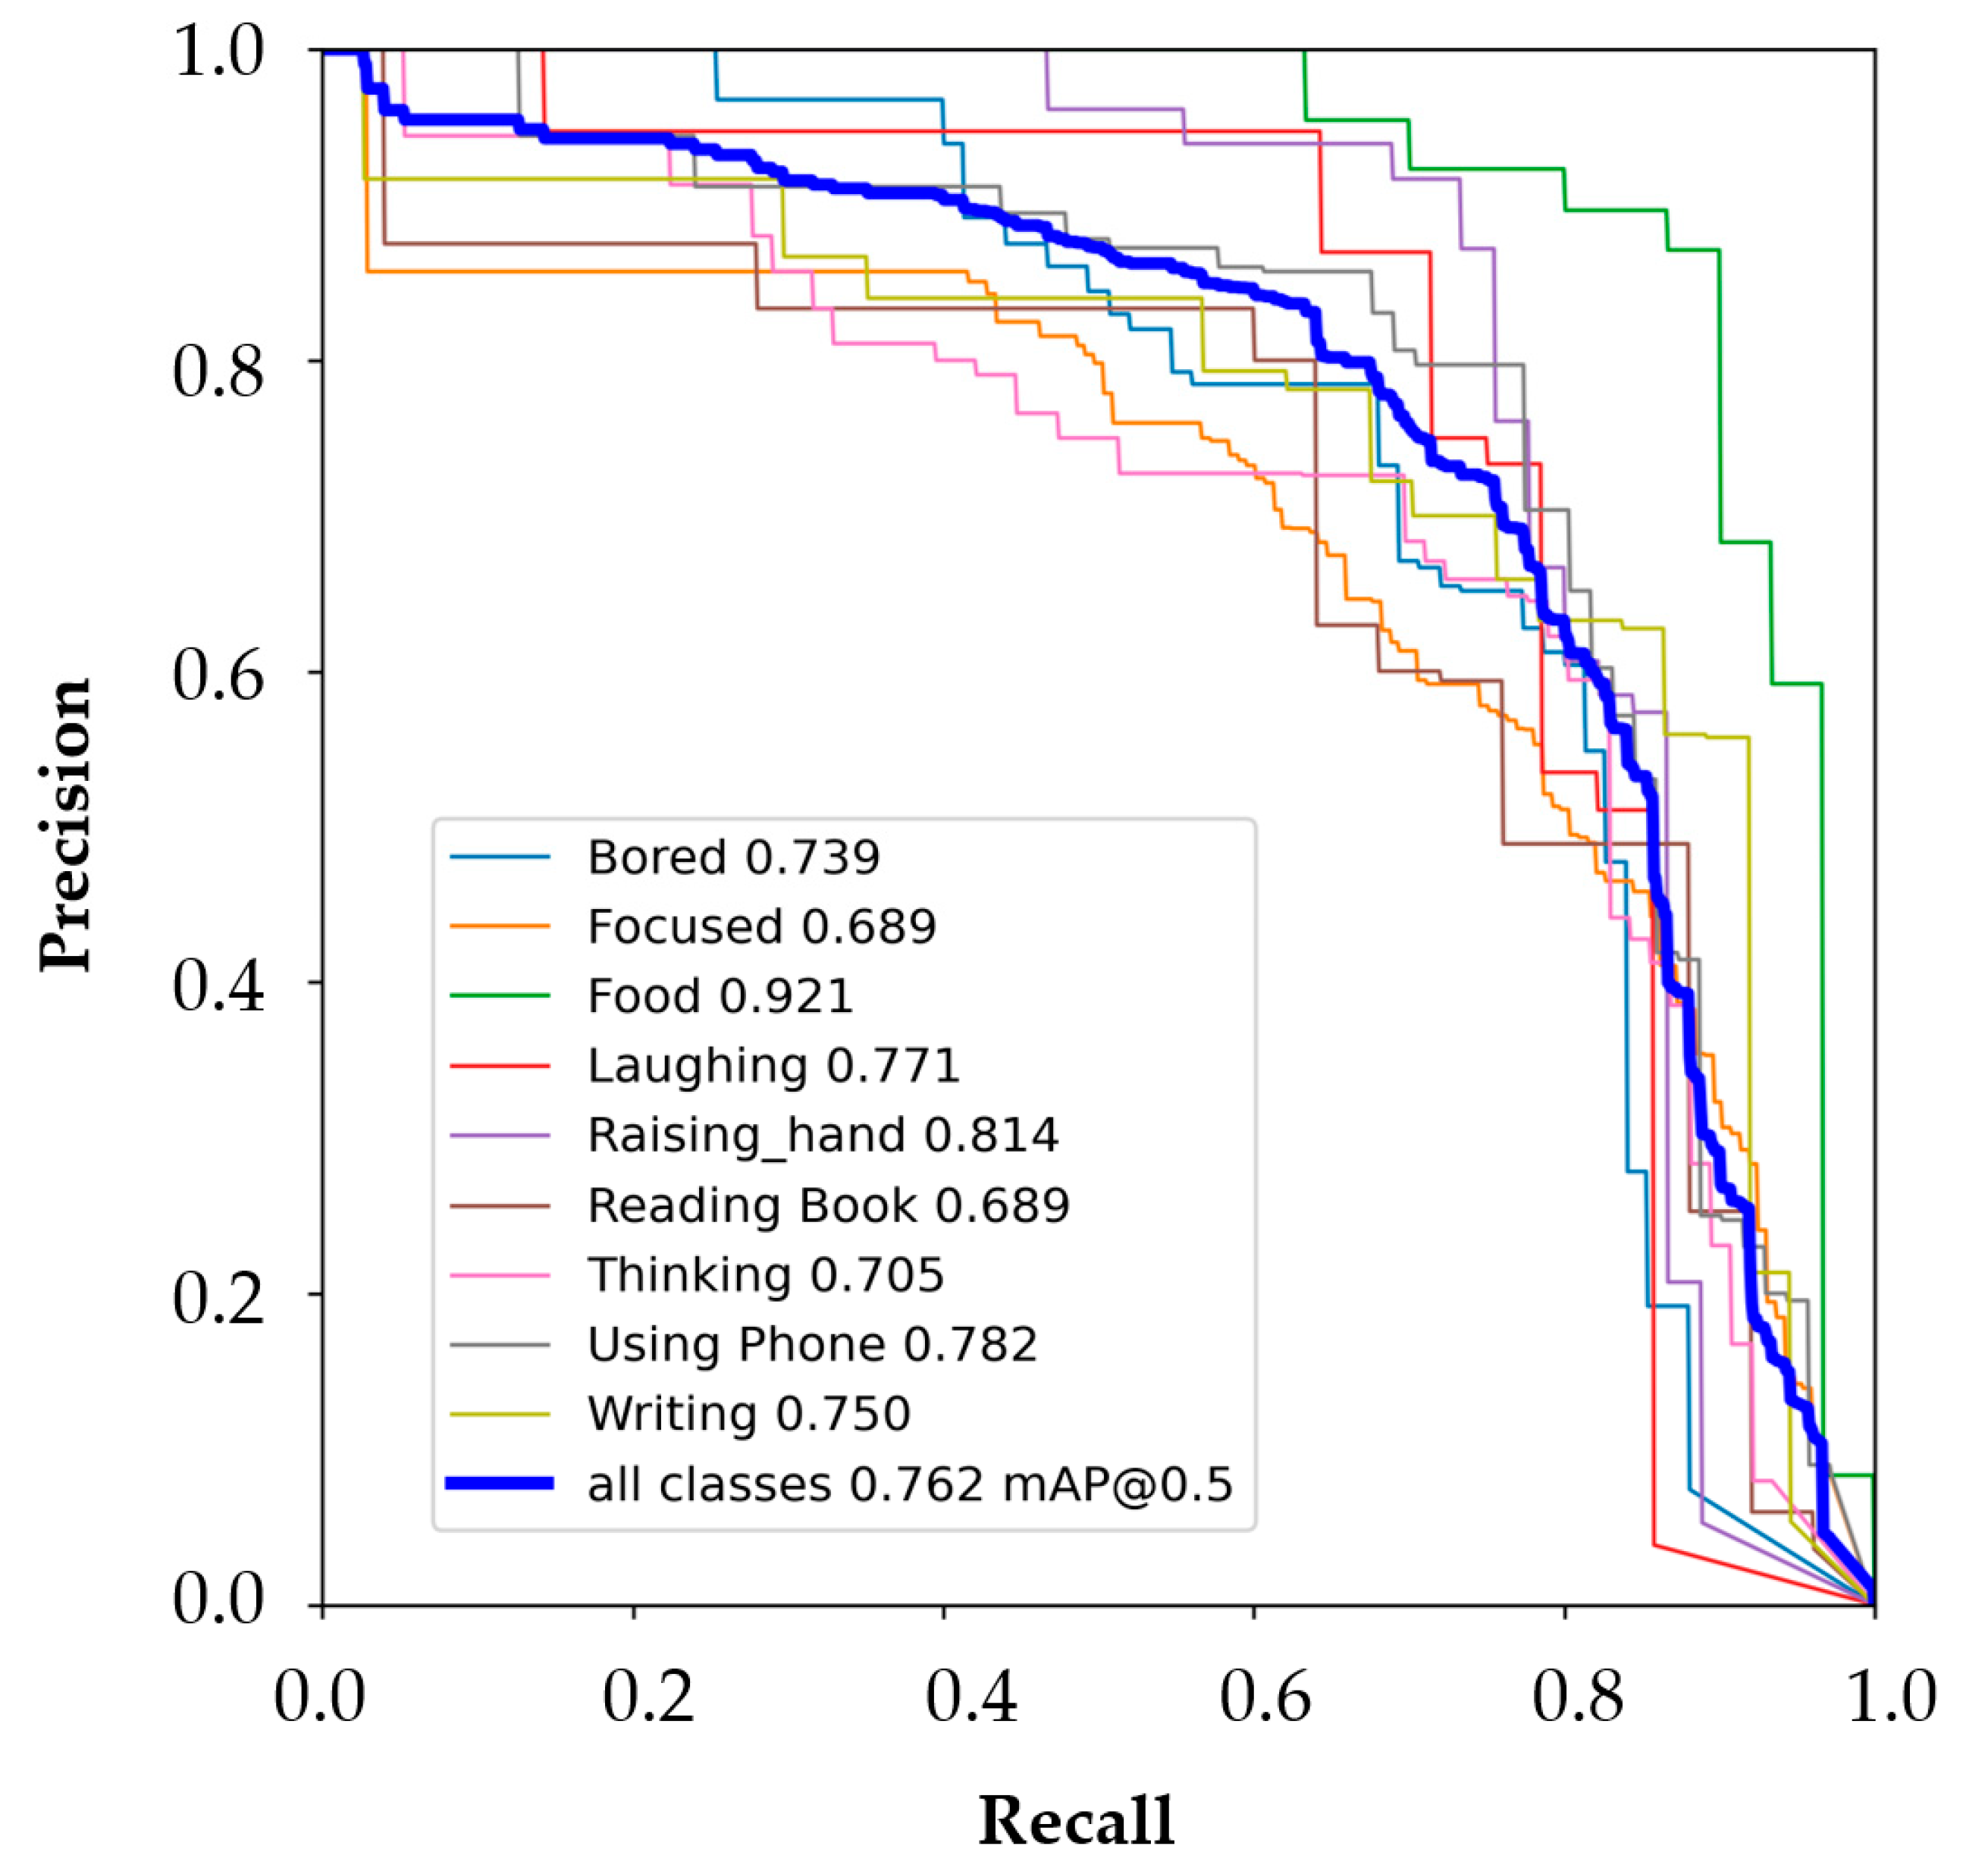
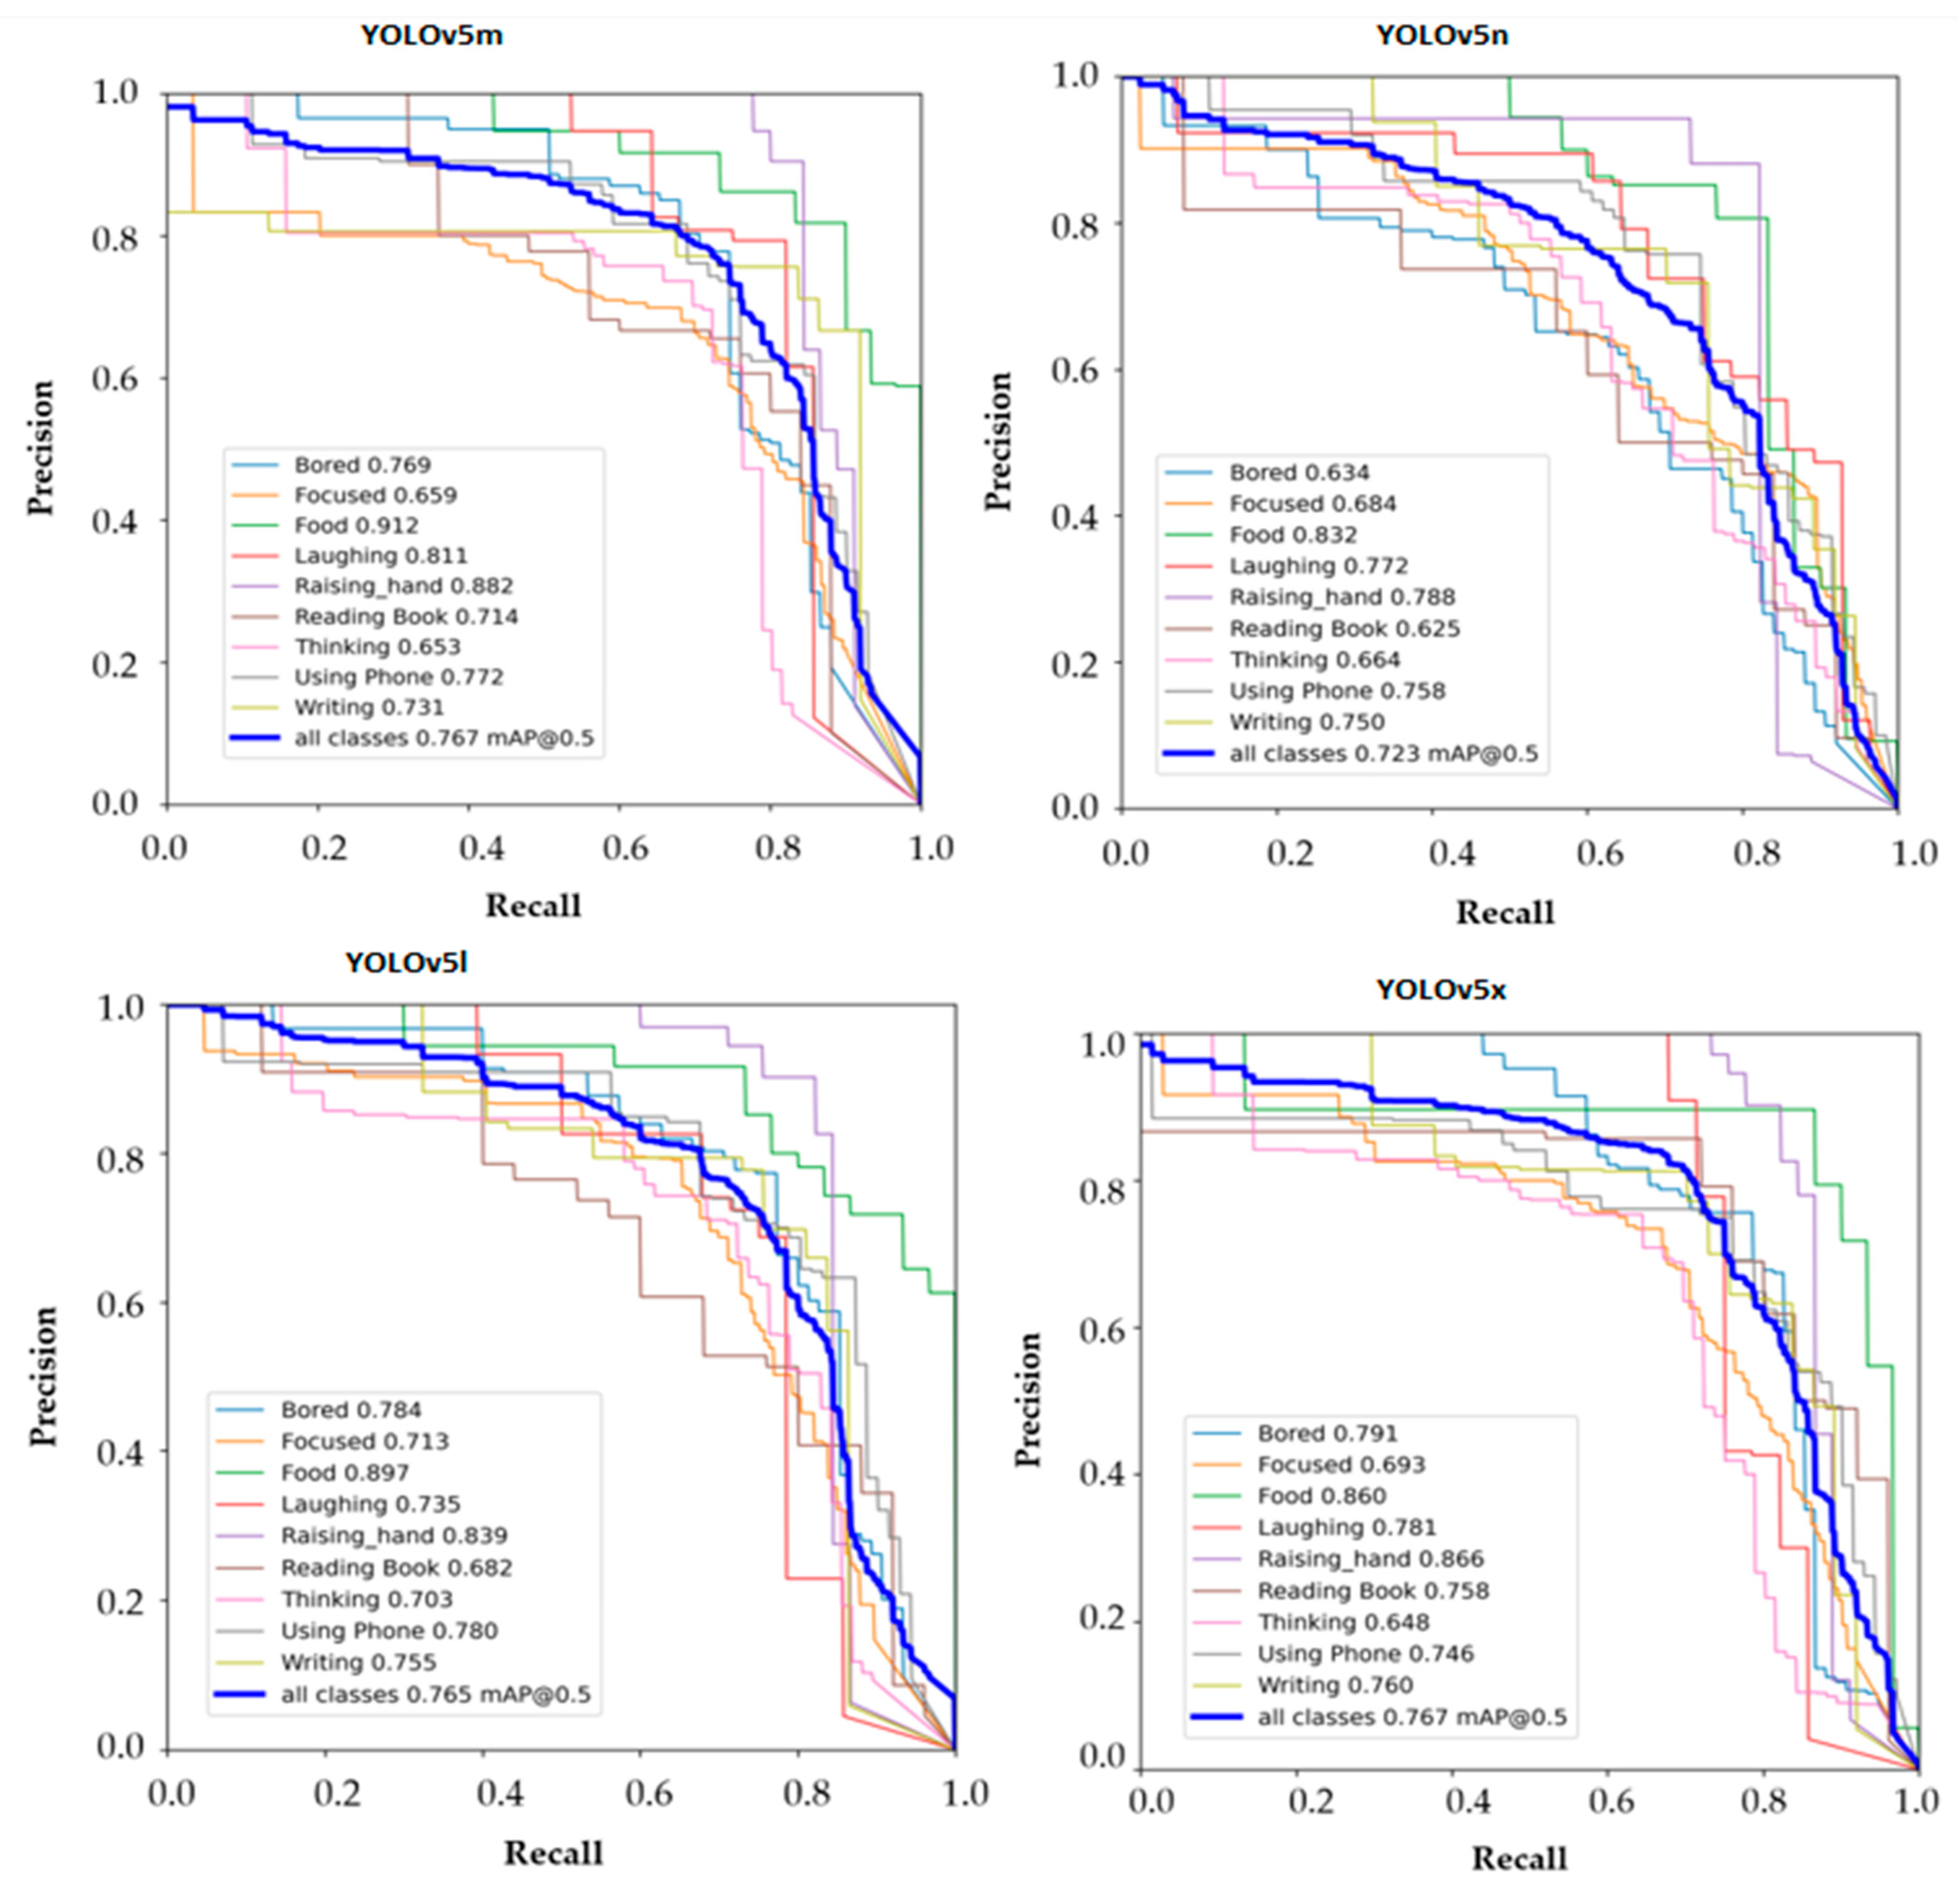
4.1. Action/Behavior Recognition Model
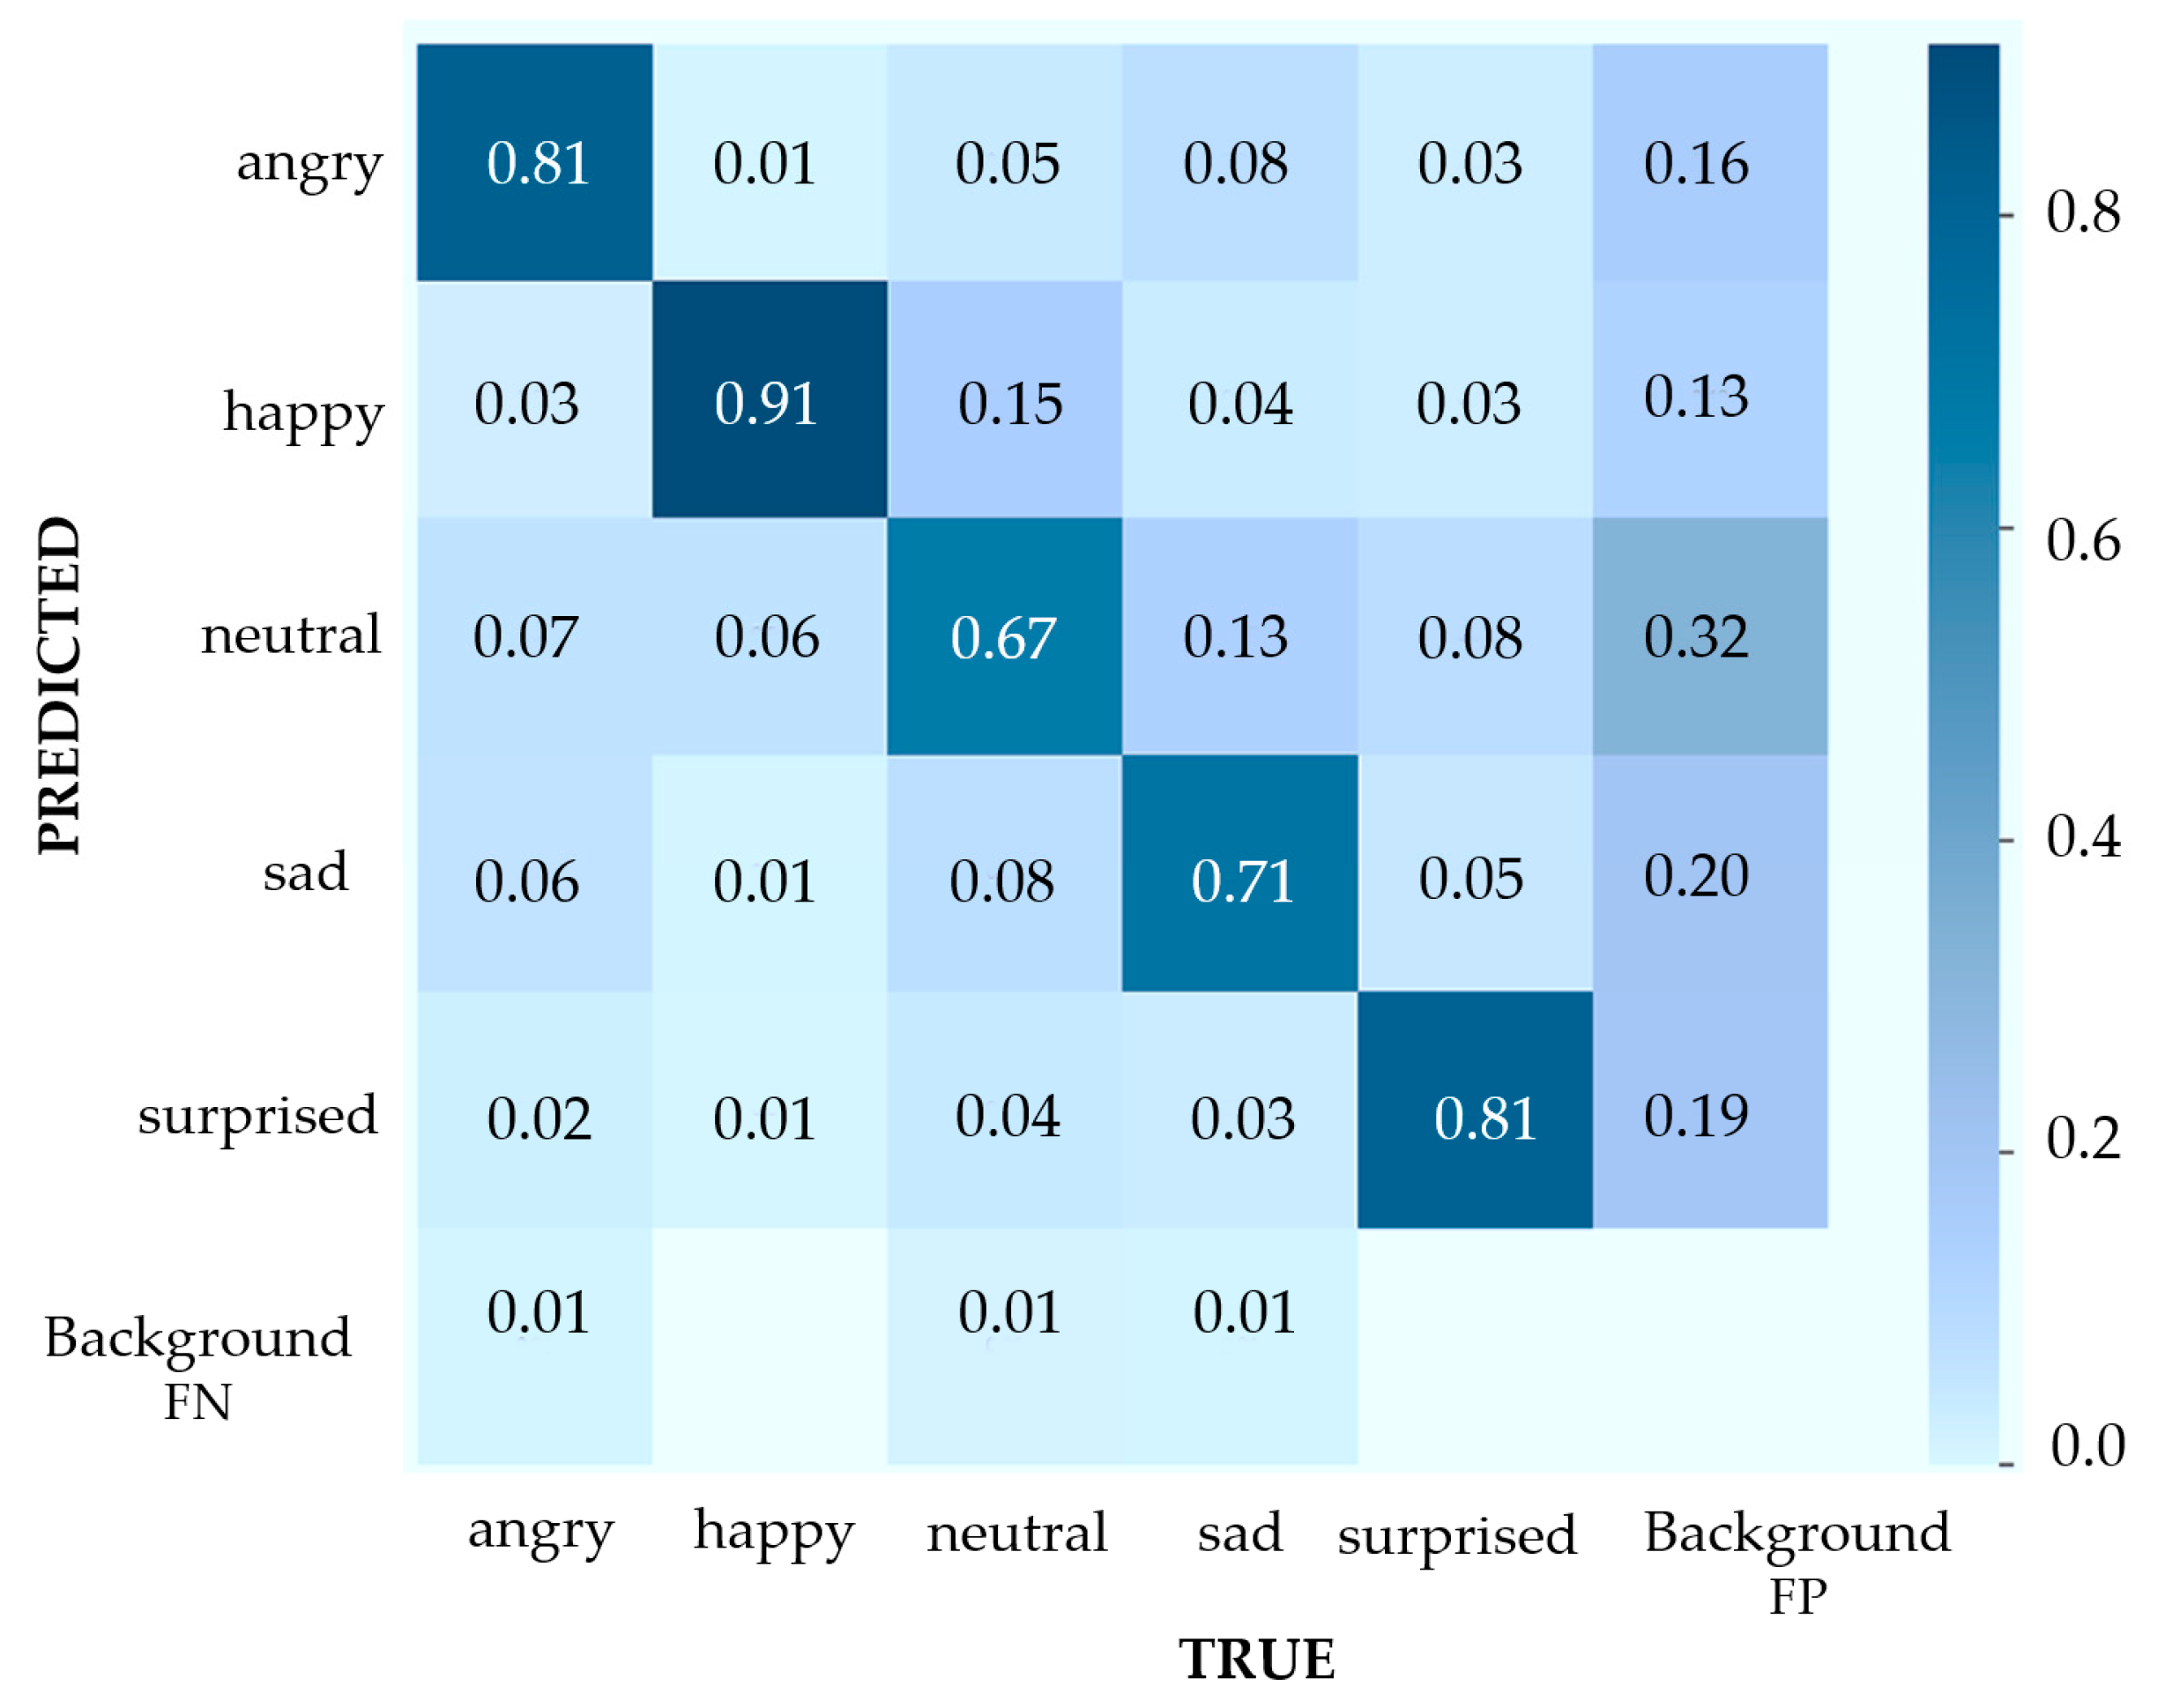
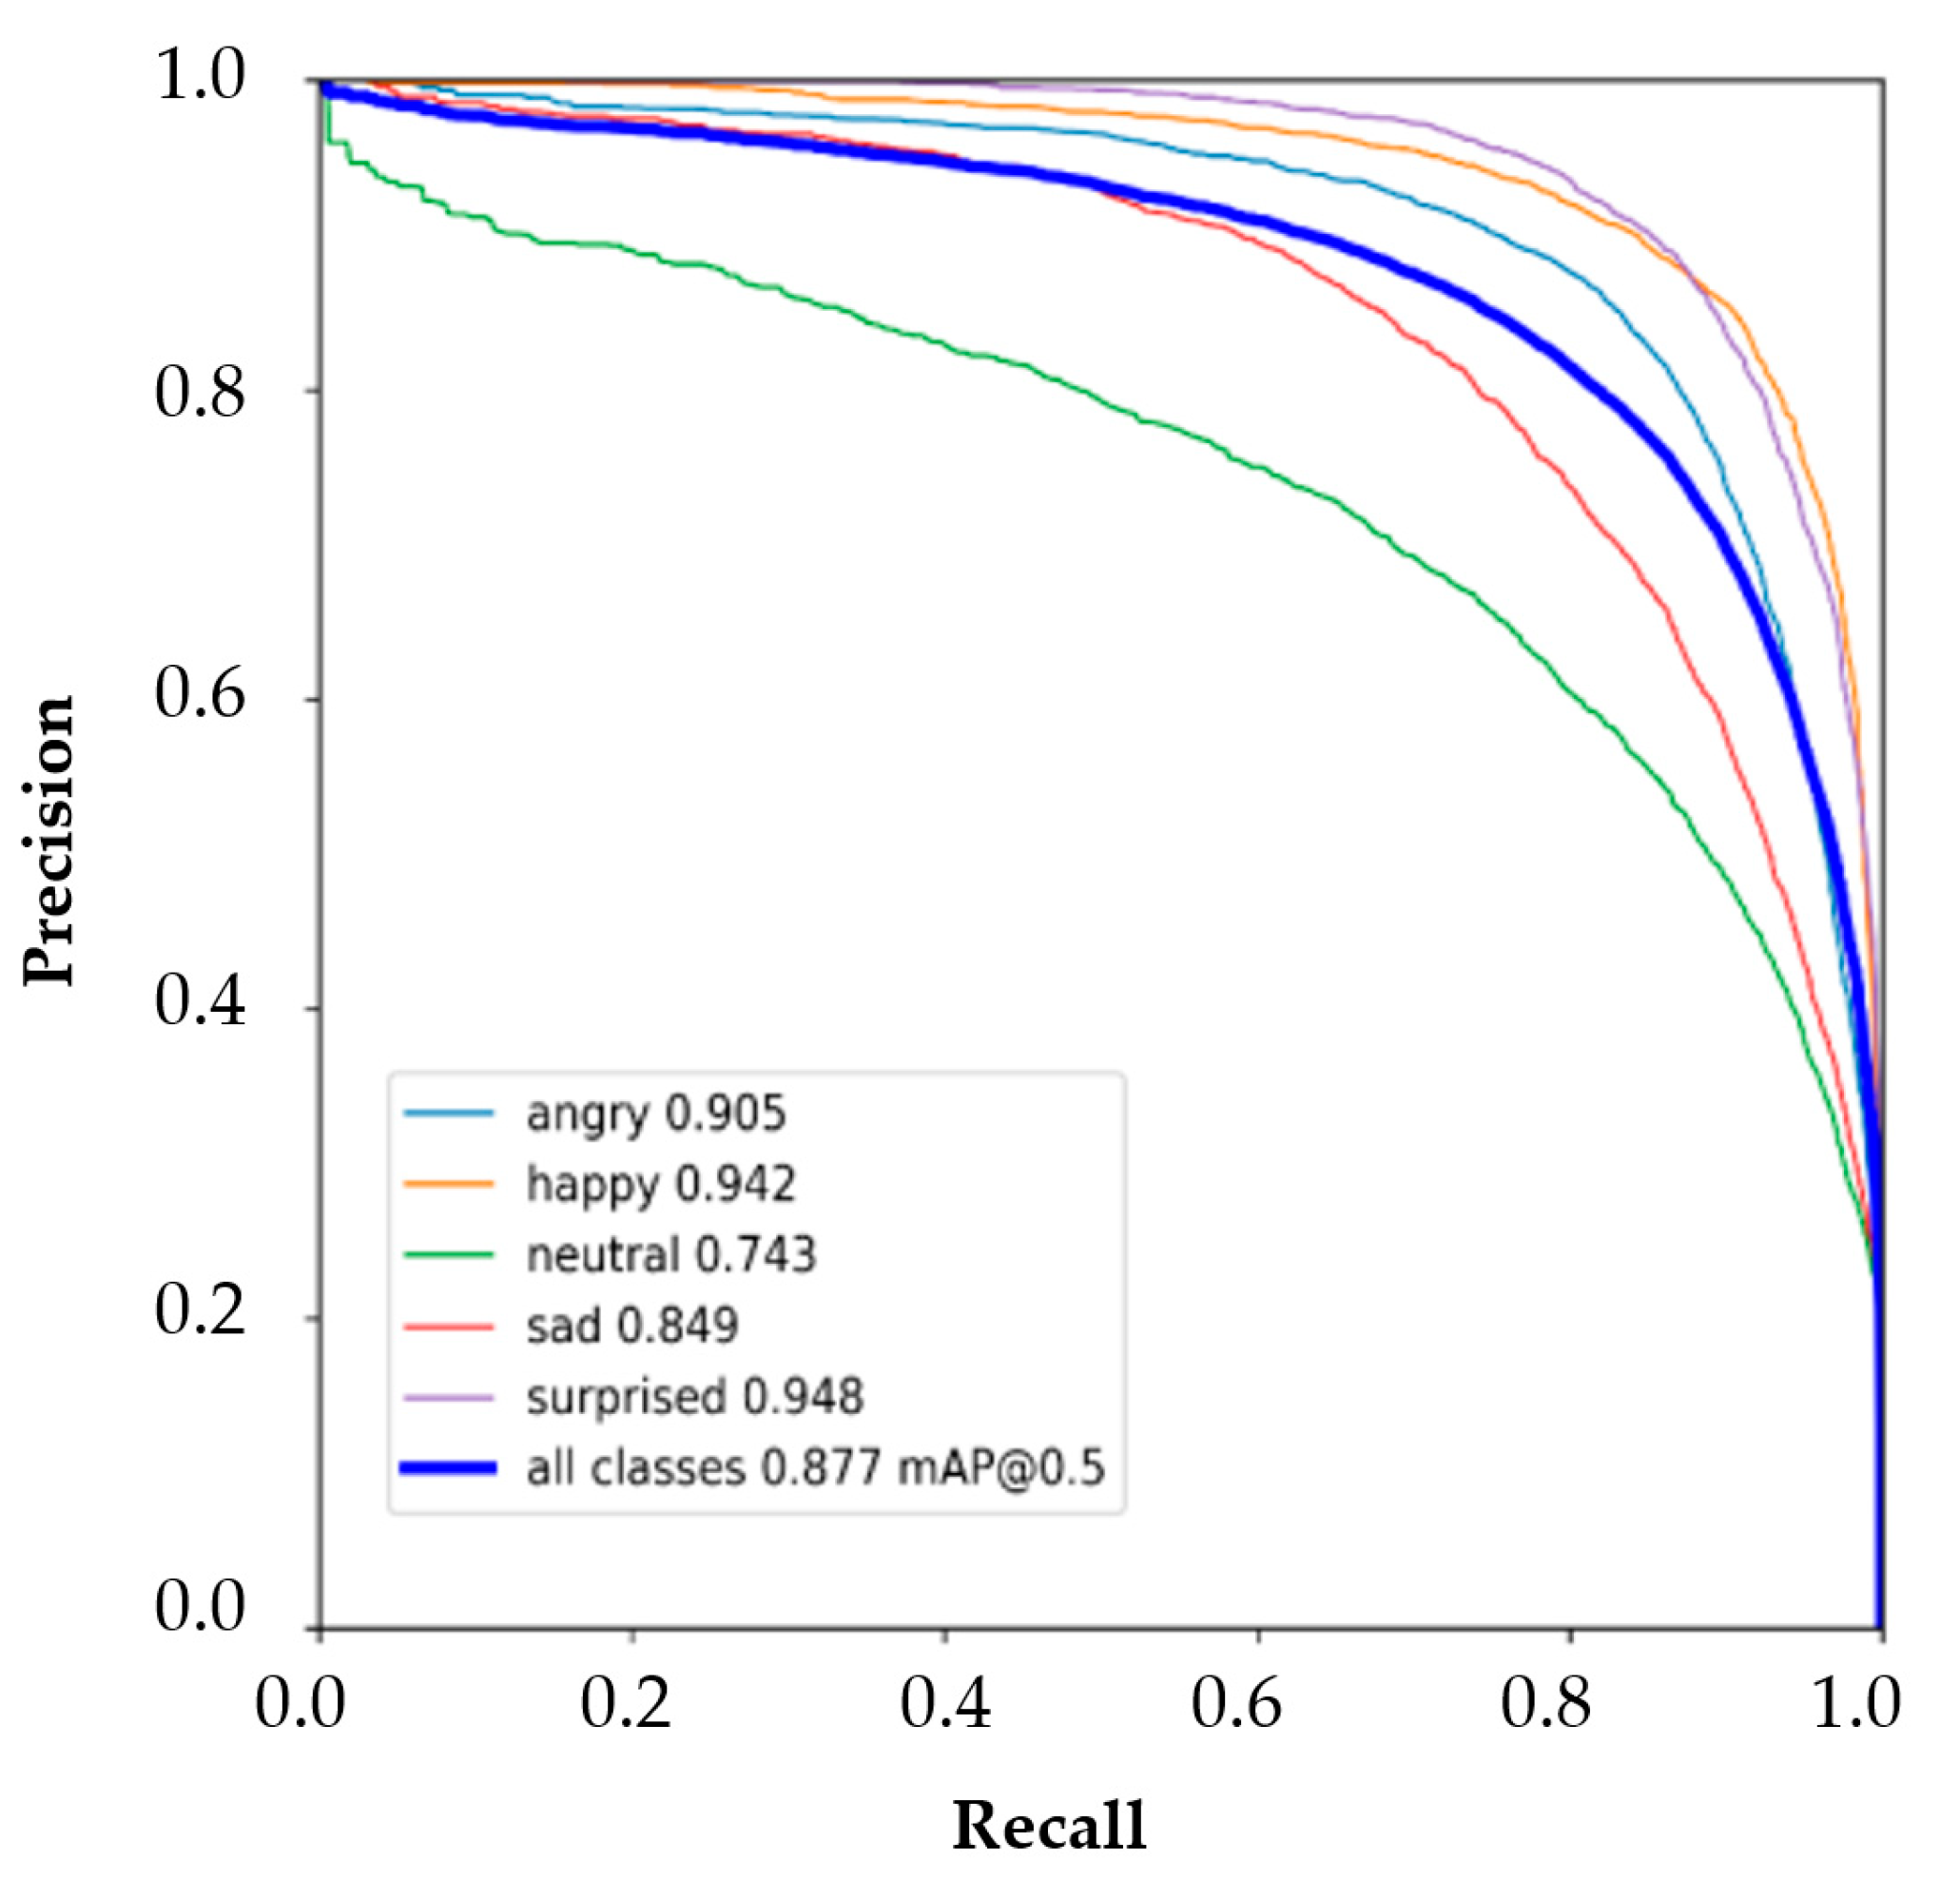
4.2. Emotion Recognition Model
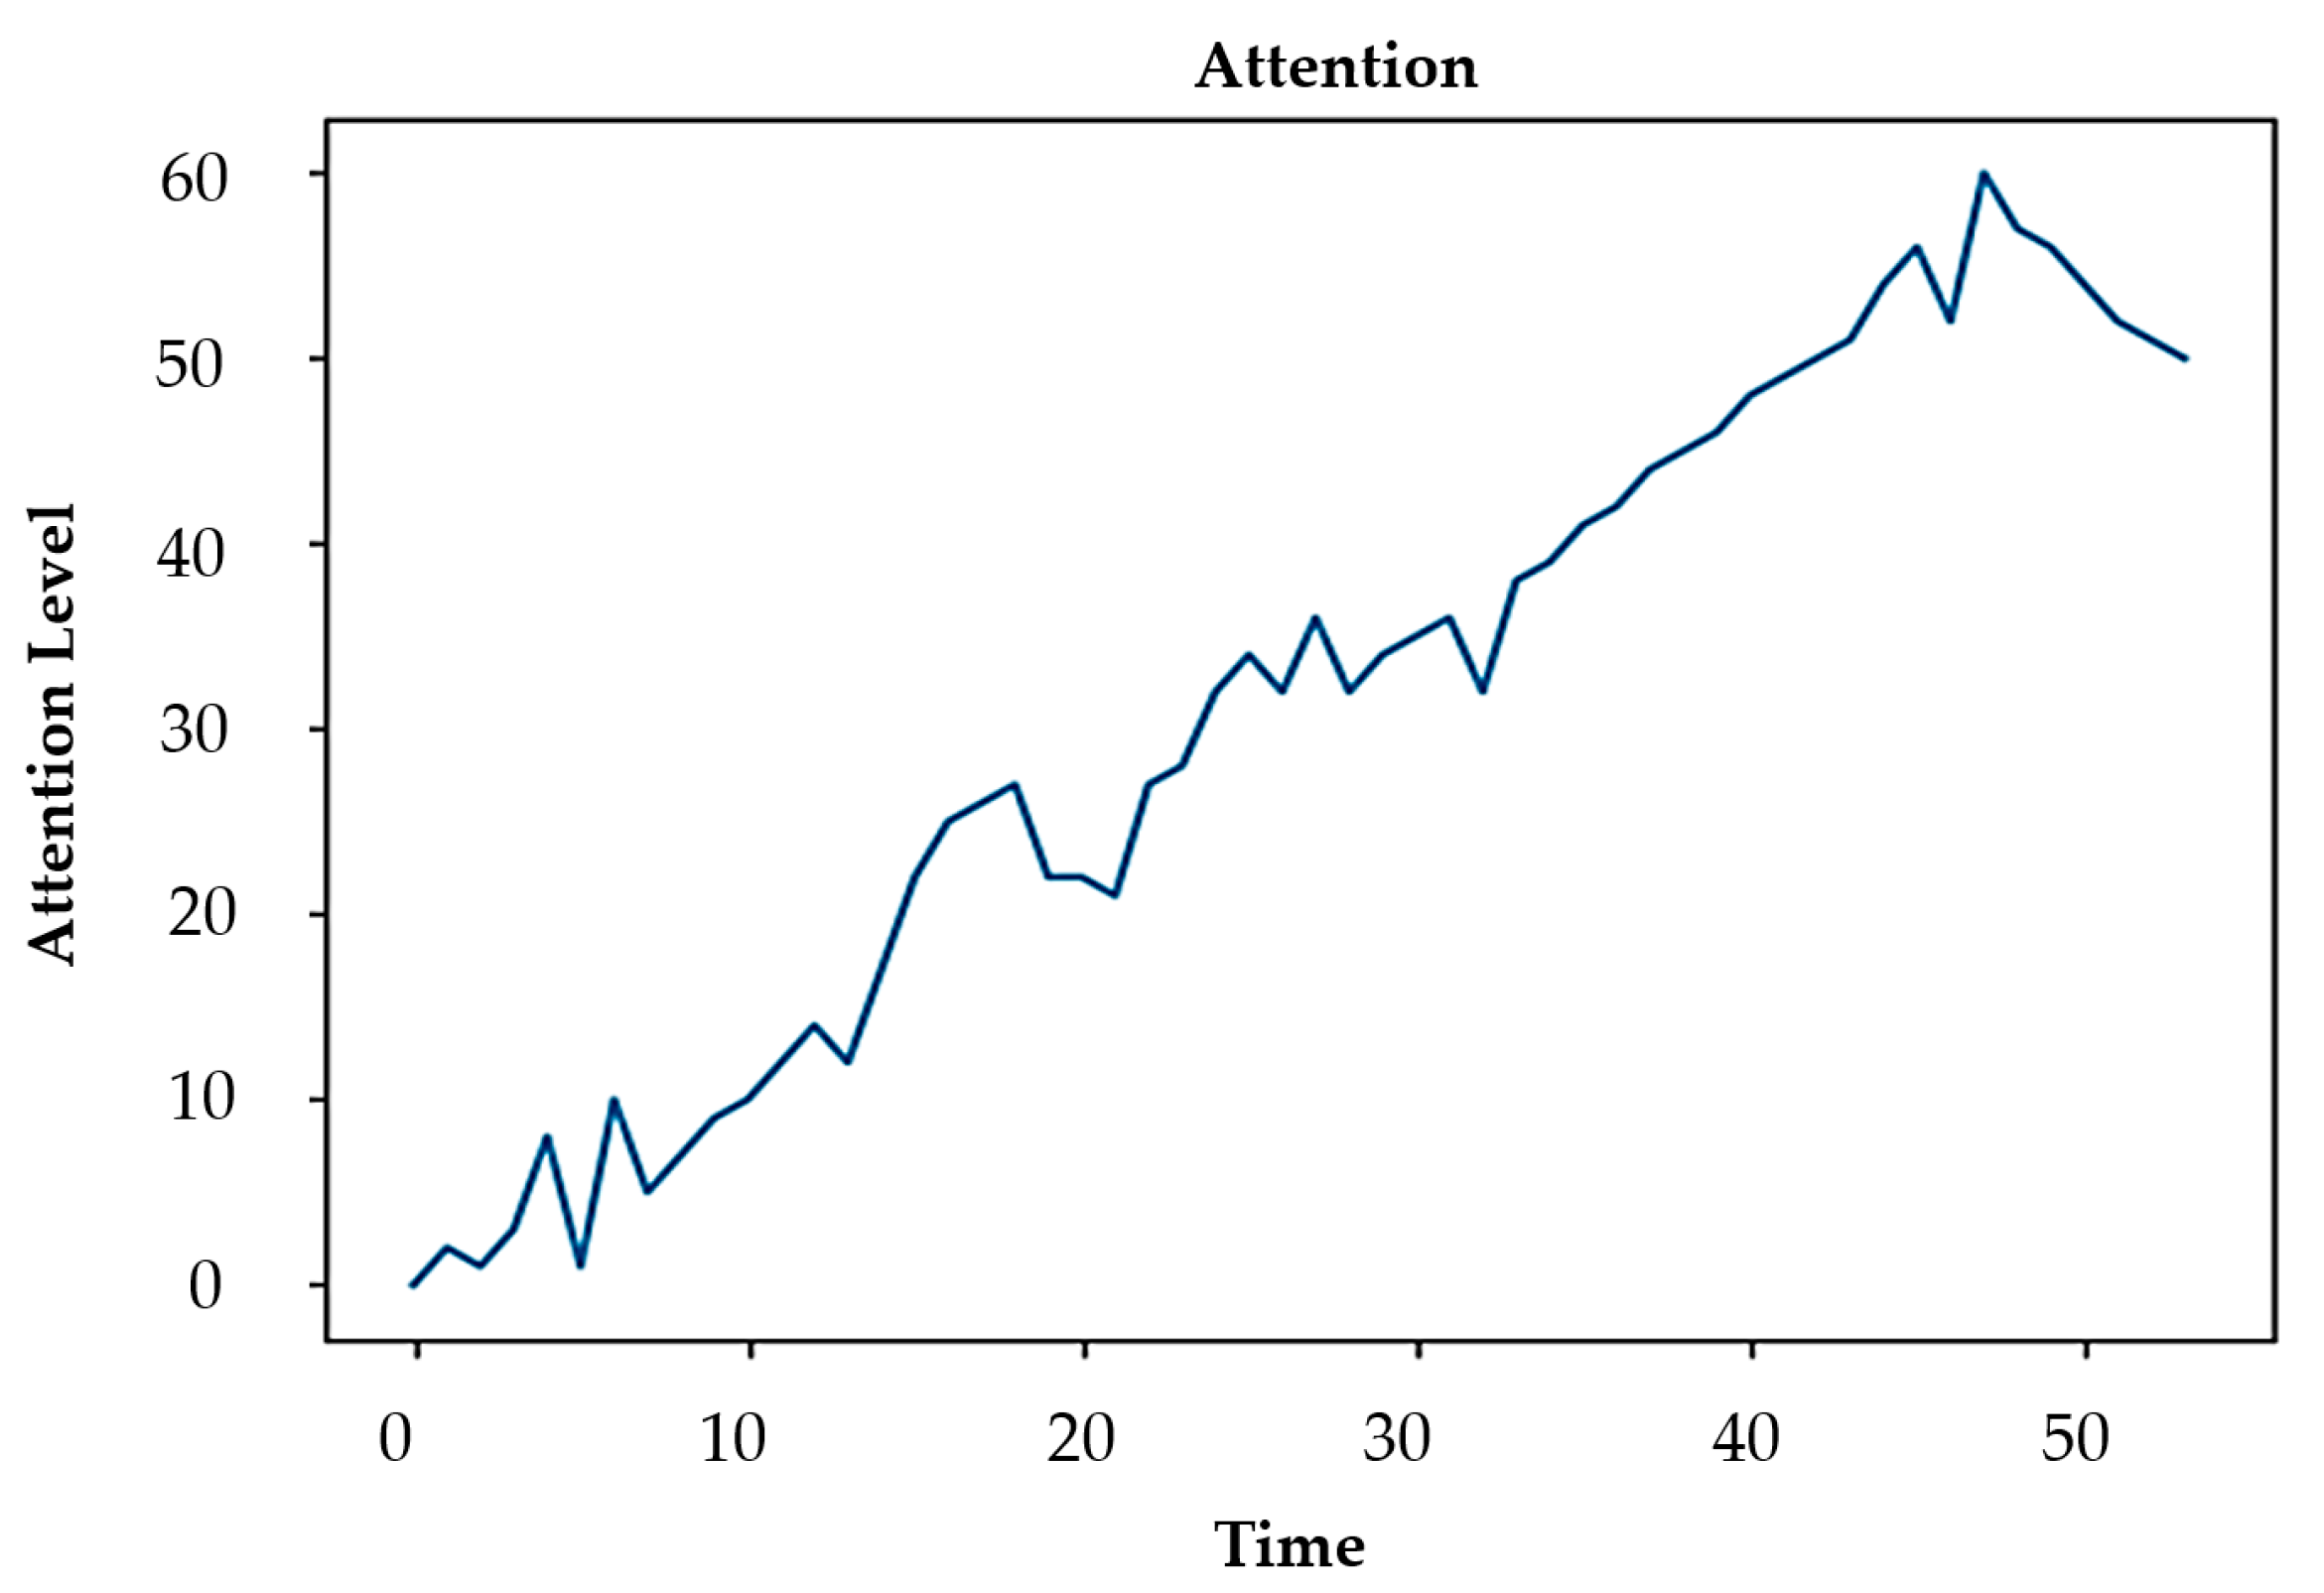
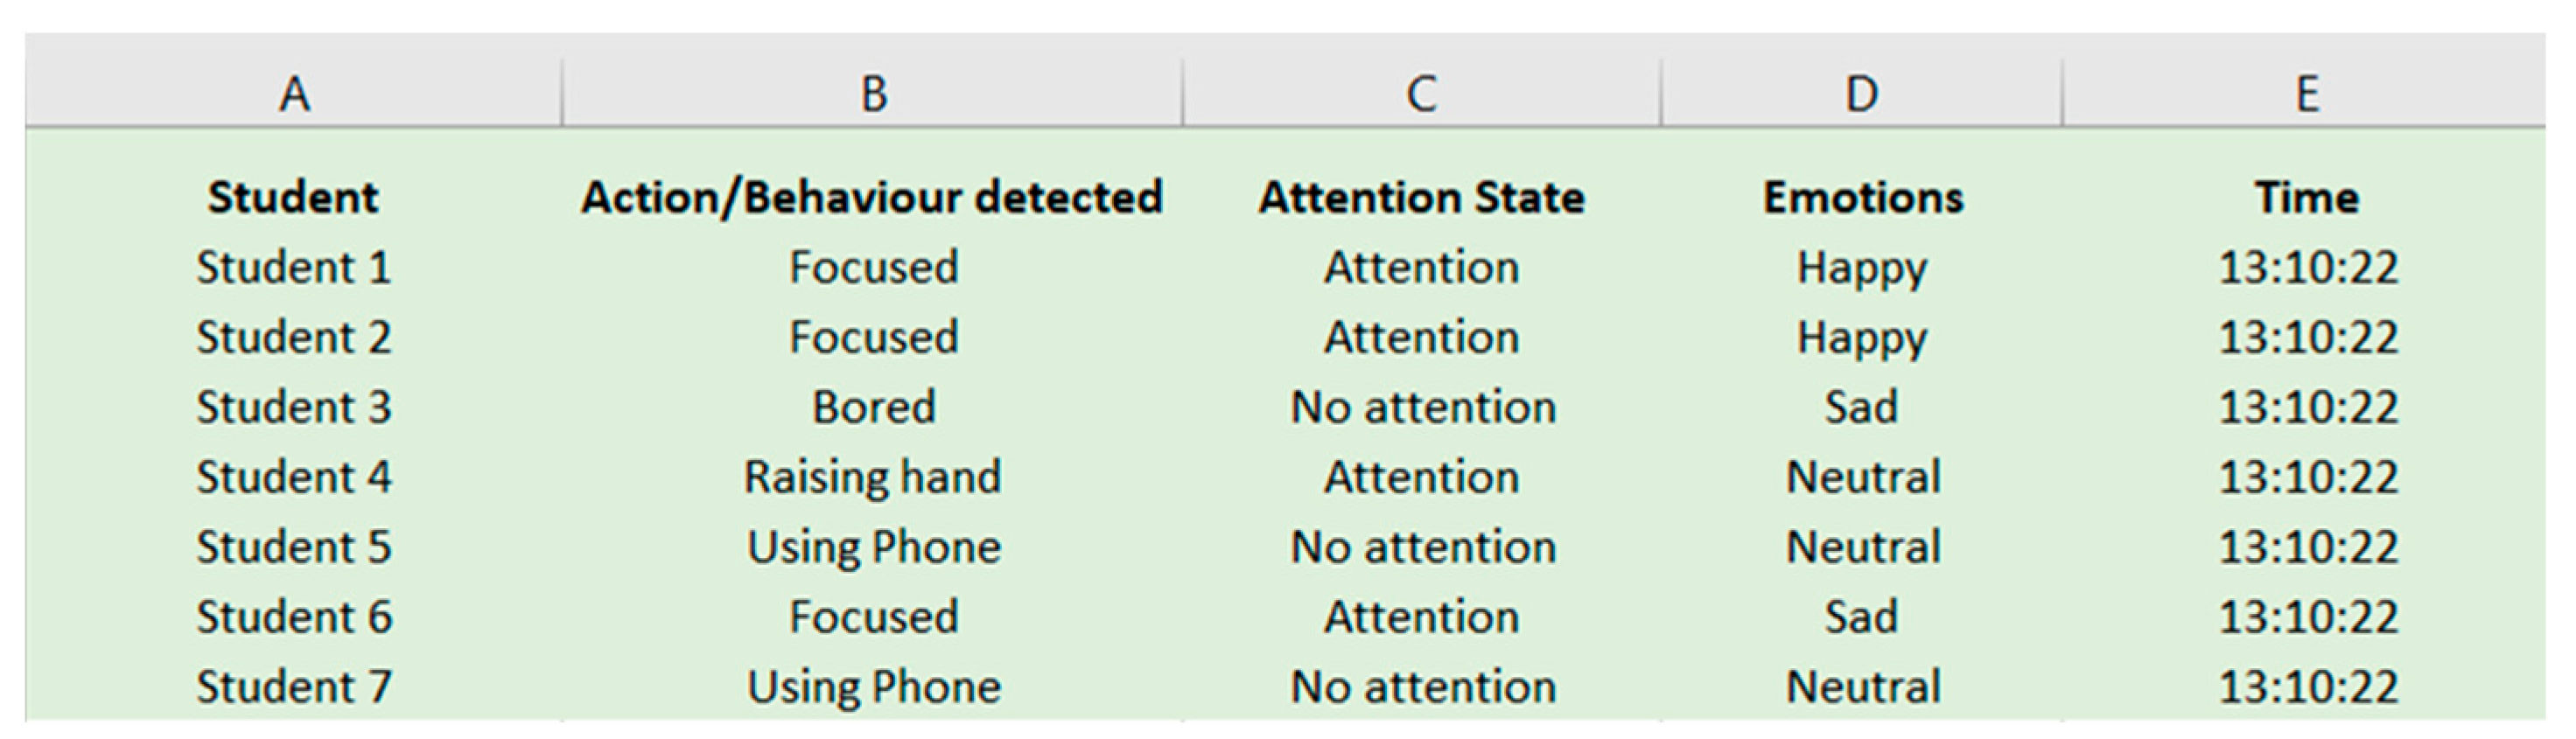
4.3. Classroom Experiment Result
5. Conclusions
Author Contributions
Funding
Informed Consent Statement
Data Availability Statement
Acknowledgments
Conflicts of Interest
References
- Sun, B.; Wu, Y.; Zhao, K.; He, J.; Yu, L.; Yan, H.; Luo, A. Student Class Behavior Dataset: A Video Dataset for Recognizing, Detecting, and Captioning Students’ Behaviors in Classroom Scenes. Neural Comput. Appl. 2021, 33, 8335–8354. [Google Scholar] [CrossRef]
- Carini, R.M.; Kuh, G.D.; Klein, S.P. Student Engagement and Student Learning: Testing the Linkages. Res. High Educ. 2006, 47, 1–32. [Google Scholar] [CrossRef] [Green Version]
- Gupta, S.; Kumar, P. Attention recognition system in online learning platform using eeg signals. In Emerging Technologies for Smart Cities: Select Proceedings of EGTET 2020; Springer: Singapore, 2021; pp. 139–152. [Google Scholar]
- Assessment, Evaluation, and Curriculum Redesign. Available online: https://www.thirteen.org/edonline/concept2class/assessment/index.html (accessed on 19 January 2023).
- Xin, X.; Shu-Jiang, Y.; Nan, P.; ChenXu, D.; Dan, L. Review on A big Data-Based Innovative Knowledge Teaching Evaluation System in Universities. J. Innov. Knowl. 2022, 7, 100197. [Google Scholar] [CrossRef]
- Willermark, S.; Gellerstedt, M. Facing radical digitalization: Capturing teachers’ transition to virtual classrooms through ideal type experiences. J. Educ. Comput. Res. 2022, 60, 1351–1372. [Google Scholar] [CrossRef]
- Saini, M.K.; Goel, N. How Smart Are Smart Classrooms? A Review of Smart Classroom Technologies. ACM Comput. Surv. 2019, 56, 1–28. [Google Scholar] [CrossRef] [Green Version]
- Wang, A.I.; Tahir, R. The Effect of Using Kahoot! For Learning—A Literature Review. Comput. Educ. 2020, 149, 103818. [Google Scholar] [CrossRef]
- Estudante, A.; Dietrich, N. Using augmented reality to stimulate students and diffuse escape game activities to larger audiences. J. Chem. Educ. 2020, 97, 1368–1374. [Google Scholar] [CrossRef]
- Bond, M.; Buntins, K.; Bedenlier, S.; Zawacki-Richter, O.; Kerres, M. Mapping Research in Student Engagement and Educational Technology in Higher Education: A Systematic Evidence Map. Int. J. Educ. Technol. High. Educ. 2020, 17, 2. [Google Scholar] [CrossRef]
- Sapci, A.H.; Sapci, H.A. Artificial Intelligence Education and Tools for Medical and Health Informatics Students: Systematic Review. JMIR Med. Educ. 2020, 6, e19285. [Google Scholar] [CrossRef]
- Chu, S.T.; Hwang, G.J.; Tu, Y.F. Artificial intelligence-based robots in education: A systematic review of selected SSCI publications. Comput. Educ. Artif. Intell. 2022, 3, 100091. [Google Scholar] [CrossRef]
- Guan, C.; Mou, J.; Jiang, Z. Artificial Intelligence Innovation in Education: A Twenty-Year Data-Driven Historical Analysis. Int. J. Innov. Stud. 2020, 4, 134–147. [Google Scholar] [CrossRef]
- González-Calatayud, V.; Prendes-Espinosa, P.; Roig-Vila, R. Artificial Intelligence for Student Assessment: A Systematic Review. Appl. Sci. 2021, 11, 5467. [Google Scholar] [CrossRef]
- Bender, W.N.; Smith, J.K. Classroom Behavior of Children and Adolescents with Learning Disabilities: A Meta-Analysis. J. Learn. Disabil. 1990, 23, 298–305. [Google Scholar] [CrossRef]
- Renawi, A.; Alnajjar, F.; Parambil, M.; Trabelsi, Z.; Gochoo, M.; Khalid, S.; Mubin, O. A Simplified Real-Time Camera-Based Attention Assessment System for Classrooms: Pilot Study. Educ. Inf. Technol. 2021, 2021, 4753–4770. [Google Scholar] [CrossRef]
- Attentive or Not? Toward a Machine Learning Approach to Assessing Students’ Visible Engagement in Classroom Instruction|SpringerLink. Available online: https://link.springer.com/article/10.1007/s10648-019-09514-z (accessed on 19 January 2023).
- Raca, M.; Dillenbourg, P. System for assessing classroom attention. In Proceedings of the Third International Conference on Learning Analytics and Knowledge, New York, NY, USA, 8–13 April 2013; Association for Computing Machinery: New York, NY, USA, 2013; pp. 265–269. [Google Scholar]
- Monitoring Students’ Attention in A Classroom Through Computer Vision. Available online: https://www.springerprofessional.de/en/monitoring-students-attention-in-a-classroom-through-computer-vi/15858720 (accessed on 19 January 2023).
- 2(PDF) Emotion Recognition and Detection Methods: A Comprehensive Survey. Available online: https://www.researchgate.net/publication/339119986_Emotion_Recognition_and_Detection_Methods_A_Comprehensive_Survey (accessed on 19 January 2023).
- Zaletelj, J.; Košir, A. Predicting Students’ Attention in the Classroom from Kinect Facial and Body Features. EURASIP J. Image Video Process. 2017, 2017, 80. [Google Scholar] [CrossRef] [Green Version]
- Ngoc Anh, B.; Tung Son, N.; Truong Lam, P.; Phuong Chi, L.; Huu Tuan, N.; Cong Dat, N.; Huu Trung, N.; Umar Aftab, M.; Van Dinh, T. A Computer-Vision Based Application for Student Behavior Monitoring in Classroom. Appl. Sci. 2019, 9, 4729. [Google Scholar] [CrossRef] [Green Version]
- Translating Head Motion into Attention—Towards Processing of Student’s Body-Language. Available online: https://files.eric.ed.gov/fulltext/ED560534.pdf (accessed on 22 January 2023).
- Broussard, D.M.; Rahman, Y.; Kulshreshth, A.K.; Borst, C.W. An Interface for Enhanced Teacher Awareness of Student Actions and Attention in a VR Classroom. In Proceedings of the 2021 IEEE Conference on Virtual Reality and 3D User Interfaces Abstracts and Workshops (VRW), Lisbon, Portugal, 37 March–1 April 2021; pp. 284–290. [Google Scholar]
- Lin, F.C.; Ngo, H.H.; Dow, C.R.; Lam, K.H.; Le, H.L. Student Behavior Recognition System for the Classroom Environment Based on Skeleton Pose Estimation and Person Detection. Sensors 2021, 21, 5314. [Google Scholar] [CrossRef]
- Liu, N.H.; Chiang, C.Y.; Chu, H.C. Recognizing the Degree of Human Attention Using EEG Signals from Mobile Sensors. sensors 2013, 13, 10273–10286. [Google Scholar] [CrossRef]
- Chen, C.M.; Wang, J.Y.; Yu, C.M. Assessing the Attention Levels of Students by Using a Novel Attention Aware System Based on Brainwave Signals. Br. J. Educ. Technol. 2017, 48, 348–369. [Google Scholar] [CrossRef]
- Zhu, Z.; Ober, S.; Jafari, R. Modeling and Detecting Student Attention and Interest Level Using Wearable Computers. In Proceedings of the 2017 IEEE 14th International Conference on Wearable and Implantable Body Sensor Networks (BSN), Eindhoven, The Netherlands, 9–12 May 2017; pp. 13–18. [Google Scholar]
- Li, Q.; Ren, Y.; Wei, T.; Wang, C.; Liu, Z.; Yue, J. A Learning Attention Monitoring System via Photoplethysmogram Using Wearable Wrist Devices. In Artificial Intelligence Supported Educational Technologies; Advances in Analytics for Learning and Teaching; Pinkwart, N., Liu, S., Eds.; Springer International Publishing: Cham, Germany, 2020; pp. 133–150. ISBN 978-3-030-41099-5. [Google Scholar]
- Hutt, S.; Krasich, K.; Brockmole, J.R.; K. D’Mello, S. Breaking out of the Lab: Mitigating Mind Wandering with Gaze-Based Attention-Aware Technology in Classrooms. In Proceedings of the 2021 CHI Conference on Human Factors in Computing Systems, Yokohama, Japan, 8–13 May 2021; Association for Computing Machinery: New York, NY, USA, 2021; pp. 1–14. [Google Scholar]
- Zhang, X.; Wu, C.W.; Fournier-Viger, P.; Van, L.D.; Tseng, Y.C. Analyzing Students’ Attention in Class Using Wearable Devices. In Proceedings of the 2017 IEEE 18th International Symposium on A World of Wireless, Mobile and Multimedia Networks (WoWMoM), Macau, China, 12–15 June 2017; pp. 1–9. [Google Scholar]
- Hernandez-de-Menendez, M.; Escobar Díaz, C.; Morales-Menendez, R. Technologies for the Future of Learning: State of the Art. Int. J. Interact. Des. Manuf. 2020, 14, 683–695. [Google Scholar] [CrossRef]
- Bosch, N.; D’Mello, S.K.; Baker, R.S.; Ocumpaugh, J.; Shute, V.; Ventura, M.; Wang, L.; Zhao, W. Detecting Student Emotions in Computer-Enabled Classrooms. In Proceedings of the Twenty-Fifth International Joint Conference on Artificial Intelligence, Palo Alto, CA, USA, 9–15 July 2016; AAAI Press: New York, NY, USA, 2016; pp. 4125–4129. [Google Scholar]
- Savva, A.; Stylianou, V.; Kyriacou, K.; Domenach, F. Recognizing Student Facial Expressions: A Web Application. In Proceedings of the 2018 IEEE Global Engineering Education Conference (EDUCON), Santa Cruz de Tenerife, Spain, 17–20 April 2018; pp. 1459–1462. [Google Scholar]
- Nicolas-Mindoro, J. Class-EyeTention A Machine Vision Inference Approach of Student Attentiveness’ Detection. Int. J. Adv. Trends Comput. Sci. Eng. 2020, 9, 5490–5496. [Google Scholar] [CrossRef]
- King, R.B.; Chen, J. Emotions in Education: Asian Insights on the Role of Emotions in Learning and Teaching. Asia-Pac. Edu Res 2019, 28, 279–281. [Google Scholar] [CrossRef] [Green Version]
- Girshick, R.; Donahue, J.; Darrell, T.; Malik, J. Rich Feature Hierarchies for Accurate Object Detection and Semantic Segmentation. arXiv 2014, arXiv:1311.2524. [Google Scholar]
- Ren, S.; He, K.; Girshick, R.; Sun, J. Faster R-CNN: Towards Real-Time Object Detection with Region Proposal Networks. In Proceedings of the Advances in Neural Information Processing Systems, Montreal, QC, Canada, 7–12 December 2015; Curran Associates Inc.: New York, NY, USA, 2015; Volume 28. [Google Scholar]
- Redmon, J.; Divvala, S.; Girshick, R.; Farhadi, A. You Only Look Once: Unified, Real-Time Object Detection. In Proceedings of the IEEE Computer Society Annual Symposium on VLSI, Pittsburgh, PA, USA, 11–13 July 2016; pp. 779–788. [Google Scholar]
- Yao, J.; Qi, J.; Zhang, J.; Shao, H.; Yang, J.; Li, X. A Real-Time Detection Algorithm for Kiwifruit Defects Based on YOLOv5. Electronics 2021, 10, 1711. [Google Scholar] [CrossRef]
- Dwivedi, P. YOLOv5 Compared to Faster RCNN. Who Wins? Available online: https://towardsdatascience.com/yolov5-compared-to-faster-rcnn-who-wins-a771cd6c9fb4 (accessed on 19 January 2023).
- Chablani, M. YOLO—You Only Look Once, Real Time Object Detection Explained. Available online: https://towardsdatascience.com/yolo-you-only-look-once-real-time-object-detection-explained-492dc9230006 (accessed on 19 January 2023).
- Otgonbold, M.E.; Gochoo, M.; Alnajjar, F.; Ali, L.; Tan, T.H.; Hsieh, J.W.; Chen, P.Y. SHELK: An Extended Dataset and Benchmarking for Safety Helmet Detection. Sensors 2022, 22, 2315. [Google Scholar] [CrossRef] [PubMed]
- Jocher, G.; Stoken, A.; Borovec, J.; Christopher, S.T.A.N.; Laughing, L.C. Ultralytics/Yolov5: V4.0—Nn.SiLU() Activations, Weights & Biases Logging, PyTorch Hub Integration. 2021. Available online: https://zenodo.org/record/4418161. (accessed on 20 July 2022).
- Ali, L.; Alnajjar, F.; Parambil, M.M.A.; Younes, M.I.; Abdelhalim, Z.I.; Aljassmi, H. Development of YOLOv5-Based Real-Time Smart Monitoring System for Increasing Lab Safety Awareness in Educational Institutions. Sensors 2022, 22, 8820. [Google Scholar] [CrossRef]
- Wojke, N.; Bewley, A.; Paulus, D. Simple Online and Realtime Tracking with A Deep Association Metric. In Proceedings of the 2017 IEEE International Conference on Image Processing (ICIP), Beijing, China, 17–20 September 2017; pp. 3645–3649. [Google Scholar]
- Introduction to Kalman Filter and Its Applications. Available online: https://www.intechopen.com/chapters/63164 (accessed on 22 January 2023).
- Dwivedi, P. People Tracking Using Deep Learning. Available online: https://towardsdatascience.com/people-tracking-using-deep-learning-5c90d43774be (accessed on 19 January 2023).
- Padilla, R.; Filho, C.; Costa, M. Evaluation of Haar Cascade Classifiers for Face Detection. Venice Italy World Acad. Sci. 2012, 6. [Google Scholar]
- Alexandrova, S.; Tatlock, Z.; Cakmak, M. RoboFlow: A Flow-Based Visual Programming Language for Mobile Manipulation Tasks. In Proceedings of the 2015 IEEE International Conference on Robotics and Automation (ICRA), Seattle, WA, USA, 25–30 May 2015; pp. 5537–5544. [Google Scholar]
- Tzutalin. LabelImg. Git Code. 2015. Available online: https://github.com/tzutalin/labelImg (accessed on 20 July 2022).
- Mollahosseini, A.; Hasani, B.; Mahoor, M.H. AffectNet: A Database for Facial Expression, Valence, and Arousal Computing in the Wild. IEEE Trans. Affect. Comput. 2019, 10, 18–31. [Google Scholar] [CrossRef] [Green Version]
- Anwar, A.; Raychowdhury, A. Masked Face Recognition for Secure Authentication. 2020. Available online: https://arxiv.org/abs/2008.11104 (accessed on 19 January 2023).
- Parambil, M.M.A.; Ali, L.; Alnajjar, F.; Gochoo, M. Smart Classroom: A Deep Learning Approach towards Attention Assessment through Class Behavior Detection. In Proceedings of the 2022 Advances in Science and Engineering Technology International Conferences (ASET), Dubai, United Arab Emirates, 21–24 February 2022; pp. 1–6. [Google Scholar]
- Personalized Robot Interventions for Autistic Children: An Automated Methodology for Attention Assessment|SpringerLink. Available online: https://link.springer.com/article/10.1007/s12369-020-00639-8 (accessed on 19 January 2023).


| Size (Resolution) | Number of Images |
|---|---|
| Tiny (<100 × 100) | 14 |
| Small | 342 |
| Medium | 1508 |
| Large | 1123 |
| Jumbo (>1024 × 1024) | 894 |
| Tiny (<100 × 100) | 14 |
| Total | 3881 |
| Models | Precision | Recall | mAP@0.5 | F1 | Model Sizes (KB) |
|---|---|---|---|---|---|
| YOLOv5n | 0.731 | 0.737 | 0.723 | 0.705 | 3806 |
| YOLOv5s | 0.752 | 0.742 | 0.762 | 0.744 | 14,115 |
| YOLOv5m | 0.762 | 0.752 | 0.765 | 0.736 | 41,273 |
| YOLOv5l | 0.773 | 0.764 | 0.767 | 0.768 | 90,733 |
| YOLOv5x | 0.784 | 0.775 | 0.767 | 0.779 | 169,141 |
Disclaimer/Publisher’s Note: The statements, opinions and data contained in all publications are solely those of the individual author(s) and contributor(s) and not of MDPI and/or the editor(s). MDPI and/or the editor(s) disclaim responsibility for any injury to people or property resulting from any ideas, methods, instructions or products referred to in the content. |
© 2023 by the authors. Licensee MDPI, Basel, Switzerland. This article is an open access article distributed under the terms and conditions of the Creative Commons Attribution (CC BY) license (https://creativecommons.org/licenses/by/4.0/).
Share and Cite
Trabelsi, Z.; Alnajjar, F.; Parambil, M.M.A.; Gochoo, M.; Ali, L. Real-Time Attention Monitoring System for Classroom: A Deep Learning Approach for Student’s Behavior Recognition. Big Data Cogn. Comput. 2023, 7, 48. https://doi.org/10.3390/bdcc7010048
Trabelsi Z, Alnajjar F, Parambil MMA, Gochoo M, Ali L. Real-Time Attention Monitoring System for Classroom: A Deep Learning Approach for Student’s Behavior Recognition. Big Data and Cognitive Computing. 2023; 7(1):48. https://doi.org/10.3390/bdcc7010048
Chicago/Turabian StyleTrabelsi, Zouheir, Fady Alnajjar, Medha Mohan Ambali Parambil, Munkhjargal Gochoo, and Luqman Ali. 2023. "Real-Time Attention Monitoring System for Classroom: A Deep Learning Approach for Student’s Behavior Recognition" Big Data and Cognitive Computing 7, no. 1: 48. https://doi.org/10.3390/bdcc7010048