
A Hybrid Deep Learning Framework with Decision-Level Fusion for Breast Cancer Survival Prediction

Abstract
:1. Introduction
- In this study, we present a novel hybrid DL (CNN-LSTM+ CNN-GRU) model that automatically extracts features from the METABRIC dataset and classifies patients as long-term survivors and short-term survivors to minimize pathologist errors;
- It is suggested that the hybrid DL model (CNN-LSTM + CNN-GRU) be used to effectively classify breast cancer survival prediction in medical research;
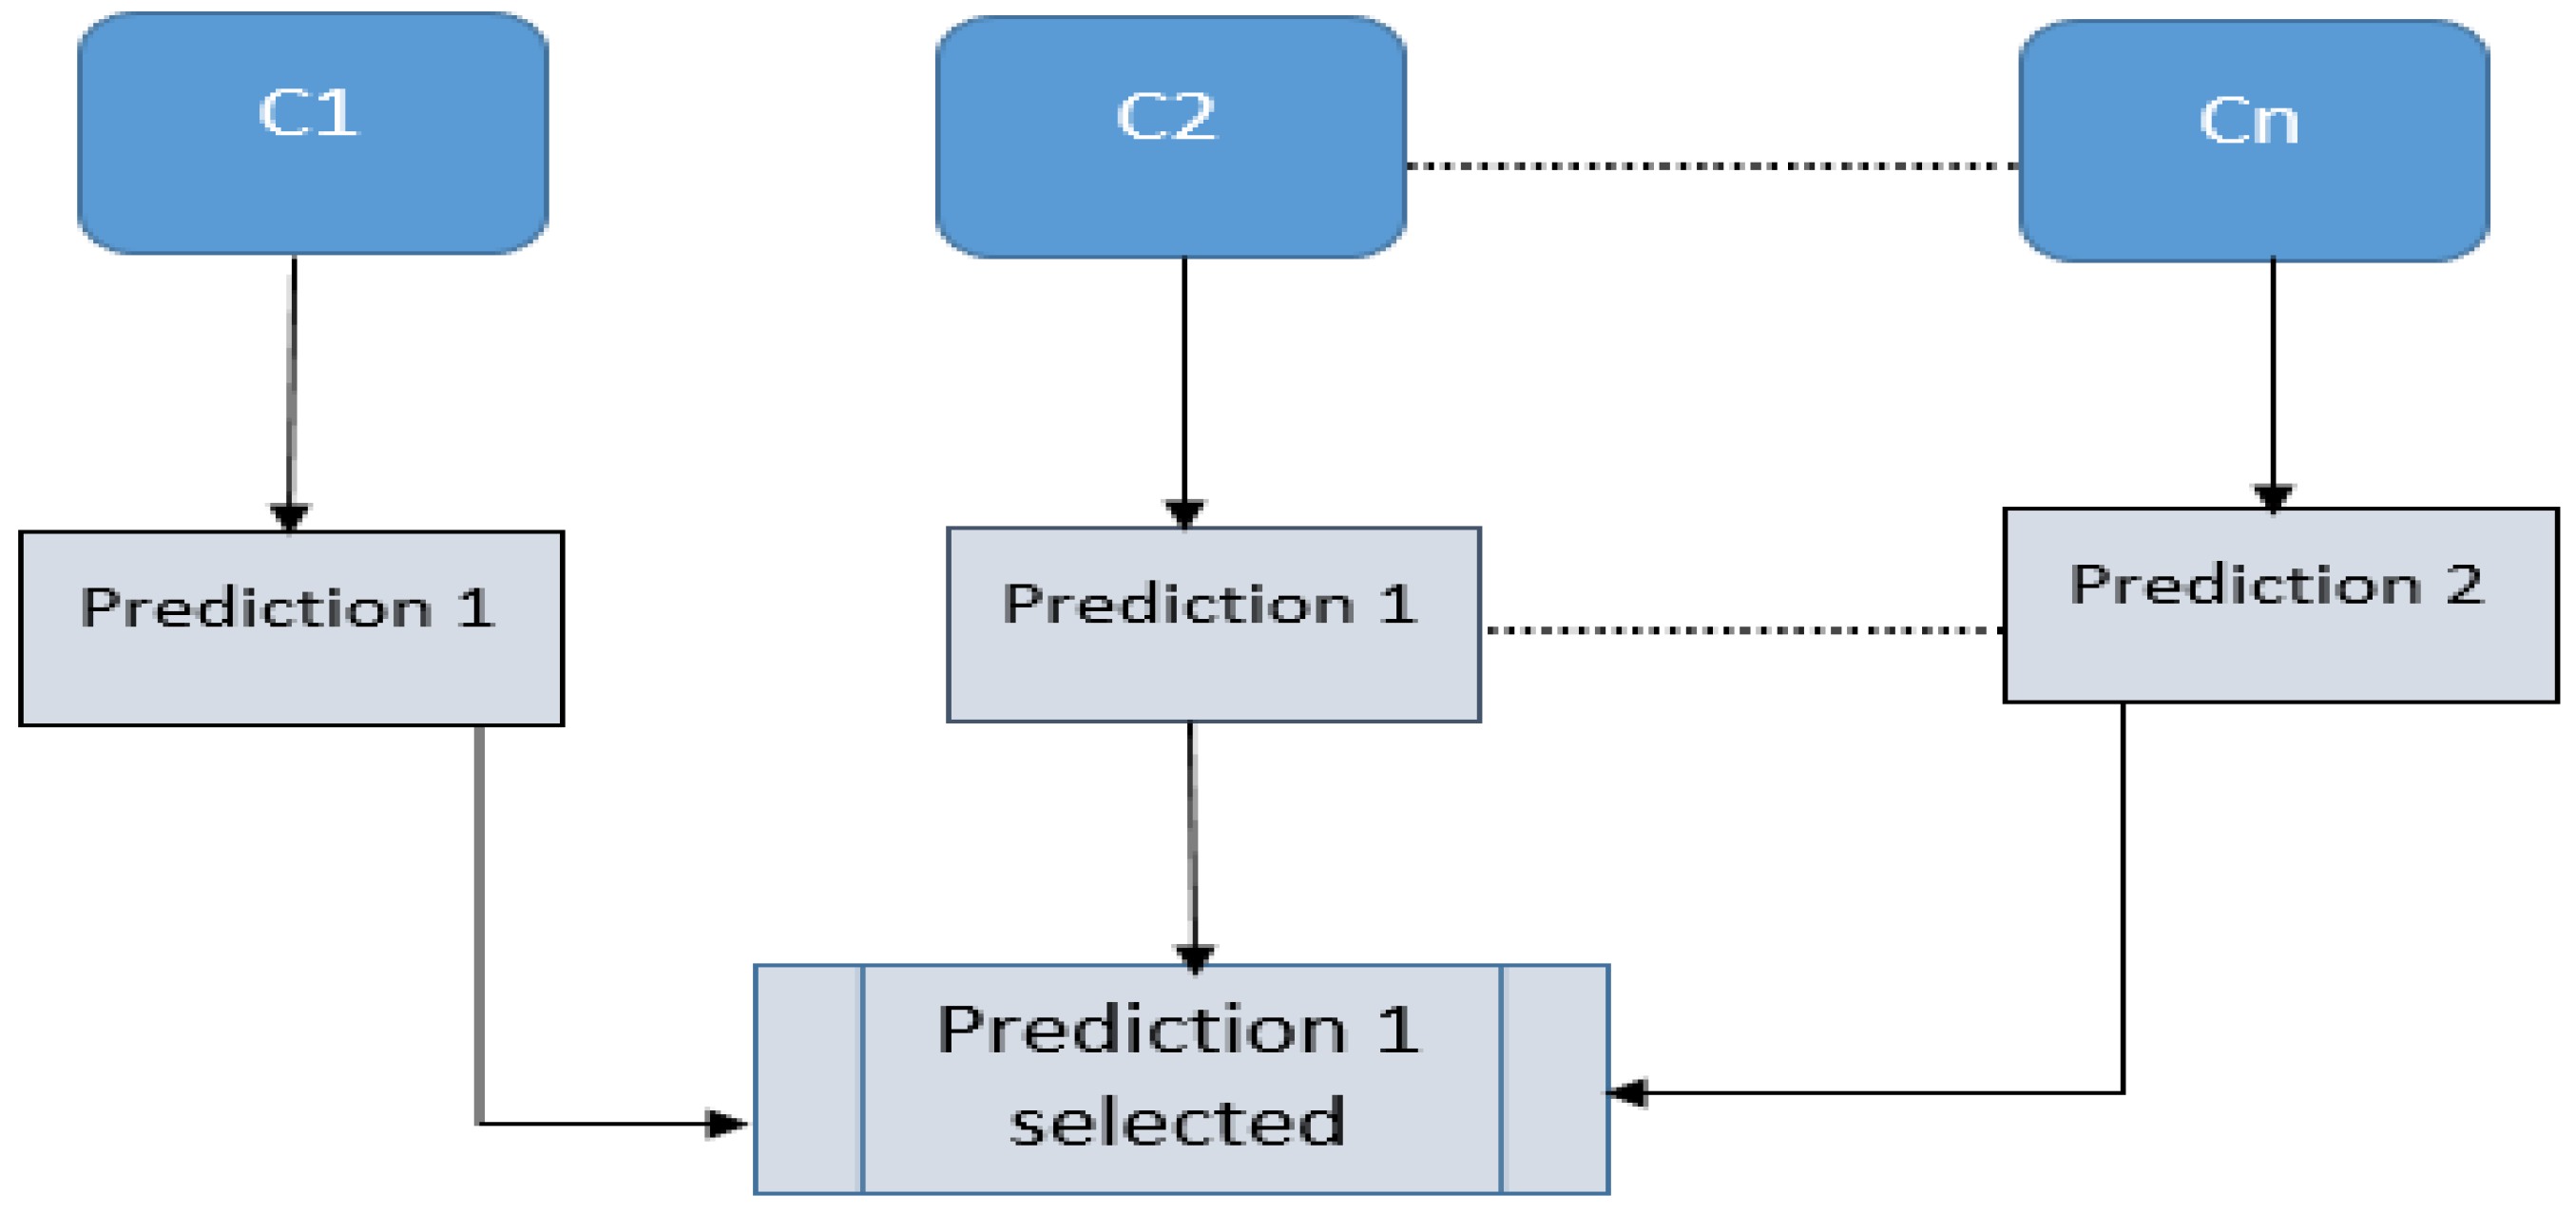
- An ensemble model is presented that provides highly accurate breast cancer prediction. The final prediction is made via a voting mechanism;
- The suggested CNN-LSTM, CNN-GRU, and hard voting (LSTM-GRU) models were evaluated, and their major performance measures were compared to current prediction models using the same dataset (METABRIC). In comparison to other models, we found that the suggested hybrid deep learning model achieves outstanding classification results;
2. Related Work
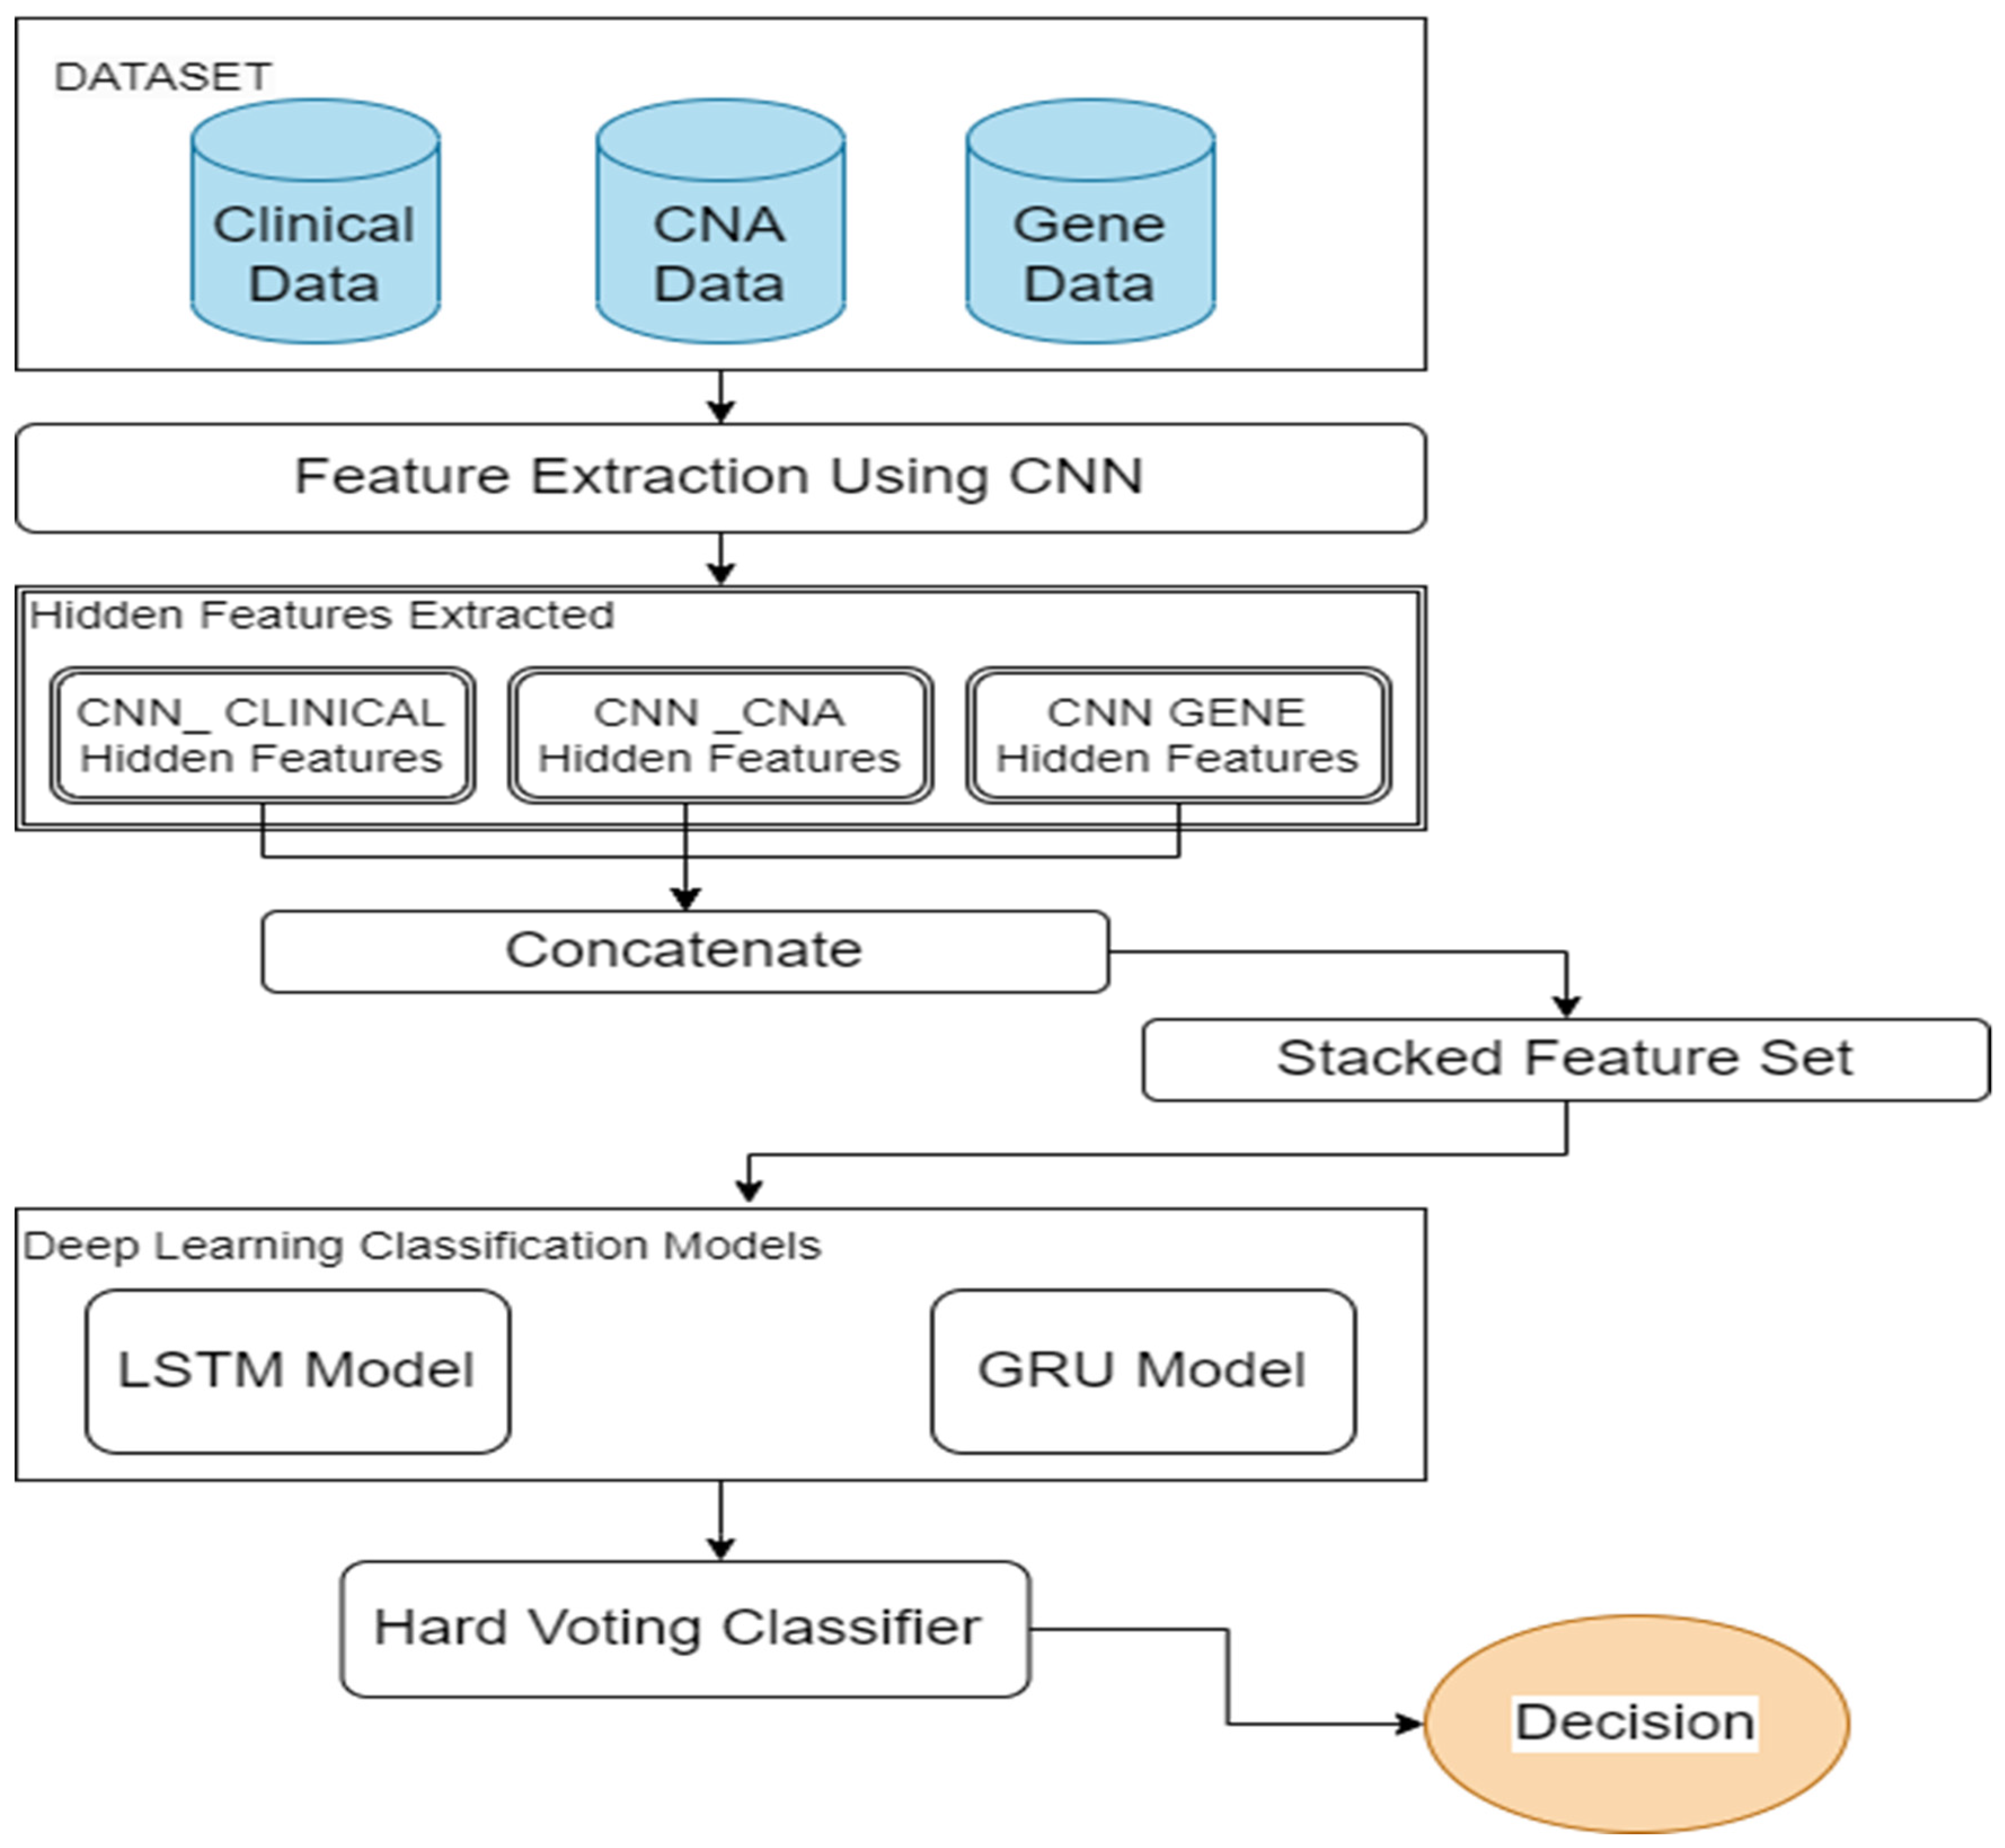
3. Proposed Method
3.1. Feature Selection
3.2. Feature Extraction and Feature Fusion
3.3. Deep Learning Classification Models and Decision-Level Fusion
4. Results Evaluation
4.1. Dataset Description
4.2. Evaluation Criteria
5. Experimental Results
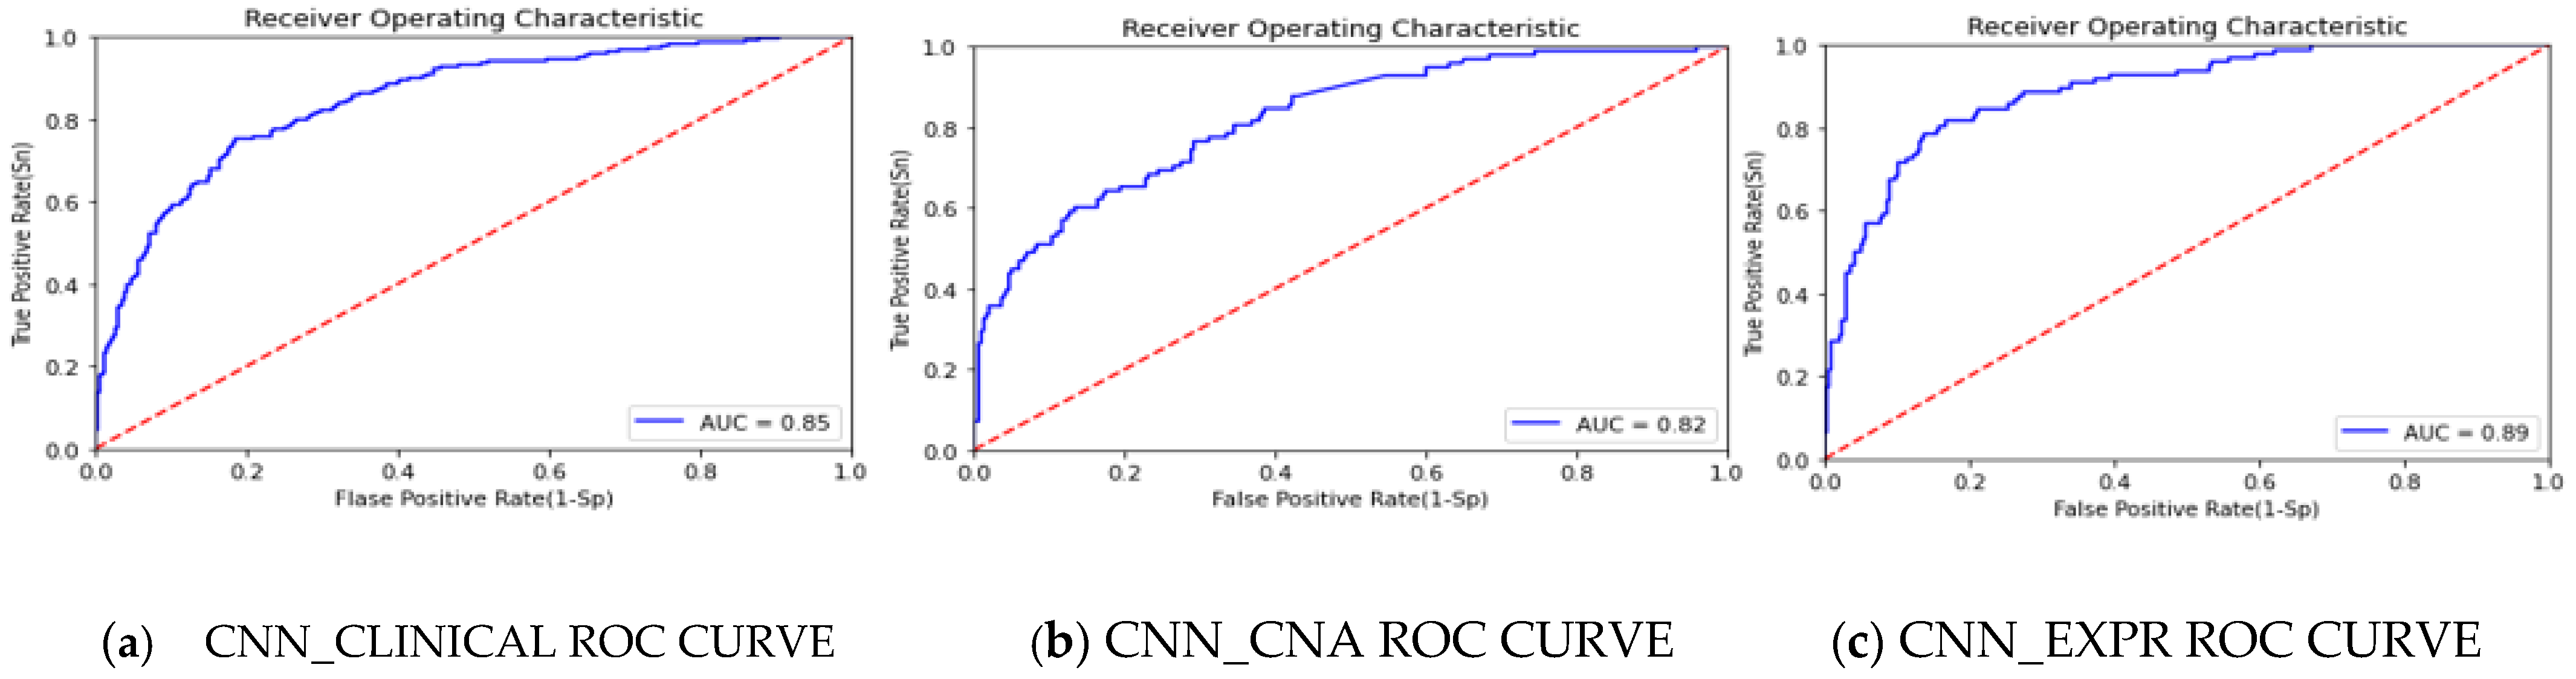
5.1. Performance Metrics of Unimodal CNN
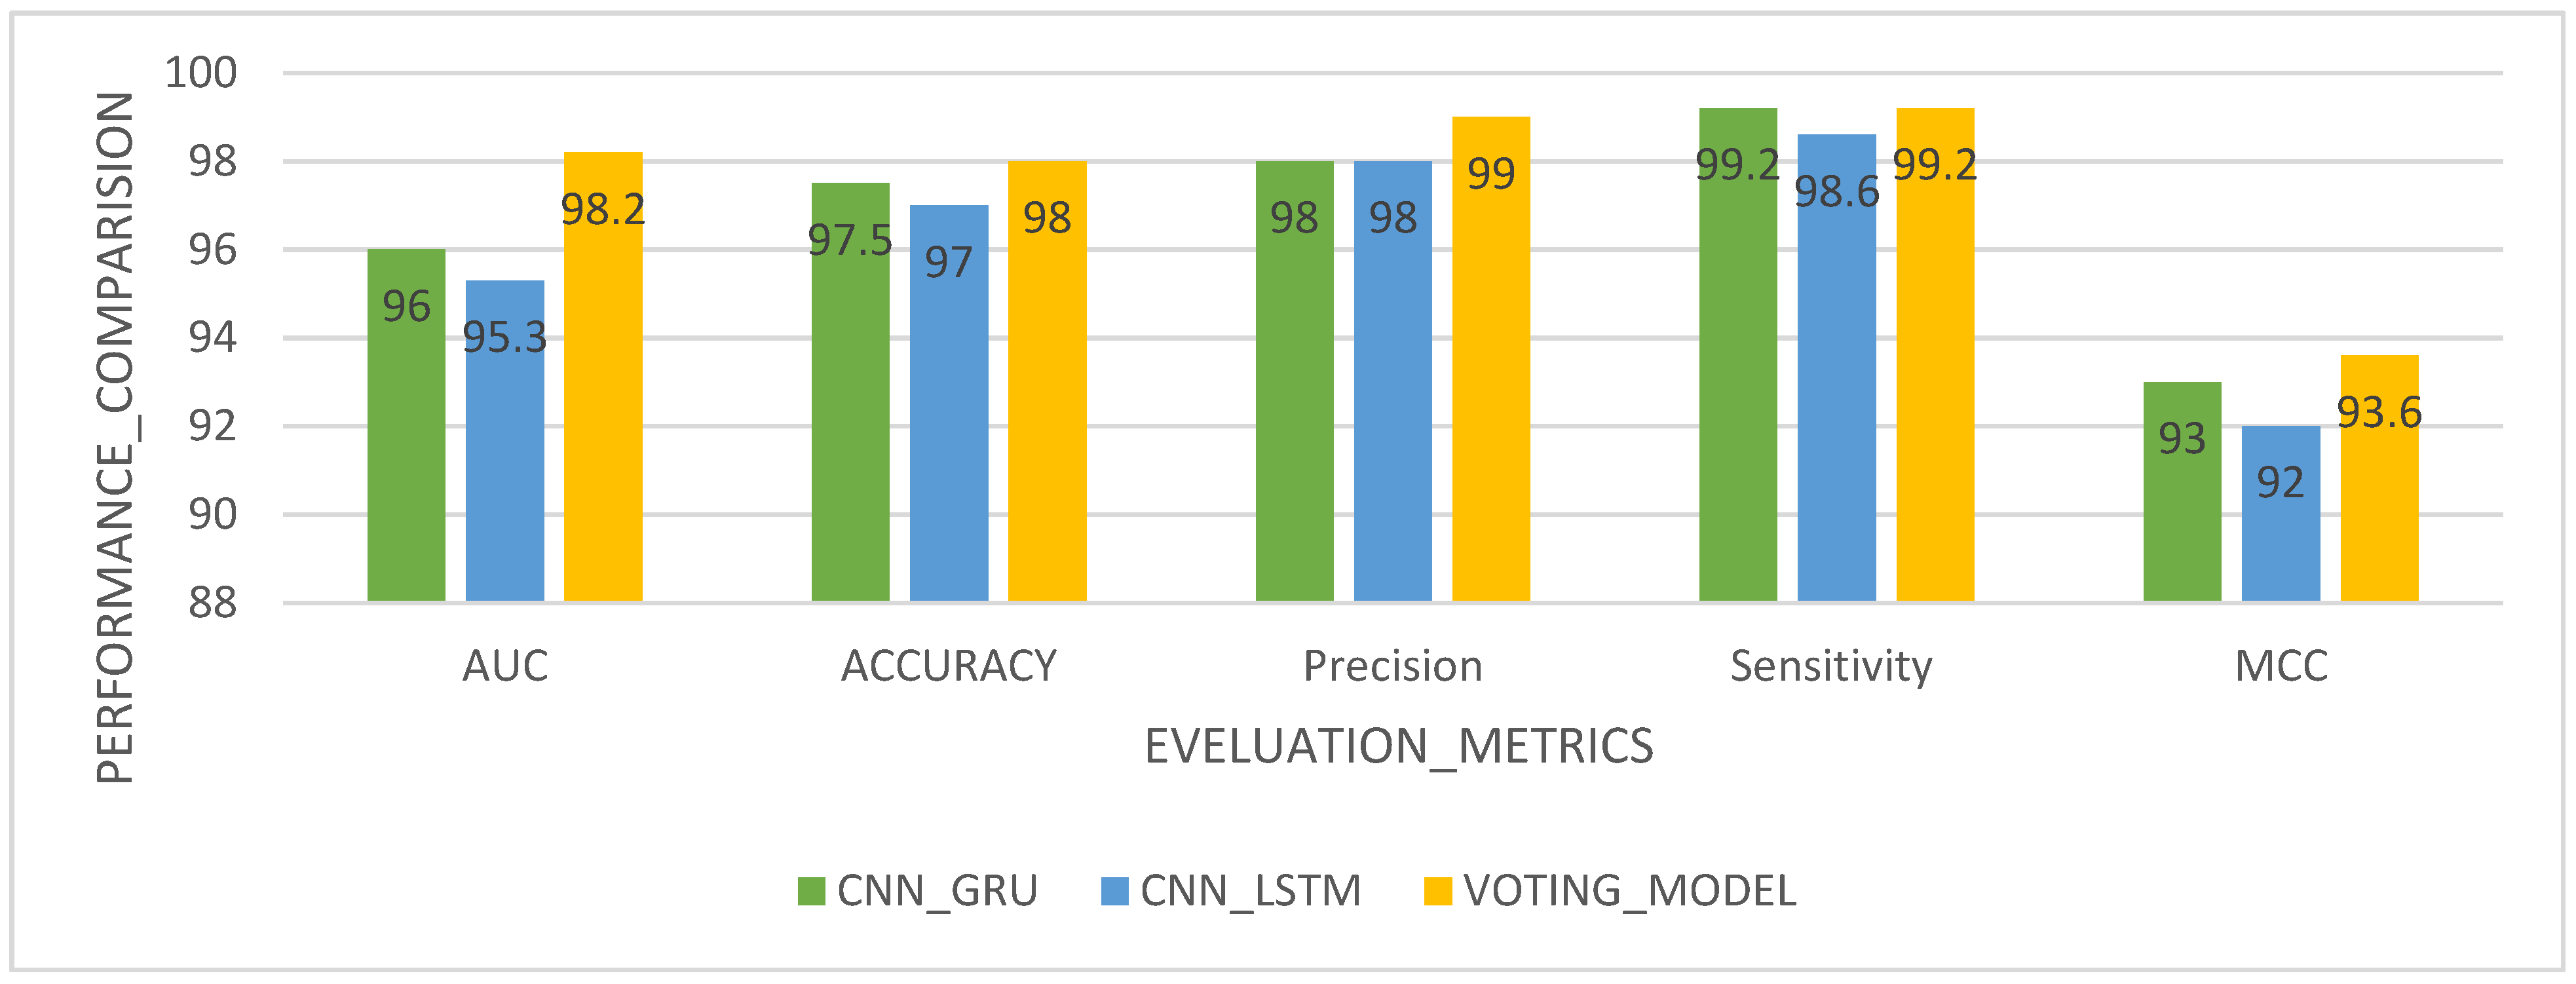
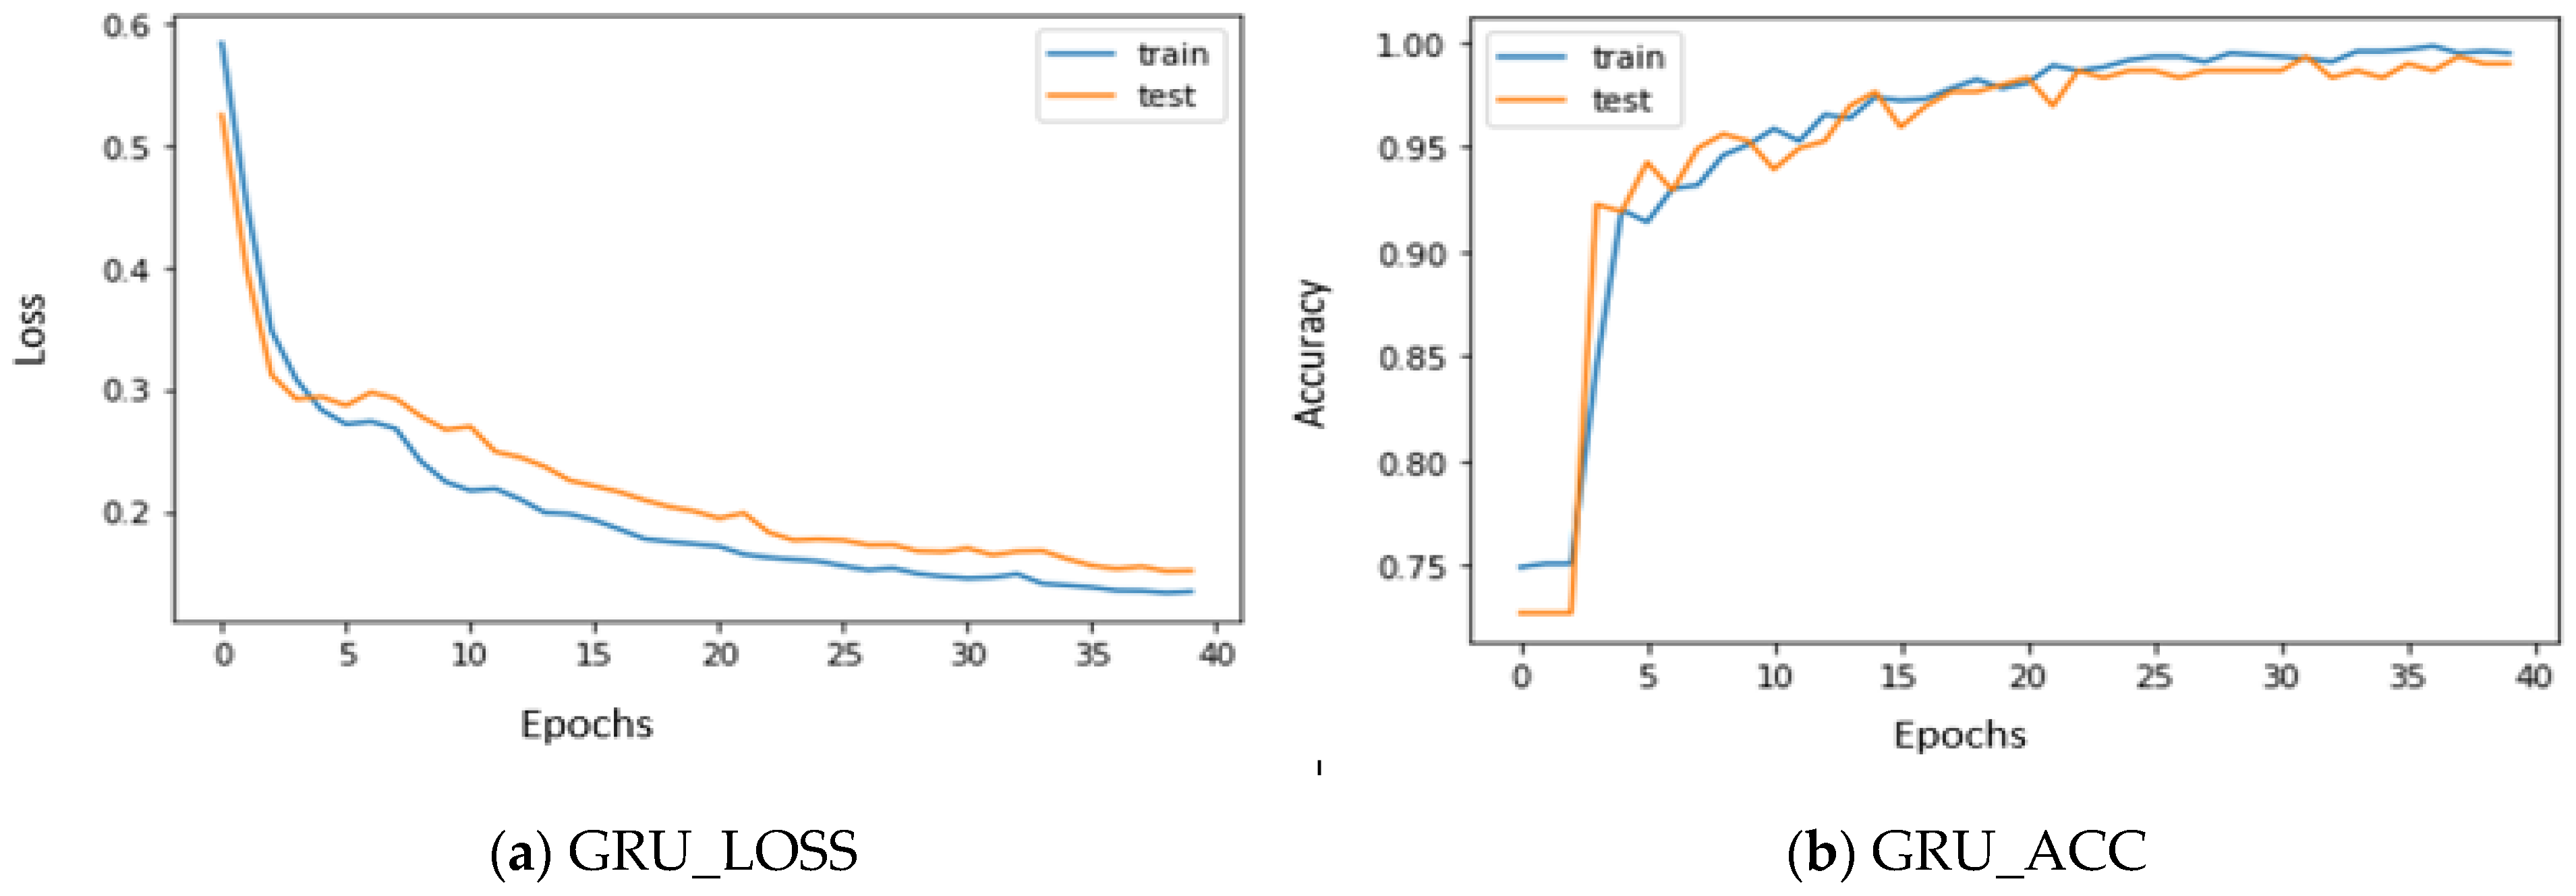
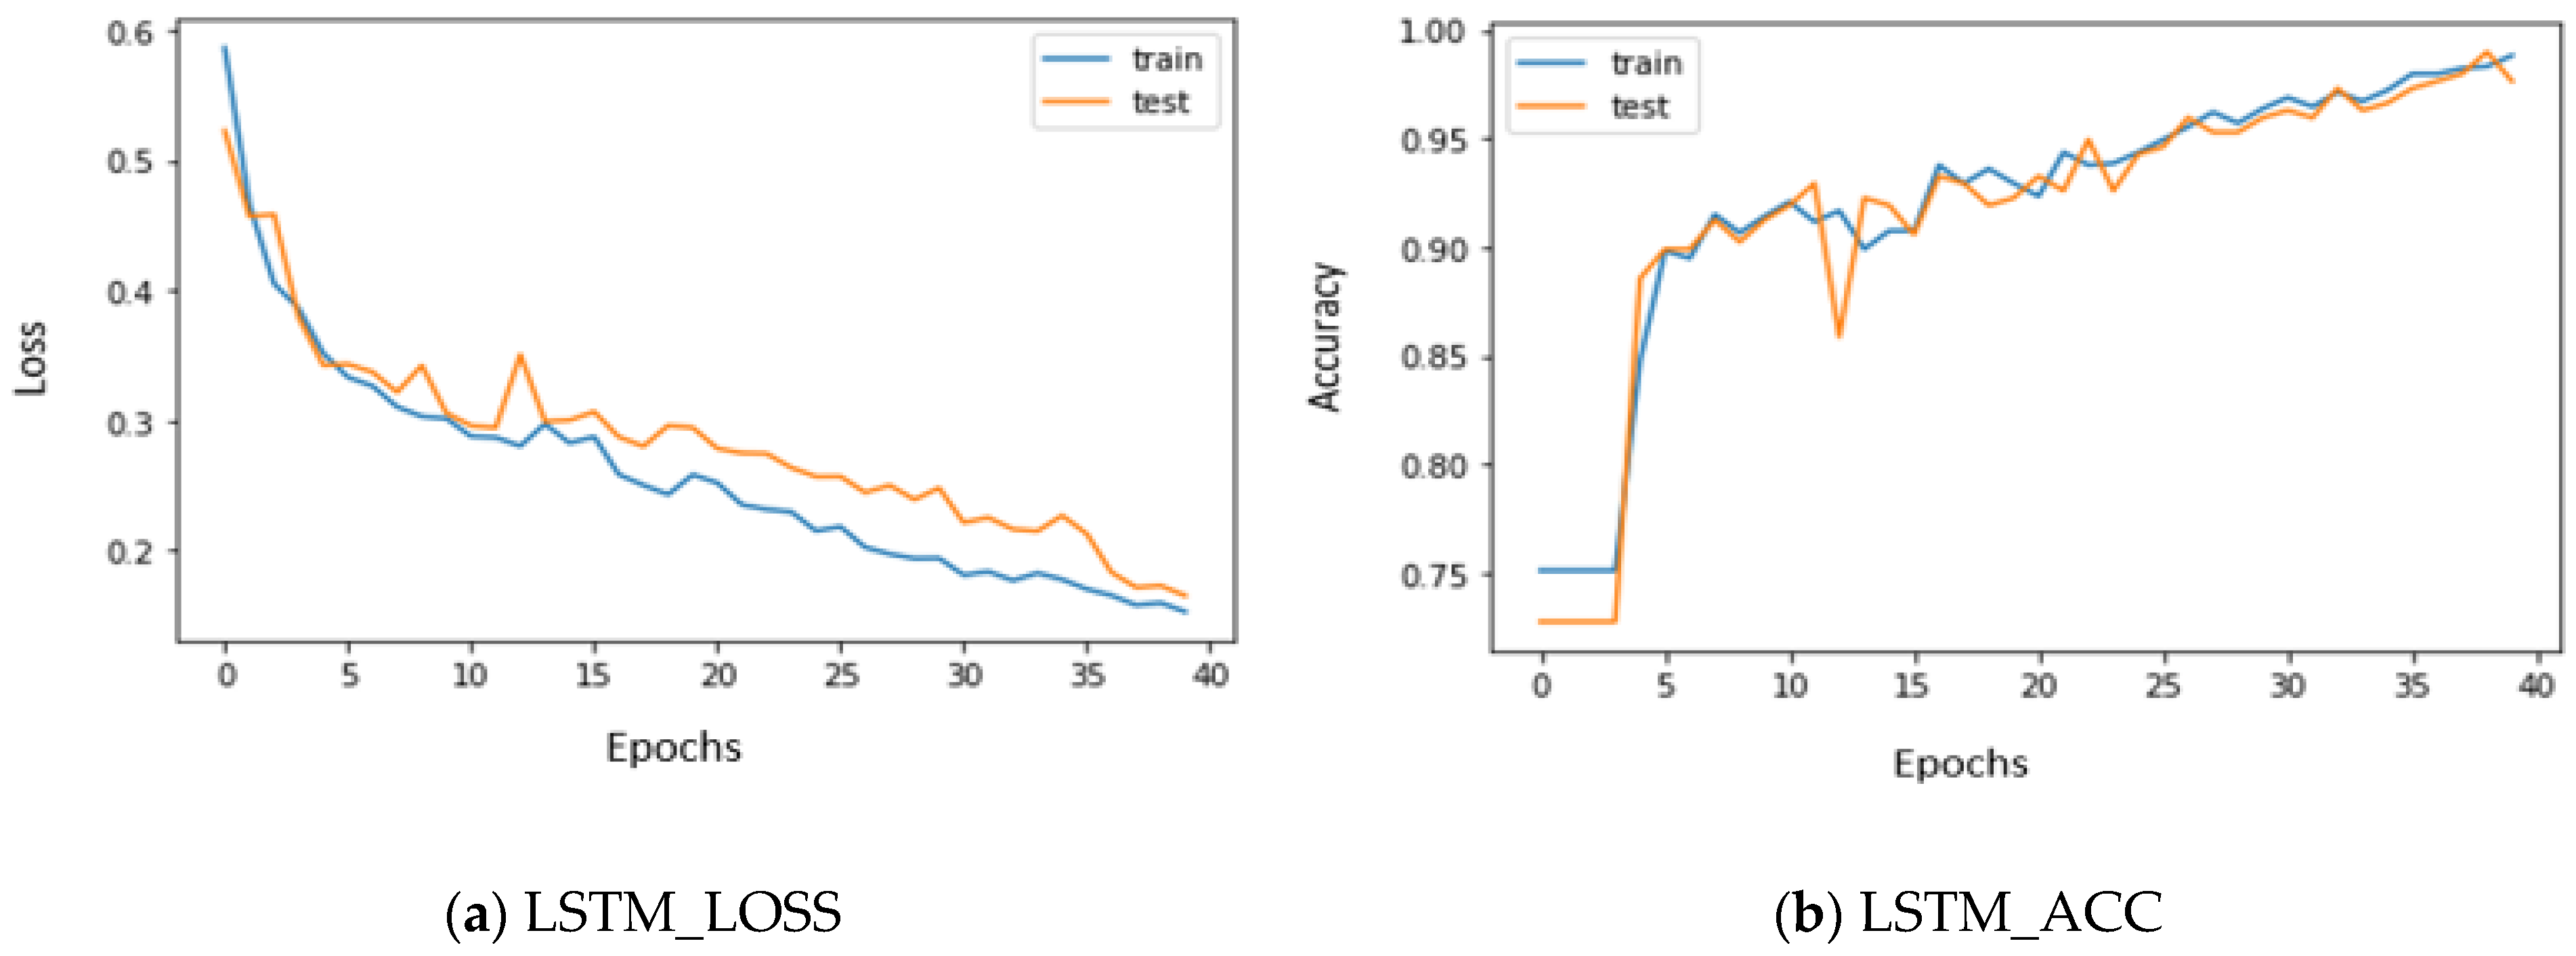
5.2. Performance Metrics of LSTM, GRU, and Voting Classifier with Stacked Features
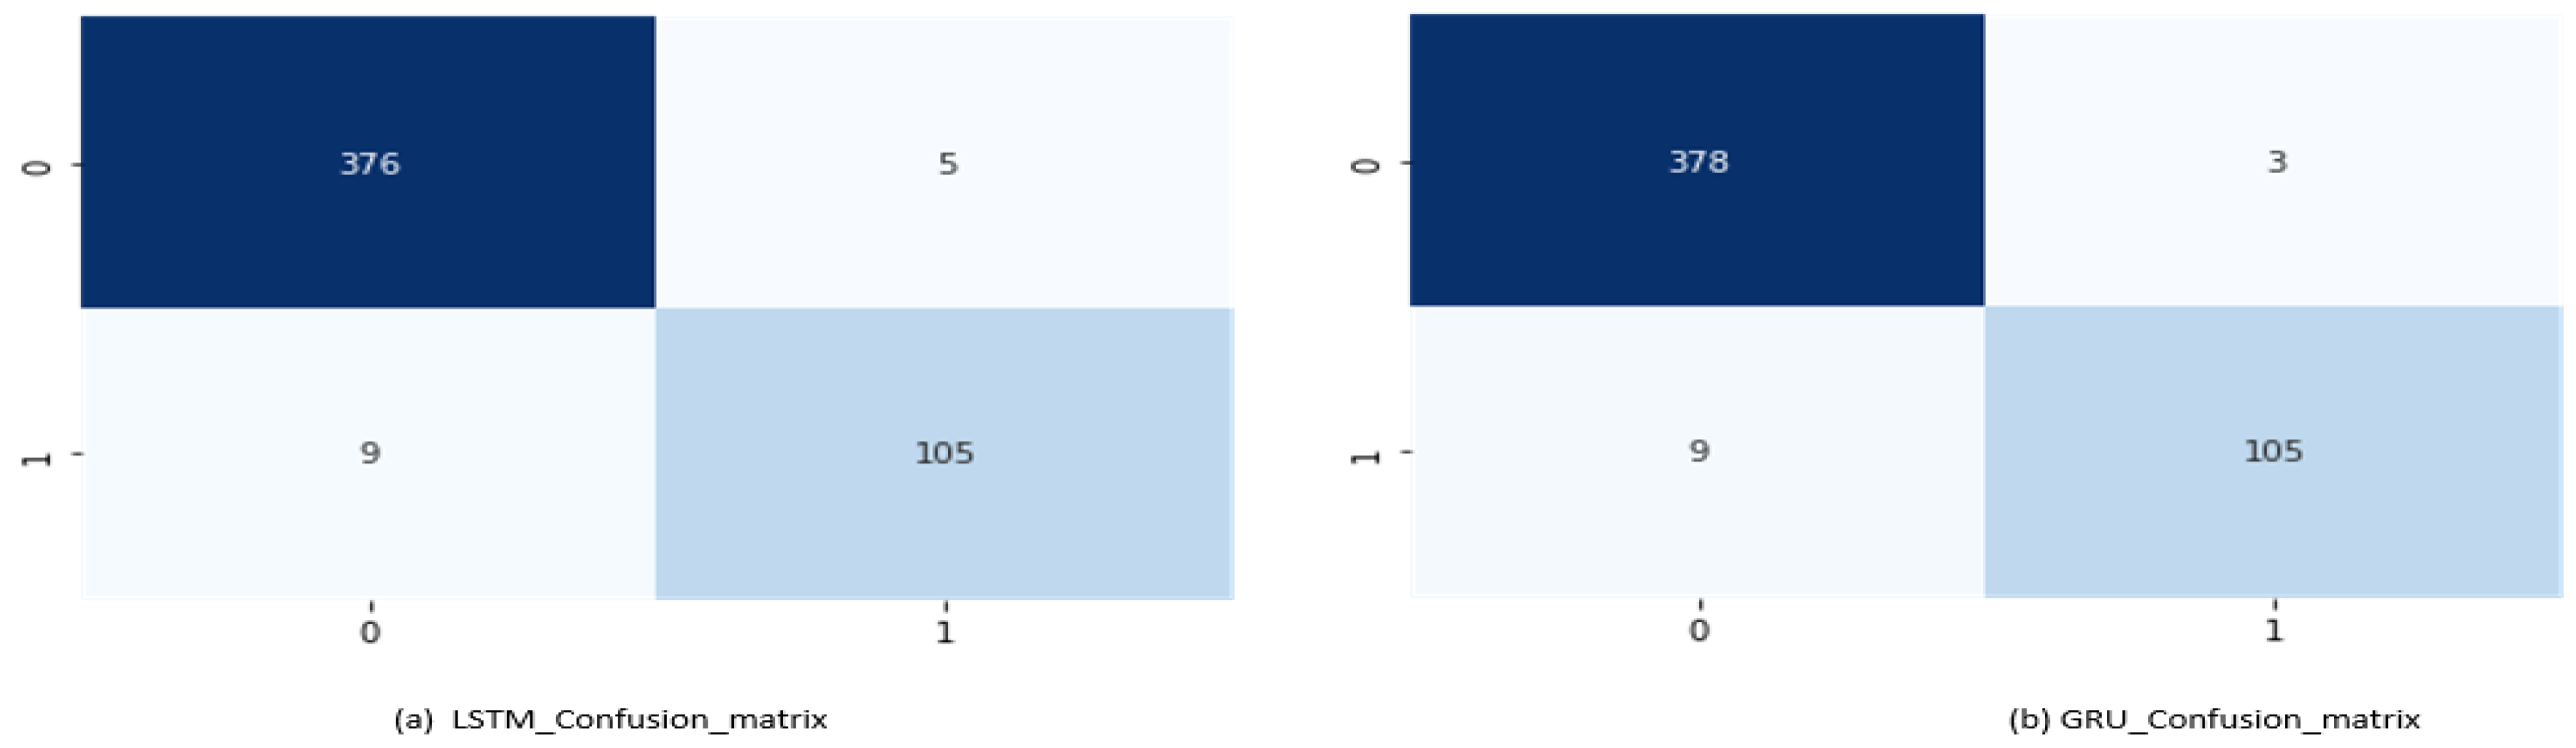
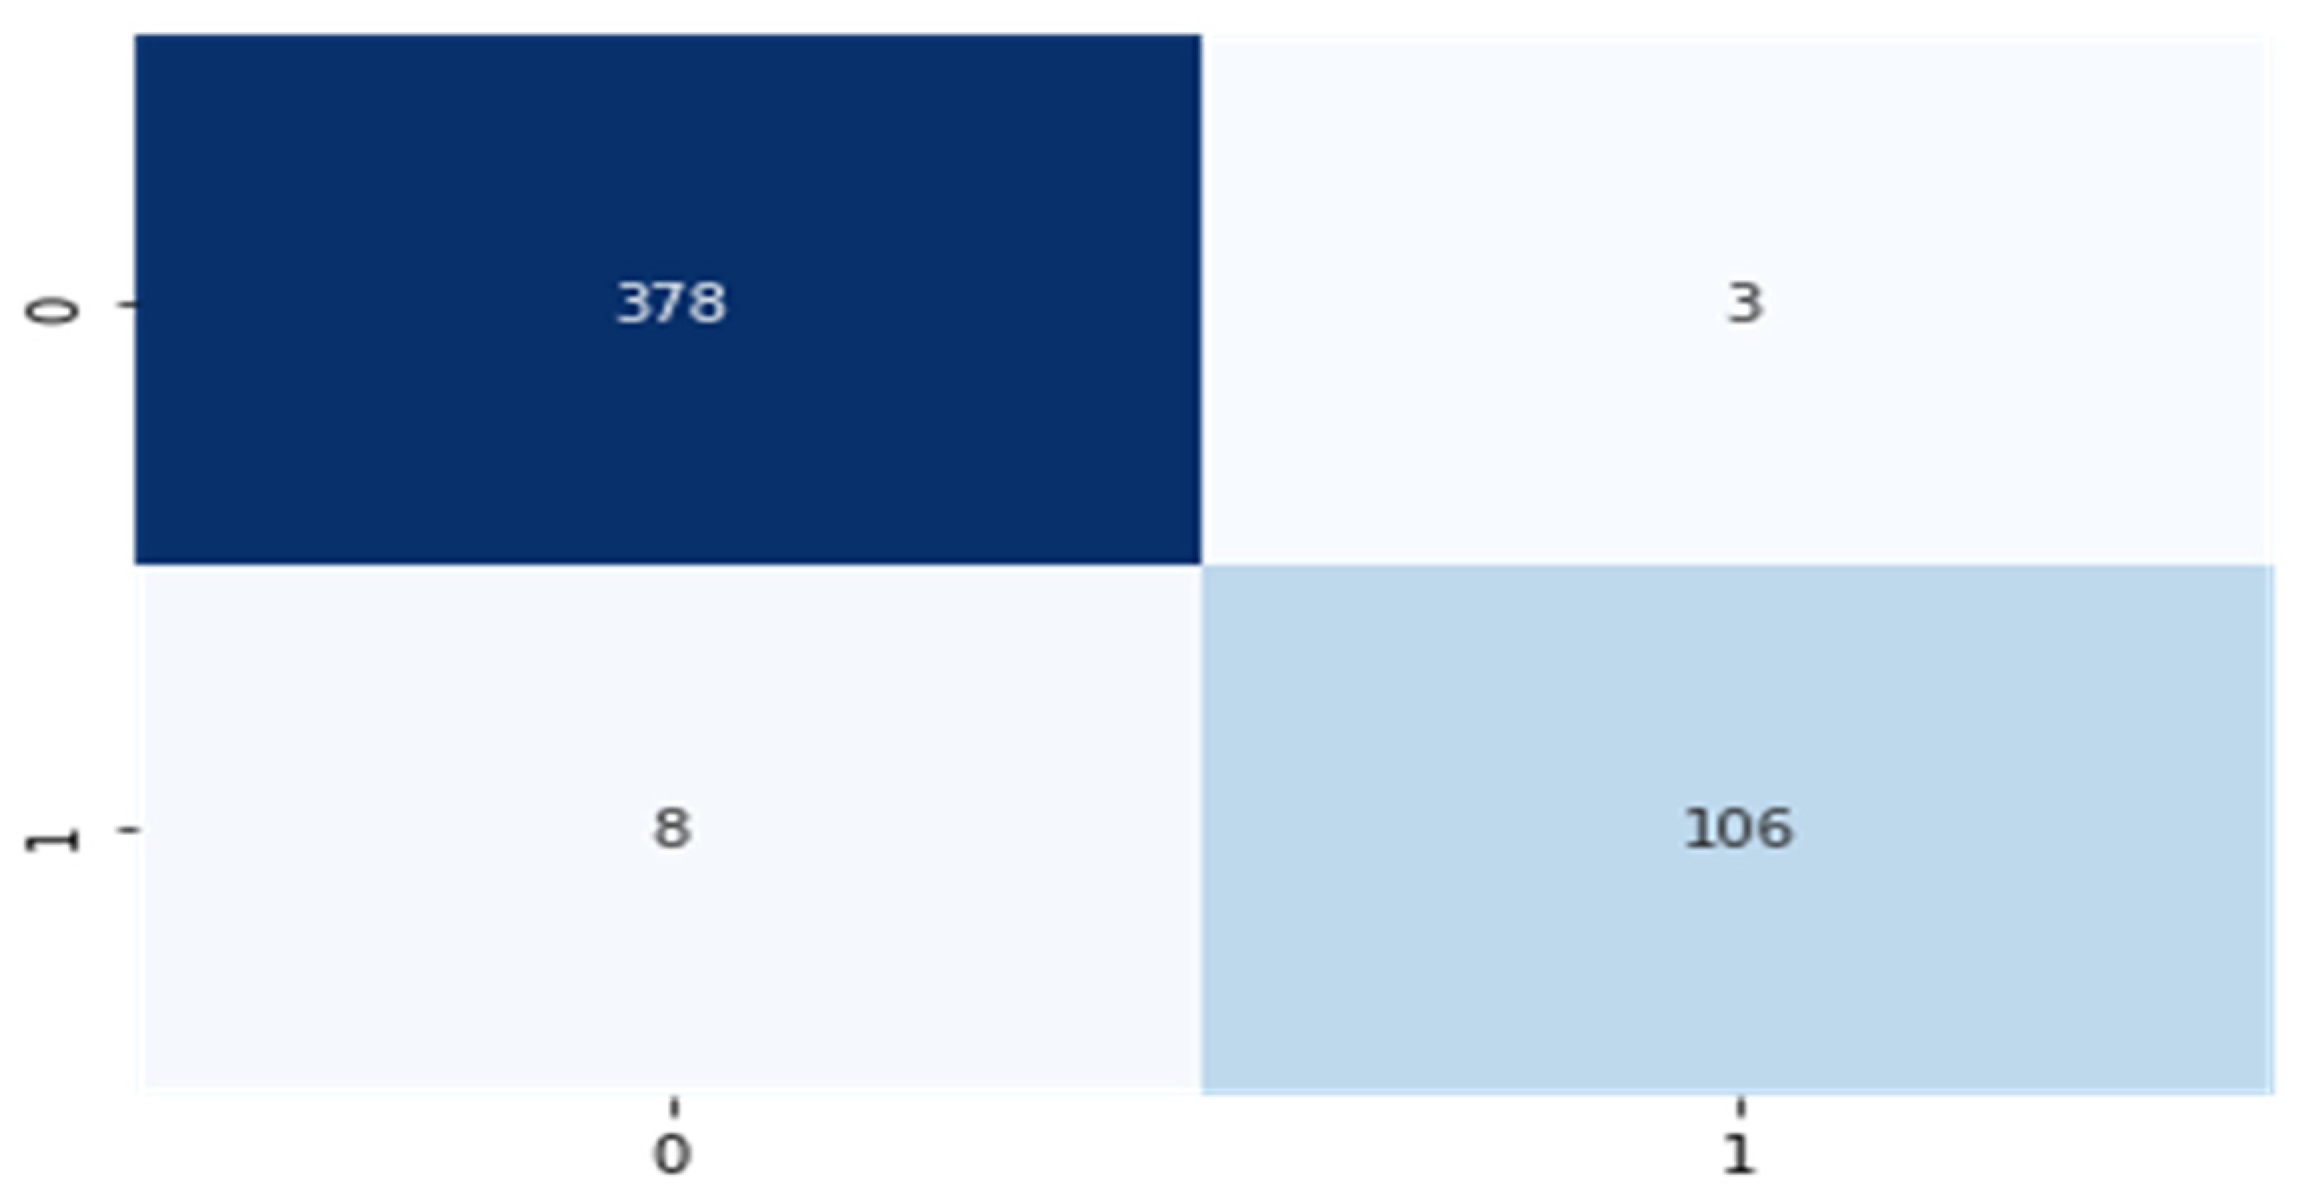
5.3. Decision-Level Fusion Using Hard Voting Classifier
5.4. Comparison of Various Classification Techniques
6. Discussion
7. Conclusions and Future Work
Author Contributions
Funding
Institutional Review Board Statement
Informed Consent Statement
Data Availability Statement
Acknowledgments
Conflicts of Interest
References
- Richens, J.G.; Lee, C.M.; Johri, S. Improving the accuracy of medical diagnosis with causal machine learning. Nat. Commun. 2020, 11, 1–9. [Google Scholar] [CrossRef]
- Siegel, R.L.; Miller, K.D.; Jemal, A. Cancer statistics, 2019. CA A Cancer J. Clin. 2019, 69, 7–34. [Google Scholar] [CrossRef] [Green Version]
- Liu, M.L.; Hu, L.; Tang, Y.; Wang, C.; He, Y.; Zeng, C. A Deep Learning Method for Breast Cancer Classification in the Pathology Images. IEEE J. Biomed. Heal. Inform. 2022, 26, 5025–5032. [Google Scholar] [CrossRef] [PubMed]
- Guo, W.; Liang, W.; Deng, Q.; Zou, X. A Multimodal Affinity Fusion Network for Predicting the Survival of Breast Cancer Patients. Front. Genet. 2021, 12, 709027. [Google Scholar] [CrossRef]
- Khamparia, A.; Bharati, S.; Podder, P.; Gupta, D.; Khanna, A.; Phung, T.K. Diagnosis of breast cancer based on modern mammography using hybrid transfer learning. Multidimens. Syst. Signal Process. 2021, 32, 747–765. [Google Scholar] [CrossRef] [PubMed]
- Arya, N.; Saha, S. Multi-modal classification for human breast cancer prognosis prediction: Proposal of deep-learning based stacked ensemble model. IEEE/ACM Trans. Comput. Biol. Bioinform. 2020, 19, 1032–1041. [Google Scholar] [CrossRef]
- Tufail, A.B.; Ma, Y.-K.; Kaabar, M.K.; Martínez, F.; Junejo, A.; Ullah, I. Deep learning in cancer diagnosis and prognosis prediction: A minireview on challenges, recent trends, and future directions. Comput. Math. Methods Med. 2021, 2021, 9025470. [Google Scholar] [CrossRef]
- Khan, R.; Yang, Q.; Ullah, I.; Rehman, A.U.; Bin Tufail, A.; Noor, A.; Rehman, A.; Cengiz, K. 3D convolutional neural networks based automatic modulation classification in the presence of channel noise. IET Commun. 2022, 16, 497–509. [Google Scholar] [CrossRef]
- Tufail, A.B.; Ullah, I.; Khan, W.U.; Asif, M.; Ahmad, I.; Ma, Y.-K.; Khan, R.; Ali, M.S. Diagnosis of Diabetic Retinopathy through Retinal Fundus Images and 3D Convolutional Neural Networks with Limited Number of Samples. Wirel. Commun. Mob. Comput. 2021, 2021, 1–15. [Google Scholar] [CrossRef]
- Kamruzzaman, M. Architecture of Smart Health Care System Using Artificial Intelligence. In Proceedings of the 2020 IEEE International Conference on Multimedia & Expo Workshops (ICMEW), London, UK, 6–10 July 2020; pp. 1–6. [Google Scholar]
- Ahmad, I.; Liu, Y.; Javeed, D.; Shamshad, N.; Sarwr, D.; Ahmad, S. A review of artificial intelligence techniques for selection & evaluation. IOP Conf. Series: Mater. Sci. Eng. 2020, 853, 012055. [Google Scholar] [CrossRef]
- Zou, J.; Huss, M.; Abid, A.; Mohammadi, P.; Torkamani, A.; Telenti, A. A primer on deep learning in genomics. Nat. Genet. 2019, 51, 12–18. [Google Scholar] [CrossRef]
- Liu, T.; Huang, J.; Liao, T.; Pu, R.; Liu, S.; Peng, Y. A Hybrid Deep Learning Model for Predicting Molecular Subtypes of Human Breast Cancer Using Multimodal Data. Irbm 2021, 43, 62–74. [Google Scholar] [CrossRef]
- Gao, J.; Li, P.; Chen, Z.; Zhang, J. A Survey on Deep Learning for Multimodal Data Fusion. Neural Comput. 2020, 32, 829–864. [Google Scholar] [CrossRef]
- Nazari, E.; Chang, H.-C.H.; Deldar, K.; Pour, R.; Avan, A.; Tara, M.; Mehrabian, A.; Tabesh, H. A comprehensive Overview of Decision Fusion Technique in Healthcare: A Systematic Scoping Review. Iran. Red Crescent Med. J. 2020, 22. [Google Scholar] [CrossRef]
- Sanyal, R.; Jethanandani, M.; Sarkar, R. DAN: Breast Cancer Classification from High-Resolution Histology Images Using Deep. Atten. Netw. 2020, 1189, 319–326. [Google Scholar] [CrossRef]
- Vo, D.M.; Nguyen, N.-Q.; Lee, S.-W. Classification of breast cancer histology images using incremental boosting convolution networks. Inf. Sci. 2019, 482, 123–138. [Google Scholar] [CrossRef]
- Arya, N.; Saha, S. Multi-modal advanced deep learning architectures for breast cancer survival prediction. Knowledge-Based Syst. 2021, 221, 106965. [Google Scholar] [CrossRef]
- Yadav, R.; Sharma, R.; Pateriya, P.K. Feature and Decision Fusion for Breast Cancer Detection. In Data Analytics and Management; Khanna, A., Polkowski, Z., Castillo, O., Eds.; Springer Nature Singapore: Singapore, 2022; pp. 737–747. [Google Scholar] [CrossRef]
- Tewary, S.; Mukhopadhyay, S. HER2 Molecular Marker Scoring Using Transfer Learning and Decision Level Fusion. J. Digit. Imaging 2021, 34, 667–677. [Google Scholar] [CrossRef]
- Yan, R.; Ren, F.; Wang, Z.; Wang, L.; Zhang, T.; Liu, Y. Breast cancer histopathological image classification using a hybrid deep neural network. Methods 2019, 173, 52–60. [Google Scholar] [CrossRef] [PubMed]
- Wang, X.; Ahmad, I.; Javeed, D.; Zaidi, S.A.; Alotaibi, F.M.; Ghoneim, M.E. Intelligent Hybrid Deep Learning Model for Breast Cancer Detection. Electronics 2022, 11, 2767. [Google Scholar] [CrossRef]
- Hamdy, E.; Badawy, O.; Zaghloul, M. Densely Convolutional Networks for Breast Cancer Classification with Multi-modal Image Fusion. Int. Arab. J. Inf. Technol. 2022, 19, 12. [Google Scholar] [CrossRef]
- Moon, W.K.; Lee, Y.-W.; Ke, H.-H.; Lee, S.H.; Huang, C.-S.; Chang, R.-F. Computer-aided diagnosis of breast ultrasound images using ensemble learning from convolutional neural networks. Comput. Methods Programs Biomed. 2020, 190, 105361. [Google Scholar] [CrossRef]
- Sathiyabhama, B.; Kumar, S.U.; Jayanthi, J.; Sathiya, T.; Ilavarasi, A.K.; Yuvarajan, V. A novel feature selection framework based on grey wolf optimizer for mammogram image analysis. Neural Comput. Appl. 2021, 33, 14583–14602. [Google Scholar] [CrossRef]
- Hu, Z.; Tang, J.; Wang, Z.; Zhang, K.; Zhang, L.; Sun, Q. Deep learning for image-based cancer detection and diagnosis−A survey. Pattern Recognit. 2018, 83, 134–149. [Google Scholar] [CrossRef]
- Glorot, X.; Bengio, Y. Understanding the Difficulty of Training Deep Feedforward Neural Networks. In Proceedings of the Thirteenth International Conference on Artificial Intelligence and Statistics, Sardinia, Italy, 13 May 2010; pp. 249–256. [Google Scholar]
- Havaei, M.; Davy, A.; Warde-Farley, D.; Biard, A.; Courville, A.; Bengio, Y. Brain tumor segmentation with Deep Neural Networks. Med Image Anal. 2017, 35, 18–31. [Google Scholar] [CrossRef] [Green Version]
- Srivastava, N.; Hinton, G.; Krizhevsky, A.; Sutskever, I.; Salakhutdinov, R. Dropout: A simple way to prevent neural networks from overfitting. J. Mach. Learn. Res. 2014, 15, 1929–1958. [Google Scholar]
- Dutta, S.; Mandal, J.K.; Kim, T.H.; Bandyopadhyay, S.K. Breast Cancer Prediction Using Stacked GRU-LSTM-BRNN. Appl. Comput. Syst. 2020, 25, 163–171. [Google Scholar] [CrossRef]
- Begum, A.; Kumar, V.D.; Asghar, J.; Hemalatha, D.; Arulkumaran, G. A Combined Deep CNN: LSTM with a Random Forest Approach for Breast Cancer Diagnosis. Complexity 2022, 2022, 1–9. [Google Scholar] [CrossRef]
- Ghosh, P.; Azam, S.; Hasib, K.M.; Karim, A.; Jonkman, M.; Anwar, A. A Performance Based Study on Deep Learning Algorithms in the Effective Prediction of Breast Cancer. In Proceedings of the 2021 International Joint Conference on Neural Networks (IJCNN), Shenzhen, China, 18–22 July 2021; pp. 1–8. [Google Scholar] [CrossRef]
- Jafarbigloo, S.K.; Danyali, H. Nuclear atypia grading in breast cancer histopathological images based on CNN feature extraction and LSTM classification. CAAI Trans. Intell. Technol. 2021, 6, 426–439. [Google Scholar] [CrossRef]
- Ahmad, S.; Ullah, T.; Ahmad, I.; Al-Sharabi, A.; Ullah, K.; Khan, R.A.; Rasheed, S.; Ullah, I.; Uddin, N.; Ali, S. A Novel Hybrid Deep Learning Model for Metastatic Cancer Detection. Comput. Intell. Neurosci. 2022, 2022, 1–14. [Google Scholar] [CrossRef]
- Shah, A.A.; Alturise, F.; Alkhalifah, T.; Khan, Y.D. Deep Learning Approaches for Detection of Breast Adenocarcinoma Causing Carcinogenic Mutations. Int. J. Mol. Sci. 2022, 23, 11539. [Google Scholar] [CrossRef] [PubMed]
- Umer, M.; Naveed, M.; Alrowais, F.; Ishaq, A.; Hejaili, A.A.; Alsubai, S. Breast Cancer Detection Using Convoluted Features and Ensemble Machine Learning Algorithm. Cancers 2022, 14, 6015. [Google Scholar] [CrossRef] [PubMed]
- Curtis, C.; Shah, S.P.; Chin, S.-F.; Turashvili, G.; Rueda, O.M.; Dunning, M.J. The genomic and transcriptomic architecture of 2,000 breast tumours reveals novel subgroups. Nature 2012, 486, 346–352. [Google Scholar] [CrossRef] [PubMed]
- Lin, W.-C.; Tsai, C.-F. Missing value imputation: A review and analysis of the literature (2006–2017). Artif. Intell. Rev. 2020, 53, 1487–1509. [Google Scholar] [CrossRef]


| Fusion-Level Type | Algorithm | Dataset | Advantages | Disadvantages |
|---|---|---|---|---|
| Data-Level Fusion [23] |
| Mini-DDSM BUSI (mammography images and ultrasound images) |
|
|
| Data-Level Fusion [24] |
| SNUH and BUSI datasets (ultrasound images) |
|
|
| Feature-Level Fusion [6] |
| METABRIC (clinical, gene expression, and CNA data) |
|
|
| Feature-Level Fusion [18] |
| METABRIC (clinical, gene expression, and CNA data) |
|
|
| Decision-Level Fusion [20] |
| Warwick University dataset |
|
|
| Decision-Level Fusion [19] |
| MIAS (mammogram images) |
|
|
| Data Type | Complete Features | Chosen Features |
|---|---|---|
| Clinical information | 27 | 25 |
| Genetic expression information | 24,368 | 400 |
| Copy number | 26,298 | 200 |
| Number of convolutional layers | 1 |
| Filter size | 15 |
| Number of filters | 4 |
| Stride size | 2 |
| Padding in the convolutional layer | Same |
| Activation function | ReLU |
| Number of hidden layers | 1 |
| Number of hidden neurons | 150 |
| Mini batch size | 8 |
| Training epochs | 20 |
| Activation function | TANH |
| Loss function | binary cross entropy + L2 regularization |
| Layers | Number of Units | Number of Received Parameters | Resultant Shape |
|---|---|---|---|
| LSTM | 128 | 66,560 | (None, 452, 128) |
| Dropout | 0.2 | 0 | (None, 452, 128) |
| LSTM | 64 | 49,408 | (None, 452, 64) |
| Dropout | 0.2 | 0 | (None, 452, 64) |
| LSTM | 32 | 12,416 | (None, 452, 32) |
| Dropout | 0.2 | 0 | (None, 452, 32) |
| LSTM | 16 | 3136 | (None, 452, 16) |
| Dropout | 0.2 | 0 | (None, 452, 16) |
| Flatten | 0 | 0 | (None, 7232) |
| Dense | 8 | 57,864 | (None, 8) |
| Dense | 4 | 36 | (None, 4) |
| Dense | 2 | 10 | (None, 2) |
| Dense | 1 | 3 | (None, 1) |
| Layers | Number of Units | Number of Received Parameters | Resultant Shape |
|---|---|---|---|
| GRU | 128 | 50,304 | (None, 452, 128) |
| Dropout | 0.2 | 0 | (None, 452, 128) |
| GRU | 64 | 37,248 | (None, 452, 64) |
| Dropout | 0.2 | 0 | (None, 452, 64) |
| GRU | 32 | 9408 | (None, 452, 32) |
| Dropout | 0.2 | 0 | (None, 452, 32) |
| GRU | 16 | 2400 | (None, 452, 16) |
| Dropout | 0.2 | 0 | (None, 452, 16) |
| Flatten | 0 | 0 | (None, 7232) |
| Dense | 8 | 57,864 | (None, 8) |
| Dense | 4 | 36 | (None, 4) |
| Dense | 2 | 10 | (None, 2) |
| Dense | 1 | 3 | (None, 1) |
| Survival limit (years) | 5 |
| # of patients | 1980 |
| Long-term survivors | 1489 |
| Short-term survivors | 491 |
| Average age at diagnosis | 61 |
| Average survival (months) | 125.1 |
| Dataset | Data Type | Dataset Description |
|---|---|---|
| Clinical | Numerical/Categorical | Clinical features were classified into four categories:
|
| CNA | Categorical | Copy number aberration features describe each region within a chromosome (number of markers and type of mutation in the somatic tissues):
|
| Gene Expression | Numerical | 48,803 EXPRESSED GENE ILLUMINA SEQUENCED HT 12 array v3 |
| S. No. | Attribute | Value Examples |
|---|---|---|
| 1 | Age at diagnosis | 21 to 96 years |
| 2 | Histologic grade | 1, 2, 3 |
| 3 | Tumor size | 1 to 182 mm |
| 4 | Tumor stage | |
| 5 | Positive examined lymph nodes | 0 to 45 |
| 6 | Inferred menopausal state | Pre, Post |
| 7 | ER status | Positive, negative |
| 8 | PR status | Positive, negative |
| 9 | Overall survival (months) | 0 to 355 |
| 10 | Histological type | Ductal/NST, lobular |
| 11 | HER2_SNP6_state | NETURAL, LOSS, GAIN |
| 12 | Treatment | Chemotherapy |
| 13 | Patients vital status | Overall survival status (0: yes, 1: no) |
| Model | ACC | AUC |
|---|---|---|
| CNN_CLINICAL | 80.8 | 85 |
| CNN_CNA | 74.3 | 82 |
| CNN_EXPR | 80.2 | 89 |
| Performance Metric (%) | Classification | Dataset | CNN_GRU | CNN_LSTM | VOTING Model |
|---|---|---|---|---|---|
| AUC (%) | Binary Classification | METABRIC Dataset | 96.0 | 95.3 | 98.2 |
| Accuracy (%) | 97.5 | 97.0 | 98.0 | ||
| Precision (%) | 98.0 | 98.0 | 99.0 | ||
| Sensitivity (%) | 99.2 | 98.6 | 99.2 | ||
| MCC (%) | 93.0 | 92.0 | 93.6 |
| Model | AUC | ACC | PR | SN | MCC |
|---|---|---|---|---|---|
| Proposed Model | 98.2 | 98.0 | 99.0 | 99.2 | 93.6 |
| GRU | 96.0 | 97.5 | 98.0 | 99.2 | 93.0 |
| LSTM | 95.3 | 97.0 | 98.0 | 98.6 | 92.0 |
| SiGaAtCNN STACKED RF | 95.0 | 91.2 | 84.1 | 79.8 | 76.2 |
| STACKED RF | 93.0 | 90.2 | 84.1 | 74.7 | 73.0 |
| MDNNMD | 84.5 | 82.6 | 74.9 | 45.0 | 48.6 |
| SVM | 81.0 | 80.5 | 70.8 | 36.5 | 40.7 |
| LR | 66.3 | 76.0 | 54.9 | 18.3 | 20.9 |
Disclaimer/Publisher’s Note: The statements, opinions and data contained in all publications are solely those of the individual author(s) and contributor(s) and not of MDPI and/or the editor(s). MDPI and/or the editor(s) disclaim responsibility for any injury to people or property resulting from any ideas, methods, instructions or products referred to in the content. |
© 2023 by the authors. Licensee MDPI, Basel, Switzerland. This article is an open access article distributed under the terms and conditions of the Creative Commons Attribution (CC BY) license (https://creativecommons.org/licenses/by/4.0/).
Share and Cite
Othman, N.A.; Abdel-Fattah, M.A.; Ali, A.T. A Hybrid Deep Learning Framework with Decision-Level Fusion for Breast Cancer Survival Prediction. Big Data Cogn. Comput. 2023, 7, 50. https://doi.org/10.3390/bdcc7010050
Othman NA, Abdel-Fattah MA, Ali AT. A Hybrid Deep Learning Framework with Decision-Level Fusion for Breast Cancer Survival Prediction. Big Data and Cognitive Computing. 2023; 7(1):50. https://doi.org/10.3390/bdcc7010050
Chicago/Turabian StyleOthman, Nermin Abdelhakim, Manal A. Abdel-Fattah, and Ahlam Talaat Ali. 2023. "A Hybrid Deep Learning Framework with Decision-Level Fusion for Breast Cancer Survival Prediction" Big Data and Cognitive Computing 7, no. 1: 50. https://doi.org/10.3390/bdcc7010050