Article

The Art of the Masses: Overviews on the Collective Visual Heritage through Convolutional Neural Networks

by
Pilar Rosado-Rodrigo
1,* and
Ferran Reverter
2
1
Department of Arts and Conservation-Restoration, University of Barcelona, 08028 Barcelona, Spain
2
Department of Genetics, Microbiology and Statistics, University of Barcelona, 08028 Barcelona, Spain
*
Author to whom correspondence should be addressed.
Big Data Cogn. Comput. 2023, 7(1), 33; https://doi.org/10.3390/bdcc7010033
Submission received: 23 November 2022 / Revised: 2 February 2023 / Accepted: 8 February 2023 / Published: 10 February 2023

Abstract

:
In the context of a society saturated in images, convolutional neural networks (CNNs), pre-trained using from the visual information contained in many thousands of images, constitute a tool that is of great use in helping us to organize the visual heritage, thus offering a route of entry that would otherwise be impossible. One of the responsibilities of the contemporary artist is to adopt a position that will help to provide sense, to project meaning onto the accumulation of images that we are faced with. The artificial neuronal network ResNet-50 has been used in order to extract the visual characteristics of large sets of images from the internet. Textual searches have been carried out on social issues such as climate change, the COVID-19 pandemic, demonstrations around the world, and manifestations of popular culture, and the image descriptors obtained have been the input for the algorithm t-SNE. In this way, we produce large visual maps composed of thousands of images and arranged following the criteria of formal similitude, displaying the visual patterns of the archetypes of specific semantic categories. The method of filing and recovering our collective memory must have a correlation with the technological and scientific advances of our time, in order for us to progressively discover new horizons of knowledge.

1. Introduction

With every passing minute, millions of images are taken and shared on the web, resembling the inexhaustible current of a river, and our images are traces of collective behavior. The difficulty of recovering them from this torrent to be visualized in an intelligible manner may make them invisible. Comprehensibility of a sort can be given back to these huge visual files by the use of deep learning technology.
The possibility of interrupting this incessant and vertiginous flow of information arises as a powerful tool for thought. Nowadays, we can create enormous snapshots that unveil the “global forms” that become apparent when we bring together as groups the images created by the collective.
In the context of this society of over-information and vast photographic production, one of the artist’s responsibilities is to take a stand that will help to imbue with meaning, to provide purpose, to the visual accumulation that confronts us. Joan Fontcuberta has written about this subject that “the most determining value of creation does not lie in making new images but, whether the images are new or old, in knowing how to steer their function” [1] (p. 39). In his theory of post-photography, Fontcuberta points toward a certain overhauling of photography to enter the realm of a total image. Locating this proposal in the field of post-photography, we claim that, by applying models of deep learning to the automated categorization of large numbers of image files, we can give them an order that enables them to present us with aspects as yet unseen in any of what Joan Fontcuberta calls the “multiple reincarnations of the image”.
The use of methods of computer vision for research in the humanities is important: methods of numerical representation and data analysis offer a new language to describe cultural artefacts, experiences, and dynamics [2,3,4]. The genealogy of these interests dates back to Aby Warburg (1866–1929), the historian of art and culture, whose Atlas Mnemosyne, which consisted of a collection of images and little text, was intended to narrate a history of the memory of European civilization. With premonitory vision, Warburg considered that images themselves and the relationships between them generate a space for thought [5].
Aby Warburg began his Atlas Mnemosyne in 1924. Tracking recurrent visual themes and patterns through time, from antiquity to the renaissance to contemporary culture, Warburg had the intention of putting together a sort of visual data bank of all the ages and cultures. It summed up the work of his entire life and he left it unfinished at his death in 1929. The original panels were composed of wooden boards measuring 1.7 × 1.4 m (66.92′′ × 55.11′′), covered with black cloth, onto which he would attach all sorts of images, such as photographs, reproductions of paintings, drawings, illustrations taken from books, and visual material from newspapers. Each panel was dedicated to a particular theme that represented a line of interest in his research; then, they were numbered and photographed in the large hall of his library. Warburg did not keep the original panels; instead, he constantly reorganized the images and added new panels and themes [6]. For him, the panels were not so much a means of presentation as a method for research and comprehension.
We must also mention André Malraux, the French author and minister of culture, who, in 1947, launched the idea of creating an imaginary museum with no walls or barriers, based on photographic reproductions, so as to allow each person to create their own museum [7]. The advantage of this type of imaginary museum is that each spectator can curate a museum of their own in terms of their personal sensibilities. Obviously, insoluble limitations such as reproducing the texture, the volume, or the scale of a work of art make it clear that a valid artistic experience of this sort can never be a substitute for live perception in situ.
We can also establish connections to the so-called augmented photography of authors such as Lev Manovich, with his visual analysis of literary works, video games, or the front pages of Time Magazine. The work Timeline, by Jeremy Douglass and Lev Manovich [8], shows all the front covers of Time Magazine from 1923 to the summer of 2009, a total of 4535 covers in a single image. The images are displayed according to their order of publication (from left to right and top to bottom).
It is equally appropriate to recall the project by Lev Manovich and William Huber in 2010, offering an insight into the world of games, as well as the visual and narrative changes within the unfolding of a single game, by ordering 22,500 frames taken from the Japanese video game Kingdom Hearts II, every six seconds of the game. The work shows sixty-two and a half hours of the game represented in a single image [9].
Web data and computational models can play an important role in the analysis of cultural trends. There are some publicly available studies that have implications for the groundbreaking use of web data to understand cultural patterns [10,11]. This article presents several such creative experiments. For the realization of these projects, textual searches were carried out in Google regarding social issues such as climate change, the COVID-19 pandemic, demonstrations around the world, and manifestations of popular culture. The thousands of photographs used were recovered from the internet and classified according to models of deep learning. The artistic practice presented in this article is based on ordering a group of images for the understanding of collective behavior, but also to transmit emotions to the audience through the color of the resulting maps. Thus, the work does not arise only out of the artist’s imagination; the groups of images under study are composed of the interests of the artist, added to the search criteria implemented in the algorithms that recover such information from the web, and to the desires of the individual persons who, at some point, chose to upload their images to the internet.

2. Materials and Methods

In the field of computer vision, a great deal of effort is dedicated to enabling machines to emulate the capacity of human beings to comprehend images. At present, great progress is being achieved in the use of deep learning for the task of automated image cataloguing.
Deep learning is based on the idea of apprenticeship by provided examples. The computer, starting from such examples, constructs a model capable of predicting underlying rules. The algorithm modifies the model whenever predictive errors arise; thus, through iteration, these models can learn in an extremely precise way, because the system is capable of extracting relevant patterns that apply to the task at hand.
The power of deep learning resides in the capacity of these methods to discover the image descriptors unassisted, without resorting to pre-defined ones. In 2019, Manovich pointed out that this aspect of automatic learning is, in fact, something new in the history of computational art: a computer that is capable, on its own, of learning the structure of the visual world [12].
To gather the thousands of images used for these artistic projects, numerous textual searches were performed in Google. To download the images salvaged through these searches, the repositories of the internet were accessed, making use of web scraping software, incorporated into the browser as an extension.
It cannot be ignored that the search algorithms in Google are designed to help us to find what we are looking for in a fraction of a second, among millions of web pages. These classification systems are based not on one but on a whole series of algorithms that take many factors into account, such as the wording of the consultation, the relevance and usability of the pages, the degree of specialization of the sources, the location, and the configuration. The weight allotted to each factor changes depending on the nature of the consultation (as stated on the Google website) [13].
For the purpose of classifying the images, the convolutional neural network ResNet-50 [14] was pre-trained on a subset of the ImageNet database [15]. Trained with over a million images, it has a total of 177 convolutional layers, associated with a residual network of 50 layers, and is able to classify images into 1000 categories of objects.
As we will explain later, the images used in these exhibitions were embedded into high-dimensional numerical space using the network ResNet-50 as an extractor of visual characteristics, taking the activations in the output layer (fc1000) as artificial descriptors of the images in the collection, obtaining a representation of each image’s visual content induced by the network. Thus, we can state that this stage of the creative process was conditioned by the supervised training of the ResNet-50 network (see Figure 1).
Subsequently, the artificially obtained descriptors were used as input for the stochastic neighbor embedding (t-SNE) algorithm [16]. t-SNE represented the 1000-dimensional vectors that corresponded to the images in a two-dimensional space (plane of representation), optimally preserving the relations of similitude of the visual content of the images (see Figure 1 and Figure 2). This stage of the creative process is non-supervised, as it depends exclusively on the similitude between the images under analysis.
As previously explained, when working with large sets of photographs, the problem is that when t-SNE is applied to the images, the result is that a large number of the locations of the images in the plane of representation correspond to superimposed elements, often preventing the inspection of any single image on its own. To overcome this drawback, the Karpathy code [17] was used, which reassigns the locations on a regular square grid, but without destroying the neighbor relations that resulted from the grouping by similitude based on t-SNE (see Figure 3).
We have also tested PCA versus t-SNE: both are dimension reduction techniques, but PCA is inspired by maintaining variability and t-SNE functions by maintaining and revealing point densities, as clusters; we found that following the t-SNE criterion is more in line with the pursuit of our objective. Moreover, although PCA representation provides similar groupings, we prefer the t-SNE representations because they improve the group’s visualization.

3. Results

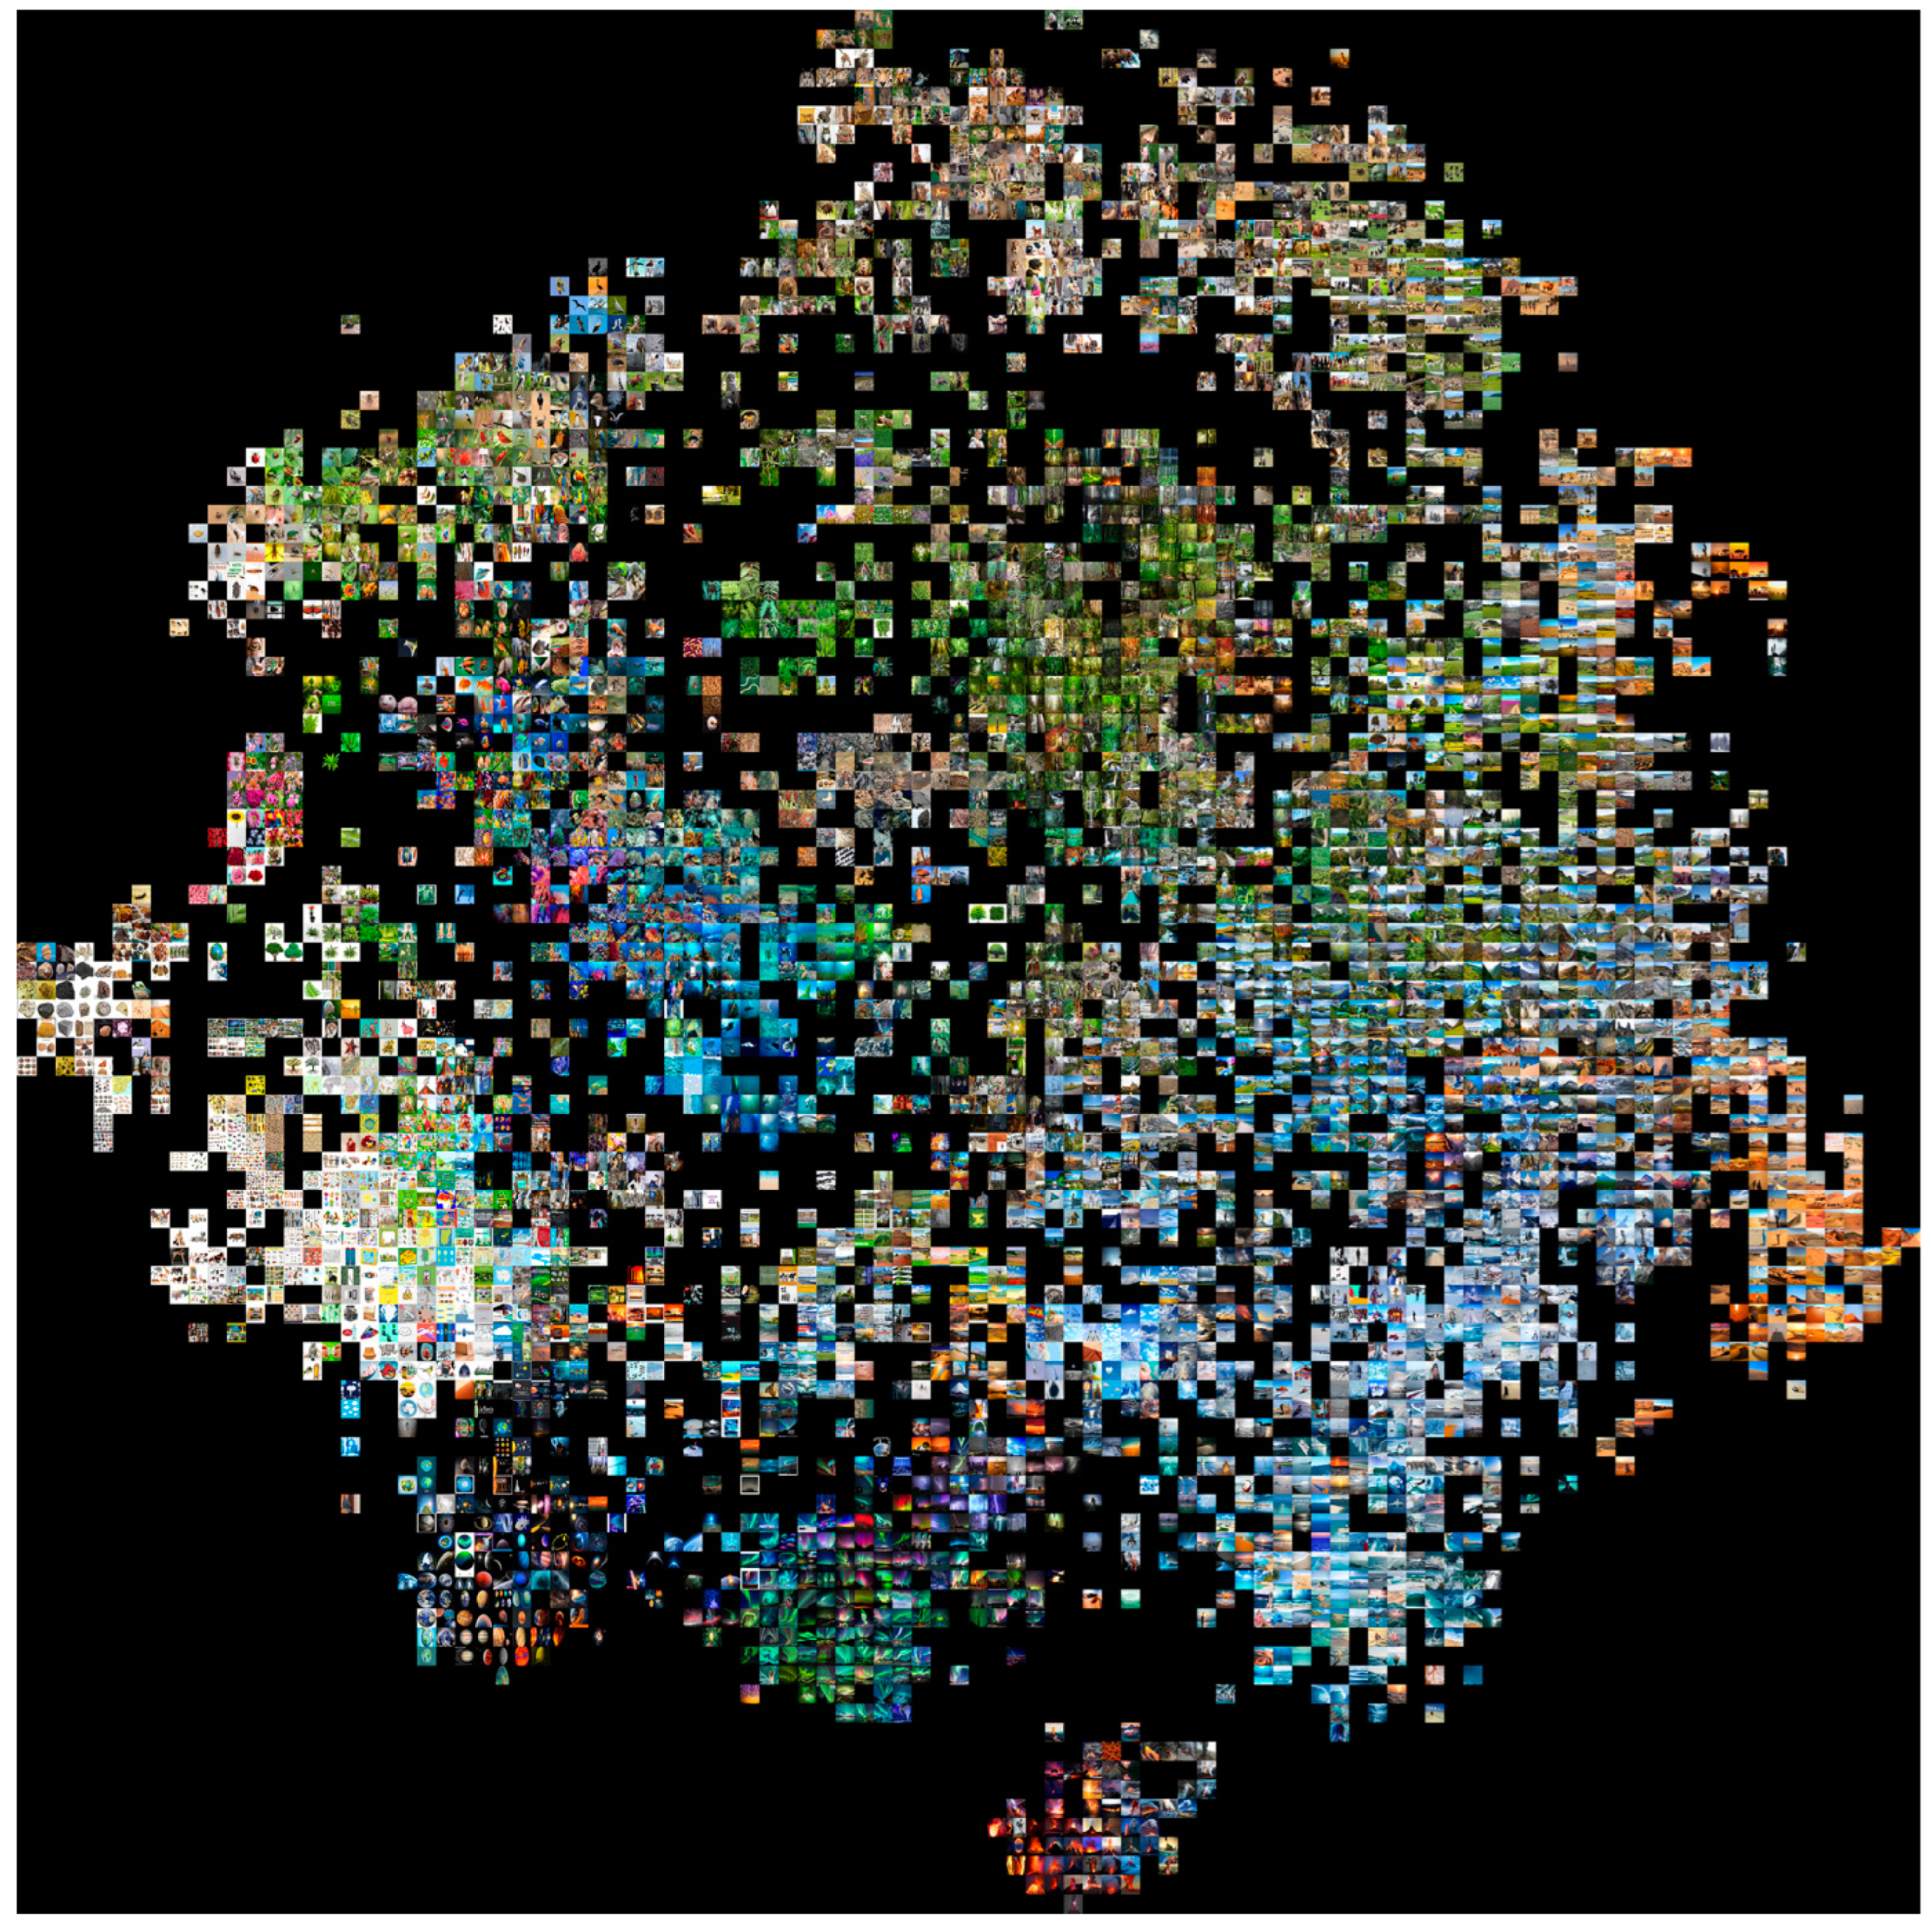
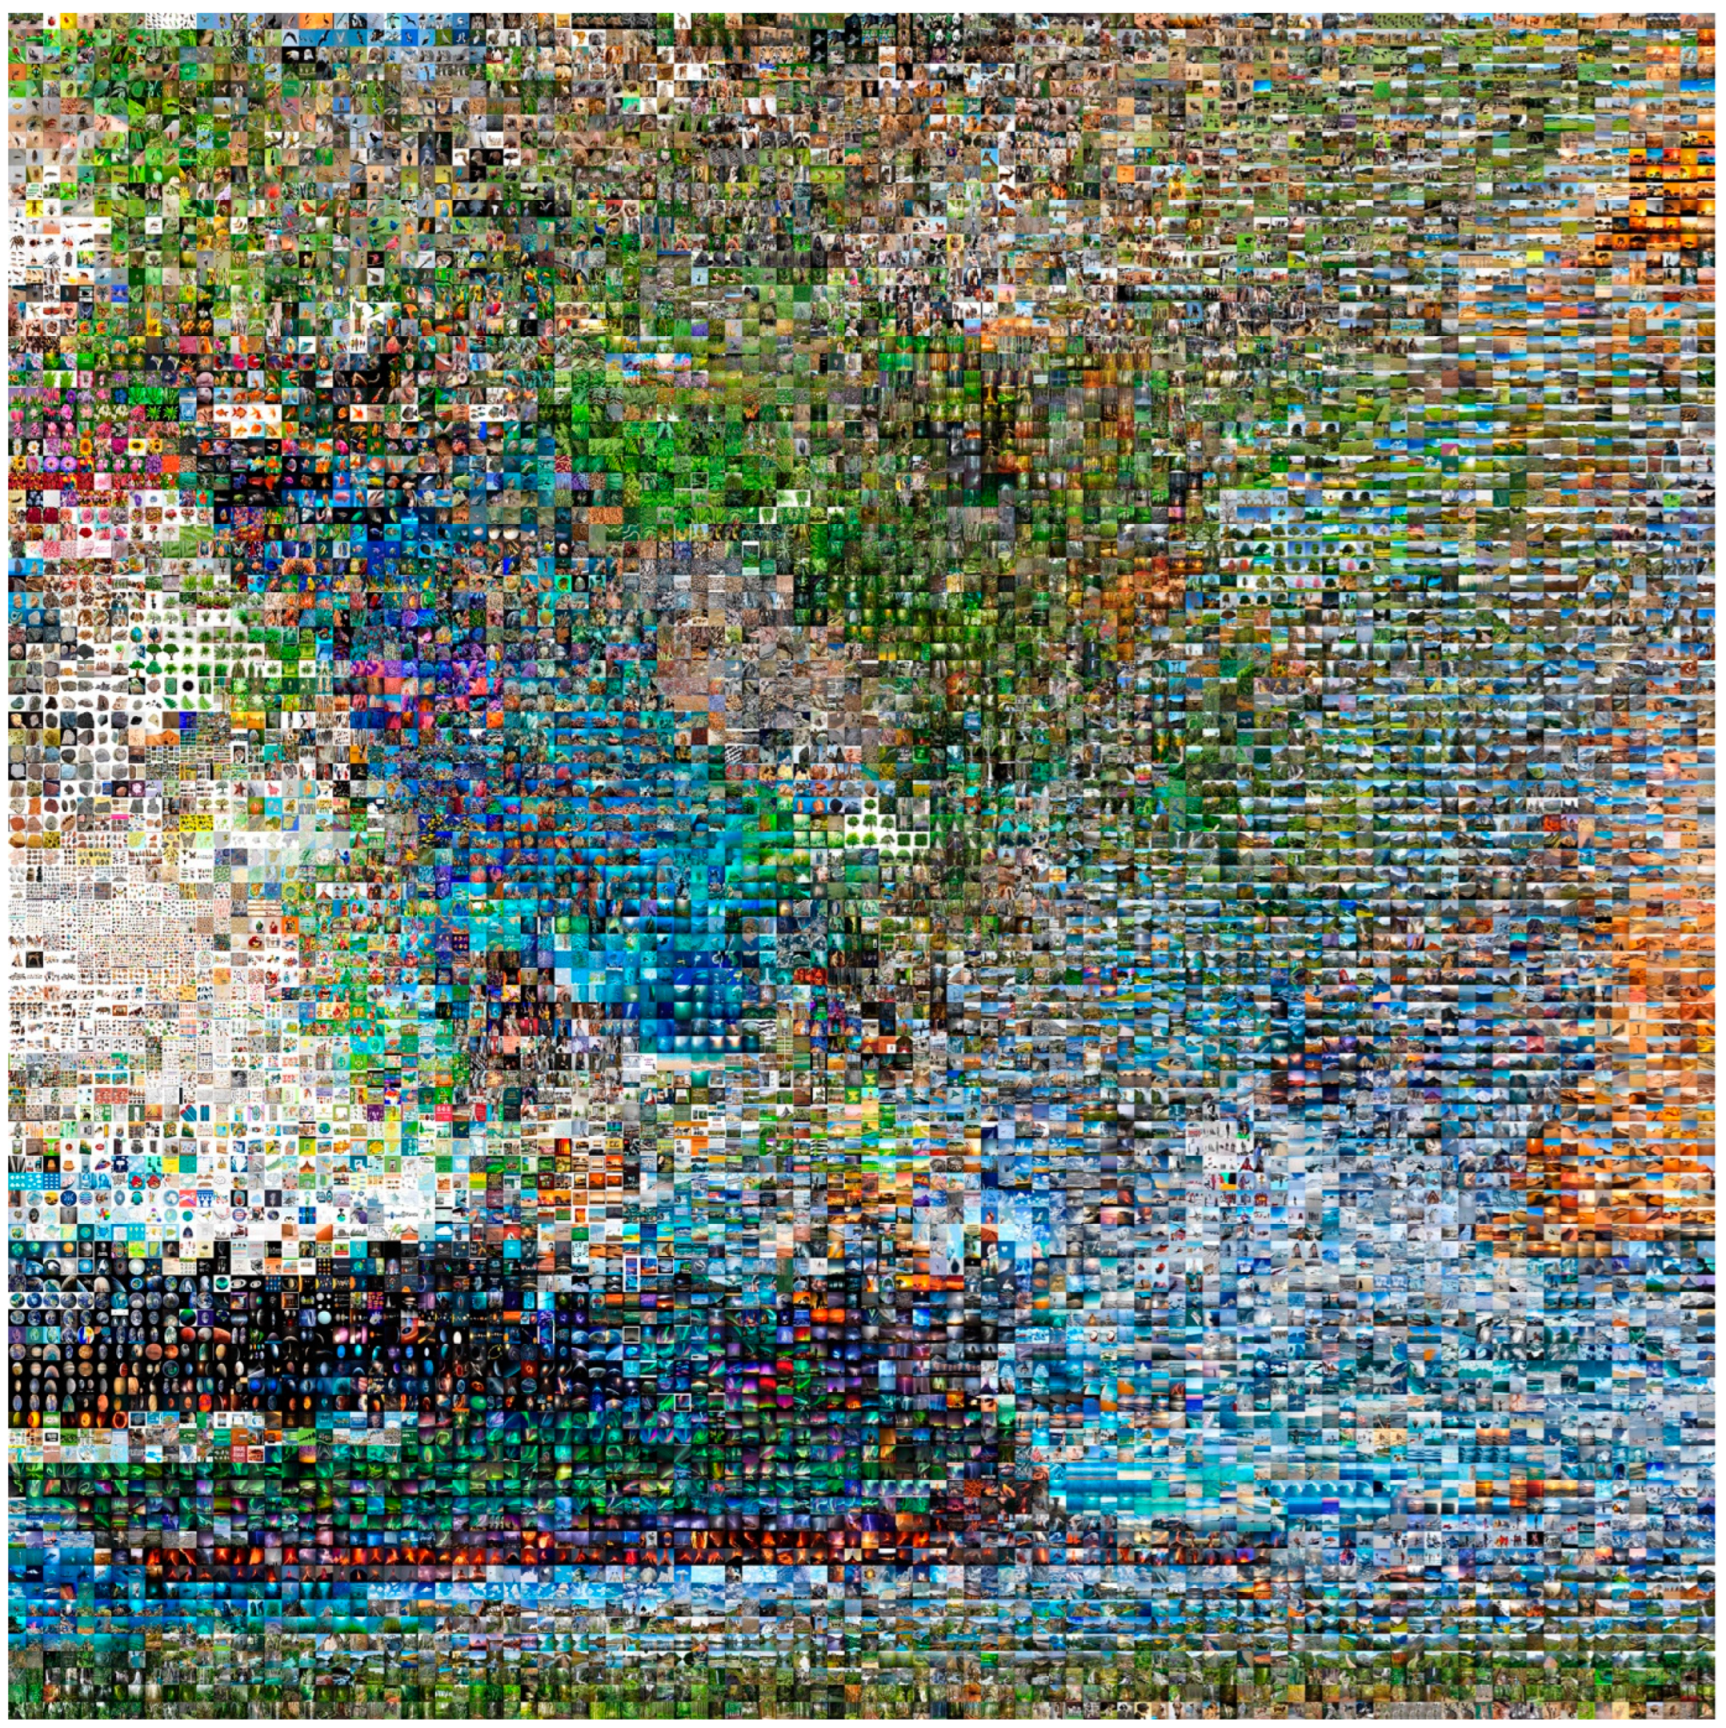
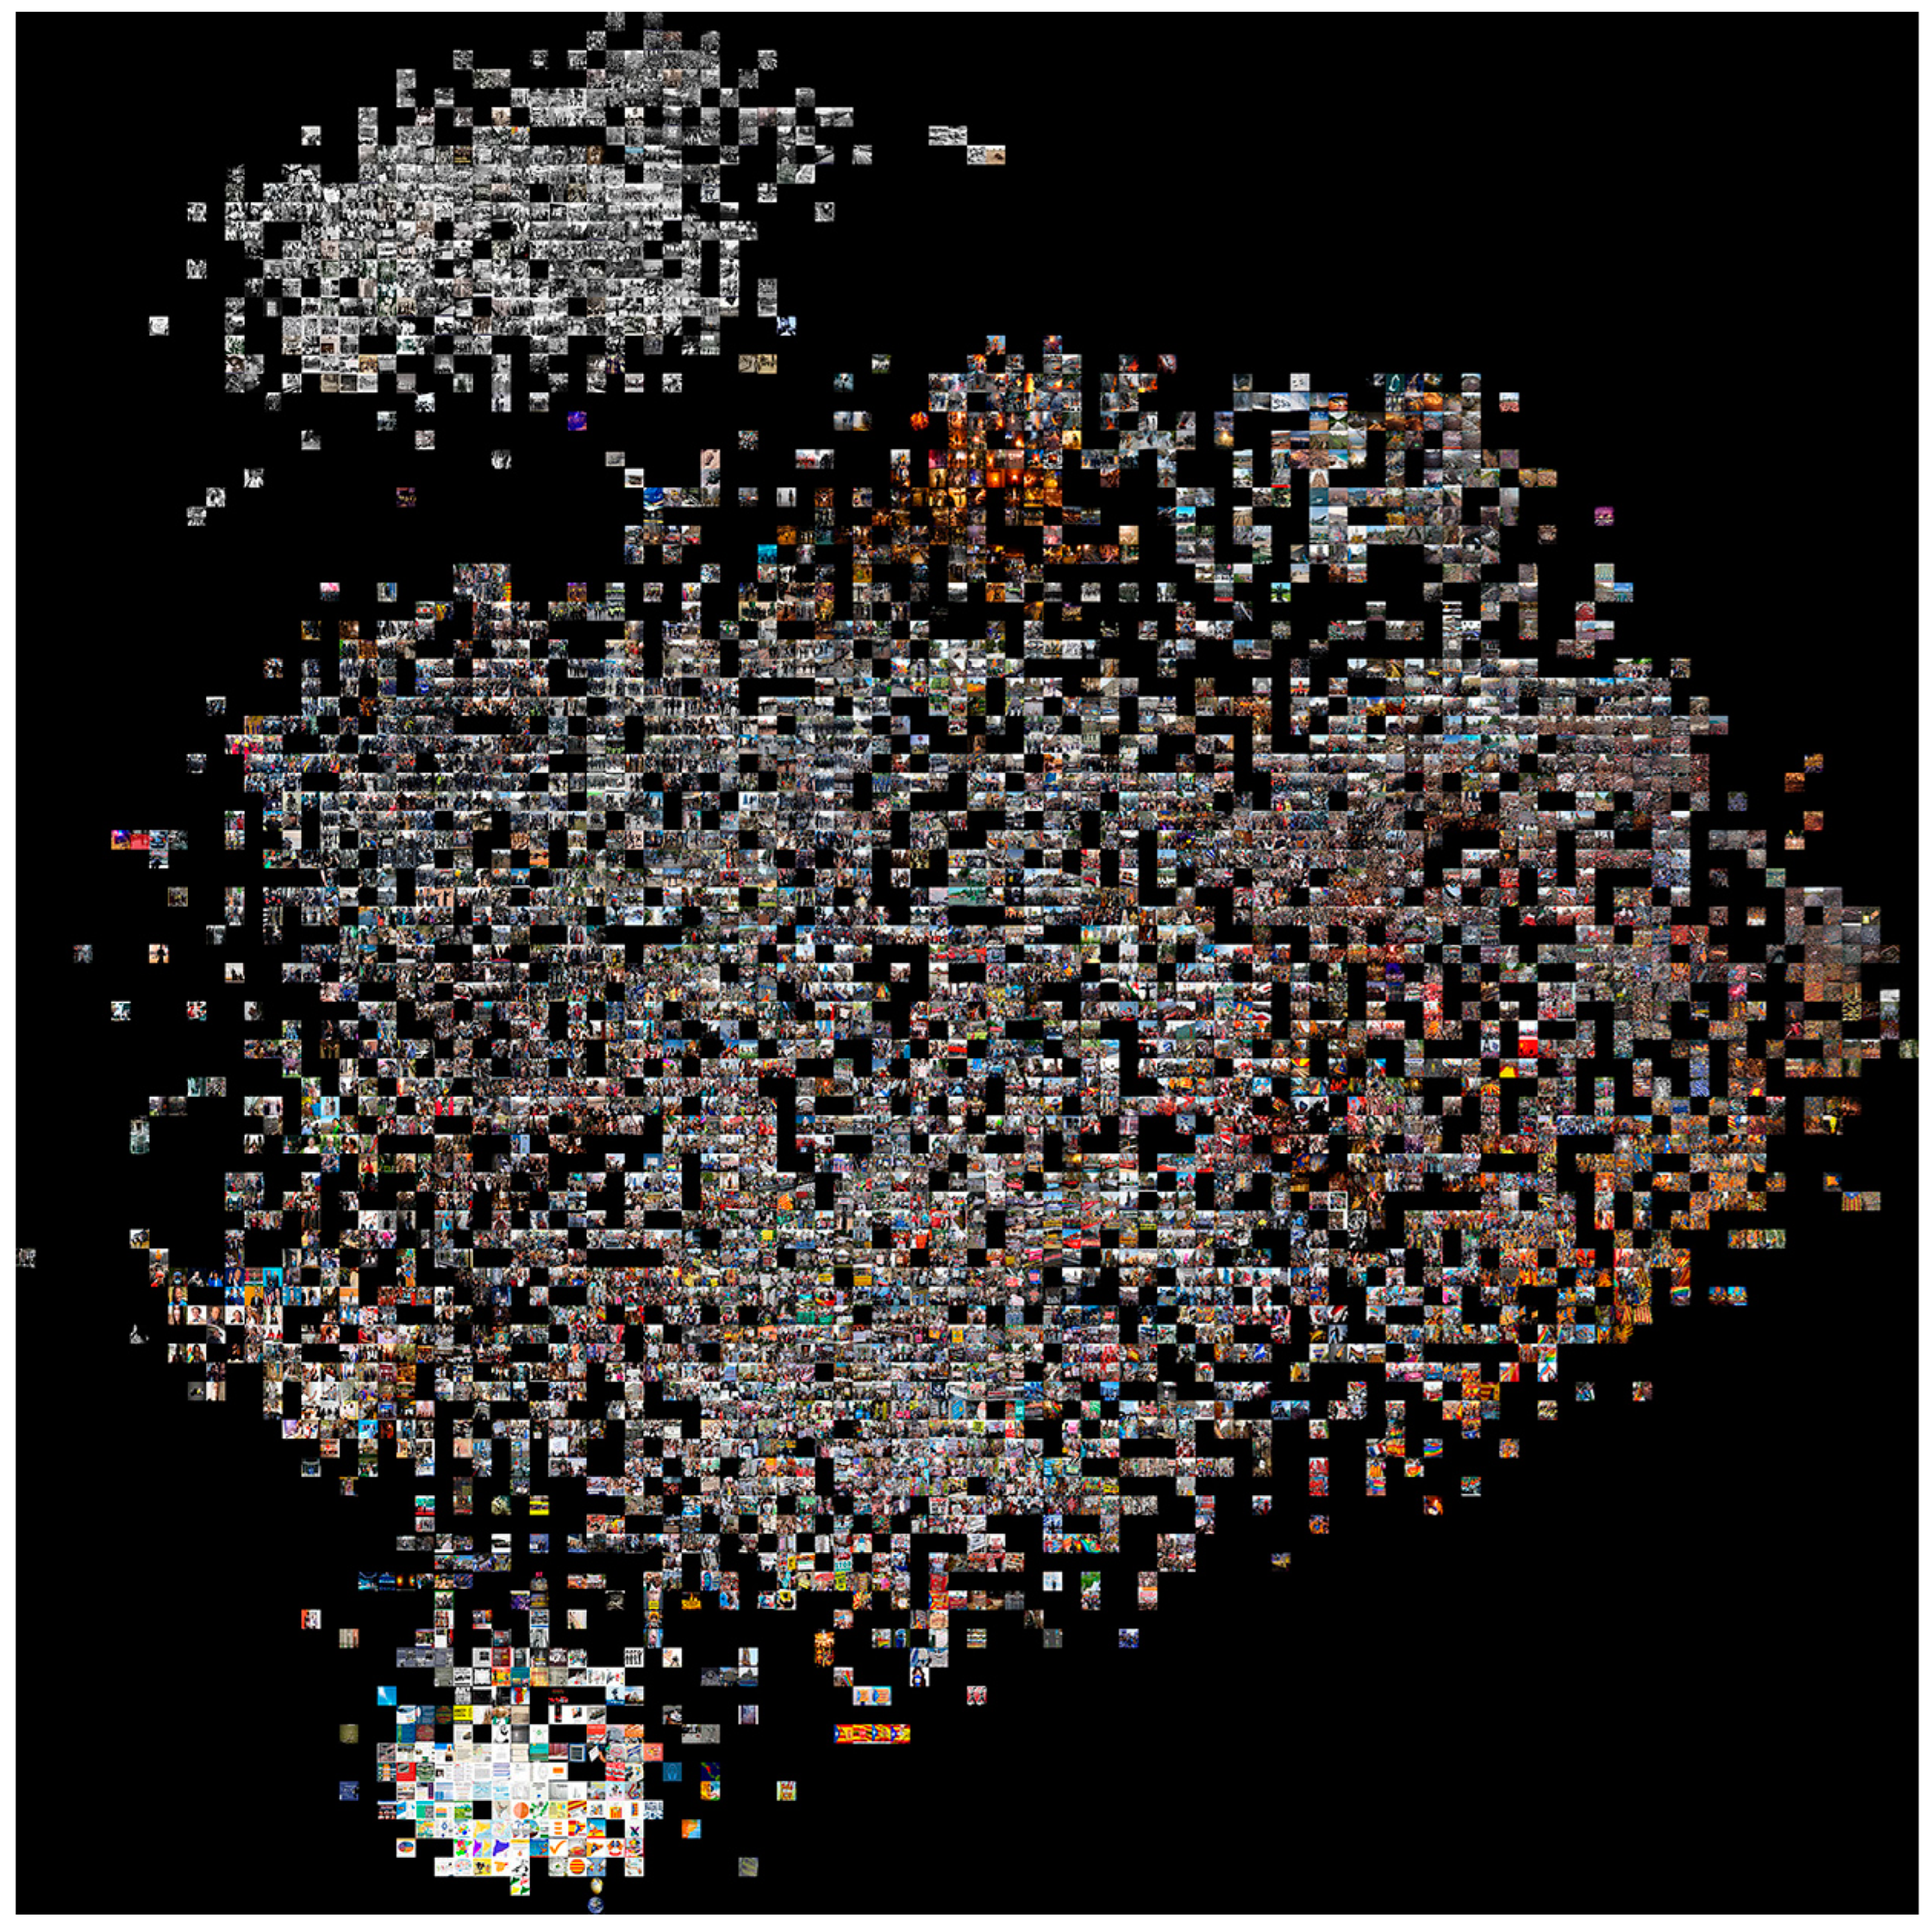
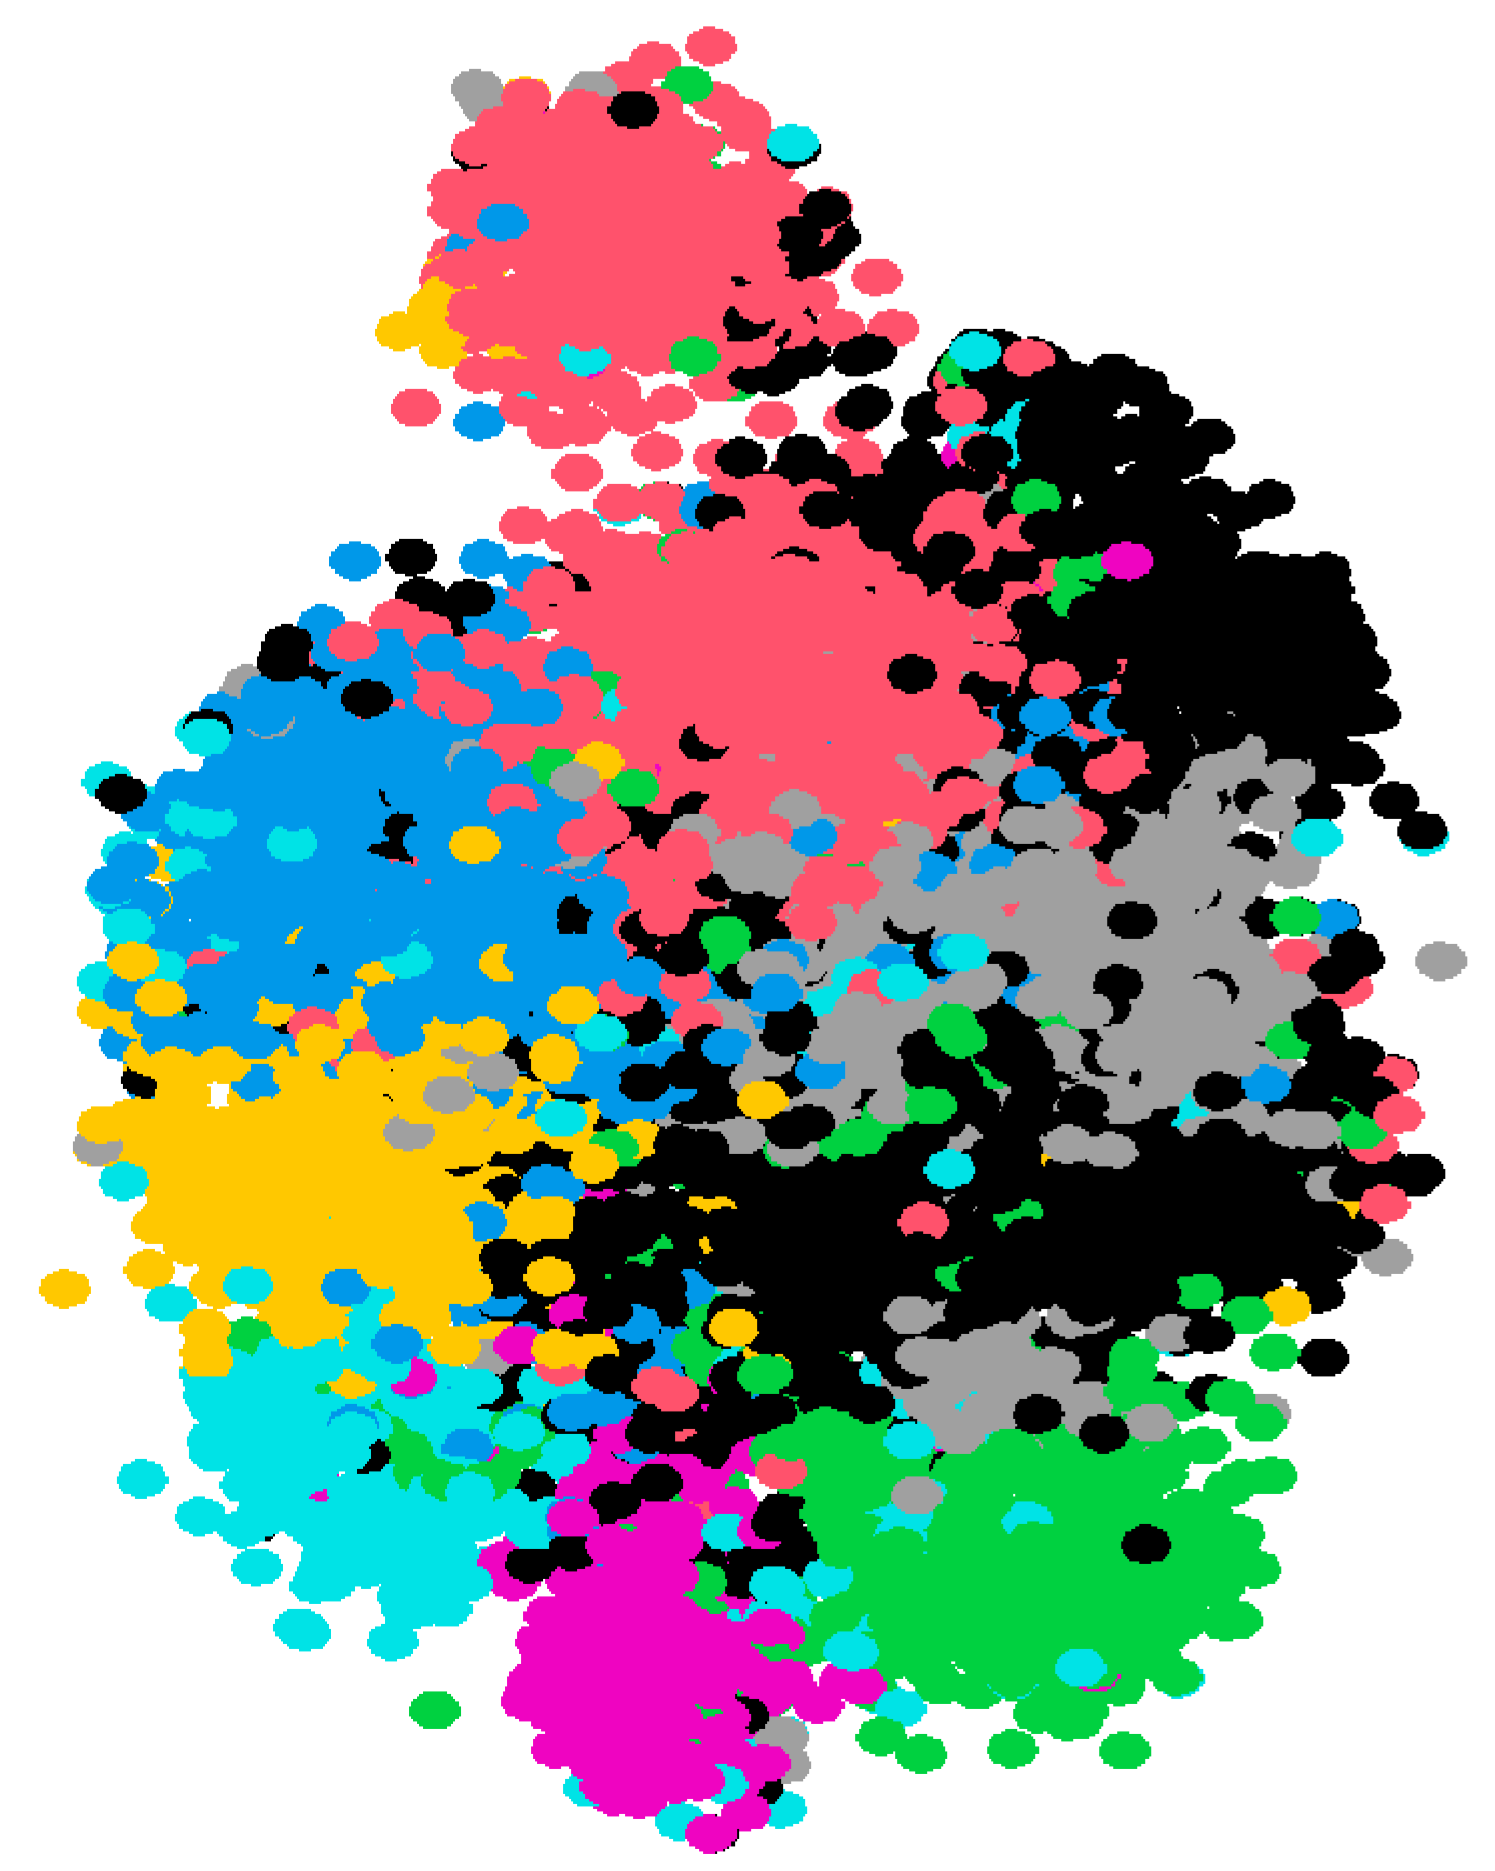
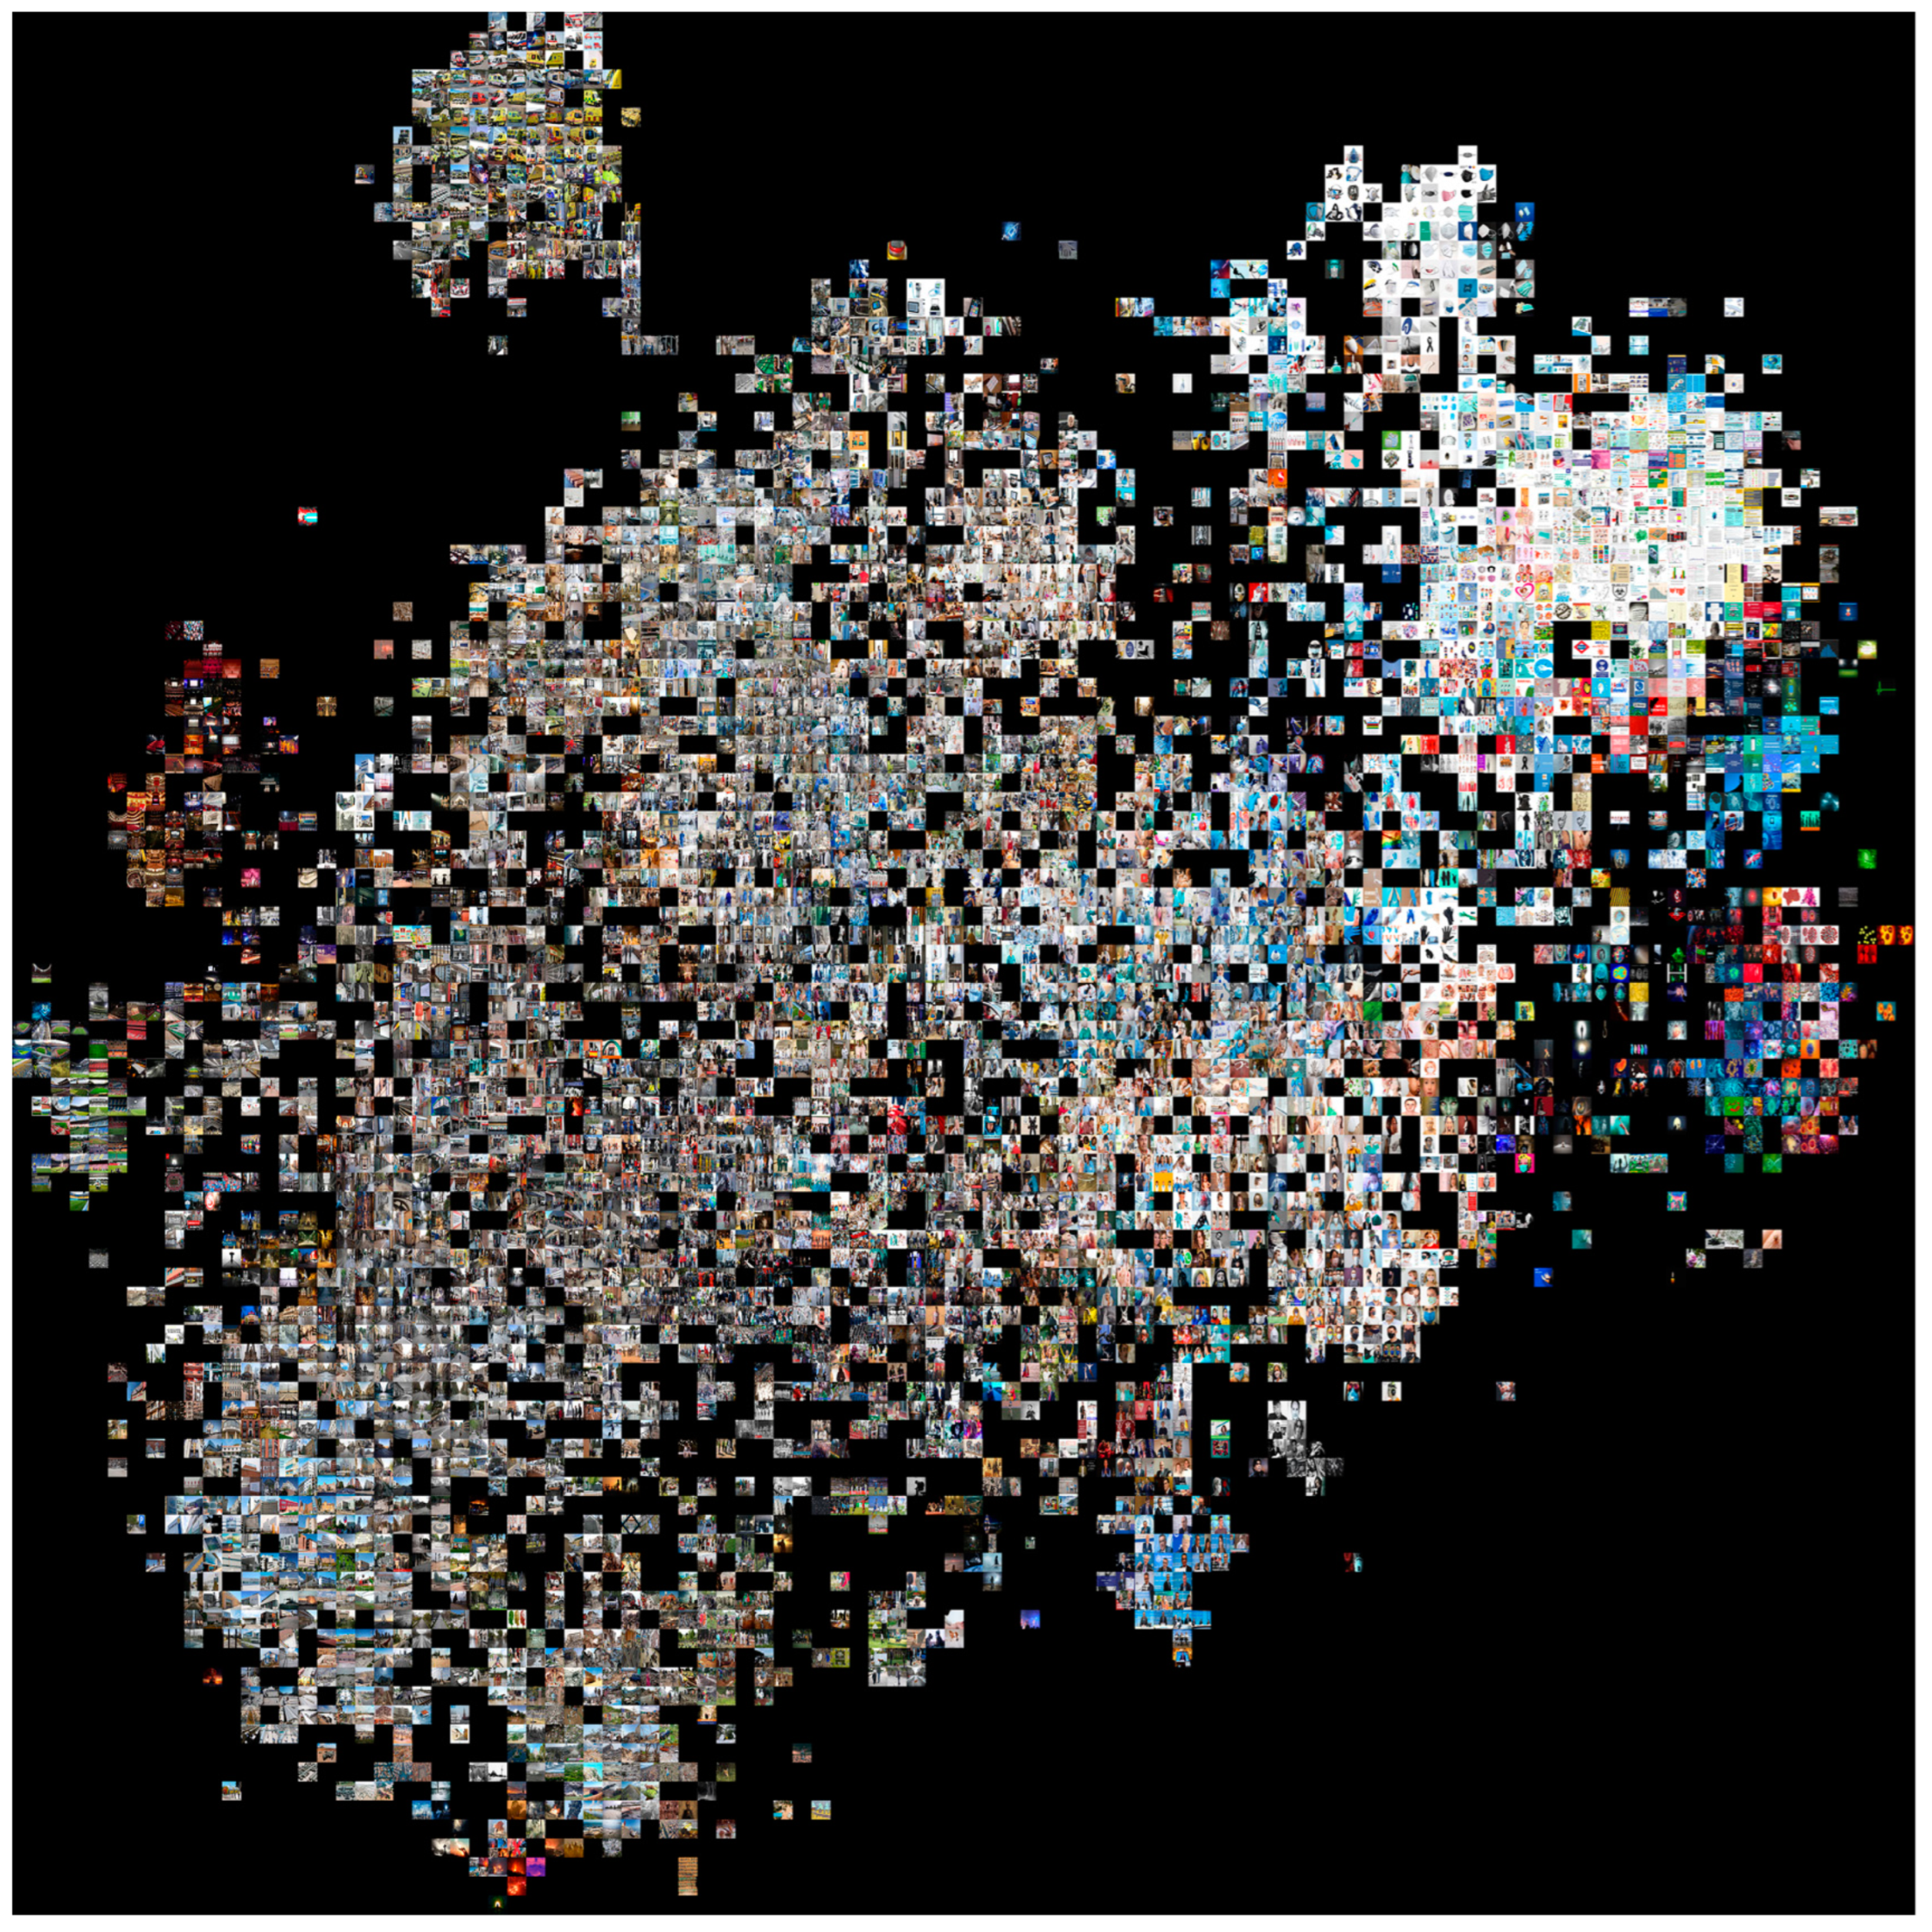
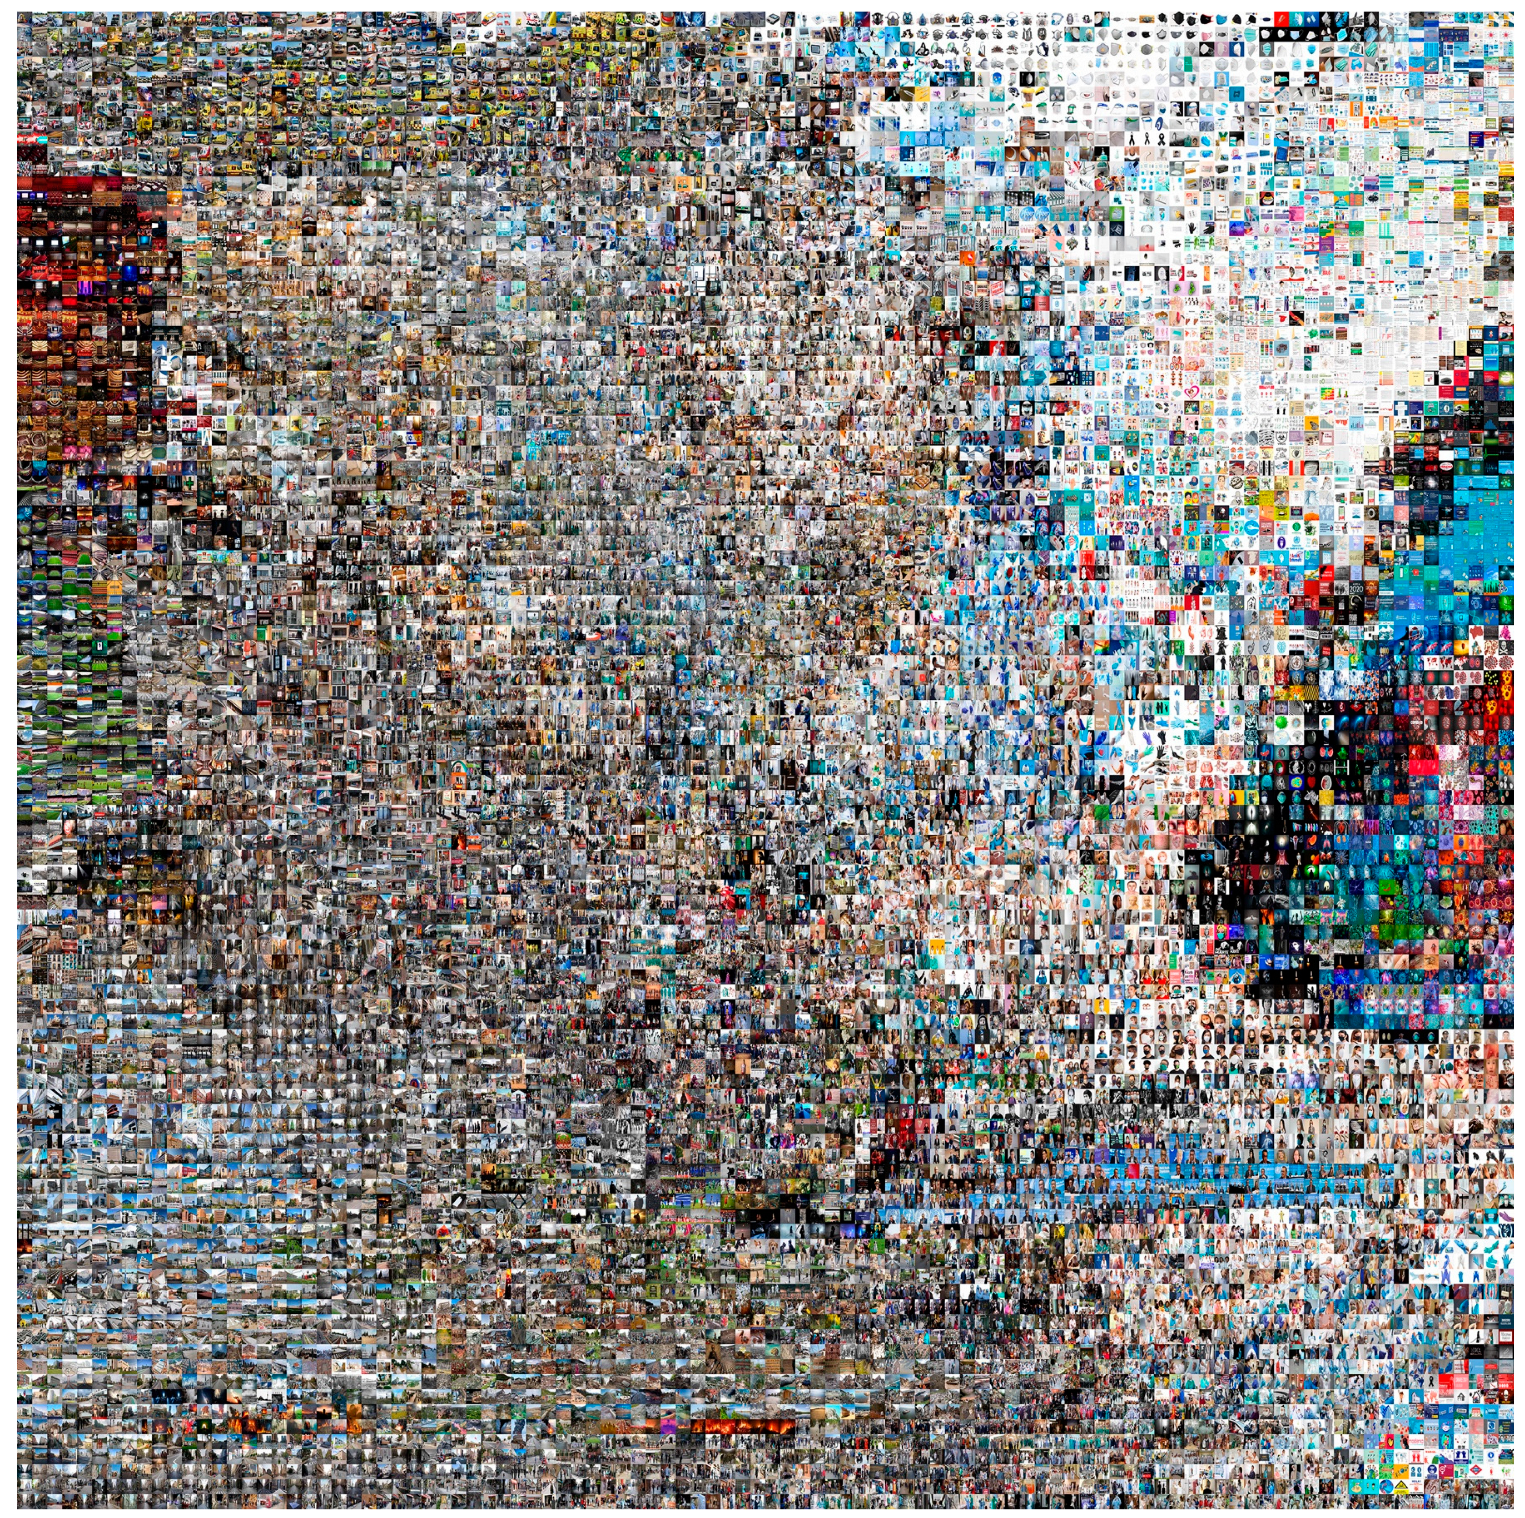
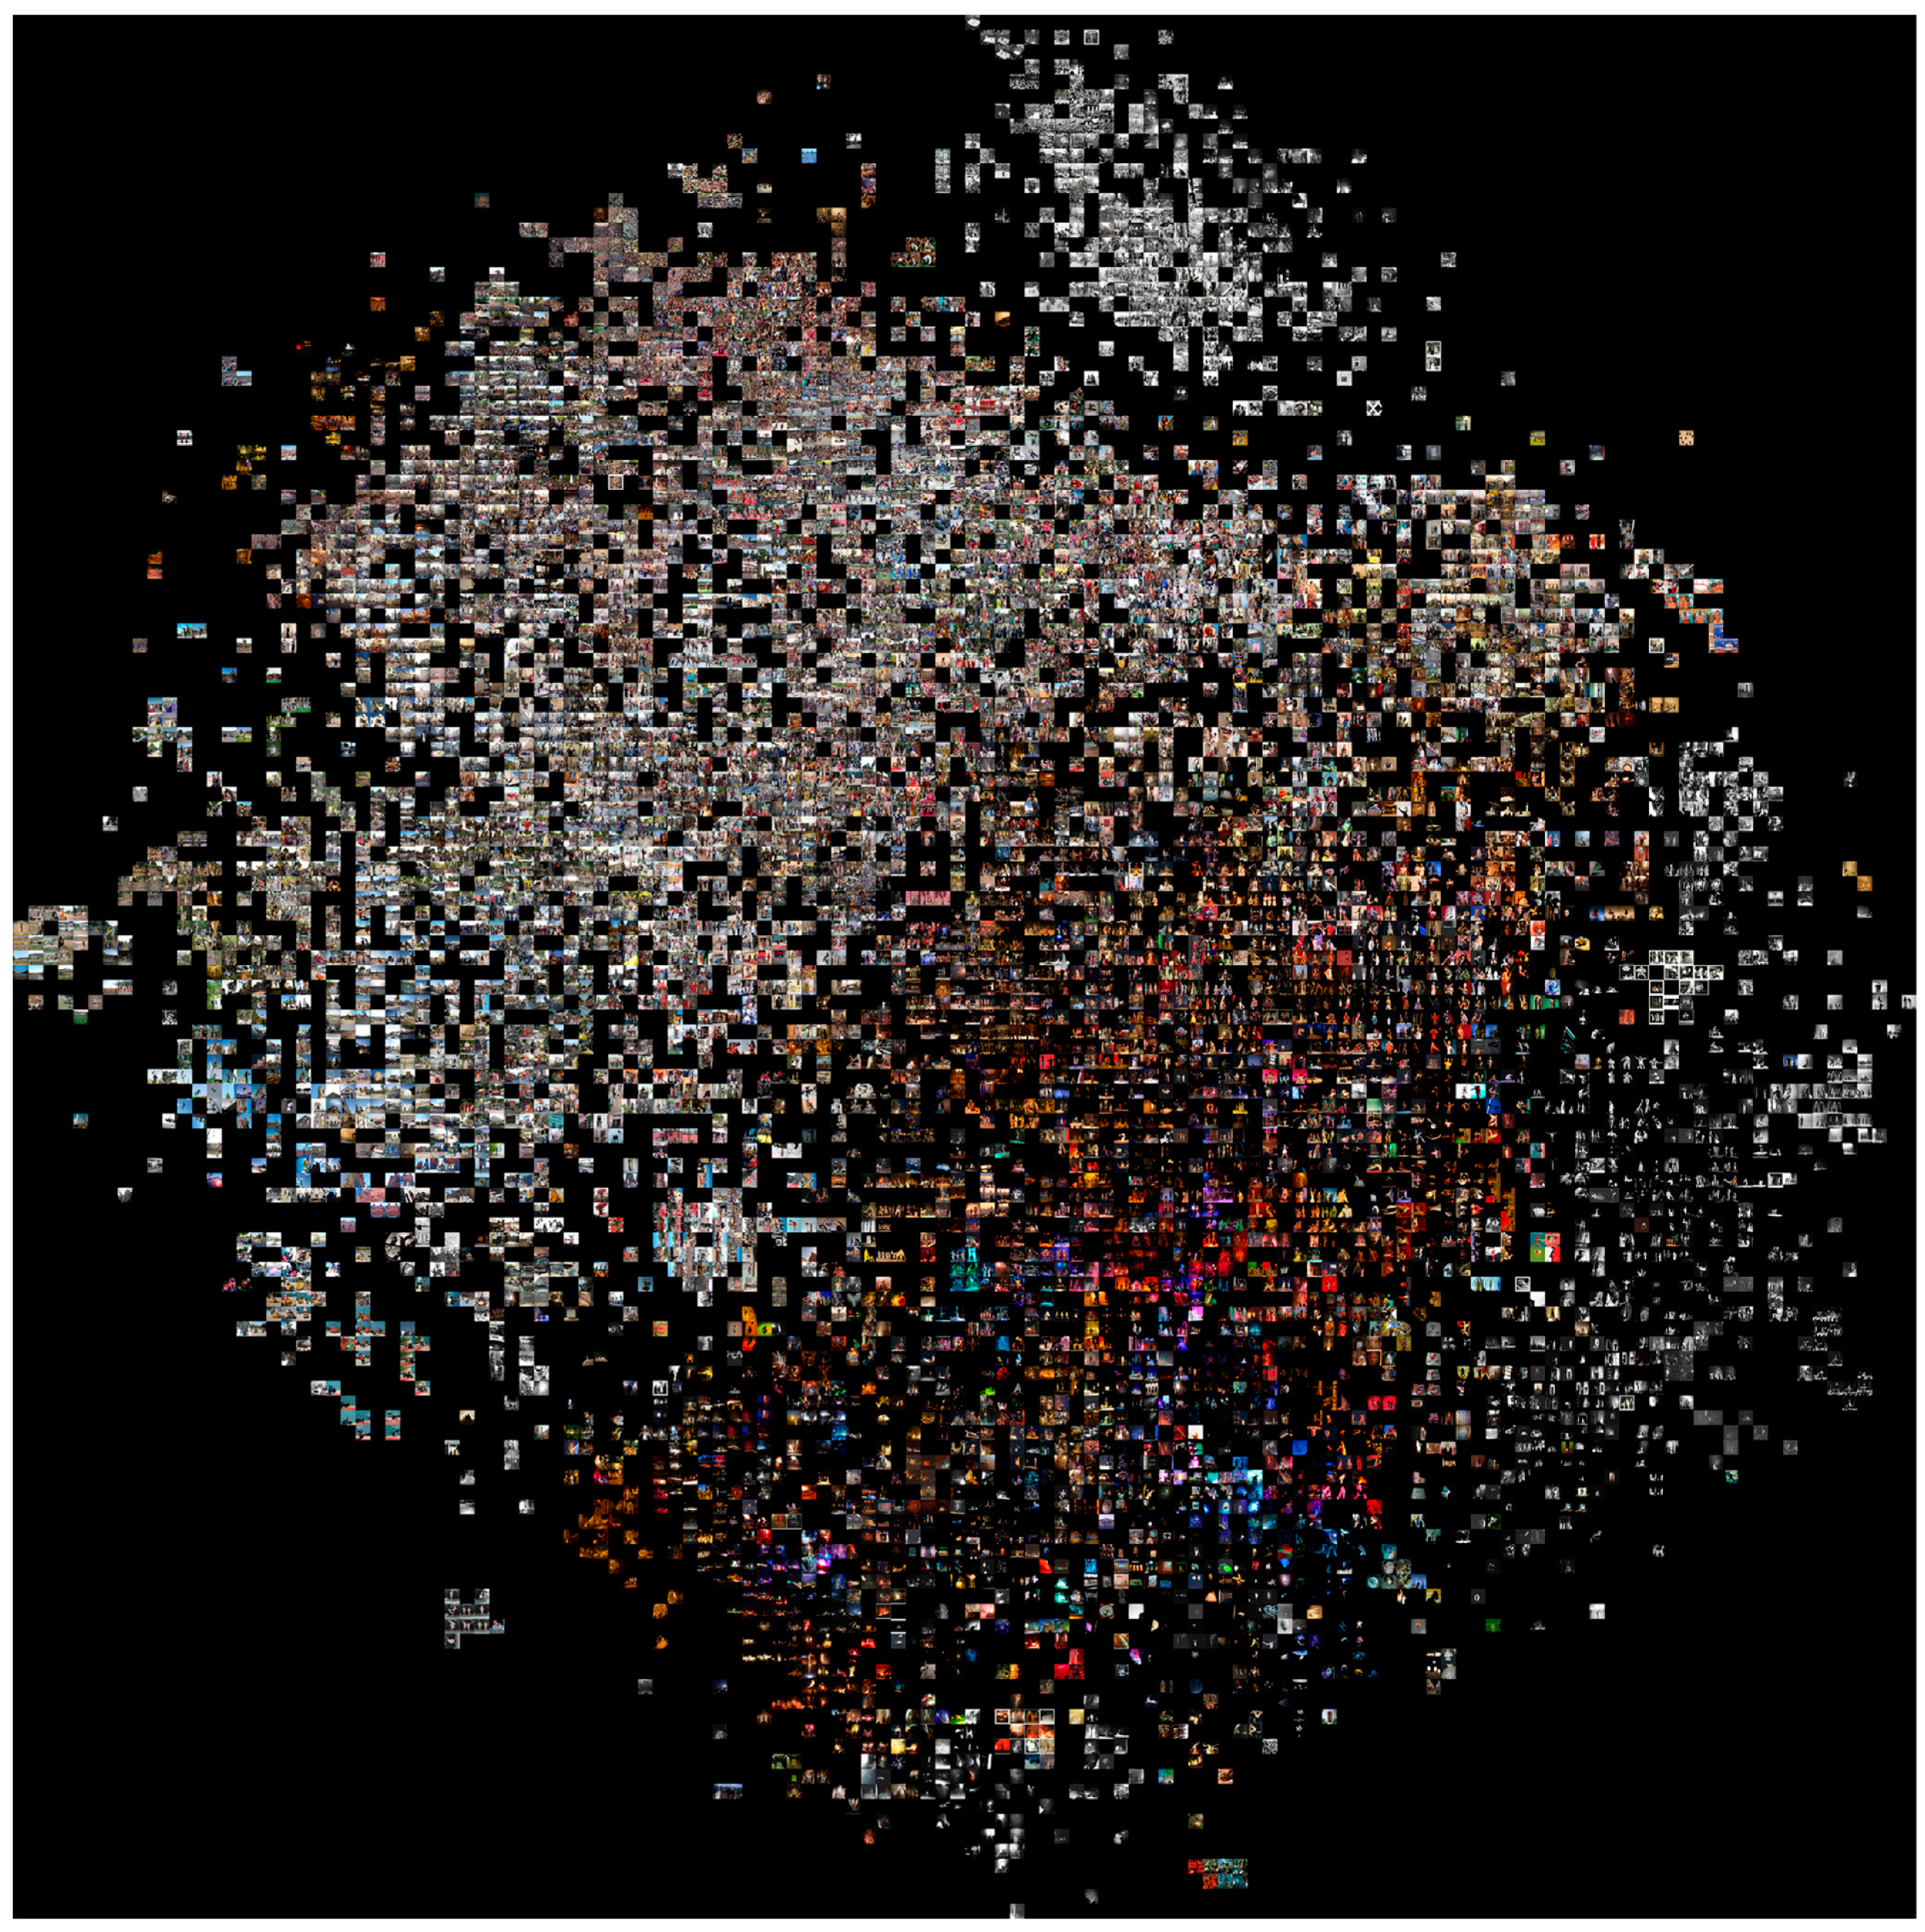
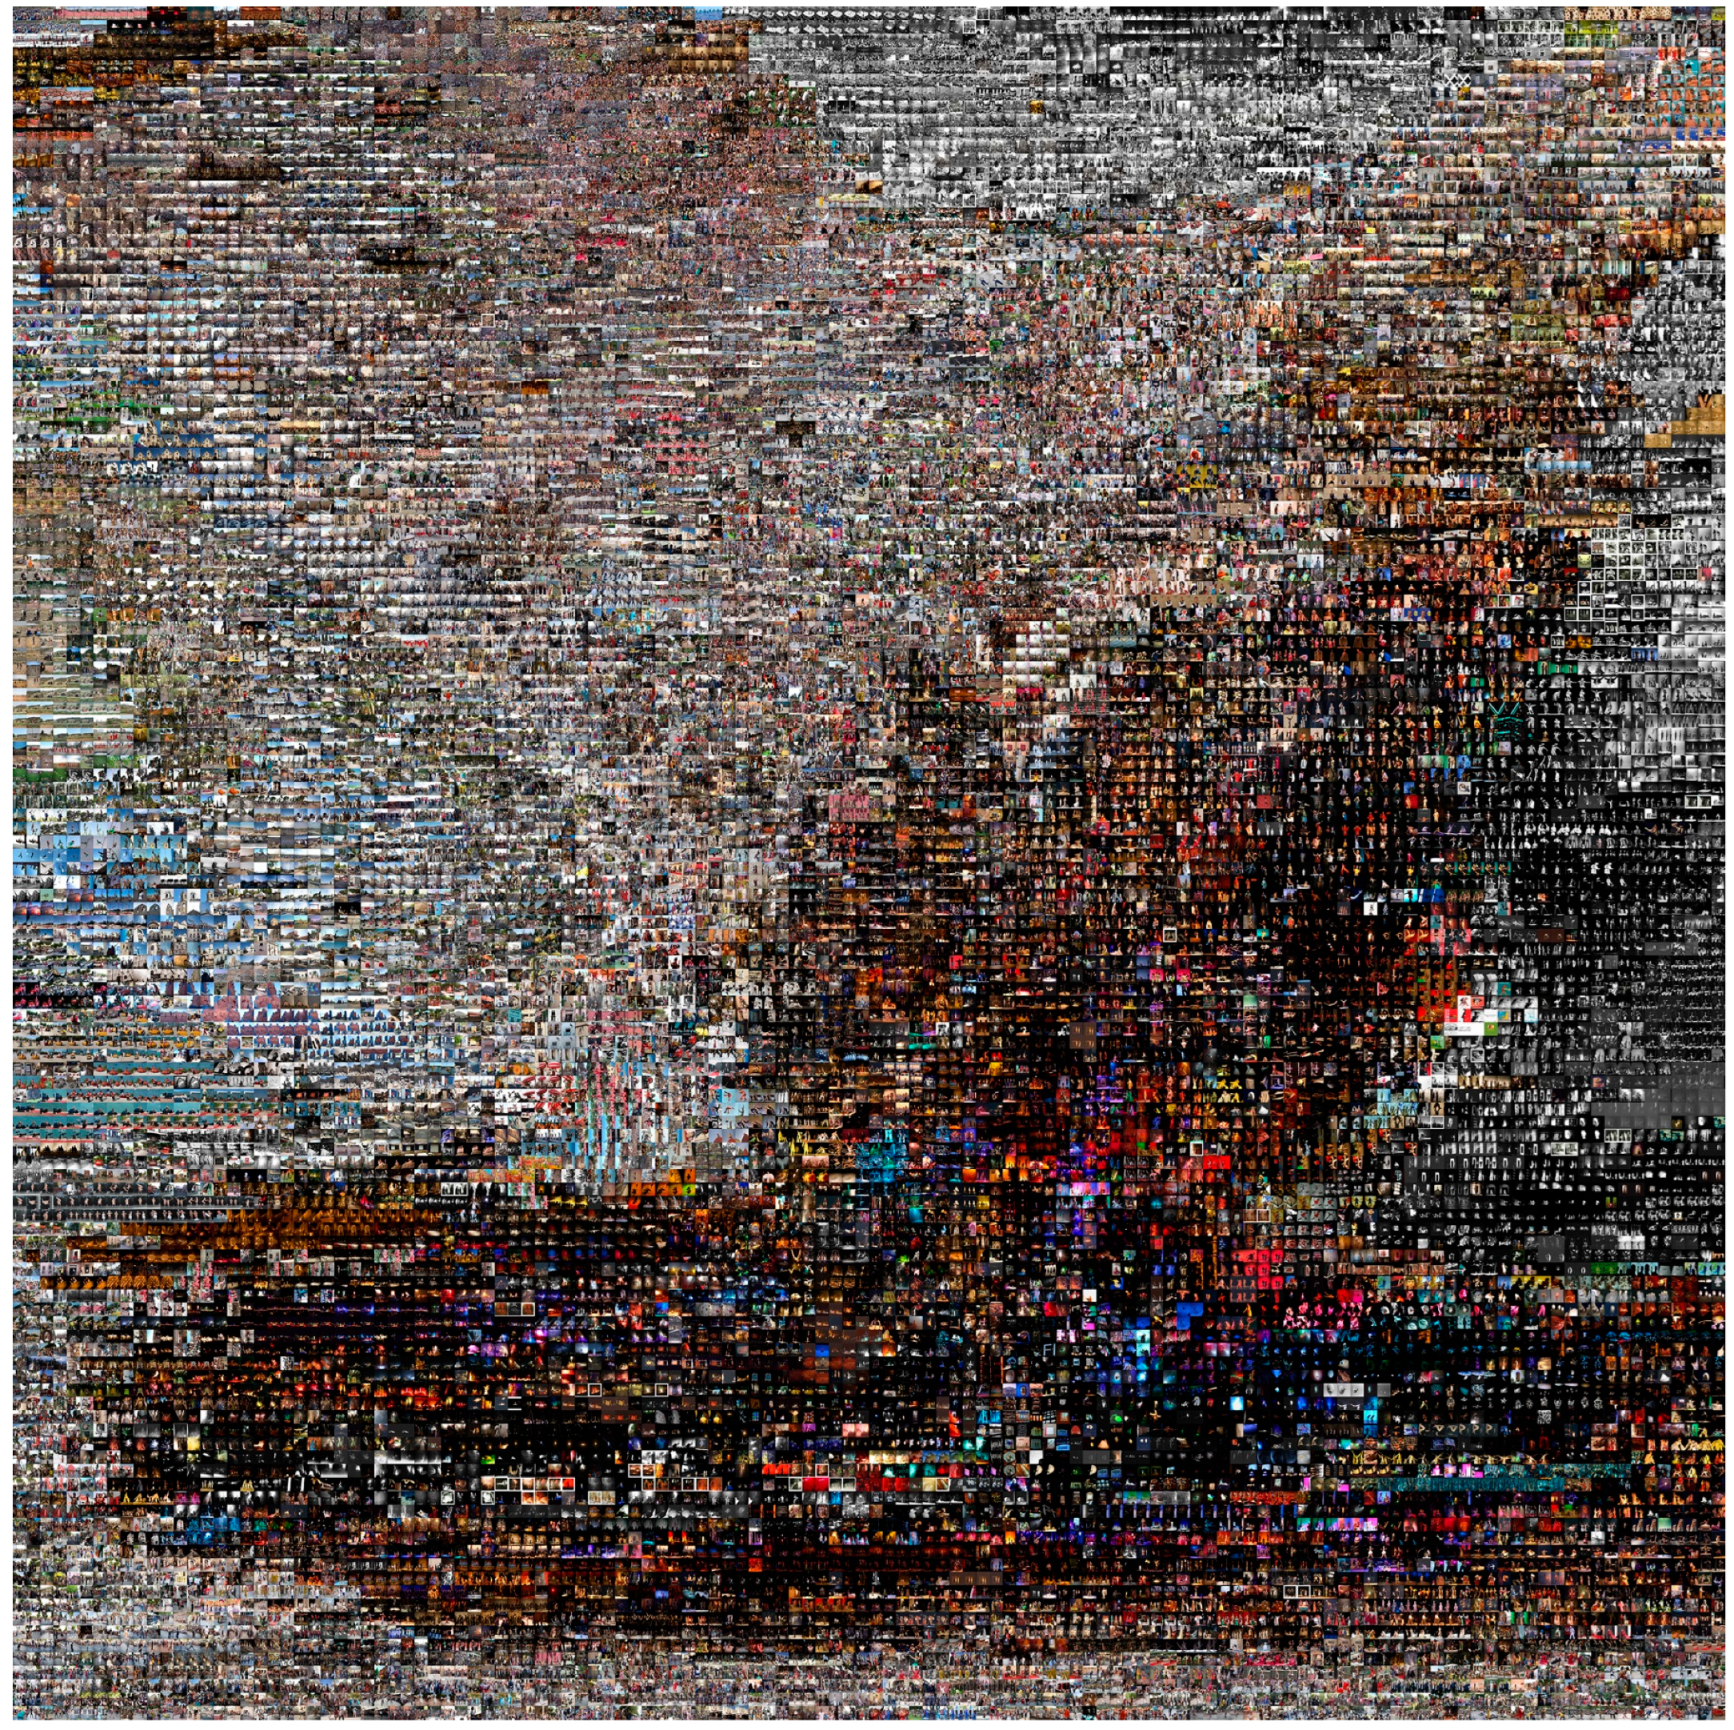
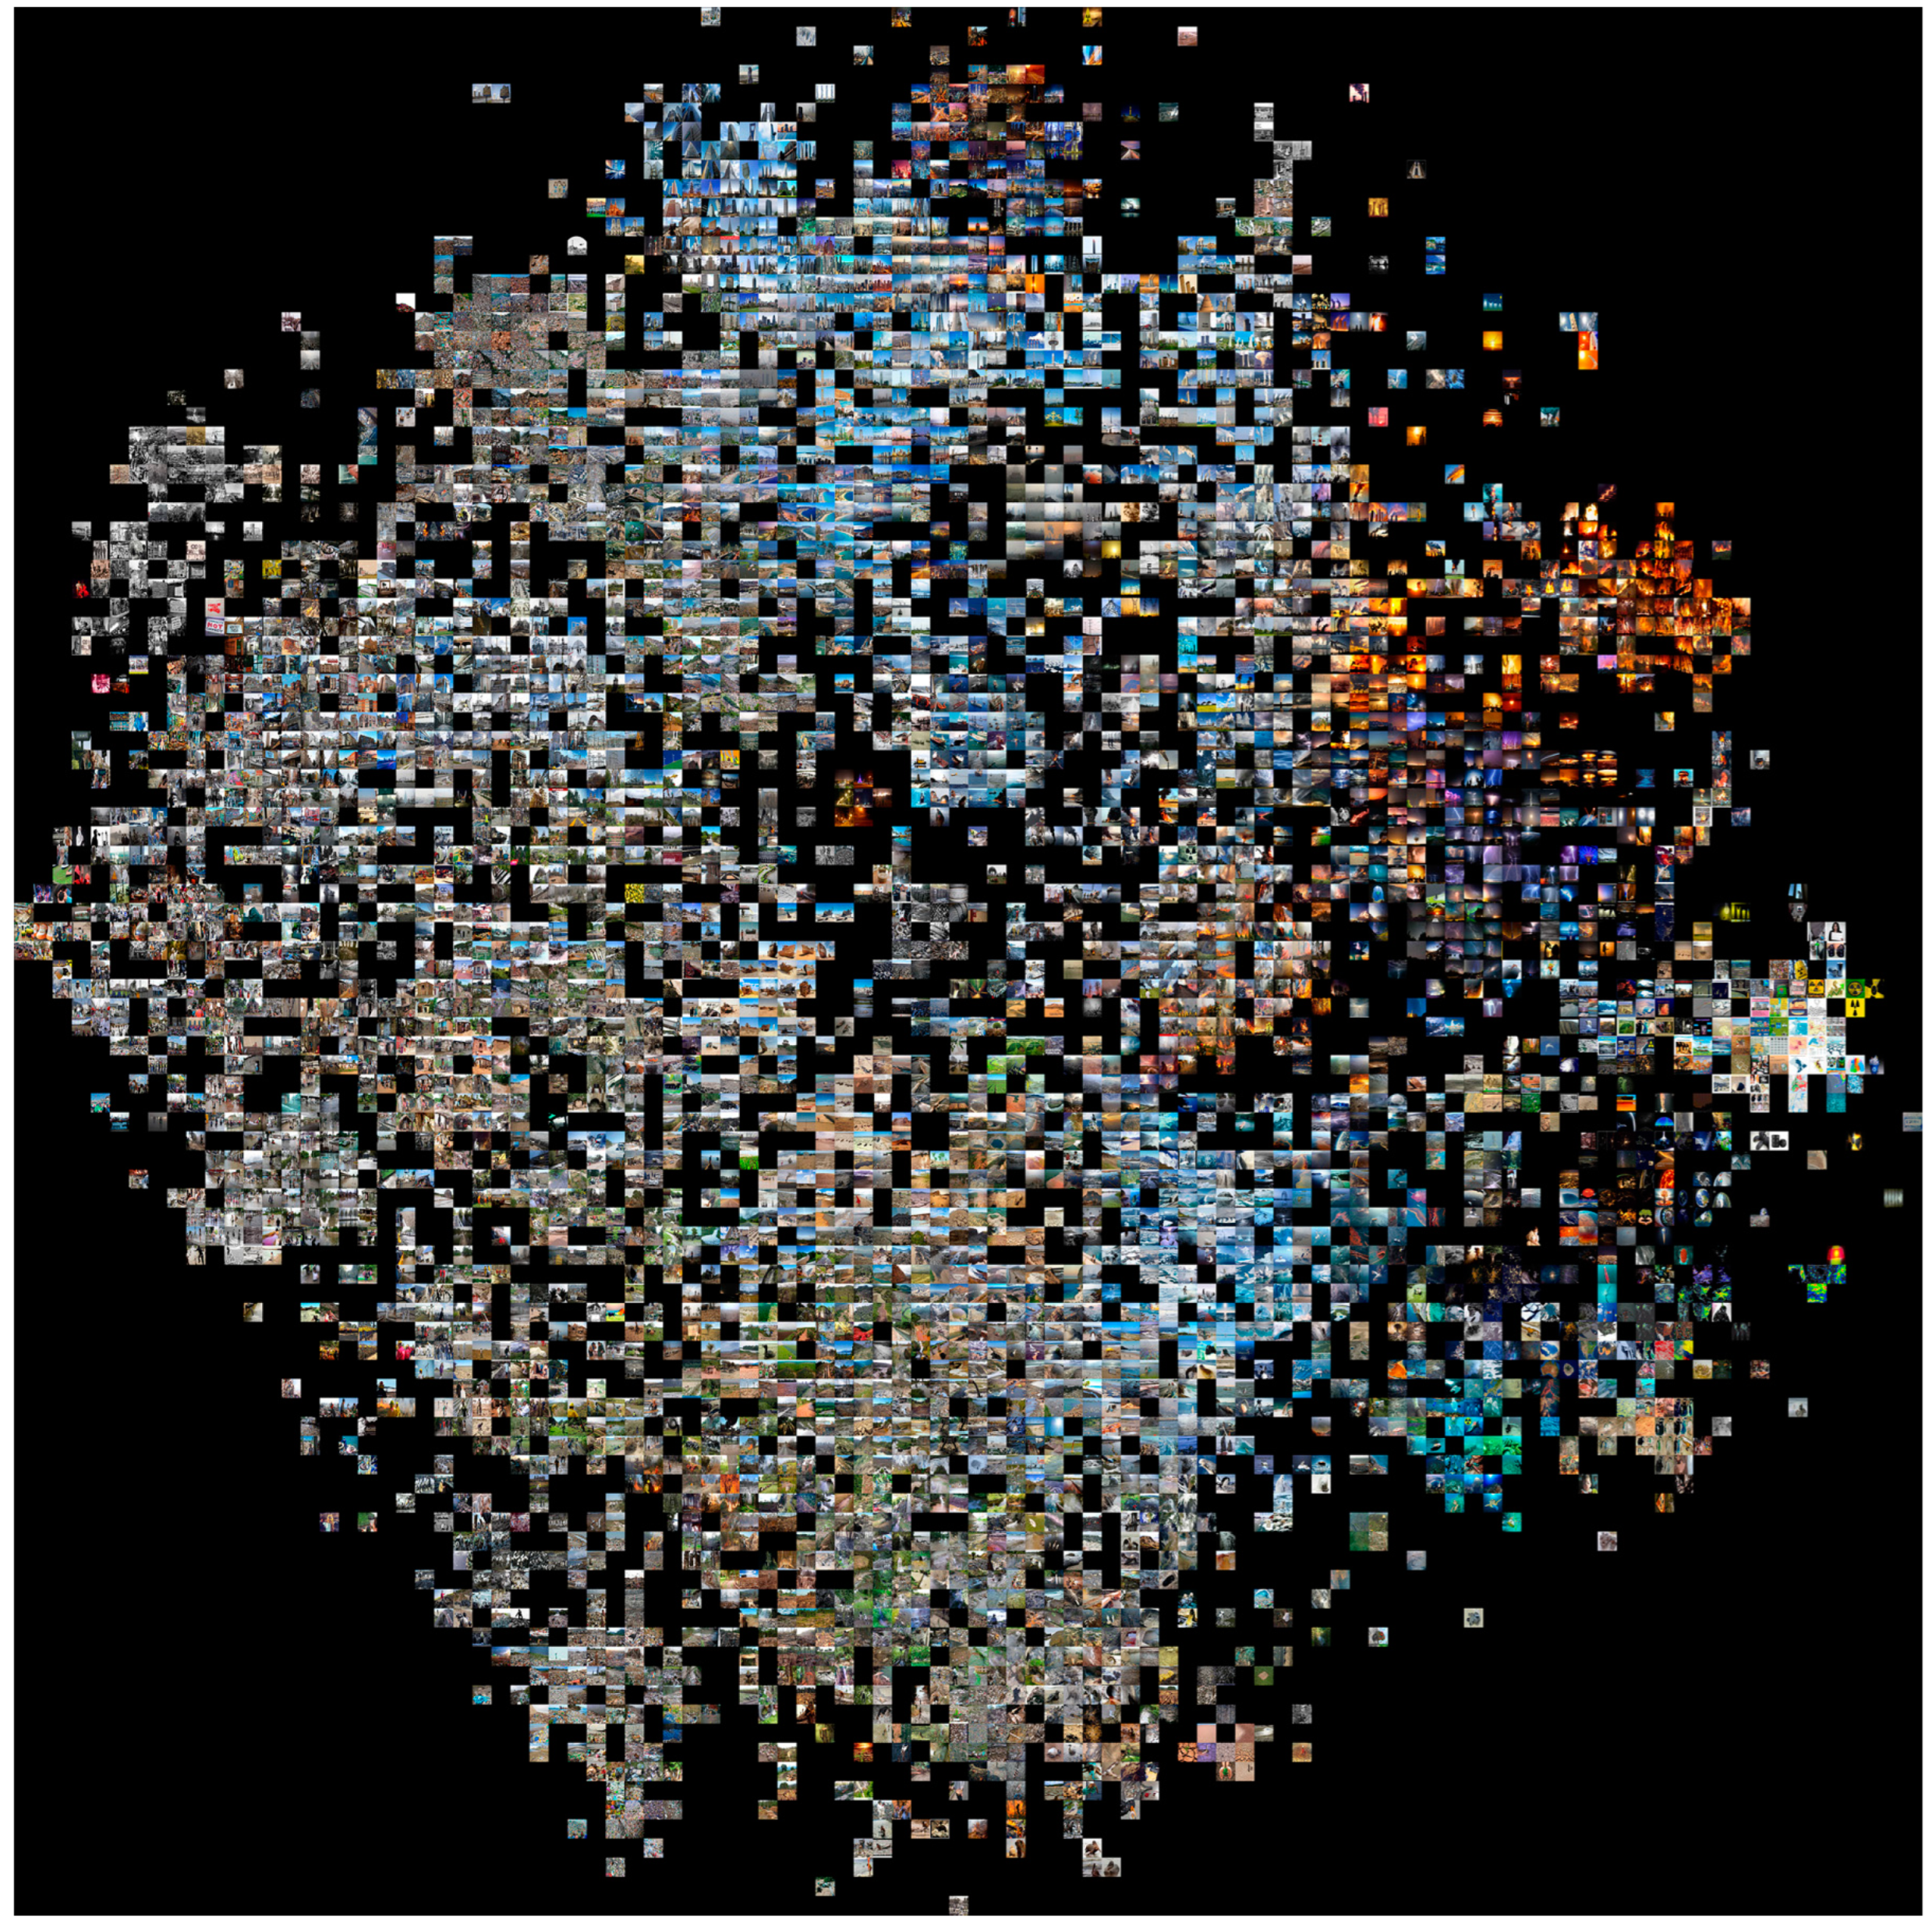
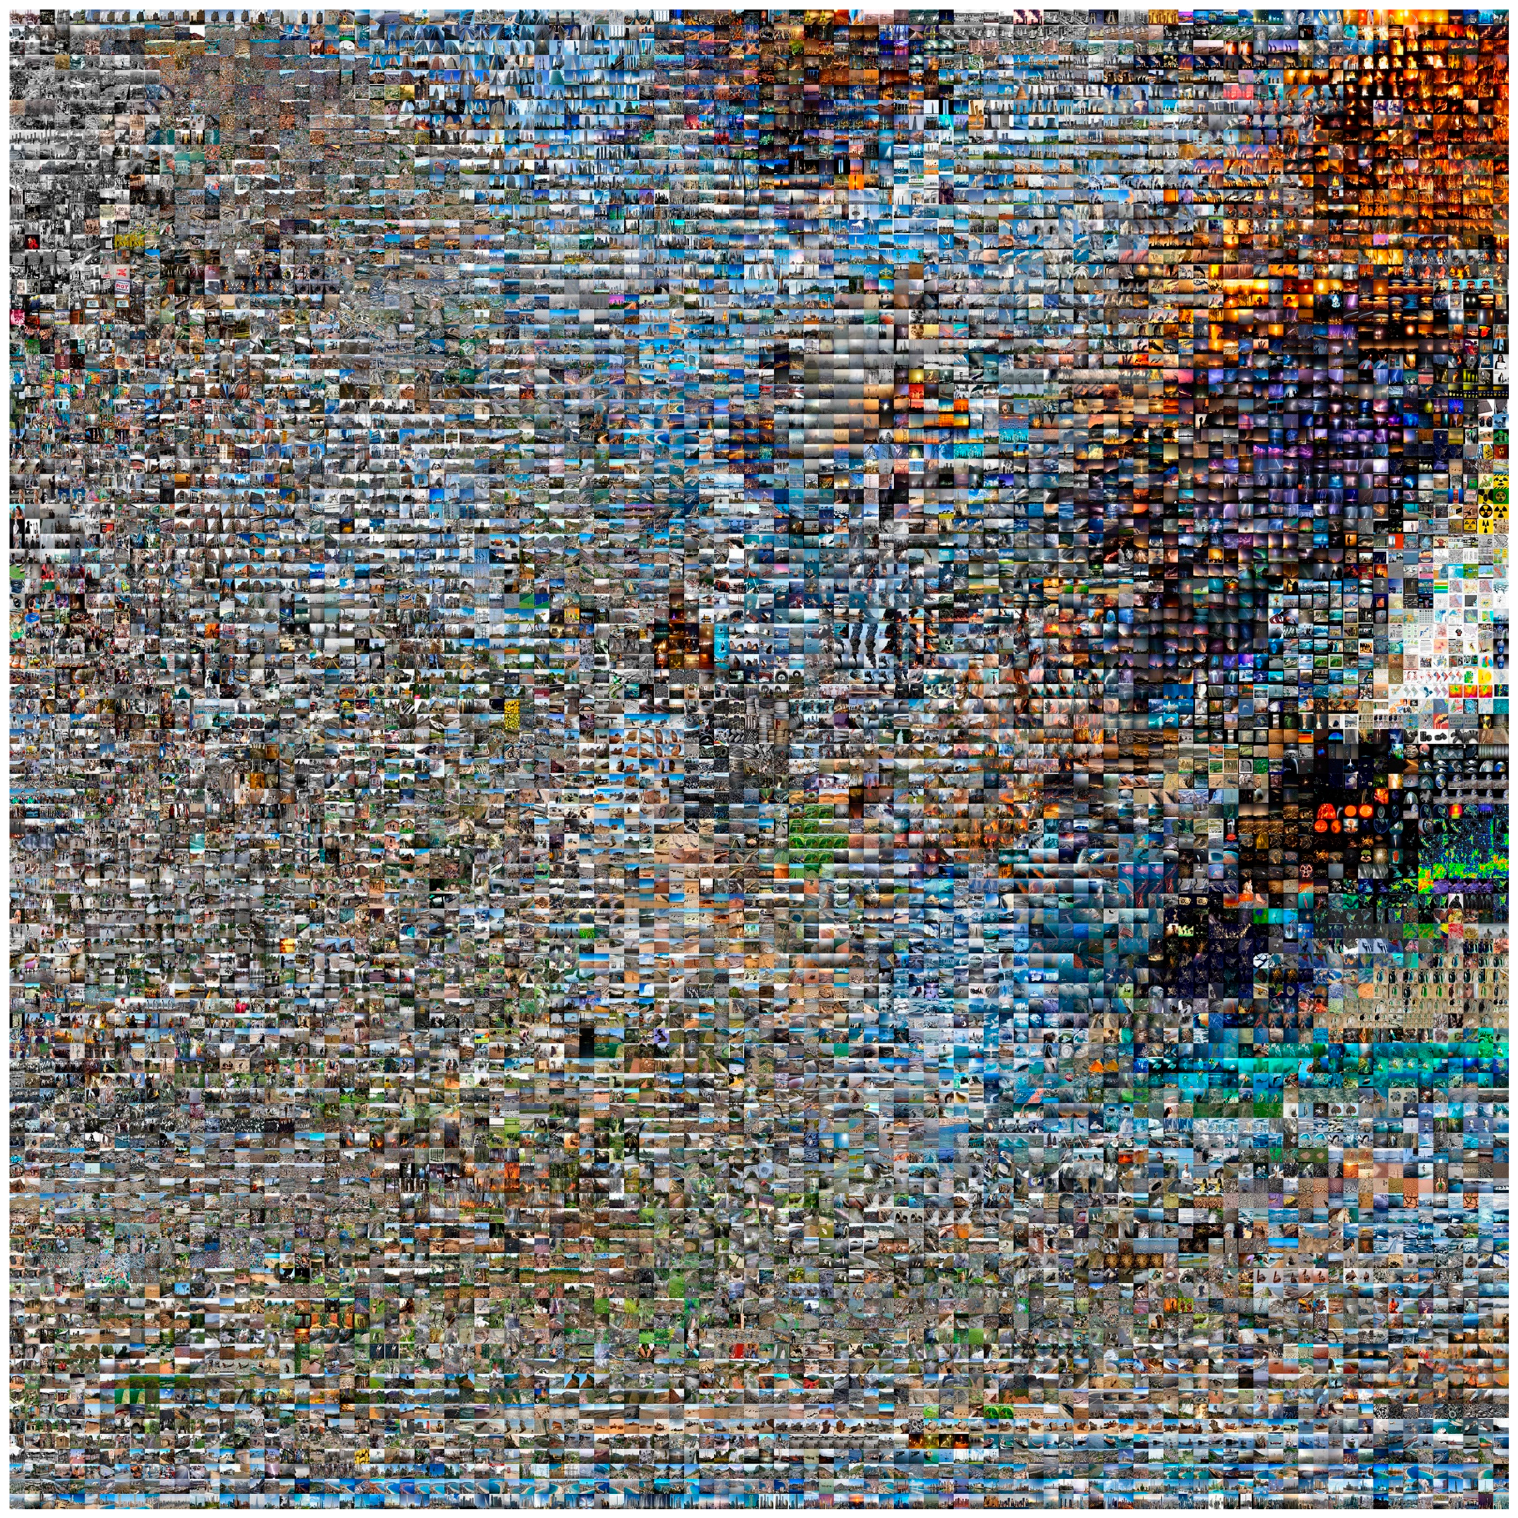
3.1. Computational Cartography of Visual Memory

“Images that are sleeping in files, as documents, may amuse and excite us once again if they are analysed so we can see them with fresh eyes; a pleasure somewhere between the plastic arts and rigorous study” [18] (p. 2).
The artistic project presented in this article is an attempt, using new technologies, to update the idea that Aby Warburg introduced with his Atlas Mnemosyne. Similar to the way in which Warburg must have worked, sitting at his table establishing visual relationships among his images, we worked at our computer keyboard using the Google information search devices. The themes of interest were “climate change”, the “COVID-19 pandemic”, “demonstrations around the world”, and “manifestations of popular culture”.
With the intention of gaining the ability to carry out a critical revision of our shared visual heritage, images were downloaded from the internet, exploring concepts related to social spaces and habits.
The texts of the searches were also relevantly displayed (see Table 1); these started out in a deliberate way according to the interests of the artist, but it soon emerged that they were conditioned by the search results themselves, in a serendipitous process that favored discoveries and lucky windfalls, stemming from an image that called for fresh, unplanned searches, which were as unexpected as they were valuable.
This method of collaborative creation between the artist and the computer becomes a stimulating process of visual learning, of discovery driven by the will but also by chance, leaving a door open to the ability of the subject undertaking the search to notice when something important, though unexpected, has turned up.
Though sharing Warburg’s intention to create a personal cartography by establishing relations and analogies that will, later, permit an open-ended and endless process of re-reading, let us note the methodological difference insofar as, here, a dialogue of co-creation is established with the computer, allowing for the search criteria to be stimulated and hybridized by the criteria of the machine.
Having downloaded 10,000 images for each concept (climate change, COVID-19 pandemic, demonstrations, popular culture), the methods of deep learning were applied, as described in the Materials and Methods section, to obtain all the images ordered in a large photograph of 2 × 2 m. The intention, by means of these large visual maps, was to crystallize the thoughts and interests of the artist, in a meandering trek through the visual information present in this set of images extracted from the internet. Let us point out that the final size of the maps is conditioned by the process of deciding the size and number of the images downloaded; this decision obeys the purpose of obtaining large photographs that will not, however, surpass the human scale, so that it is possible for both the whole and the parts to be encompassed in the same gaze, simultaneously revealing to us the details of the smaller images as well as the configuration of the archetypes of the entire piece. At a distance, the large photographs display appreciable pictorial qualities of abstract art, while the small photographs appear as brush strokes, shrinking the objective representations that they contain until all that they represent is the visual tension established by the formal gradation in which they are placed. Later, it is the spectators who will establish their own visual paths across the maps, which add up to a great visual atlas, or, as the subtitle to the article suggests, “computational cartographies of visual memory” pertaining to the different concepts obtained from the internet.
An atlas is, in fact, a visual means of knowing. It is not a dictionary, or a manual, or a catalogue. The knowledge that it offers is open: in the presence of images, words are superfluous. An atlas reveals a passion for morphologies, but turns away from strict categorization. As with an atlas, the gaze of the reader can wander, scanning erratically, finding or not, leading to a cartography that is entirely individual.

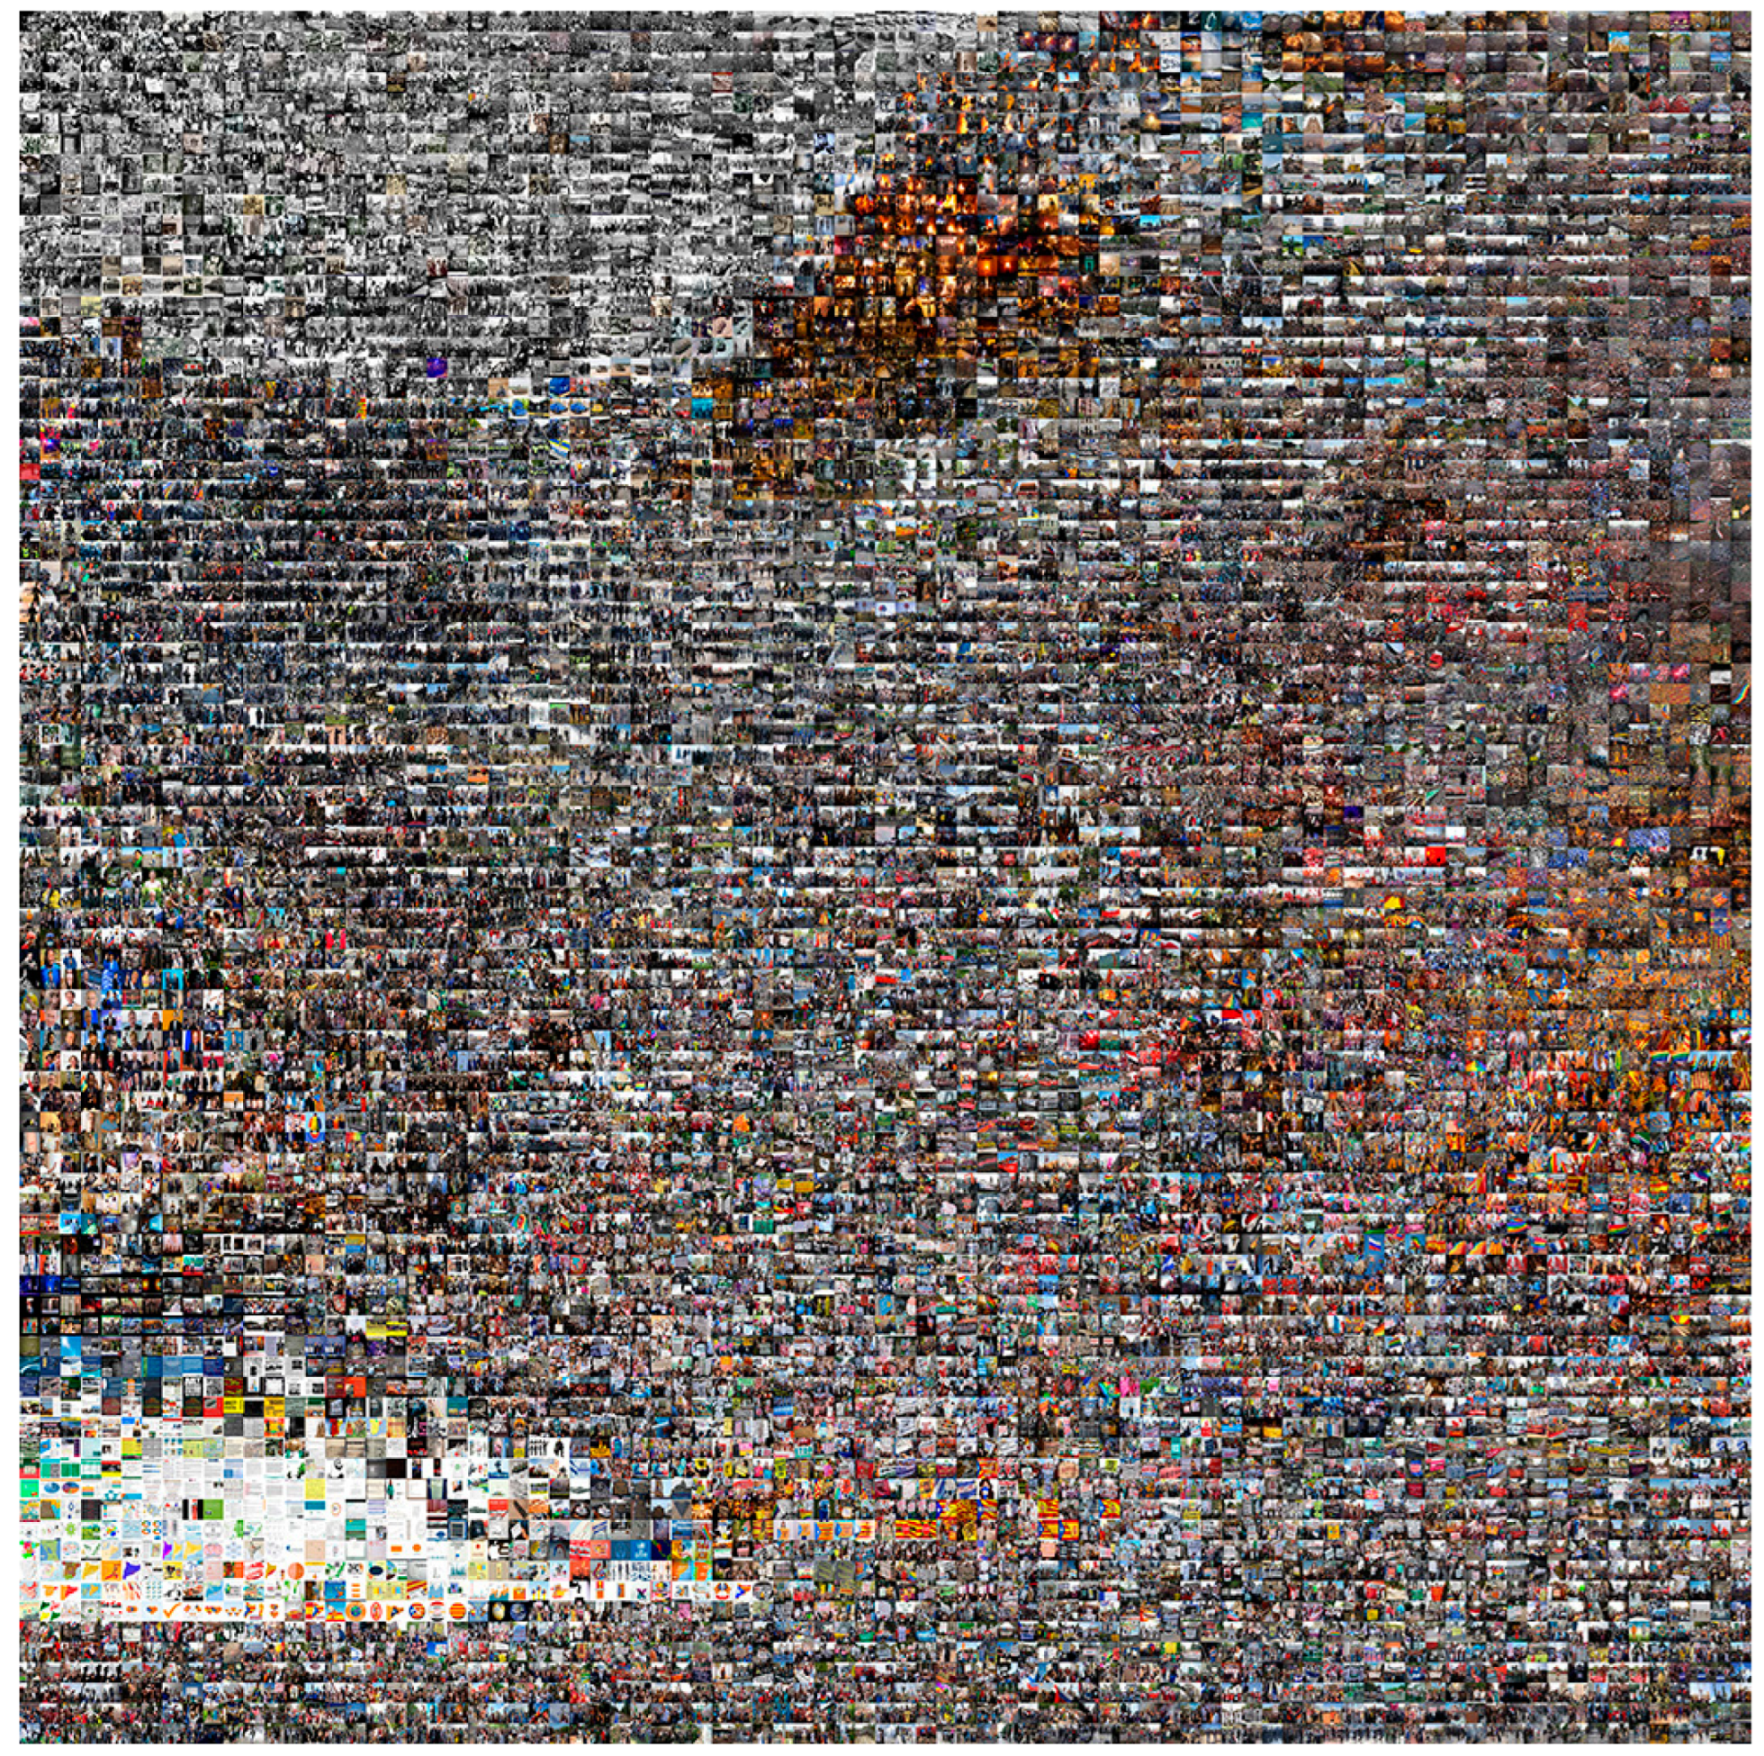
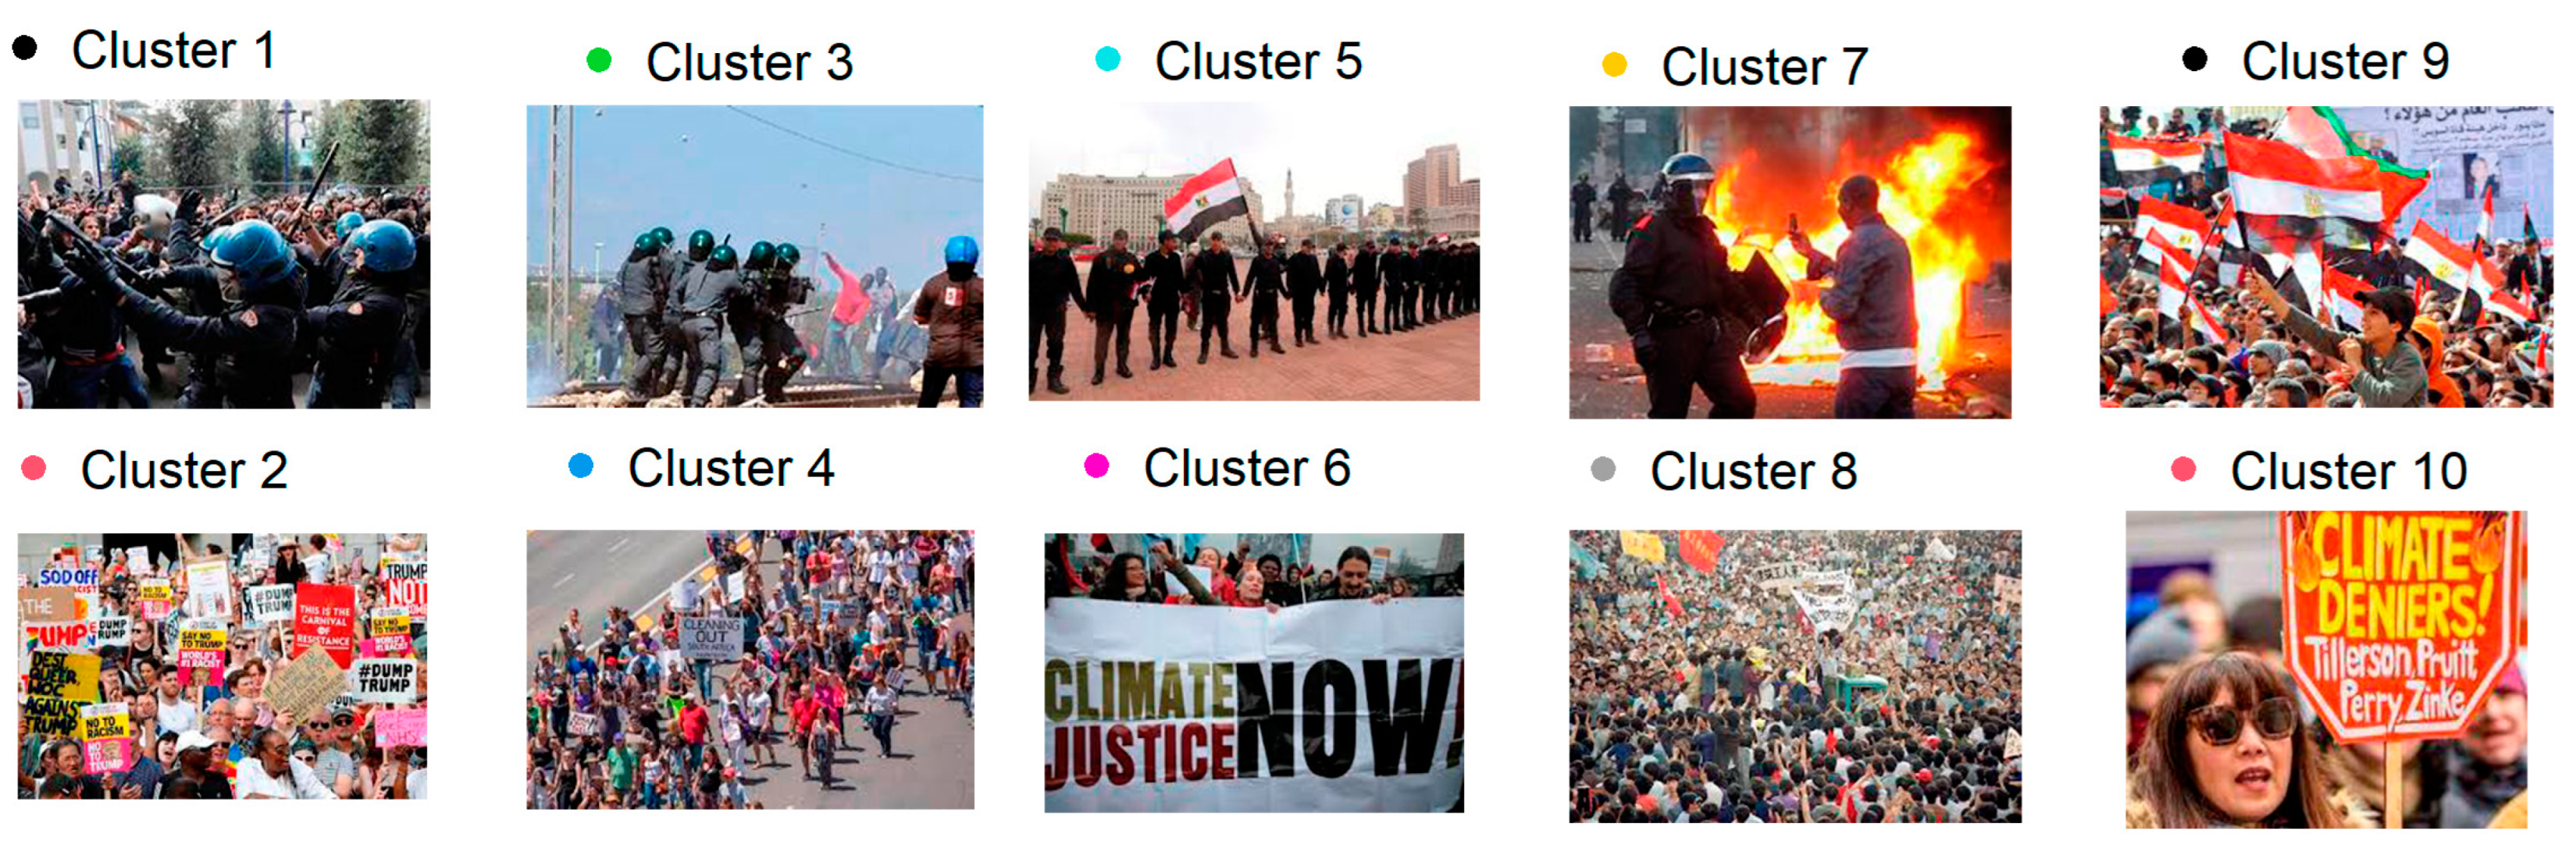
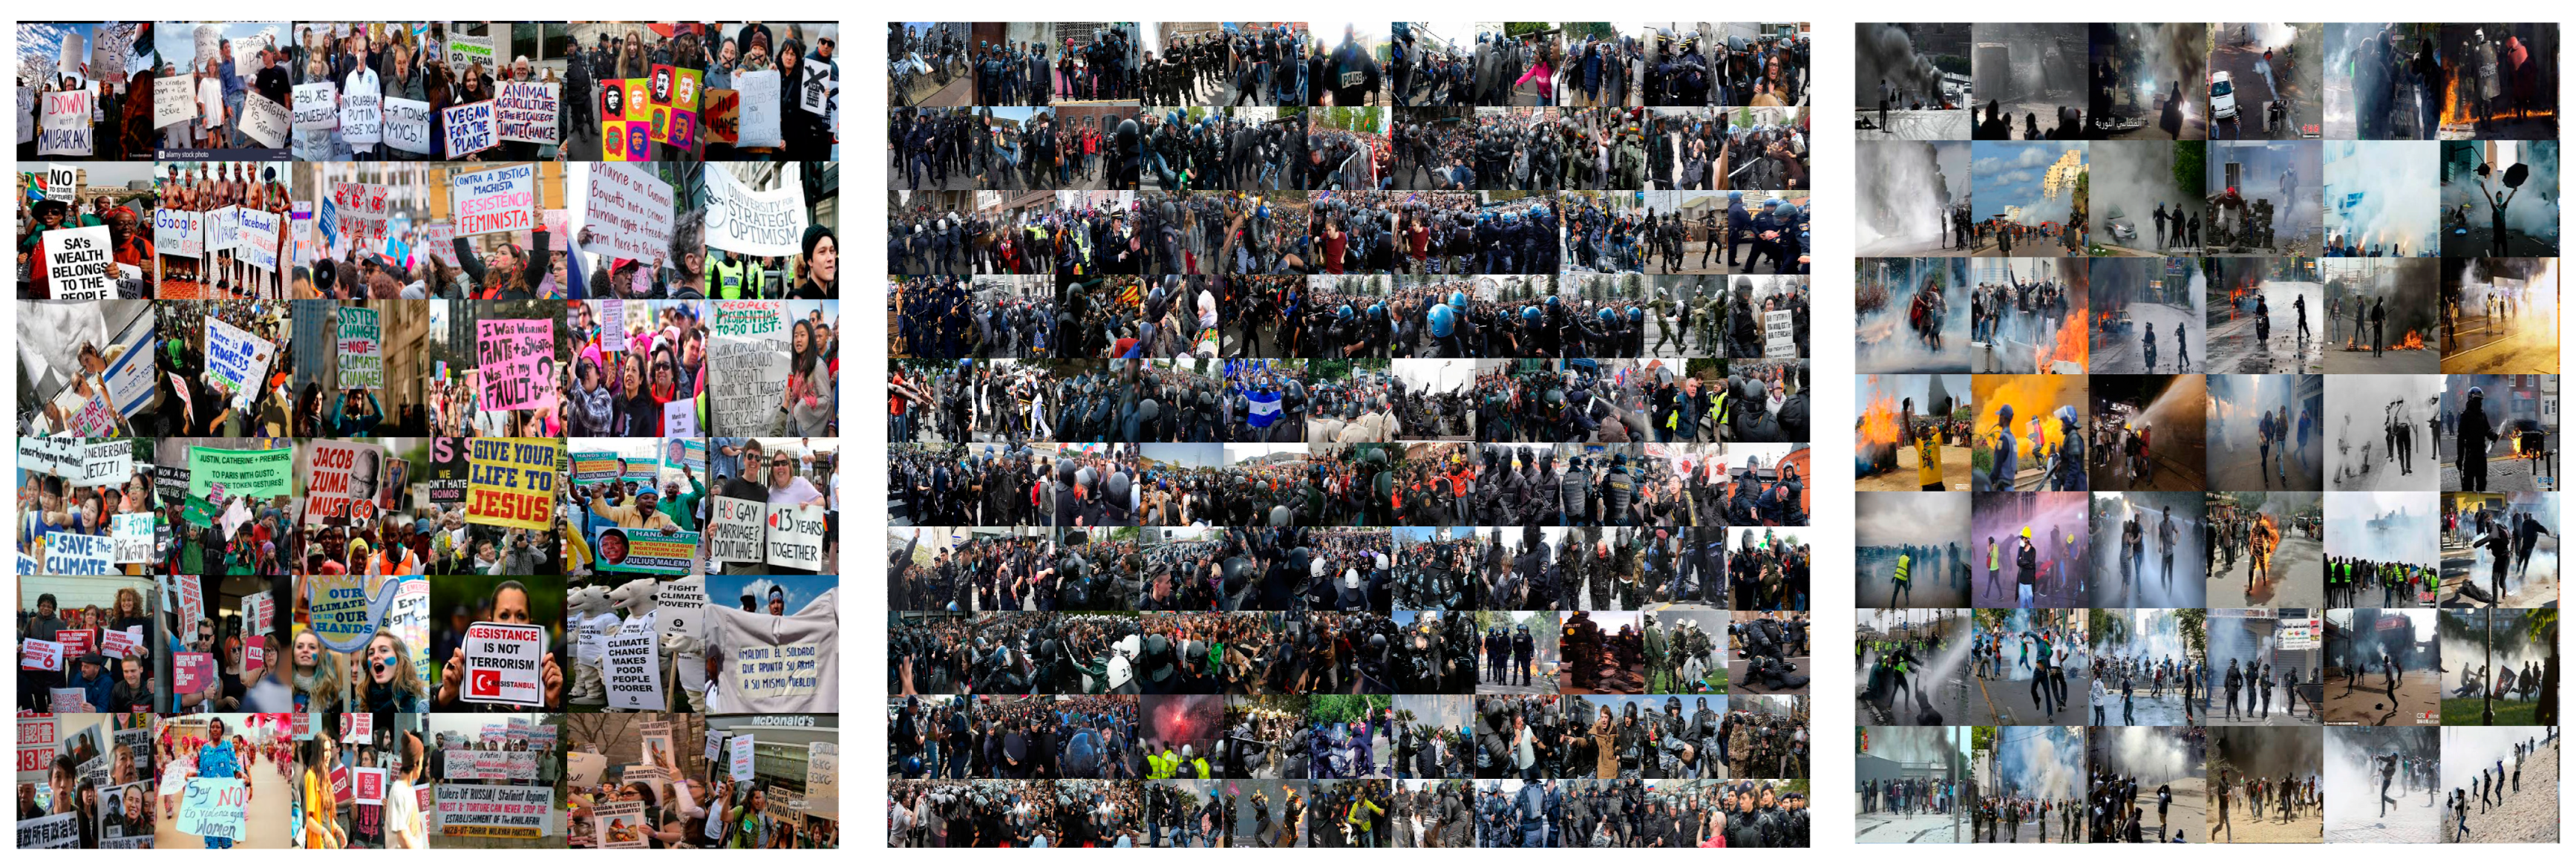
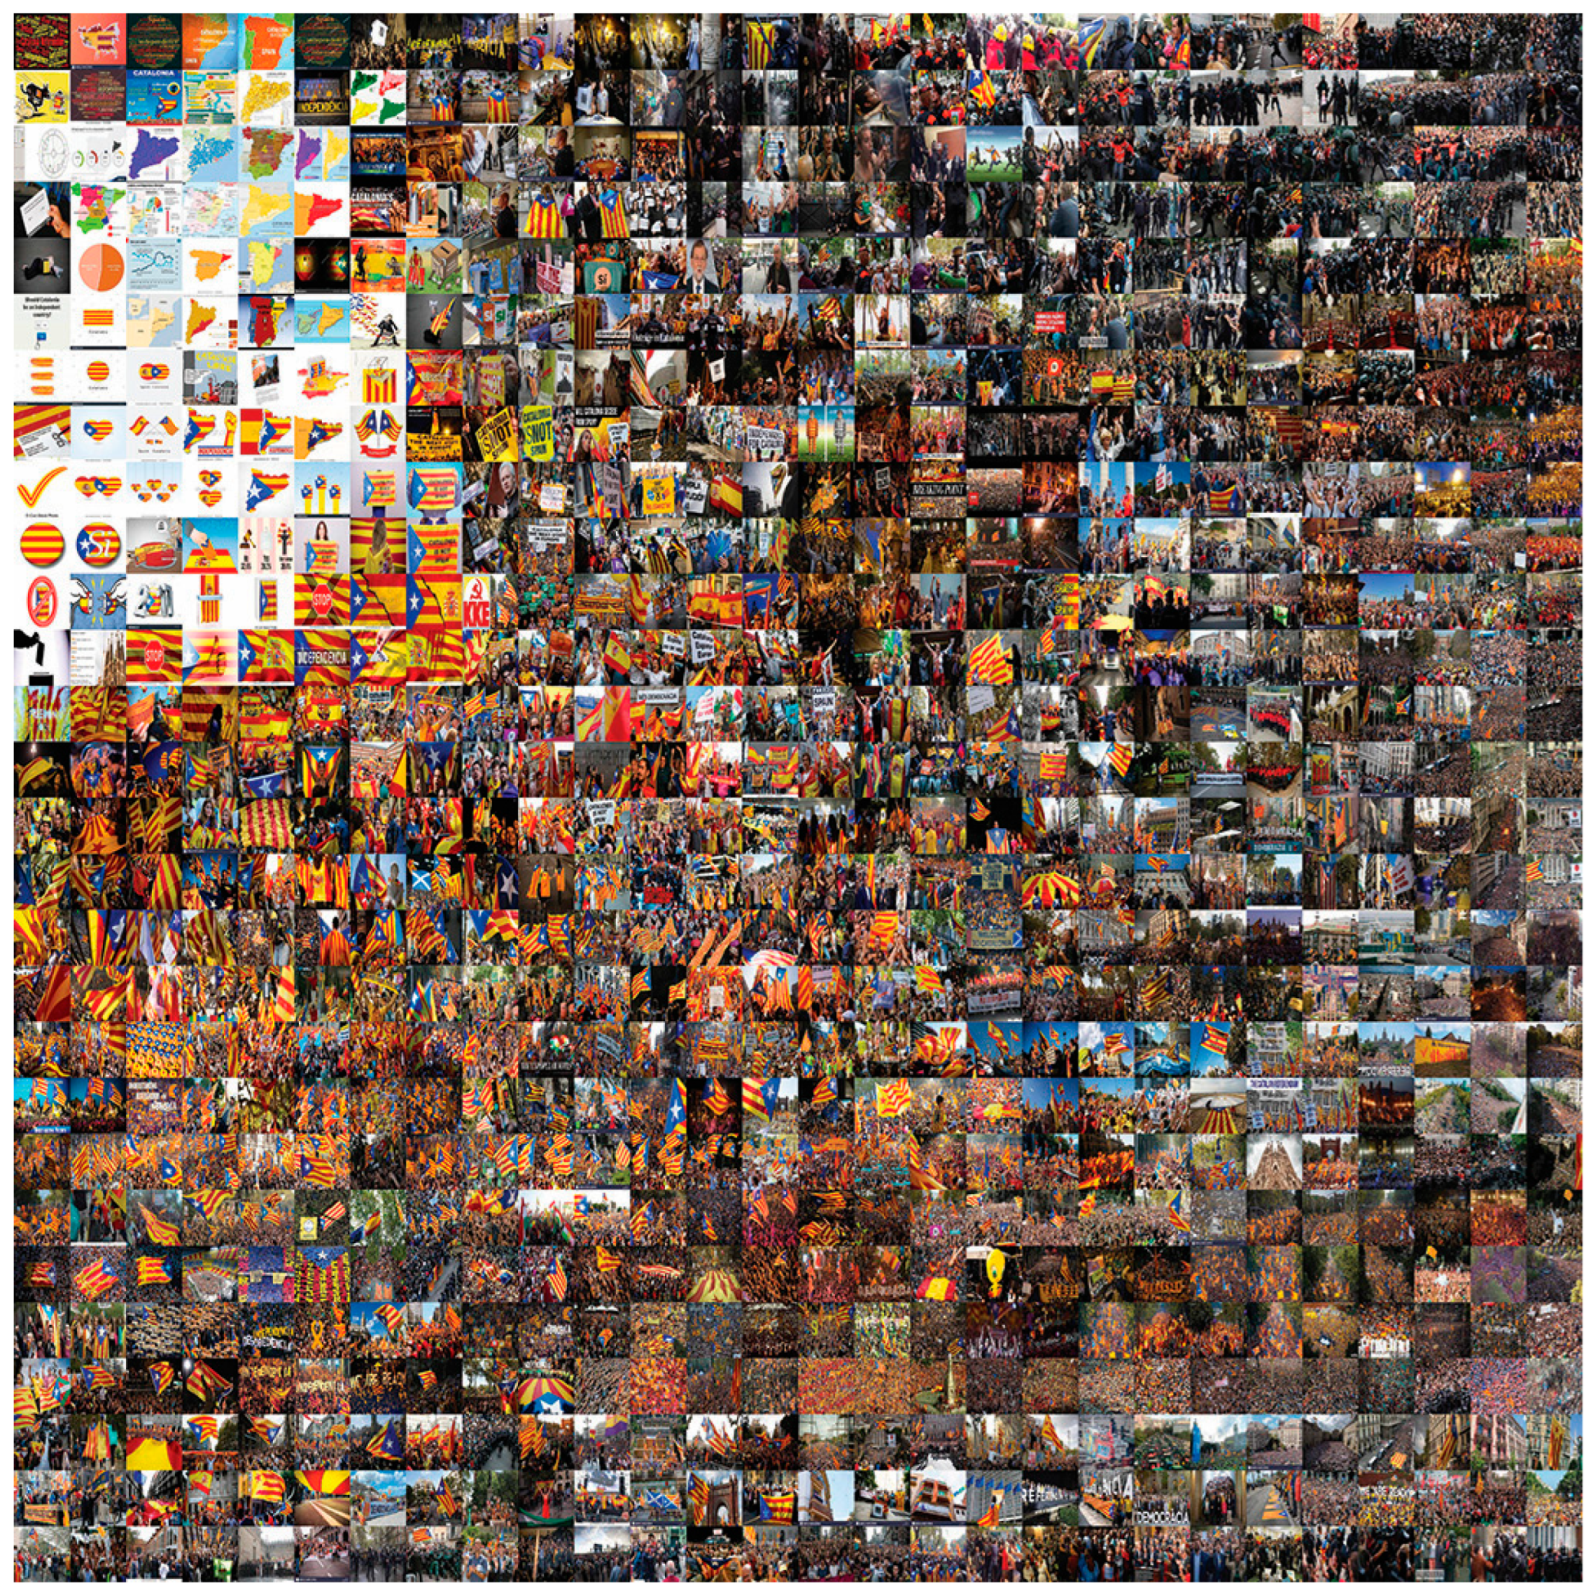
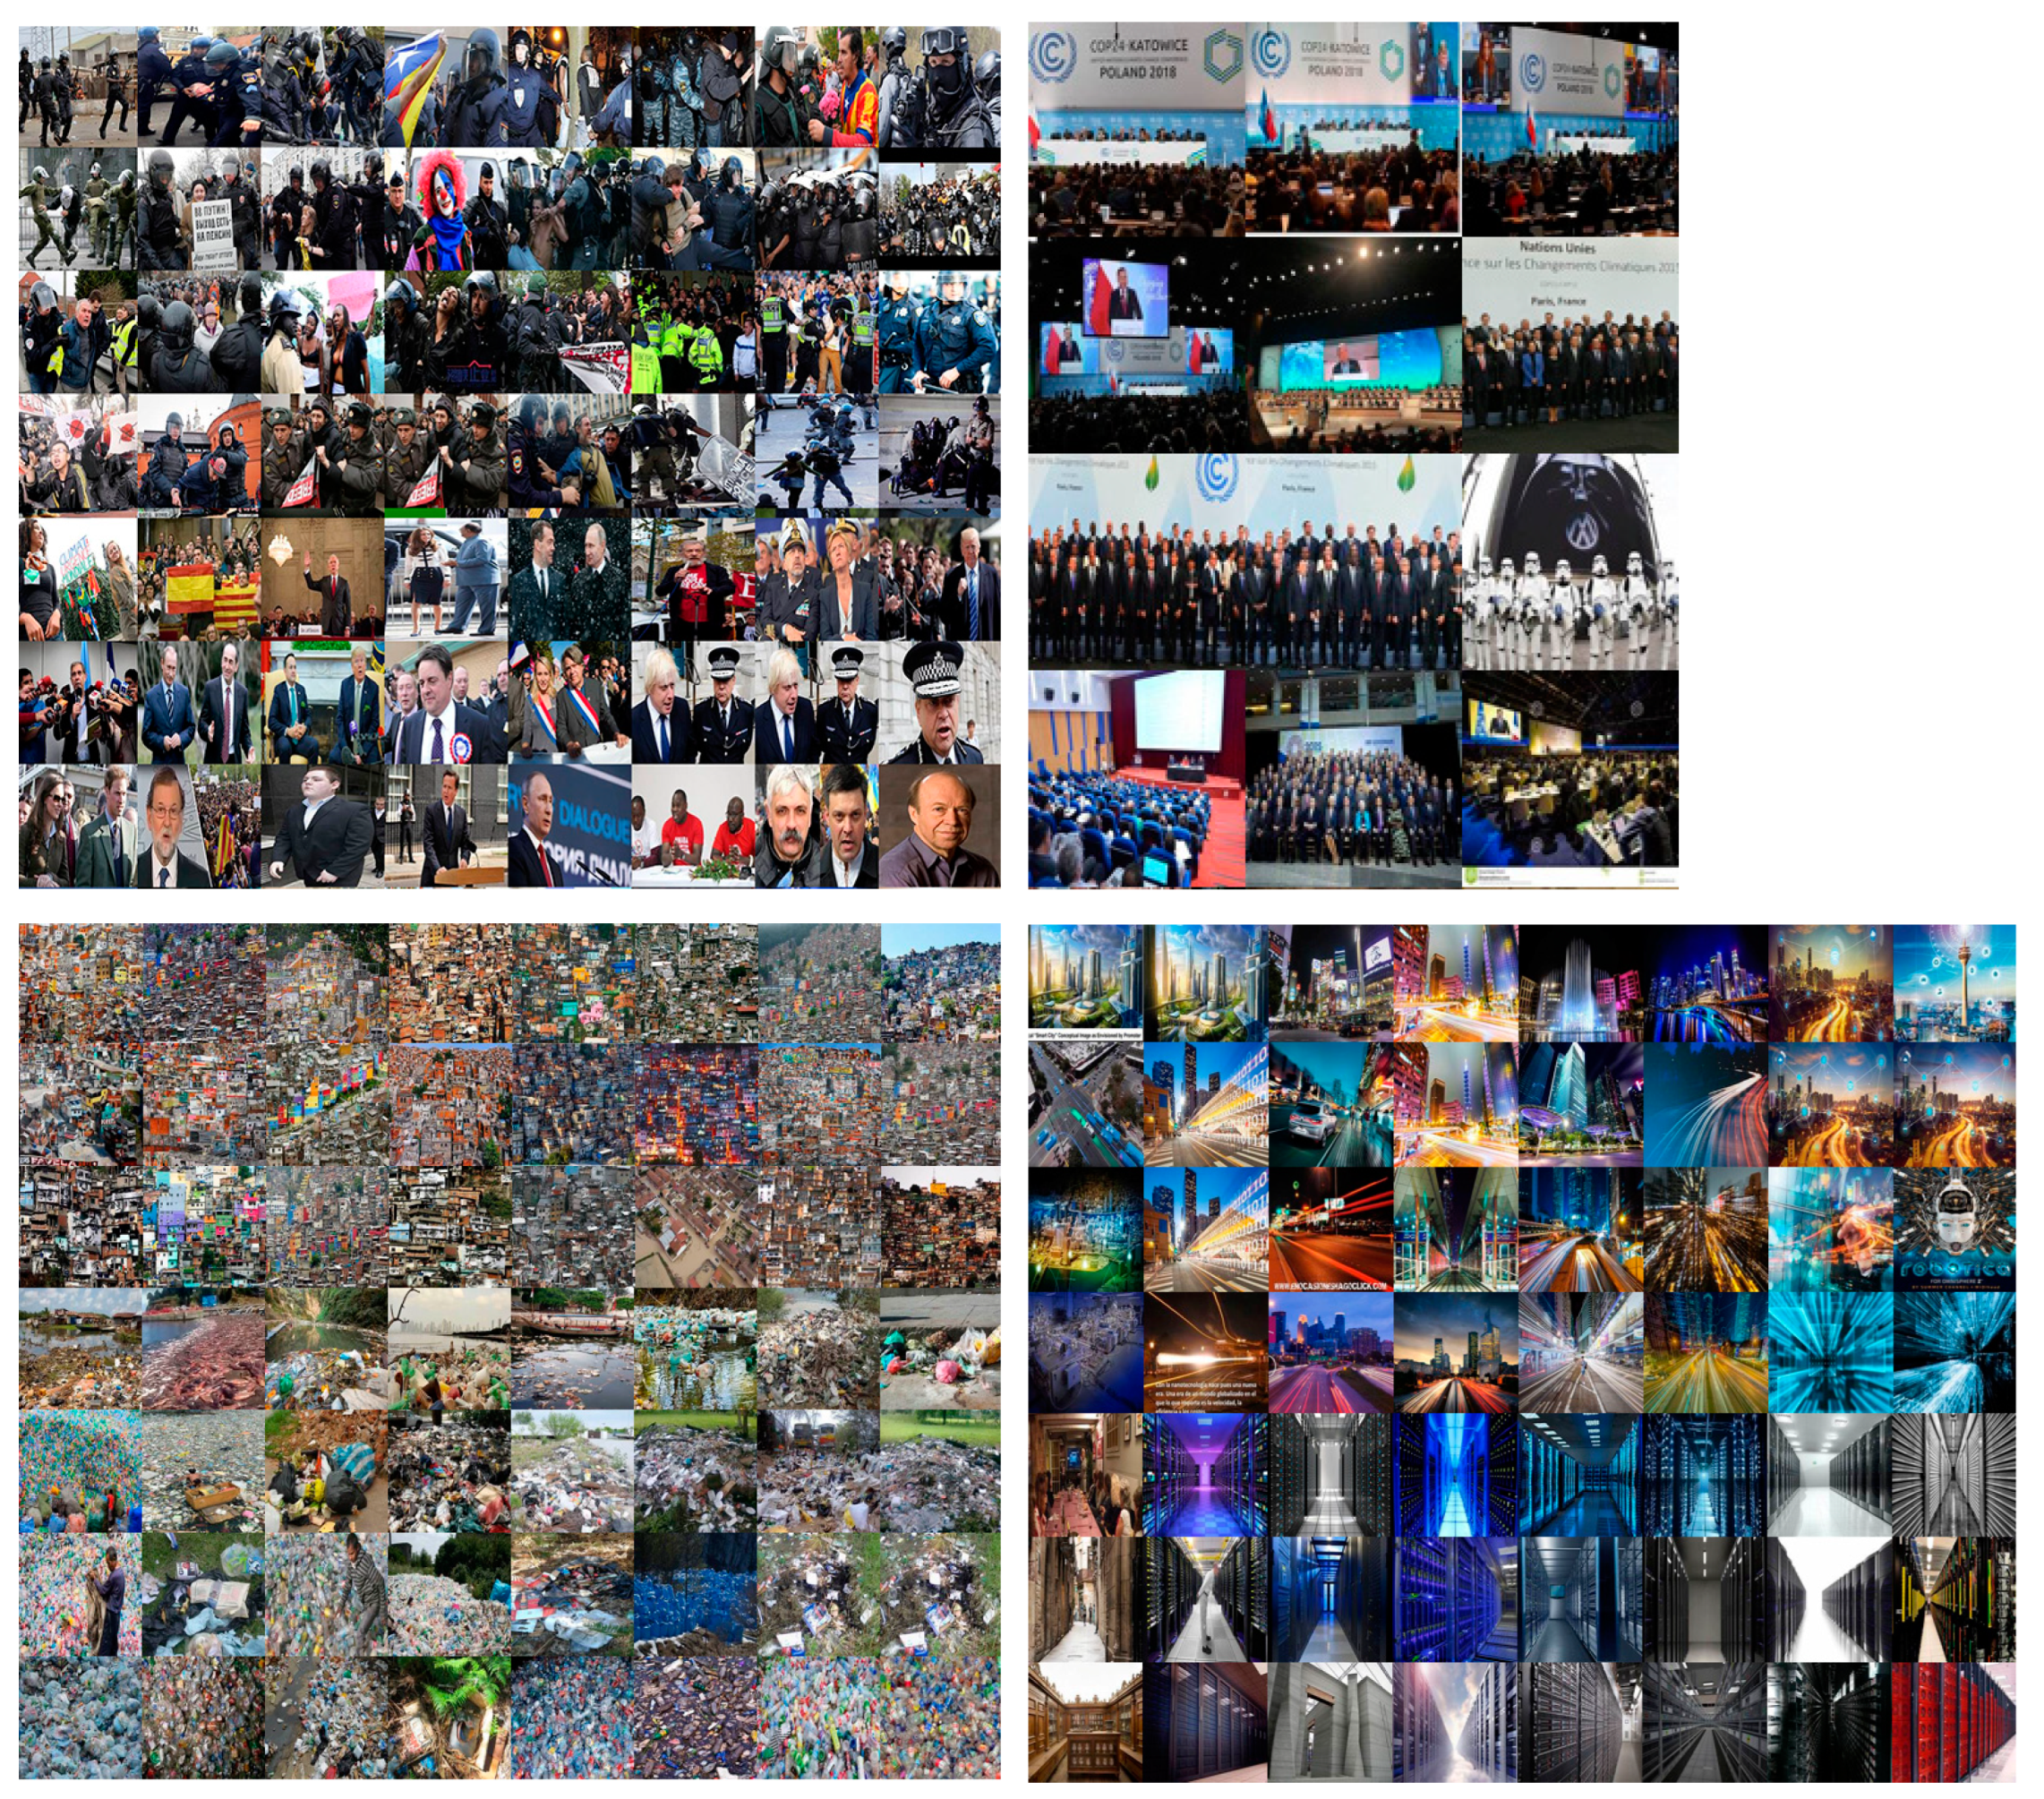
3.2. Demonstrations around the World

Clusters were labeled according to the K-means algorithm (see Figure 4 and Figure 5). To support the interpretation of Figure 5, Figure 6 shows t-SNE but substituting each image for the color of the label of the cluster that it belongs to, according to the K-means algorithm. Figure 7 shows the prototype image for each one of the clusters. Cluster 1 shows images of massive police deployments charging against a crowd. Cluster 2 shows images of people waving a variety of signs according to these demonstrations. Cluster 3 shows photographs capturing the confrontation between groups of riot police and protesters. Cluster 4 has images of crowds walking. Cluster 5 shows members of the police lined up in barrier formations. In Cluster 6, billboards are the main subject of the picture. Cluster 7 presents pictures of violent confrontations between police and demonstrators. Cluster 8 gathers bird’s-eye views of crowds. In Cluster 9, flags are the theme. Cluster 10 has close-ups of some of the demonstrators. Figure 8 shows examples of images belonging to Clusters 1, 2, and 7 (from left to right), to improve the comprehensibility of the grouping.
Pilar Rosado understands photography as a tool to conceptualize reality, and this project is an attempt to bring some order into the photographic typhoon around us, by applying strategies of automatic cataloguing, to build an atlas consisting of images composed of images, cartographies of our visual memory that may help us to understand a little better the traces, the patterns, and the archetypes that we construct as a society, through our photographic activity. The results obtained will allow us to revisit the iconography that, in the future, will constitute the files of our memory from a new, freer point of view, less bound by preconceptions and ideologies.
To obtain a visual representation of demonstrations around the world (see Figure 4), images were selected based on the concept “demonstration”, with the added criterion of the location: “demonstrations in Catalonia”, “demonstrations in Russia”, “demonstrations in China”, “demonstrations in Nicaragua”, “demonstrations in South Africa”, or “demonstrations in Egypt” (see Table 1); placed on different panels in the manner of Aby Warburg, photo-mosaics were created in which the images of each conflict were arranged by their graphic affinity.
Once the images were positioned according to their visual content, the relevance embodied by tanks or other elements of warfare became appreciable, as well as the mortality, the masses of people united, the flags, the billboards, or the police action. Demonstrations being the subject, obviously, images with people or police are the most abundant in each map, or, in the case of Catalonia, for example, where the presence of flags is particularly weighty (see Figure 9), but clear differences appear according to the location. However, the visual maps presented are not categorical and only show a reality in which each spectator can choose to take the analysis deeper.
The purpose is not only to identify the patterns that define revolutions, but to consider how, regarding images, new technologies offer an alternative point of view to the human one, providing a great deal of information and enabling images to be catalogued from a previously unexplored perspective.

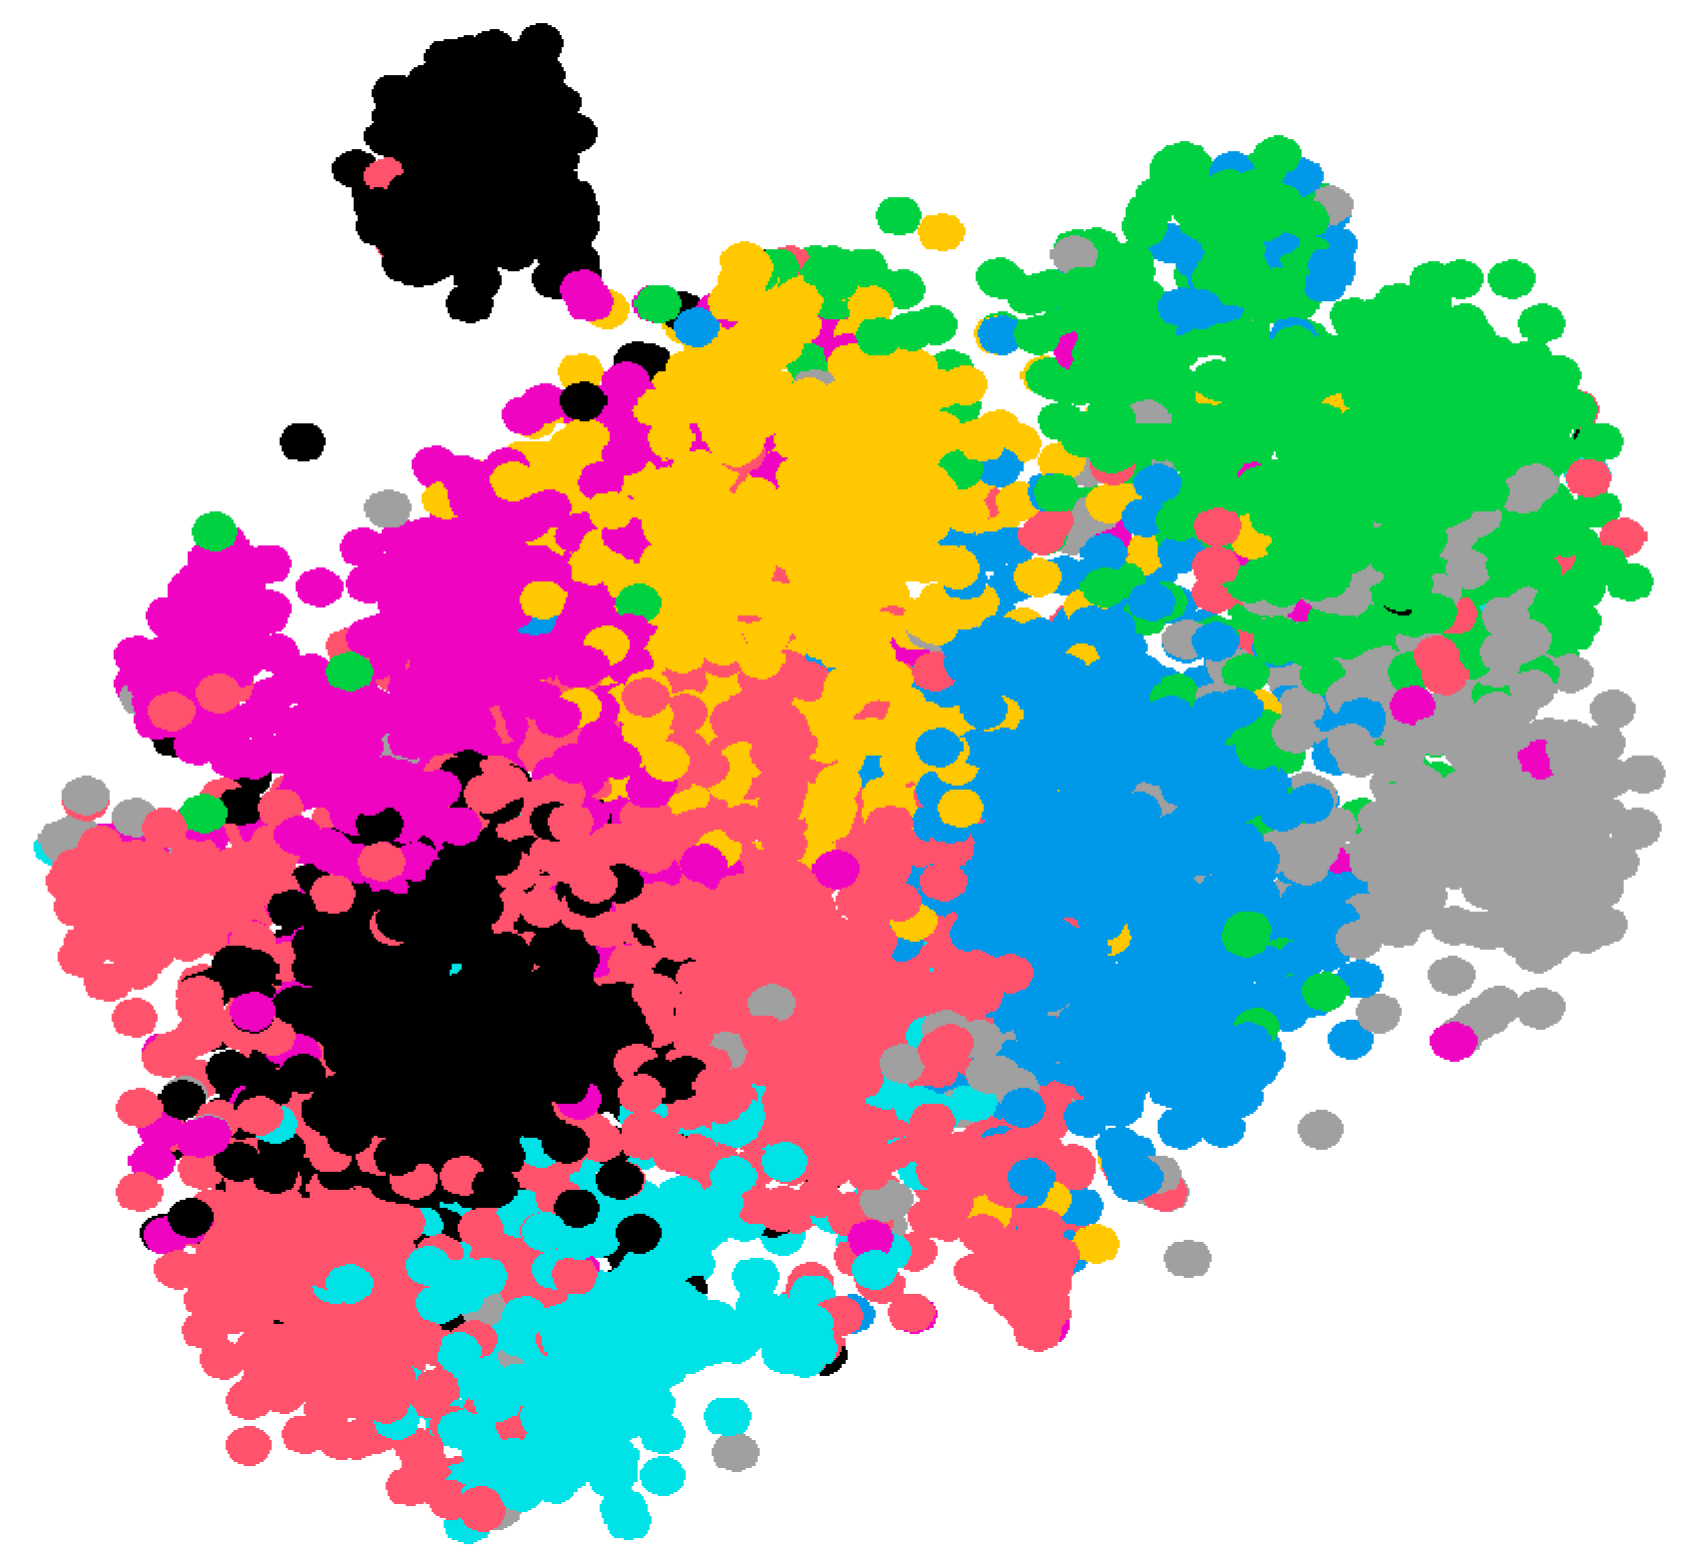
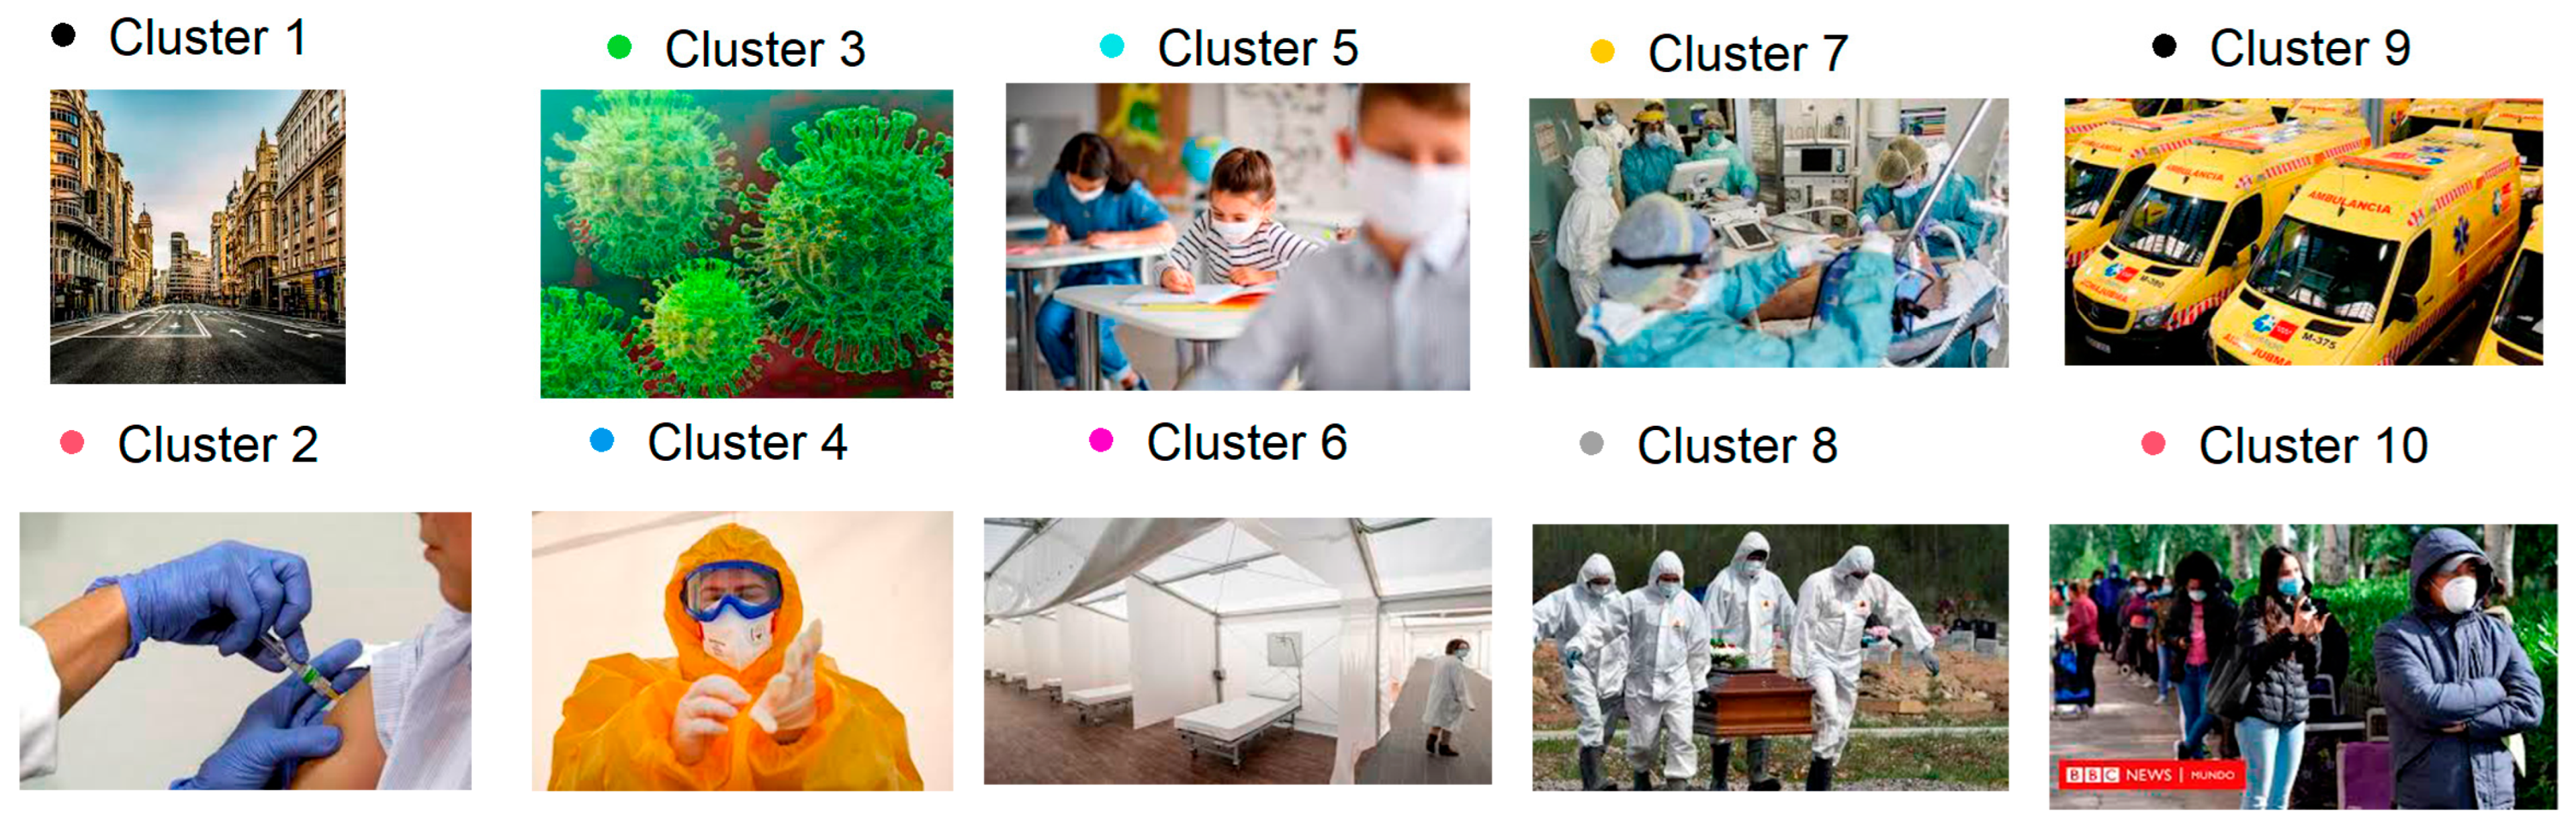
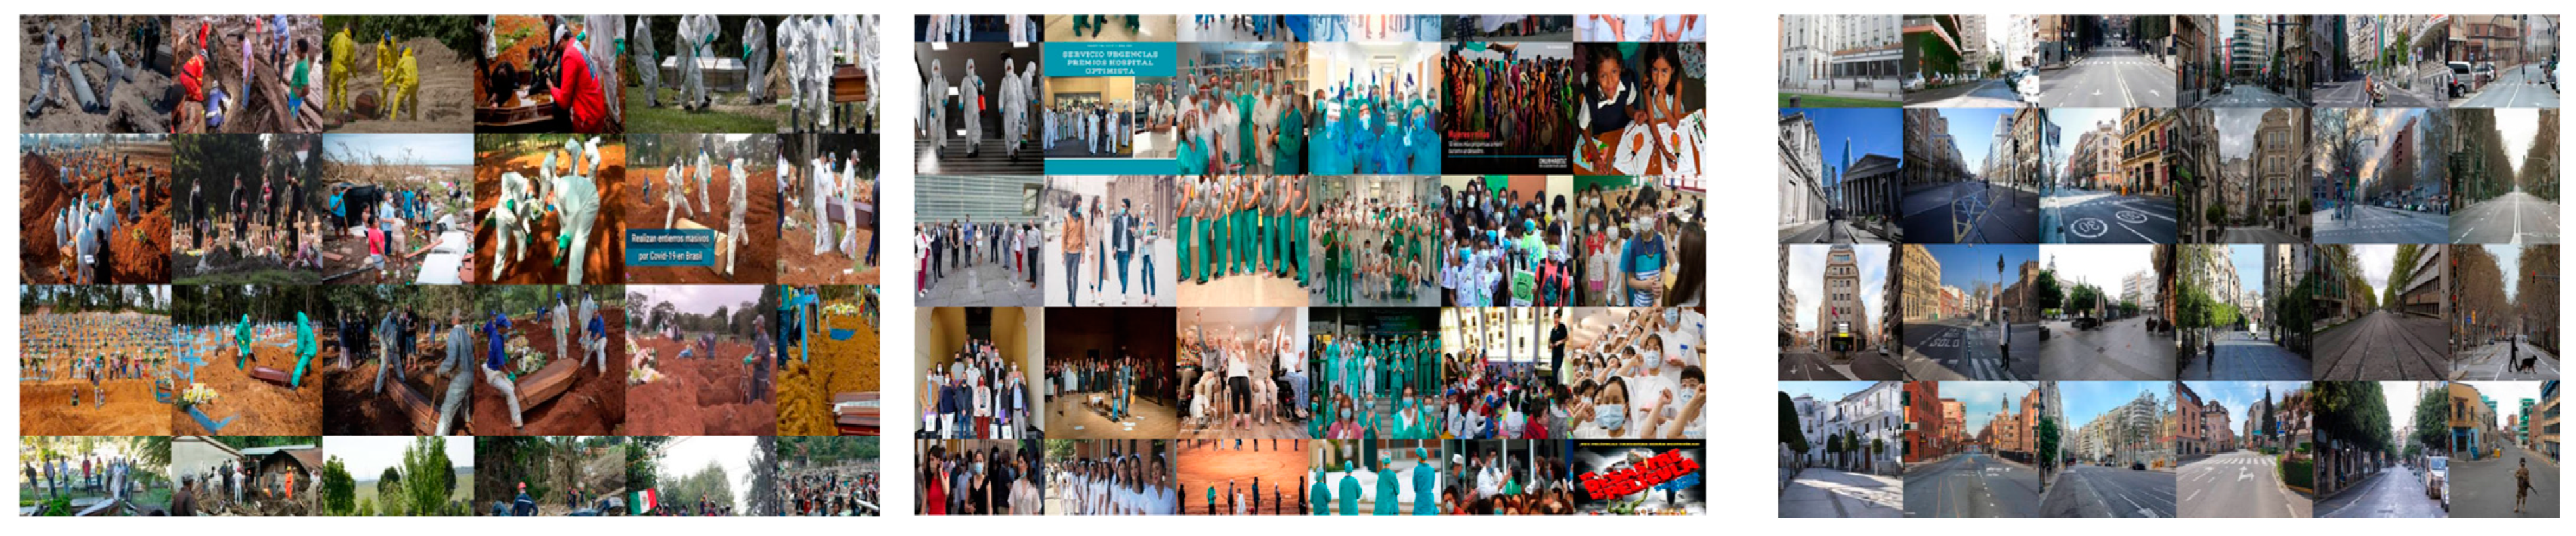
3.3. COVID-19 Pandemic

In the map of the coronavirus pandemic, one is struck by the large number of images of masks, empty public spaces (theatres, streets, soccer fields, etc.), empty streets, a large number of coronavirus statistical graphs, and politicians making statements (see Figure 10 and Figure 11).
Clusters were labeled according the K-means algorithm. To support the interpretation of Figure 10, Figure 11 shows the t-SNE, but substitutes each image for the color of the label of the cluster where it belongs, according to the K-means algorithm. Figure 12 shows the prototype image for each of the clusters. Cluster 1 presents pictures of empty cities. Cluster 2 shows vaccinations being administered. Cluster 3 contains coronavirus statistical graphs. Cluster 4 shows sanitary personnel in PPE suits. In Cluster 5, we find pictures of children wearing sanitary masks in school. Cluster 6 gathers photographs of field hospitals. Cluster 7 shows images of intensive care units. Cluster 8 gathers pictures of emergency burials. Cluster 9 shows the activities of ambulances, and Cluster 10 has photographs of citizens wearing face masks as they stand in line, maintaining the recommended safe distance. Figure 13 shows examples of images belonging to Clusters 8, 7, and 1 (from left to right), to improve the comprehensibility of the grouping.
In Figure 14 we see the COVID-19 map which reassigns the locations on a regular square grid, but without destroying the neighbor relations that resulted from the grouping by similitude based on t-SNE.

3.4. Manifestations of Popular Culture
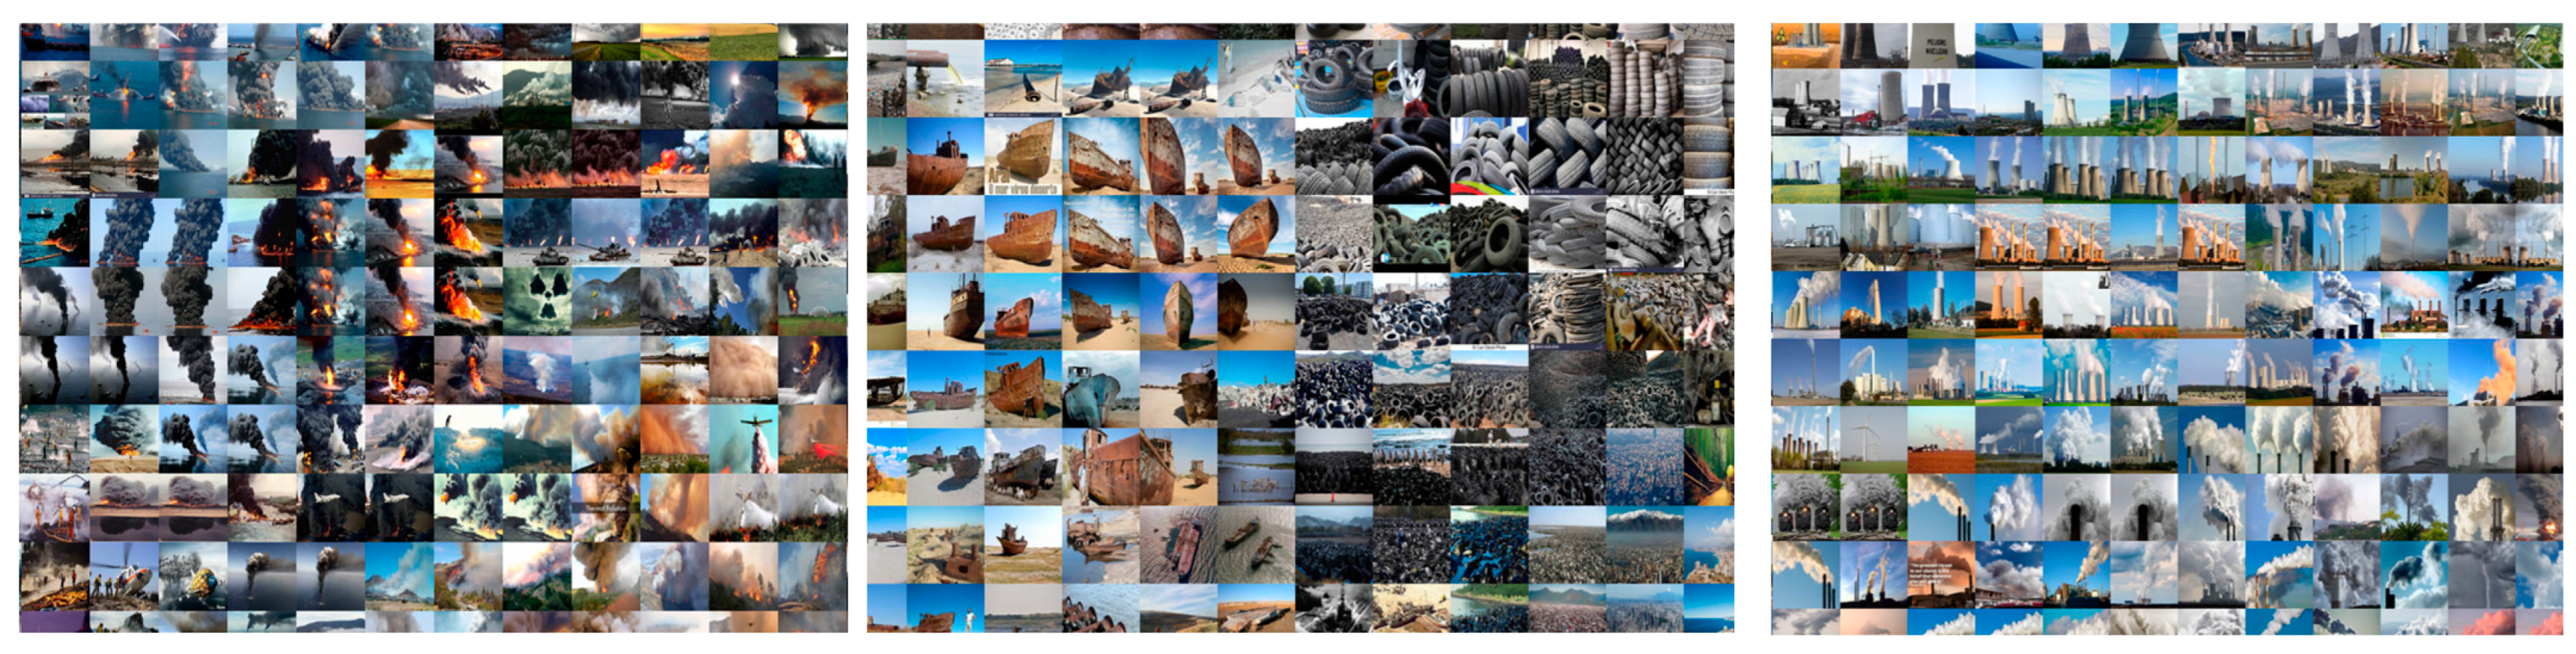
This map, built from 10,000 images of popular cultural events such as circus festivals, street theater, concerts, etc. (see Table 1), shows a clear differentiation between the events and shows that take place indoors or outdoors (see Figure 15).
These patterns or latent visual aspects, configured by means of the photographic activity of different people over time, present an extraordinary balance that is manifested by the diagonal line that one can see between the photographs with a darker or a lighter appearance (see Figure 16).

3.5. Climate Change

Concerning climate change, the large group of images on extreme weather conditions such as large fires and storms, which appears in the upper right part of the map, is remarkable (see Figure 17 and Figure 18).
The formal proximity between the towers of nuclear power plants and the skyscrapers of large cities is curious. There are also great similarities between garbage dumps and shanty towns (see Figure 19).

4. Discussion

The computer algorithm only analyses the exclusively visual content of the images, whereas, for human beings, it is the semiotic, historical, or ideological factors that cause the images to acquire meaning. Images do not only concern reality and its representation; they help us to understand the way in which human beings see things.
“Errors” in the automatic classification cause momentary breaks in the “routines” with which our visual thinking programs operate.
To show how the methods applied can make a difference in the recognition of unexpected patterns, we present some images that we consider to belong in very different categories, and yet they appear in positions that are very nearby in the map (see Figure 20). For example, we can see how, for the algorithm, the police are located in the vicinity of the politicians. At some point, this establishes a relation between the formations of diplomats at their conferences and the ranks of robots present in the image. We can also see that the algorithm establishes analogies between giant garbage dumps and the shanty towns of irregular housing that proliferate in poor countries. It also seems relevant that the images on the internet regarding the subject of intelligent cities appear in the same cluster as the images of great data storage facilities.
During the execution of this project, the decision-making task was shared jointly between the human being and the machine, configuring a hybrid process of co-creation from start to finish, which sheds light on new possibilities to achieve results. The proposal contains a play between what is personal and what is collective that is enriched by the cooperation of the algorithms.
Great repositories of images constitute a part of the memory shared by humanity and there is growing interest in the concept of “collective memory”. Regarding the history and the theory of art and culture, Malraux and Warburg were interested in the role of images as representations and lines of transmission of the psychological memory of societies, but also in the metamorphosis of forms and means of expression in global social memory [19] (p. 8).
In these projects, the possibility to encompass the total visual content of an entire collection allows us to consider information to which we would not have access when analyzing only the parts; the properties of the totality do not result from the constituent elements, but emerge from the relations in space and time of the whole [20,21]. These methodologies open up new lines of dialogue with the past and promise to shed light on many aspects of the history and evolution of images.
“Artists and scientists have to deal with the data and images, and not only research and criticize what is done with them from above, but propose other paths as well, other games and questions aimed at something beyond selling or self-selling” [18] (p. 2).
For years, Margaret Boden has studied the way in which artificial intelligence can help us to explain human creativity and, although she recognizes that creativity in machines or in humans is no simple matter, she explains that three types can be distinguished: combinational, exploratory, and transformational creativity. In combinational creativity, known ideas are mingled in unknown ways, and analogies are constructed based on structural similitudes. Exploratory creativity rests on rules and structures that already have cultural value, such as styles in painting and music, for example, to generate new propositions [22] (p. 73).
The creative process described above causes an interaction of combinational and exploratory creativity. Combinational creativity is present as it entails encounters between visual analogies established by the computer algorithms and the search criteria chosen by the artist. Exploratory creativity is present throughout the process in the overlapping of the artist’s visual archetypes and the visual patterns detected by the algorithm in the sets of photographs being analyzed.
In this creative process, we could state that the visual preconceptions of the human and those of the machine are superimposed. This is a substantial difference, at a methodological level, regarding the strategies used by Aby Warburg to establish visual analogies, as he could only rely on his own criterion. In both cases, what the strategies have in common is the desire to establish a dialogue with images for the purpose of thought.
From this point of view, the works described here demonstrate how the conjugation of human and machine can favor the process of co-creation. This collaboration is largely dependent on human judgement, which will be responsible, in the end, for the success of the system; the computer’s increased computational power, however, will greatly stimulate the creative process by the speed it gives to searches that would otherwise be impossible. Moreover, the results of the searches carried out to obtain these sets of images are mediated by the algorithms of Google; there can be little doubt that, besides the discoveries that are foreseeable, the interaction with the computer sparks fortuitous and unexpected discoveries, and the artist’s imagination cannot help but be activated by this search procedure.

5. Conclusions

Each collection of images generates a different visual vocabulary, which constitutes an inexhaustible source of material for creative purposes. Images of this kind constitute an enriching item to establish bridges between the visual and the written domains. The reader is confronted with the paradox of observing an image that was not composed with the purpose of representing anything, but which reveals different pulses, regular and systematic patterns. The small images grouped by similarities produce a hypnotic narrative rhythm that lures us and invites us to enquire into the nature of the visual content that they have in common. There is no struggle in this work between written and visual language. Instead, it is rather a transfiguration of the textual into the visual.
The images to be rescued from the immense archives of the internet embody an unusual grammar. From a sociological perspective, this type of photography reveals the rituals of the collective. The avalanche of images must be considered as a fertile ground for a new type of photography aimed at the management of images that already exist. These image maps have at least two narratives. The first narrative is scientific in nature, the patterns revealed by statistics. The second narrative consists of human experiences, desires, and decisions that people decide to perpetuate in the photographs that they take. Photography has become the art of the masses, in which the multitude is presented as the creator of a collective intelligence, far removed from the strict tenets of photography.

Author Contributions

Conceptualization, P.R.-R.; Methodology, F.R.; Software, P.R.-R. and F.R.; Validation, P.R.-R. and F.R.; Writing—review and editing, P.R.-R.; Supervision, P.R.-R. and F.R.; Funding acquisition, P.R.-R. and F.R. All authors have read and agreed to the published version of the manuscript.

Funding

This research and the APC was funded by the Government of Catalonia, grant number 2021 SGR 01466 (POCIO), 2021 SGR 01421 (GRBIO) and in part from the PID2019-104830RB-I00 and PID2020-116999RB-I00 (MICINN).

Data Availability Statement

Data available on request due to privacy restrictions.

Conflicts of Interest

The authors declare no conflict of interest.

References

  1. Fontcuberta, J. La Furia de las Imágenes. Notas Sobre la Postfotografía; Galaxia Gutenberg: Barcelona, Spain, 2016. [Google Scholar]
  2. Manovich, L. Computer vision, human senses, and language of art. AI Soc. 2021, 36, 1–8. [Google Scholar] [CrossRef]
  3. Manovich, L. Rethinking AI: Neural Networks, Biometrics and the New Artificial Intelligence. Digit. Cult. Soc. 2018, 4, 17–28. [Google Scholar] [CrossRef]
  4. Manovich, L. Data. In Critical Terms in Futures Studies; Paul, H., Ed.; Palgrave Macmillan: Cham, Switzerland, 2019. [Google Scholar]
  5. Warburg, A. Atlas Mnemosyne; Mielke, J.C., Translator; Akal: Madrid, Spain, 2010. [Google Scholar]
  6. The Warburg Institute. Aby Warburg Bilderatlas Mnemosyne Virtual Exhibition. Available online: https://warburg.sas.ac.uk/aby-warburg-bilderatlas-mnemosyne-virtual-exhibition (accessed on 20 February 2022).
  7. Malraux, A. Le Musée Imaginaire; Skira: Geneva, Switzerland, 1949. [Google Scholar]
  8. Manovich. TimeLine. Available online: http://manovich.net/index.php/exhibitions/timeline (accessed on 20 October 2022).
  9. Manovich. How to Compare One Million Images. Available online: http://manovich.net/index.php/projects/how-to-compare (accessed on 20 October 2022).
  10. Manovich, L. 2007 Cultural Analytics: About Software Studies Lab. Available online: http://lab.softwarestudies.com/p/overview-slides-and-video-articles-why.html (accessed on 15 April 2022).
  11. Park, S.; Song, H.; Han, S.; Weldegebriel, B.; Manovich, L.; Arielli, E.; Cha, M. Using Web Data to Reveal 22-Year History of Sneaker Designs. Www’22 Proc. ACM Web Conf. 2022, 2022, 2967–2977. [Google Scholar] [CrossRef]
  12. Manovich, L. Defining AI Arts: Three Proposals. In AI and Dialog of Cultures, Exhibition Catalog; Hermitage Museum: Saint-Petersburg, Russia, 2019. [Google Scholar]
  13. Google. Cómo Funcionan los Algoritmos de Google. Available online: https://www.google.com/intl/es_es/search/howsearchworks/algorithms/ (accessed on 10 April 2022).
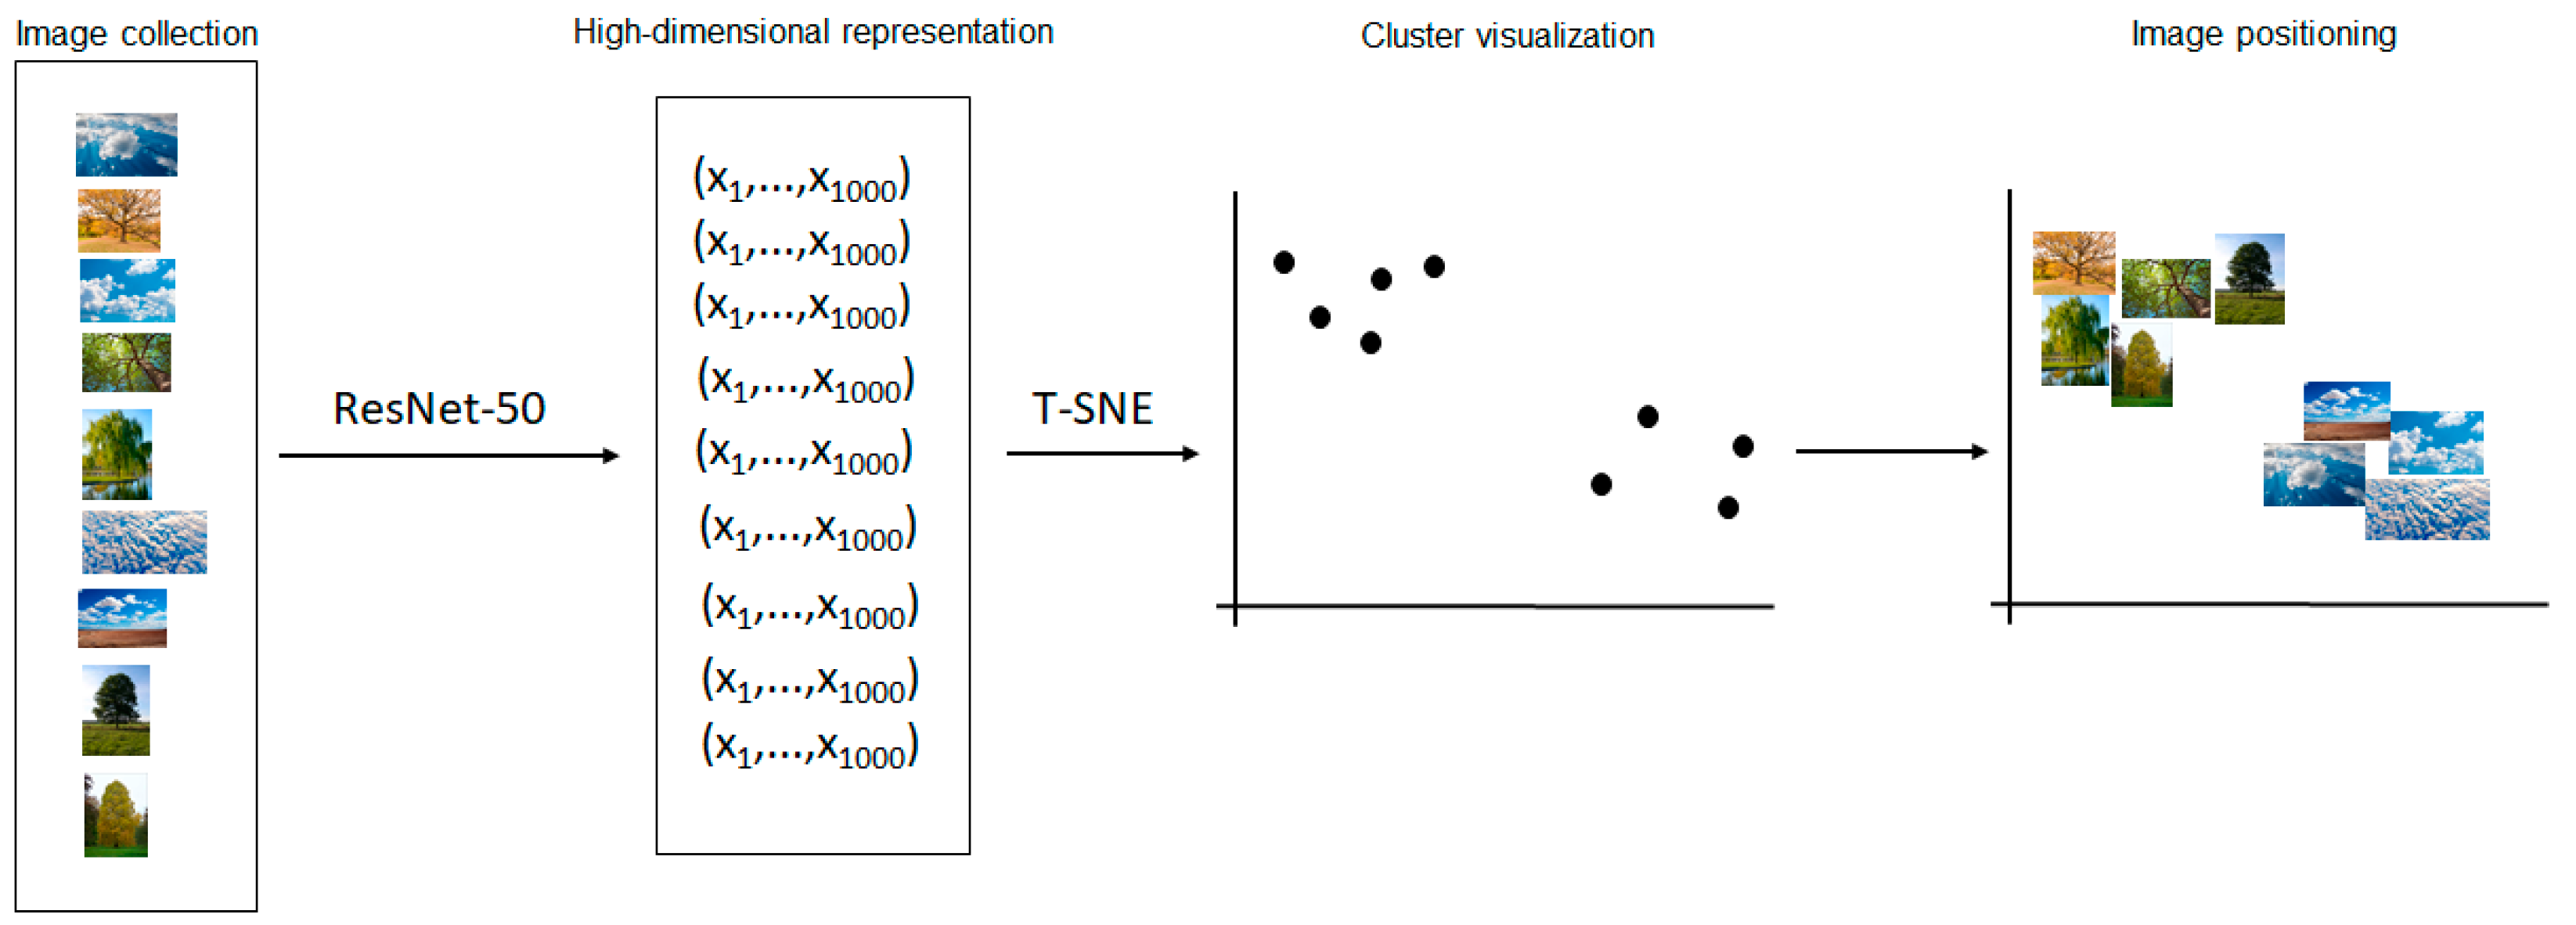
  14. He, K.; Zhang, X.; Ren, S.; Sun, J. Deep residual learning for image recognition. In Proceedings of the IEEE Conference on Computer Vision and Pattern Recognition (CVPR), Las Vegas, NV, USA, 27–30 June 2016; pp. 770–778. Available online: http://openaccess.thecvf.com/content_cvpr_2016/html/He_Deep_Residual_Learning_CVPR_2016_paper.html (accessed on 3 June 2022).
  15. Russakovsky, O.; Deng, J.; Su, H.; Krause, J.; Satheesh, S.; Ma, S.; Huang, Z.; Karpathy, A.; Khosla, A.; Bernstein, M.; et al. ImageNet Large Scale Visual Recognition Challenge. Int. J. Comput. Vis. 2015, 115, 211–252. [Google Scholar] [CrossRef]
  16. Van der Maaten, L.; Hinton, G. Visualizing data using t-SNE. J. Mach. Learn. Res. 2008, 9, 2579–2605. [Google Scholar]
  17. Karpathy, A. t-SNE Visualization of CNN Codes. 2017. Available online: https://cs.stanford.edu/people/karpathy/cnnembed/ (accessed on 8 January 2020).
  18. Pérez-Hita, F. Pilar Rosado y la resurrección de los archivos. In Mnemosyne 2.0. Cartografías Computacionales de la Memoria Visual; Roca Umbert Fàbrica de les Arts: Granollers, Spain, 2019; pp. 1–2. [Google Scholar]
  19. Grebe, A. Museum and Mnemosyne. Aby Warburg, André Malraux and the re-/construction of art history as social history. In Le Musée Imaginaire and Temptations of the Orient and Japan; Hidemichi, T., Ed.; Akita: Tokyo, Japan, 2010; pp. 55–61. [Google Scholar]
  20. Koffka, K. Principles of Gestalt Psychology; Mimesis International: New York, NY, USA, 1967. [Google Scholar]
  21. Köhler, W. Gestalt Psychology: An Introduction to New Concepts in Modern Psychology; Liveright: New York, NY, USA, 1947. [Google Scholar]
  22. Boden, M.A. AI: Its Nature and Future; Oxford University Press: Oxford, UK, 2016. [Google Scholar]
Figure 1. ResNet-50 embeds image collection into high-dimensional space; T-SNE reveals the existence of clusters in this space by mapping the set of points in the plane.
Bdcc 07 00033 g001
Figure 2. Digital image of 2 × 2 m containing 10,000 images ordered using the artificial network ResNet-50 and the t-SNE algorithm. © Pilar Rosado.
Bdcc 07 00033 g002
Figure 3. Digital image of 2 × 2 m, which reassigns the locations on a regular grid, but without destroying the neighborhood relations that emerge from the similarity grouping based on t-SNE. © Pilar Rosado.
Bdcc 07 00033 g003
Figure 4. Digital image containing 10,000 images of demonstrations in different countries all over the world (2 × 2 m). © Pilar Rosado.
Bdcc 07 00033 g004
Figure 5. Digital image of 2 × 2 m containing 10,000 images of demonstrations ordered using the artificial network ResNet-50 and the t-SNE algorithm. © Pilar Rosado.
Bdcc 07 00033 g005
Figure 6. t-SNE representation of points corresponding to digital images of demonstrations.
Bdcc 07 00033 g006
Figure 7. Images representative of each cluster.
Bdcc 07 00033 g007
Figure 8. Examples of images belonging to Clusters 2, 1, and 7.
Bdcc 07 00033 g008
Figure 9. Digital image containing 800 photographs of demonstrations in Catalonia, ordered using the ResNet-50 convolutional neural network (1 × 1 m). © Pilar Rosado.
Bdcc 07 00033 g009
Figure 10. Digital image containing 10,000 images related to COVID-19 pandemic (2 × 2 m). © Pilar Rosado.
Bdcc 07 00033 g010
Figure 11. t-SNE representation of points corresponding to digital images of COVID-19 pandemic.
Bdcc 07 00033 g011
Figure 12. Images representative of each cluster.
Bdcc 07 00033 g012
Figure 13. COVID-19 map detail. Cluster 8, Cluster 7, Cluster 1.
Bdcc 07 00033 g013
Figure 14. Digital image containing 10,000 images regarding the COVID-19 pandemic (2 × 2 m). © Pilar Rosado.
Bdcc 07 00033 g014
Figure 15. Digital image containing 10,000 photographs regarding popular culture, ordered using the ResNet-50 convolutional neural network (2 × 2 m). © Pilar Rosado.
Bdcc 07 00033 g015
Figure 16. Digital image containing 10,000 photographs regarding popular culture, ordered using the ResNet-50 convolutional neural network (2 × 2 m). © Pilar Rosado.
Bdcc 07 00033 g016
Figure 17. Digital image containing 10,000 photographs of climate change, ordered using the ResNet-50 convolutional neural network (2 × 2 m). © Pilar Rosado.
Bdcc 07 00033 g017
Figure 18. Digital image containing 10,000 photographs concerning climate change, ordered using the ResNet-50 convolutional neural network (2 × 2 m). © Pilar Rosado.
Bdcc 07 00033 g018
Figure 19. Climate change map detail. © Pilar Rosado.
Bdcc 07 00033 g019
Figure 20. Expanded details of the different maps. © Pilar Rosado.
Bdcc 07 00033 g020
Table 1. Phrases that the artist Pilar Rosado used to retrieve from Google the 40,000 images shown in the project.
Climate ChangeCOVID-19 PandemicDemonstrationsPopular Culture
pollutioncoronavirusin Russiacircus shows
big dumpslockdownin Chinastreet theater
deforestationfield hospitalin South Africaconcerts
industrial spillspandemicpolice in riotsdances
clean energyempty showsin Cataloniacinema
oil spillscoronavirus deathin Nicaraguatraditional music
climate changeepidemicin Egyptpopular culture
nuclear disasterscoronavirus outbreakdemonstrationsstreet show
Disclaimer/Publisher’s Note: The statements, opinions and data contained in all publications are solely those of the individual author(s) and contributor(s) and not of MDPI and/or the editor(s). MDPI and/or the editor(s) disclaim responsibility for any injury to people or property resulting from any ideas, methods, instructions or products referred to in the content.

