Next Issue
Volume 10, February
Previous Issue
Volume 9, December


Hydrology, Volume 10, Issue 1 (January 2023) – 24 articles

Cover Story (view full-size image): 
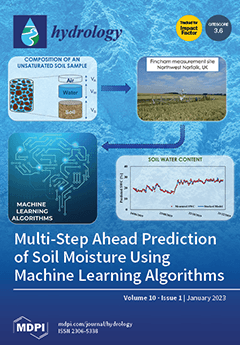
Soil moisture greatly affects the interactions between the earth's surface and the atmosphere, both from a meteorological and climatic perspective, with a significant impact on the processes that control the division of precipitation into surface runoff, subsurface flow and infiltration. This impact gives soil moisture prediction a key role in flood risk management and landslide risk assessment. Furthermore, predicting soil moisture content is essential for predicting the onset of drought and planning irrigation, as soil moisture is a critical limiting factor for crop growth and can have a massive impact on agriculture. On this basis, this study shows how machine learning algorithms represent a powerful tool for the short-term prediction of soil water content and how the accuracy of predictions can be improved by properly combining algorithms. View this paper
  • Issues are regarded as officially published after their release is announced to the table of contents alert mailing list.
  • You may sign up for e-mail alerts to receive table of contents of newly released issues.
  • PDF is the official format for papers published in both, html and pdf forms. To view the papers in pdf format, click on the "PDF Full-text" link, and use the free Adobe Reader to open them.
Order results
Result details
Section
Select all
Export citation of selected articles as:
16 pages, 2461 KiB  
Article
Comparison of Nonlinear Reservoir and UH Algorithms for the Hydrological Modeling of a Real Urban Catchment with EPASWMM
by Carlo Giudicianni, Mohammed N. Assaf, Sara Todeschini and Enrico Creaco
Hydrology 2023, 10(1), 24; https://doi.org/10.3390/hydrology10010024 - 16 Jan 2023
Cited by 2 | Viewed by 2070
Abstract
This paper presents a comparative analysis of two hydrological models in the Storm Water Management Model (SWMM) software, namely, the non-linear reservoir (N-LR) and the unit hydrograph (UH), on the urban catchment of Cascina Scala, Pavia in Italy. The two models were applied [...] Read more.
This paper presents a comparative analysis of two hydrological models in the Storm Water Management Model (SWMM) software, namely, the non-linear reservoir (N-LR) and the unit hydrograph (UH), on the urban catchment of Cascina Scala, Pavia in Italy. The two models were applied for the simulation of the rainfall-runoff transformation in the 42 sub-catchments in Cascina Scala, while flow routing in the underground channels was simulated by means of the De Saint-Venant equations. A dataset of rainfall and runoff for 14 events from 2000 to 2003 was adopted for the calibration and validation of the models. The calibration was performed on 7 out of the 14 events by maximizing the fit of modeled-to-measured hydrographs in the final channel of the system. Prediction performance was assessed through different indices. Results from both models fit measured data well in terms of the total hydrograph. Whereas the time to peak was reliably predicted by both models, the N-LR was found to slightly outperform the UH in terms of total volume and peak flow prediction, though it requires a more detailed knowledge of the system for its implementation. Accordingly, the UH must be preferred in the case of a scarcity of data. Full article
Show Figures

Figure 1

19 pages, 2533 KiB  
Article
Iron and Manganese Oxidation States, Bonding Environments, and Mobility in the Mining-Impacted Sediments of Coeur d’Alene Lake, Idaho: Core Experiments
by Gaige Swanson, Jeff B. Langman, Andrew W. Child, Frank M. Wilhelm and James G. Moberly
Hydrology 2023, 10(1), 23; https://doi.org/10.3390/hydrology10010023 - 16 Jan 2023
Cited by 1 | Viewed by 1918
Abstract
The mobility of a metal in mining-impacted sediments is determined by the environmental conditions that influence the metal’s oxidation state and bonding environment. Coeur d’Alene Lake, USA, has been impacted by legacy mining practices that allowed the hydrologic transport of mining waste to [...] Read more.
The mobility of a metal in mining-impacted sediments is determined by the environmental conditions that influence the metal’s oxidation state and bonding environment. Coeur d’Alene Lake, USA, has been impacted by legacy mining practices that allowed the hydrologic transport of mining waste to the lakebed, resulting in substantial amounts of redox-sensitive Fe and Mn along with Ag, As, Cd, Cu, Hg, Pb, Sb, and Zn. Future lake conditions may include algal blooms and additional algal detritus at the sediment–water interface, which may alter Fe and Mn forms that can influence their, and other metal(loid)s, mobility during seasonal anoxia. Cores of the lakebed sediments were exposed to anoxic and anoxic + algal detritus conditions for 8 weeks. Sediment samples were collected biweekly for analysis of Fe and Mn oxidation states and bonding environments by synchrotron-based X-ray absorption spectroscopy. Over the 8-week period and at a location 12.5 cm deep in the sediments, anoxic and anoxic + algae conditions produced limited changes in Fe and Mn oxidation states and bonding environments. At a location 2.5 cm below the sediment–water interface, the anoxic condition promoted a relatively stable environment in which Fe and Mn oxidation states and bonding environments did not vary greatly during the experiment. At the 2.5 cm depth, the anoxic + algae condition substantially altered the Mn oxidation state distribution and bonding environment, but this condition did not strongly influence the Fe oxidation state distribution or bonding environment. The anoxic + algae condition increased the presence of Mn3+, produced Mn4+ at select times, altered the Mn bonding environment, and temporarily increased the release of Mn into porewater. The algae influence on sediment and porewater Mn likely occurred because of the increased formation of organo-Mn complexes produced during algae-enhanced enzymatic processes. The lack of influence of algal detritus on sediment and porewater Fe and the formation of soluble organo-Mn complexes may limit the potential increase in the mobility of other metal(loid)s with future lake conditions. Full article
(This article belongs to the Section Ecohydrology)
Show Figures

Figure 1

15 pages, 16352 KiB  
Article
Assessment of a Smartphone App for Open Channel Flow Measurement in Data Scarce Irrigation Schemes
by Menwagaw T. Damtie, Marshet B. Jumber, Fasikaw A. Zimale and Seifu A. Tilahun
Hydrology 2023, 10(1), 22; https://doi.org/10.3390/hydrology10010022 - 15 Jan 2023
Cited by 1 | Viewed by 2340
Abstract
Accurate water flow measurement ensures proper irrigation water management by allocating the desired amount of water to the irrigation fields. The present study evaluated whether the non-intrusive smartphone application “DischargeApp” could be applicable and precise to measure small canal flow rates in the [...] Read more.
Accurate water flow measurement ensures proper irrigation water management by allocating the desired amount of water to the irrigation fields. The present study evaluated whether the non-intrusive smartphone application “DischargeApp” could be applicable and precise to measure small canal flow rates in the Koga irrigation Scheme. The app was tested in unlined canals with flow rates ranging from 15 to 65 l/s using a 90° V-notch weir. The app is found to overestimate high flow rates. Another source of uncertainty is that the app employed a constant surface velocity conversion factor (C = 0.8) to compute discharge. The accuracy was enhanced by recalculating the measured discharge using a new surface velocity conversion factor that depends on depths. The new conversion factor decreased the errors of MAE and RMSE by 47% and 52%, respectively. Where channel and other optional measuring techniques are not available without interfering with the flow operation conditions in place, the DischargeApp devices can be used to measure flows. The DischargeApp could be used to collect data using local citizens in data-scarce areas. This study suggested reconfiguring the DischargeApp with a new surface velocity conversion coefficient based on flow depths in field conditions for better performance. Full article
(This article belongs to the Topic Hydrology and Water Resources Management)
Show Figures

Figure 1

14 pages, 2355 KiB  
Article
Uncertainty of Kozeny–Carman Permeability Model for Fractal Heterogeneous Porous Media
by Jianting Zhu
Hydrology 2023, 10(1), 21; https://doi.org/10.3390/hydrology10010021 - 14 Jan 2023
Cited by 2 | Viewed by 1501
Abstract
A method was developed to integrate the truncated power-law distribution of solid volumetric fraction into the widely used Kozeny–Carman (KC)-type equations to assess the potential uncertainty of permeability. The focus was on the heterogeneity of porosity (or solid volumetric fraction) in the KC [...] Read more.
A method was developed to integrate the truncated power-law distribution of solid volumetric fraction into the widely used Kozeny–Carman (KC)-type equations to assess the potential uncertainty of permeability. The focus was on the heterogeneity of porosity (or solid volumetric fraction) in the KC equation. The truncated power-law distribution simulates a heterogeneous scenario in which the solid volumetric fraction varies over different portions of porous media, which is treated as stationary, so its spatial mean can be replaced by the ensemble mean. The model was first compared with the experimental results of 44 samples from the literature and a recent model of KC equation modification that targets the coefficients in the equation. The effects of the fractal dimension of characteristic length of the solid volumetric fraction on the mean and standard deviation of permeability are calculated and discussed. The comparison demonstrates that the heterogeneous solid volumetric fraction can have similar effects as adjusting the empirical constant in the KC equation. A narrow range smaller than mean ± standard deviation from the model agreed with the experimental data well. Incorporating the truncated power-law distribution into the classical KC model predicts a high mean permeability and uncertainty. Both the mean and standard deviation of the permeability decrease with an increasing fractal dimension. Full article
Show Figures

Figure 1

24 pages, 3074 KiB  
Article
Proposing a Wetland-Based Economic Approach for Wastewater Treatment in Arid Regions as an Alternative Irrigation Water Source
by Mohamed Elsayed Gabr, Nadhir Al-Ansari, Ali Salem and Ahmed Awad
Hydrology 2023, 10(1), 20; https://doi.org/10.3390/hydrology10010020 - 11 Jan 2023
Cited by 6 | Viewed by 1725
Abstract
Point and nonpoint wastewater sources have a detrimental, negative effect on agriculture, soil, surface, and groundwater supplies. In this research, a wastewater treatment system made up of a sedimentation tank, a horizontal subsurface flow constructed wetland (HSSF-CW), a vertical subsurface flow constructed wetland [...] Read more.
Point and nonpoint wastewater sources have a detrimental, negative effect on agriculture, soil, surface, and groundwater supplies. In this research, a wastewater treatment system made up of a sedimentation tank, a horizontal subsurface flow constructed wetland (HSSF-CW), a vertical subsurface flow constructed wetland (VF-CW), and a storage tank was proposed, designed, and cost estimated. Small populations in underdeveloped nations with dry and semi-arid climates can use the treatment system as an affordable construction, maintenance, and operational solution for wastewater treatment. The system will protect agricultural lands and groundwater from pollution. The system can service 6000 capita and has a wastewater discharge of 780 m3/d in the developing arid region in El-Moghra Oasis western desert of Egypt, where the 1.5 million acres used for the land reclamation project based on groundwater irrigation. The relaxed tanks in a series model based on the areal loading rates and background pollutants concentrations (P-K-C*) was utilized to size the HSSF and VF-CWs. The results indicated that the HSSF-CW design treatment surface area was 2375 m2, and the hydraulic surface loading (q) and hydraulic retention time (RT) were 0.33 m/d and 0.55 d, respectively, and utilizing Phragmites australis and Papyrus for the biological treatment. The expected overall cumulative removal efficiencies were 96.7, 70, and 100% for the biological oxygen demand (BOD), total phosphors (TP), and fecal coliforms (FC), respectively. The VF-CW indicates that there was a 2193 m2 design treatment surface area, q = 0.36 m/d, and RT of 0.63 d. The expected BOD, TP, and FC removal efficiencies were 75, 33.3, and 92.7%, respectively. In order to simplify the design stages and the cost estimation, design and investment cost curves were established for a population range from 500 to 9000. The total monthly water loss due to evapotranspiration for the HSSF and VF-CWs indicates a range from 3.7 to 8.5%, respectively. The total investment cost analysis for the proposed system corresponding to 780 m3/d wastewater discharge of indicates a total investment cost of EUR 146,804 and EUR 24.46/per-capita equivalent (P.E). This approach can be used by decision makers in the Mediterranean region and Middle Eastern countries to improve the water quality using social and economic criteria, leading to the effective implementation of ecological restoration projects as a low-cost treatment system and adding a nonconventional water source that can be used in irrigation. Full article
(This article belongs to the Special Issue Stormwater/Drainage Systems and Wastewater Management)
Show Figures

Figure 1

20 pages, 5856 KiB  
Technical Note
Establishing and Operating (Pilot Phase) a Telemetric Streamflow Monitoring Network in Greece
by Katerina Mazi, Antonis D. Koussis, Spyridon Lykoudis, Basil E. Psiloglou, Georgios Vitantzakis, Nikolaos Kappos, Dimitrios Katsanos, Evangelos Rozos, Ioannis Koletsis and Theodora Kopania
Hydrology 2023, 10(1), 19; https://doi.org/10.3390/hydrology10010019 - 10 Jan 2023
Cited by 2 | Viewed by 1799
Abstract
This paper describes HYDRONET, a telemetry-based prototype of a streamflow monitoring network in the Greek territory, where such data are sparse. HYDRONET provides free and near-real-time online access to data. Instead of commercially available stations, in-house-designed and -built telemetric stations were installed, [...] Read more.
This paper describes HYDRONET, a telemetry-based prototype of a streamflow monitoring network in the Greek territory, where such data are sparse. HYDRONET provides free and near-real-time online access to data. Instead of commercially available stations, in-house-designed and -built telemetric stations were installed, which reduced the equipment cost by approximately 50%. The labour of hydrometric campaigns was reduced by applying a new maximum-entropy method to estimate the discharge from surface velocity observations. Here, we describe these novelty elements succinctly. The potential of HYDRONET to provide civil protection services is exemplified by a flood warning demonstrator for Kalamata’s City Centre. The network’s operation, including the hydraulic criteria for monitoring site selection, the characteristics of the telemetric equipment, the operational monitoring and hydrometric procedures, and the specifics of data transmission, quality control, and storage are described in detail, along with experiences with problems encountered during this pilot phase. Full article
(This article belongs to the Special Issue Advances in River Monitoring)
Show Figures

Figure 1

16 pages, 4699 KiB  
Article
An Assessment of Uncertainties in Flood Frequency Estimation Using Bootstrapping and Monte Carlo Simulation
by Zaved Khan, Ataur Rahman and Fazlul Karim
Hydrology 2023, 10(1), 18; https://doi.org/10.3390/hydrology10010018 - 10 Jan 2023
Cited by 5 | Viewed by 2179
Abstract
Reducing uncertainty in design flood estimates is an essential part of flood risk planning and management. This study presents results from flood frequency estimates and associated uncertainties for five commonly used probability distribution functions, extreme value type 1 (EV1), generalized extreme value (GEV), [...] Read more.
Reducing uncertainty in design flood estimates is an essential part of flood risk planning and management. This study presents results from flood frequency estimates and associated uncertainties for five commonly used probability distribution functions, extreme value type 1 (EV1), generalized extreme value (GEV), generalized pareto distribution (GPD), log normal (LN) and log Pearson type 3 (LP3). The study was conducted using Monte Carlo simulation (MCS) and bootstrapping (BS) methods for the 10 river catchments in eastern Australia. The parameters were estimated by applying the method of moments (for LP3, LN, and EV1) and L-moments (for GEV and GPD). Three-parameter distributions (e.g., LP3, GEV, and GPD) demonstrate a consistent estimation of confidence interval (CI), whereas two-parameter distributions show biased estimation. The results of this study also highlight the difficulty in flood frequency analysis, e.g., different probability distributions perform quite differently even in a smaller geographical area. Full article
Show Figures

Figure 1

18 pages, 2947 KiB  
Article
Intercomparison of Automated Near-Real-Time Flood Mapping Algorithms Using Satellite Data and DEM-Based Methods: A Case Study of 2022 Madagascar Flood
by Wenzhao Li, Dongfeng Li and Zheng N. Fang
Hydrology 2023, 10(1), 17; https://doi.org/10.3390/hydrology10010017 - 08 Jan 2023
Cited by 3 | Viewed by 1960
Abstract
Numerous algorithms have been developed to automate the process of delineating water surface maps for flood monitoring and mitigation purposes by using multiple sources such as satellite sensors and digital elevation model (DEM) data. To better understand the causes of inaccurate mapping information, [...] Read more.
Numerous algorithms have been developed to automate the process of delineating water surface maps for flood monitoring and mitigation purposes by using multiple sources such as satellite sensors and digital elevation model (DEM) data. To better understand the causes of inaccurate mapping information, we aim to demonstrate the advantages and limitations of these algorithms through a case study of the 2022 Madagascar flooding event. The HYDRAFloods toolbox was used to perform preprocessing, image correction, and automated flood water detection based on the state-of-the-art Edge Otsu, Bmax Otsu, and Fuzzy Otsu algorithms for the satellite images; the FwDET tool was deployed upon the cloud computing platform (Google Earth Engine) for rapid estimation of flood area/depth using the digital elevation model (DEM) data. Generated surface water maps from the respective techniques were evaluated qualitatively against each other and compared with a reference map produced by the European Union Copernicus Emergency Management Service (CEMS). The DEM-based maps show generally overestimated flood extents. The satellite-based maps show that Edge Otsu and Bmax Otsu methods are more likely to generate consistent results than those from Fuzzy Otsu. While the synthetic-aperture radar (SAR) data are typically favorable over the optical image under undesired weather conditions, maps generated based on SAR data tend to underestimate the flood extent as compared with reference maps. This study also suggests the newly launched Landsat-9 serves as an essential supplement to the rapid delineation of flood extents. Full article
(This article belongs to the Special Issue Flood Inundation Mapping in Hydrological Systems)
Show Figures

Figure 1

15 pages, 3025 KiB  
Article
Environmental Risk Assessment of Wetland Ecosystems Using Bayesian Belief Networks
by Bahram Malekmohammadi, Cintia Bertacchi Uvo, Negar Tayebzadeh Moghadam, Roohollah Noori and Soroush Abolfathi
Hydrology 2023, 10(1), 16; https://doi.org/10.3390/hydrology10010016 - 07 Jan 2023
Cited by 36 | Viewed by 3825
Abstract
Wetlands are valuable natural capital and sensitive ecosystems facing significant risks from anthropogenic and climatic stressors. An assessment of the environmental risk levels for wetlands’ dynamic ecosystems can provide a better understanding of their current ecosystem health and functions. Different levels of environmental [...] Read more.
Wetlands are valuable natural capital and sensitive ecosystems facing significant risks from anthropogenic and climatic stressors. An assessment of the environmental risk levels for wetlands’ dynamic ecosystems can provide a better understanding of their current ecosystem health and functions. Different levels of environmental risk are defined by considering the categories of risk and the probability and severity of each in the environment. Determining environmental risk levels provides a general overview of ecosystem function. This mechanism increases the visibility of risk levels and their values in three distinct states (i.e., low, moderate, and high) associated with ecosystem function. The Bayesian belief network (BBN) is a novel tool for determining environmental risk levels and monitoring the effectiveness of environmental planning and management measures in reducing the levels of risk. This study develops a robust methodological framework for determining the overall level of risks based on a combination of varied environmental risk factors using the BBN model. The proposed model is adopted for a case study of Shadegan International Wetlands (SIWs), which consist of a series of Ramsar wetlands in the southwest of Iran with international ecological significance. A comprehensive list of parameters and variables contributing to the environmental risk for the wetlands and their relationships were identified through a review of literature and expert judgment to develop an influence diagram. The BBN model is adopted for the case study location by determining the states of variables in the network and filling the probability distribution tables. The environmental risk levels for the SIWs are determined based on the results obtained at the output node of the BBN. A sensitivity analysis is performed for the BBN model. We proposed model-informed management strategies for wetland risk control. According to the BBN model results, the SIWs ecosystems are under threat from a high level of environmental risk. Prolonged drought has been identified as the primary contributor to the SIWs’ environmental risk levels. Full article
Show Figures

Figure 1

19 pages, 4635 KiB  
Article
Assessing the Impact of the Urban Landscape on Extreme Rainfall Characteristics Triggering Flood Hazards
by Yakob Umer, Victor Jetten, Janneke Ettema and Gert-Jan Steeneveld
Hydrology 2023, 10(1), 15; https://doi.org/10.3390/hydrology10010015 - 06 Jan 2023
Cited by 3 | Viewed by 2071
Abstract
This study configures the Weather Research and Forecasting (WRF) model with the updated urban fraction for optimal rainfall simulation over Kampala, Uganda. The urban parameter values associated with urban fractions are adjusted based on literature reviews. An extreme rainfall event that triggered a [...] Read more.
This study configures the Weather Research and Forecasting (WRF) model with the updated urban fraction for optimal rainfall simulation over Kampala, Uganda. The urban parameter values associated with urban fractions are adjusted based on literature reviews. An extreme rainfall event that triggered a flood hazard in Kampala on 25 June 2012 is used for the model simulation. Observed rainfall from two gauging stations and satellite rainfall from Climate Hazards Group InfraRed Precipitation with Station data (CHIRPS) are used for model validation. We compared the simulation using the default urban fraction with the updated urban fraction focusing on extreme rainfall amount and spatial-temporal rainfall distribution. Results indicate that the simulated rainfall is overestimated compared to CHIRPS and underestimated when comparing gridcell values with gauging station records. However, the simulation with updated urban fraction shows relatively better results with a lower absolute relative error score than when using default simulation. Our findings indicated that the WRF model configuration with default urban fraction produces rainfall amount and its spatial distribution outside the city boundary. In contrast, the updated urban fraction has peak rainfall events within the urban catchment boundary, indicating that a proper Numerical Weather Prediction rainfall simulation must consider the urban morphological impact. The satellite-derived urban fraction represents a more realistic urban extent and intensity than the default urban fraction and, thus, produces more realistic rainfall characteristics over the city. The use of explicit urban fractions will be crucial for assessing the effects of spatial differences in the urban morphology within an urban fraction, which is vital for understanding the role of urban green areas on the local climate. Full article
(This article belongs to the Special Issue Modern Developments in Flood Modelling)
Show Figures

Figure 1

20 pages, 2139 KiB  
Review
Overview of Coastal Vulnerability Indices with Reference to Physical Characteristics of the Croatian Coast of Istria
by Zaviša Šimac, Nina Lončar and Sanja Faivre
Hydrology 2023, 10(1), 14; https://doi.org/10.3390/hydrology10010014 - 03 Jan 2023
Cited by 5 | Viewed by 1986
Abstract
Coastal areas are dynamic and complex systems exposed to waves, high tides, and storm surges. Often, these areas are densely populated and have essential socio-economic values for the region and country. Any changes or disruptions can cause a tremendous social burden. Coastal Vulnerability [...] Read more.
Coastal areas are dynamic and complex systems exposed to waves, high tides, and storm surges. Often, these areas are densely populated and have essential socio-economic values for the region and country. Any changes or disruptions can cause a tremendous social burden. Coastal Vulnerability Index (CVI) is one of the most used and straightforward methods to assess coastal vulnerability. This paper aims to analyse and summarise the current state of published coastal vulnerability indices. The analysis seeks to develop a regional vulnerability index for the eastern Adriatic coast, specifically for the Istrian peninsula. A total of 18 published papers were reviewed. A detailed survey was performed on three groups of variables that represent (a) the physical features of the coast, (b) the amount of influence of wave energy on the coast, and (c) exposed socio-economic factors. While choosing Physical and ecological variables is relatively straightforward, choosing Socio-economic variables is particularly challenging. The number of variables differs significantly from one author to another. As a result of the huge variety of global coastal characteristics and different research approaches, there is no universal CVI. Therefore, analysed indices are not suited for the calculation of the vulnerability of the Istrian coast without modification. A 5 × 5 m cell dimension was proposed as the most suitable for analysing the physical vulnerability of the Croatian coast of Istria. Full article
(This article belongs to the Special Issue Climate Change Effects on Coastal Management)
Show Figures

Figure 1

14 pages, 8403 KiB  
Article
Risk Assessment of Sea Level Rise for Karasu Coastal Area, Turkey
by Ali Eliawa, Aslı Numanoğlu Genç, Hakan Tora and Hadi Hakan Maraş
Hydrology 2023, 10(1), 13; https://doi.org/10.3390/hydrology10010013 - 03 Jan 2023
Cited by 1 | Viewed by 1743
Abstract
Sea Level Rise (SLR) due to global warming is becoming a more pressing issue for coastal zones. This paper presents an overall analysis to assess the risk of a low-lying coastal area in Karasu, Turkey. For SLR scenarios of 1 m, 2 m, [...] Read more.
Sea Level Rise (SLR) due to global warming is becoming a more pressing issue for coastal zones. This paper presents an overall analysis to assess the risk of a low-lying coastal area in Karasu, Turkey. For SLR scenarios of 1 m, 2 m, and 3 m by 2100, inundation levels were visualized using Digital Elevation Model (DEM). The eight-side rule is applied as an algorithm through Geographic Information System (GIS) using ArcMap software with high-resolution DEM data generated by eleven 1:5000 scale topographic maps. The outcomes of GIS-based inundation maps indicated 1.40%, 6.02%, and 29.27% of the total land area by 1 m, 2 m, and 3 m SLR scenarios, respectively. Risk maps have shown that water bodies, low-lying urban areas, arable land, and beach areas have a higher risk at 1 m. In a 2 m scenario, along with the risk of the 1 m scenario, forests become at risk as well. For the 3 m scenario, almost all the territorial features of the Karasu coast are found to be inundated. The effect of SLR scenarios based on population and Gross Domestic Product (GDP) is also analyzed. It is found that the 2 and 3 m scenarios lead to a much higher risk compared to the 1 m scenario. The combined hazard–vulnerability data shows that estuarine areas on the west and east of the Karasu region have a medium vulnerability. These results provide primary assessment data for the Karasu region for the decision-makers to enhance land use policies and coastal management plans. Full article
(This article belongs to the Special Issue Climate Change Effects on Coastal Management)
Show Figures

Figure 1

16 pages, 6156 KiB  
Article
Combined Well Multi-Parameter Logs and Low-Flow Purging Data for Soil Permeability Assessment and Related Effects on Groundwater Sampling
by Francesco Maria De Filippi and Giuseppe Sappa
Hydrology 2023, 10(1), 12; https://doi.org/10.3390/hydrology10010012 - 02 Jan 2023
Cited by 1 | Viewed by 1939
Abstract
Cost-effective remediation is increasingly dependent on high-resolution site characterization (HRSC), which is supposed to be necessary prior to interventions. This paper aims to evaluate the use of low-flow purging and sampling water level data in estimating the horizontal hydraulic conductivity of soils. In [...] Read more.
Cost-effective remediation is increasingly dependent on high-resolution site characterization (HRSC), which is supposed to be necessary prior to interventions. This paper aims to evaluate the use of low-flow purging and sampling water level data in estimating the horizontal hydraulic conductivity of soils. In a new quali-quantitative view, this procedure can provide much more information and knowledge about the site, reducing time and costs. In case of high heterogeneity along the well screen, the whole procedure, as well as the estimation method, could be less effective and rigorous, with related issues in the purging time. The result showed significant permeability weighted sampling, which could provide different results as the pump position changes along the well screen. The proposed study confirms this phenomenon with field data, demonstrating that the use of multiparameter well logs might be helpful in detecting the behaviour of low-permeability layers and their effects on purging and sampling. A lower correlation between low-flow permeability estimations and LeFranc test results was associated with high heterogeneity along the screen, with a longer purging time. In wells P43, MW08 and MW36, due to the presence of clay layers, results obtained differ for almost one order of magnitude and the purging time increases (by more than 16 min). However, with some precautions prior to the field work, the low-flow purging and sampling procedure could become more representative in a shorter time and provide important hydrogeological parameters such as hydraulic conductivity with many tests and high-resolution related results. Full article
(This article belongs to the Special Issue Novel Approaches in Contaminant Hydrology and Groundwater Remediation)
Show Figures

Figure 1

11 pages, 2769 KiB  
Article
Water Level Fluctuations in the Middle and Late Holocene in the Curonian Lagoon, Southeastern Baltic: Results of the Macrofossil and Phytolith Analyses
by Olga Druzhinina, Maxim Napreenko, Tatiana Napreenko-Dorokhova, Alexandra Golyeva and Leyla Bashirova
Hydrology 2023, 10(1), 11; https://doi.org/10.3390/hydrology10010011 - 31 Dec 2022
Cited by 1 | Viewed by 1363
Abstract
This paper presents the results of a study on fluctuations in the water level of the Curonian Lagoon (in the Baltic Sea). To date, the genesis of this inland bay as part of the complex postglacial development of the southeastern Baltic is poorly [...] Read more.
This paper presents the results of a study on fluctuations in the water level of the Curonian Lagoon (in the Baltic Sea). To date, the genesis of this inland bay as part of the complex postglacial development of the southeastern Baltic is poorly understood. The data from lithological, geochronological, and phytolith analyses, as well as assessments of plant and animal macroremains from the lagoonal sediments, provide a reconstruction of local coastal biocenoses and water level dynamics in the Middle and Late Holocene time. This study reveals the fairly dynamic evolution of the coastal zone of the Curonian Lagoon over the past 7000 years, as indicated by the traced succession of plant communities from forest to near-shore, open-water biocenoses and the alternations of the drying out and inundation of the area under consideration. Thus far, a connection with two stages of the Baltic Sea water level fluctuations has been traced: the regressional stage, which took place approximately 5600 cal years BP, and the Late Subatlantic transgression, which started at approximately 1100 cal BP. This study demonstrates that phytolith (microbiomorphic) analysis is a promising method for the study of temperate-latitude lagoonal sediments, providing information not only on the local plant communities, but also on the changes in the hydrological regime of the area. Full article
(This article belongs to the Special Issue Climate Change Effects on Coastal Management)
Show Figures

Figure 1

20 pages, 5579 KiB  
Article
The Effect of Woody Encroachment on Evapotranspiration in a Semi-Arid Savanna
by Tiffany A. Aldworth, Michele L. W. Toucher, Alistair D. Clulow and Anthony M. Swemmer
Hydrology 2023, 10(1), 9; https://doi.org/10.3390/hydrology10010009 - 30 Dec 2022
Cited by 1 | Viewed by 1924
Abstract
Over the past century, increases in indigenous woody plant species, also known as woody encroachment (WE), has occurred in grasslands and savannas across the globe. While the impact on grassland and savanna composition and productivity has been well studied, little is known of [...] Read more.
Over the past century, increases in indigenous woody plant species, also known as woody encroachment (WE), has occurred in grasslands and savannas across the globe. While the impact on grassland and savanna composition and productivity has been well studied, little is known of the impacts on the hydrological cycle. WE may increase evapotranspiration (ET) losses, leading to reduced infiltration and ultimately reduced freshwater availability, which is of particular concern in arid and semi-arid areas. The aim of this study was to determine the effect of Colophospermum mopane (mopane) encroachment on ET in a semi-arid savanna located in South Africa. Mopane is widely distributed across southern Africa, and is one of the main encroaching species of the region. Following an assessment of the validity of two surface renewal approaches, SR1 and SRDT, against short eddy covariance campaigns for sensible heat flux estimation, the SR1 approach was used to estimate ET at an experimental woody plant clearing trial from November 2019 to July 2022. For the two drier years of the study, the removal of mopane trees had little effect on ET. However, for the wettest year of the study, the removal of mopane trees decreased ET by 12%, supporting the hypothesis that the conversion from grass dominance to woody dominance can increase ET. Annual ET exceeded annual rainfall in all 3 years, indicating that the vegetation supplements its water use with soil water that has accumulated during previous wet seasons, or that tree roots facilitate hydraulic lift of deep soil water, or groundwater, to depths within the rooting depth of both trees and grasses. Further research is needed to confirm the exact mechanism involved, and the consequences of this for groundwater and streamflow at landscape scales. Full article
(This article belongs to the Section Ecohydrology)
Show Figures

Figure 1

16 pages, 6450 KiB  
Article
Synthetic Drought Hydrograph
by Radu Drobot, Aurelian Florentin Draghia, Nicolai Sîrbu and Cristian Dinu
Hydrology 2023, 10(1), 10; https://doi.org/10.3390/hydrology10010010 - 30 Dec 2022
Viewed by 2053
Abstract
Droughts are natural disasters with a significant impact on the economy and social life. Prolonged droughts can cause even more damage than floods. The novelty of this work lies in the definition of a synthetic drought hydrograph (SDH) which can be derived at [...] Read more.
Droughts are natural disasters with a significant impact on the economy and social life. Prolonged droughts can cause even more damage than floods. The novelty of this work lies in the definition of a synthetic drought hydrograph (SDH) which can be derived at each gaging station of a river network. Based on drought hydrographs (DHs) recorded for a selected gaging station, the SDH is statistically characterized and provides valuable information to water managers regarding available water resources during the drought period. The following parameters of the registered drought hydrograph (DH) are proposed: minimum drought discharge QDmin, drought duration DD  and deficit volume VD. All these parameters depend on the drought threshold QT, which is chosen based on either pure hydrological considerations or on socio-economic consequences. For the same statistical parameters of the drought, different shapes of the synthetic drought hydrograph (SDH) can be considered. In addition, the SDH varies according to the probabilities of exceedance of the minimum drought discharge and deficit volume. Full article
(This article belongs to the Special Issue Stochastic and Deterministic Modelling of Hydrologic Variables)
Show Figures

Figure 1

17 pages, 1599 KiB  
Article
Trends and Variabilities in Rainfall and Streamflow: A Case Study of the Nilwala River Basin in Sri Lanka
by Ravindu Panditharathne, Miyuru B. Gunathilake, Imiya M. Chathuranika, Upaka Rathnayake, Mukand S. Babel and Manoj K. Jha
Hydrology 2023, 10(1), 8; https://doi.org/10.3390/hydrology10010008 - 29 Dec 2022
Cited by 6 | Viewed by 2541
Abstract
Rainfall is one of the dominating climatic parameters that affect water availability. Trend analysis is of paramount significance to understand the behavior of hydrological and climatic variables over a long timescale. The main aim of the present study was to identify trends and [...] Read more.
Rainfall is one of the dominating climatic parameters that affect water availability. Trend analysis is of paramount significance to understand the behavior of hydrological and climatic variables over a long timescale. The main aim of the present study was to identify trends and analyze existing linkages between rainfall and streamflow in the Nilwala River Basin (NRB) of Southern Sri Lanka. An investigation of the trends, detection of change points and streamflow alteration, and linkage between rainfall and streamflow were carried out using the Mann–Kendall test, Sen’s slope test, Pettitt’s test, indicators of hydrological alteration (IHA), and Pearson’s correlation test. Selected rainfall-related extreme climatic indices, namely, CDD, CWD, PRCPTOT, R25, and Rx5, were calculated using the RClimdex software. Trend analysis of rainfall data and extreme rainfall indices demonstrated few statistically significant trends at the monthly, seasonal, and annual scales, while streamflow data showed non-significant trends, except for December. Pettitt’s test showed that Dampahala had a higher number of statistically significant change points among the six rainfall stations. The Pearson coefficient correlation showed a strong-to–very-strong positive relationship between rainfall and streamflow. Generally, both rainfall and streamflow showed non-significant trend patterns in the NRB, suggesting that rainfall had a higher impact on streamflow patterns in the basin. The historical trends of extreme climatic indices suggested that the NRB did not experience extreme climates. The results of the present study will provide valuable information for water resource planning, flood and disaster mitigation, agricultural operations planning, and hydropower generation in the NRB. Full article
(This article belongs to the Topic Hydrology and Water Resources in Agriculture and Ecology)
Show Figures

Figure 1

17 pages, 3405 KiB  
Article
Soil Erosion Quantification using Machine Learning in Sub-Watersheds of Northern Portugal
by Saulo Folharini, António Vieira, António Bento-Gonçalves, Sara Silva, Tiago Marques and Jorge Novais
Hydrology 2023, 10(1), 7; https://doi.org/10.3390/hydrology10010007 - 28 Dec 2022
Cited by 4 | Viewed by 2650
Abstract
Protected areas (PA) play an important role in minimizing the effects of soil erosion in watersheds. This study evaluated the performance of machine learning models, specifically support vector machine with linear kernel (SVMLinear), support vector machine with polynomial kernel (SVMPoly), and random forest [...] Read more.
Protected areas (PA) play an important role in minimizing the effects of soil erosion in watersheds. This study evaluated the performance of machine learning models, specifically support vector machine with linear kernel (SVMLinear), support vector machine with polynomial kernel (SVMPoly), and random forest (RF), on identifying indicators of soil erosion in 761 sub-watersheds and PA in northern Portugal, by using soil erosion by water in Europe, according to the revised universal soil loss equation (RUSLE2015), as target variable. The parameters analyzed were: soil erosion by water in Europe according to the revised universal soil loss equation (RUSLE2015), total burned area of the sub-watershed in the period of 1975-2020, fire recurrence, topographic wetness index (TWI), and the morphometric factors, namely area (A), perimeter (P), length (L), width (W), orientation (O), elongation ratio (Re), circularity ratio (Rc), compactness coefficient (Cc), form factor (Ff), shape factor (Sf), DEM, slope, and curvature. The median coefficient of determination (R2) for each model was RF (0.61), SVMpoly (0.68), and SVMLinear (0.54). Regarding the analyzed parameters, those that registered the greatest importance were A, P, L, W, curvature, and burned area, indicating that an analysis which considers morphometric factors, together with soil erosion data affected by water and soil moisture, is an important indicator in the analysis of soil erosion in watersheds. Full article
Show Figures

Figure 1

16 pages, 2591 KiB  
Article
Evaluation of Potential Changes in Extreme Discharges over Some Watersheds in Côte d’Ivoire
by N’da Jocelyne Maryse Christine Amichiatchi, Gneneyougo Emile Soro, Jean Hounkpè, Tie Albert Goula Bi and Agnidé Emmanuel Lawin
Hydrology 2023, 10(1), 6; https://doi.org/10.3390/hydrology10010006 - 28 Dec 2022
Cited by 5 | Viewed by 1281
Abstract
Climate change has had strong impacts on water resources over the past decades in Côte d’Ivoire, but these impacts on hydrological extremes remain largely unknown in most watersheds. Thus, this work aimed to evaluate the trends and breakpoints in extreme discharge characteristics of [...] Read more.
Climate change has had strong impacts on water resources over the past decades in Côte d’Ivoire, but these impacts on hydrological extremes remain largely unknown in most watersheds. Thus, this work aimed to evaluate the trends and breakpoints in extreme discharge characteristics of five watersheds in Côte d’Ivoire over the period 1970 to 2017. Seven indexes were selected, namely the 5-day maximum flow (QX5-days), peak discharge (Qmaxan), maximum monthly discharge (VCX30), annual minimum discharge (Qminan), average monthly discharge (QMNA), discharge day rate (VCN7), and characteristic of low discharge (WFD). The analysis was done using the modified Mann–Kendall (MMK) test and the standard normal homogeneity test at a 5% significance level for heterogeneous and homogeneous periods of data. The results for the heterogeneous and homogeneous periods were similar, with a predominance of non-significant trends for high discharge, except for the VCX30 index, which showed a significant upward trend at Kahin station. A decreasing trend for QX5-days was found at Loboville station. The variables Qminan, QMNA, VCN7, and WDF show significant upward trends of 33%, 16%, 50%, and 33% for the heterogeneous stations, respectively. A significant breakpoint in almost all variables was obtained, with a strong decrease after 2008. Some differences between the results from the heterogeneous and homogeneous periods of data were found and discussed. This study can help in understanding the behaviour of past hydrological extremes in the study area and in planning for further studies in the future. Full article
Show Figures

Figure 1

14 pages, 2426 KiB  
Article
Suspended Sediments in Environmental Flows: Interpretation of Concentration Profiles Shapes
by Rafik Absi
Hydrology 2023, 10(1), 5; https://doi.org/10.3390/hydrology10010005 - 25 Dec 2022
Cited by 2 | Viewed by 3565
Abstract
In environmental flows, field and laboratory measurements of suspended sediments show two kinds of concentration profiles. For coarse sediments, a near-bed upward convex profile is observed beneath the main upward concave profile. In this study, we consider two 1-DV models, namely, the classical [...] Read more.
In environmental flows, field and laboratory measurements of suspended sediments show two kinds of concentration profiles. For coarse sediments, a near-bed upward convex profile is observed beneath the main upward concave profile. In this study, we consider two 1-DV models, namely, the classical advection–diffusion equation (ADE) based on the gradient diffusion model, and the kinetic model. Both need sediment diffusivity, which is related to the eddy viscosity, and an y-dependent β-function (i.e., the inverse of the turbulent Schmidt number). Our study shows that the kinetic model reverts to the classical ADE with an “apparent” settling velocity or sediment diffusivity. For the numerical resolution of the ADE, simple and accurate tools are provided for both the sediment diffusivity and hindered settling. The results for the concentration profiles show good agreement with the experimental data. An interpretation of the concentration profiles is provided by two “criteria” for shapes. The main for steady open-channel flows shows that the shape of the concentration profiles in the Cartesian coordinate depends on the vertical distribution of the derivative of R (the ratio between the sediment diffusivity and the settling velocity of the sediments): dR/dy > −1 for the upward concave concentration profile while dR/dy < −1 for the near-bed upward convex profile. A generalization is proposed for oscillatory flows over sand ripples, where the time-averaged concentration profiles in the semi-log plots are interpreted by a relation between the second derivative of the logarithm of the concentration and the derivative of the product between the sediment diffusivity and an additional parameter related to the convective sediment entrainment process. Full article
(This article belongs to the Special Issue Recent Advances in Water and Water Resources Engineering)
Show Figures

Figure 1

18 pages, 4693 KiB  
Article
Biogeochemical Permeable Barrier Based on Zeolite and Expanded Clay for Immobilization of Metals in Groundwater
by Nadezhda Popova, Grigoriy Artemiev, Inga Zinicovscaia, Nikita Yushin, Ludmila Demina, Kirill Boldyrev, Denis Sobolev and Alexey Safonov
Hydrology 2023, 10(1), 4; https://doi.org/10.3390/hydrology10010004 - 24 Dec 2022
Cited by 2 | Viewed by 1683
Abstract
Groundwater samples contaminated with potentially toxic elements (PTE), including metals and nitrate ions, were collected at a depth of 8–10 m from the Siberian Chemical Plant multicomponent waste storage. The possibility of developing a permeable biogeochemical barrier with zeolite and lightweight expanded clay [...] Read more.
Groundwater samples contaminated with potentially toxic elements (PTE), including metals and nitrate ions, were collected at a depth of 8–10 m from the Siberian Chemical Plant multicomponent waste storage. The possibility of developing a permeable biogeochemical barrier with zeolite and lightweight expanded clay aggregate (LECA) was investigated. The mass fraction and properties of several metals (Mn, Fe, Co, Ni, Cu, Zn, Cd, Hg and Pb) were determined to investigate their fixation on the chosen materials at the given experimental conditions. It was established that metals in sulfide or phosphate forms can be effectively immobilized via biomineralization on LECA, whereas metals from the non-chalcogen group are primarily retained in the form of phosphates. The formation of biogenic deposits of iron sulfide, which serve as a sorption–precipitation phase during the immobilization of the majority of metals, is an important aspect of the LECA loading process. The use of LECA and zeolite in the form of a two-component barrier is feasible based on the data obtained. It is assumed that metal immobilization processes occur due to sorption mechanisms in the zone of zeolite loading. Microbial nitrate removal and the formation of iron sulfide phases under reducing conditions, which form a geochemical barrier for metals, are expected in the LECA zone. Full article
(This article belongs to the Special Issue Novel Approaches in Contaminant Hydrology and Groundwater Remediation)
Show Figures

Figure 1

22 pages, 4368 KiB  
Article
What Is the Impact of Leaky Sewers on Groundwater Contamination in Urban Semi-Confined Aquifers? A Test Study Related to Fecal Matter and Personal Care Products (PCPs)
by Laura Ducci, Pietro Rizzo, Riccardo Pinardi, Augusto Solfrini, Alessandro Maggiali, Mattia Pizzati, Fabrizio Balsamo and Fulvio Celico
Hydrology 2023, 10(1), 3; https://doi.org/10.3390/hydrology10010003 - 23 Dec 2022
Cited by 4 | Viewed by 3375
Abstract
Urban areas exercise numerous and strong pressures on water bodies, implying that different external anthropogenic factors also stress groundwater. Sewerage networks play an important role, being the place of wastewater flow. When sewerage deterioration conditions occur, aquifers can be contaminated by contaminants contained [...] Read more.
Urban areas exercise numerous and strong pressures on water bodies, implying that different external anthropogenic factors also stress groundwater. Sewerage networks play an important role, being the place of wastewater flow. When sewerage deterioration conditions occur, aquifers can be contaminated by contaminants contained within wastewater. The study aims to verify the impact of sewerage leaks in urban semi-confined aquifers through a multidisciplinary approach. Geological, hydrogeological, hydrochemical, microbiological, and biomolecular investigations are carried out in a test site close to a sewer pipe, from February to October 2022. Microbiological analyses are carried out on a monthly basis, contextually to hydraulic head measurements in purpose-drilled piezometers. The presence of sandy intercalations and the prevalence of silt within the outcropping (about 10 m thick) aquitard makes the aquifer vulnerable to percolation from leaky sewers, therefore causing persistent microbial contamination in groundwater. The presence of fecal indicators (including pathogenic genera), corrosive and human-associated bacteria markers, is detected. The magnitude of microbiological impact varies over time, depending on hydrogeological factors such as dilution, hydrodynamic dispersion, and variation of the groundwater flow pathway at the site scale. As for personal care products, only Disodium EDTA is detected in wastewater, while in groundwater the concentrations of all the analyzed substances are lower than the instrumental detection limit. Full article
(This article belongs to the Special Issue Urban Hydrogeology: Qualitative and Quantitative Research)
Show Figures

Figure 1

14 pages, 13910 KiB  
Article
Machine Learning for Surrogate Groundwater Modelling of a Small Carbonate Island
by Karl Payne, Peter Chami, Ivanna Odle, David Oscar Yawson, Jaime Paul, Anuradha Maharaj-Jagdip and Adrian Cashman
Hydrology 2023, 10(1), 2; https://doi.org/10.3390/hydrology10010002 - 22 Dec 2022
Cited by 2 | Viewed by 2378
Abstract
Barbados is heavily reliant on groundwater resources for its potable water supply, with over 80% of the island’s water sourced from aquifers. The ability to meet demand will become even more challenging due to the continuing climate crisis. The consequences of climate change [...] Read more.
Barbados is heavily reliant on groundwater resources for its potable water supply, with over 80% of the island’s water sourced from aquifers. The ability to meet demand will become even more challenging due to the continuing climate crisis. The consequences of climate change within the Caribbean region include sea level rise, as well as hydrometeorological effects such as increased rainfall intensity, and declines in average annual rainfall. Scientifically sound approaches are becoming increasingly important to understand projected changes in supply and demand while concurrently minimizing deleterious impacts on the island’s aquifers. Therefore, the objective of this paper is to develop a physics-based groundwater model and surrogate models using machine learning (ML), which provide decision support to assist with groundwater resources management in Barbados. Results from the study show that a single continuum conceptualization is adequate for representing the island’s hydrogeology as demonstrated by a root mean squared error and mean absolute error of 2.7 m and 2.08 m between the model and observed steady-state hydraulic head. In addition, we show that data-driven surrogates using deep neural networks, elastic networks, and generative adversarial networks are capable of approximating the physics-based model with a high degree of accuracy as shown by R-squared values of 0.96, 0.95, and 0.95, respectively. The framework and tools developed are a critical step towards a digital twin that provides stakeholders with a quantitative tool for optimal management of groundwater under a changing climate in Barbados. These outputs will provide sound evidence-based solutions to aid long-term economic and social development on the island. Full article
Show Figures

Figure 1

19 pages, 7876 KiB  
Article
A Stacked Machine Learning Algorithm for Multi-Step Ahead Prediction of Soil Moisture
by Francesco Granata, Fabio Di Nunno, Mohammad Najafzadeh and Ibrahim Demir
Hydrology 2023, 10(1), 1; https://doi.org/10.3390/hydrology10010001 - 21 Dec 2022
Cited by 11 | Viewed by 2114
Abstract
A trustworthy assessment of soil moisture content plays a significant role in irrigation planning and in controlling various natural disasters such as floods, landslides, and droughts. Various machine learning models (MLMs) have been used to increase the accuracy of soil moisture content prediction. [...] Read more.
A trustworthy assessment of soil moisture content plays a significant role in irrigation planning and in controlling various natural disasters such as floods, landslides, and droughts. Various machine learning models (MLMs) have been used to increase the accuracy of soil moisture content prediction. The present investigation aims to apply MLMs with novel structures for the estimation of daily volumetric soil water content, based on the stacking of the multilayer perceptron (MLP), random forest (RF), and support vector regression (SVR). Two groups of input variables were considered: the first (Model A) consisted of various meteorological variables (i.e., daily precipitation, air temperature, humidity, and wind speed), and the second (Model B) included only daily precipitation. The stacked model (SM) had the best performance (R2 = 0.962) in the prediction of daily volumetric soil water content for both categories of input variables when compared with the MLP (R2 = 0.957), RF (R2 = 0.956) and SVR (R2 = 0.951) models. Overall, the SM, which, in general, allows the weaknesses of the individual basic algorithms to be overcome while still maintaining a limited number of parameters and short calculation times, can lead to more accurate predictions of soil water content than those provided by more commonly employed MLMs. Full article
Show Figures

Figure 1

Previous Issue
Next Issue
Back to TopTop