Next Issue
Volume 10, January
Previous Issue
Volume 9, November


Hydrology, Volume 9, Issue 12 (December 2022) – 23 articles

Cover Story (view full-size image): 
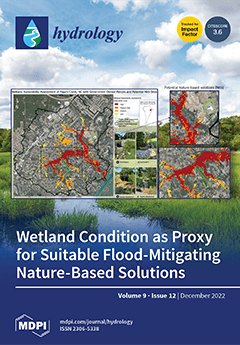
Flood mitigation in low-gradient, tidal-influenced, and rapidly urbanizing coastal locations remains a priority across a range of stakeholders and communities. Wetland ecosystems act as a natural flood buffer for coastal storms and rising sea levels, while simultaneously providing invaluable benefits to urban dwellers. Nature-based solutions (NBSs) are a type of green infrastructure that can contribute to flood mitigation through the management and restoration of the ecosystems that provide socio-environmental benefits. We propose that wetland vulnerability assessments can be used as a rapid method to quantify the changes in ecosystem dynamics and flood exposure and to prioritize potential locations of NBS implementation. View this paper
  • Issues are regarded as officially published after their release is announced to the table of contents alert mailing list.
  • You may sign up for e-mail alerts to receive table of contents of newly released issues.
  • PDF is the official format for papers published in both, html and pdf forms. To view the papers in pdf format, click on the "PDF Full-text" link, and use the free Adobe Reader to open them.
Order results
Result details
Section
Select all
Export citation of selected articles as:
28 pages, 7366 KiB  
Article
Hillslope Hydrology in a Deeply Weathered Saprolite and Associated Nitrate Transport to a Valley Bottom Wetland in Central Uganda
by Claudia Schepp, Bernd Diekkrüger and Mathias Becker
Hydrology 2022, 9(12), 229; https://doi.org/10.3390/hydrology9120229 - 19 Dec 2022
Cited by 1 | Viewed by 1775
Abstract
While interflow from the slopes can be crucial for water and nutrient availability in low-input farming systems in wetlands in East Africa, very little data exist on hillslope hydrology and associated nutrient transport in deeply weathered saprolites over crystalline rocks. This study aims [...] Read more.
While interflow from the slopes can be crucial for water and nutrient availability in low-input farming systems in wetlands in East Africa, very little data exist on hillslope hydrology and associated nutrient transport in deeply weathered saprolites over crystalline rocks. This study aims for a better process understanding of interflow generation and routing in this environment and its contribution to water and nitrate availability at the wetland fringe of a valley bottom wetland in central Uganda. The study was set up as a plot study following a multi-method approach, including interflow trenches, soil analysis, and geo-electrical measurements. We found that interflow generation was related to the undulating subsurface topography and the conductivity of the upper saprolite, while interflow was conducted to the slope toe via small, perched aquifers and preferential flow paths within the saprolite, which are connected during the rainy season. Interflow volumes and nitrate transport were strongly related to the land-use type and rainfall characteristics. As the nitrate delivered from the slopes was quickly lost in the anaerobic environment of the wetland fringe, sustainable agricultural management should focus on the slope toe and the upland positions. Full article
Show Figures

Figure 1

7 pages, 1786 KiB  
Editorial
Advances in Flow Modeling for Water Resources and Hydrological Engineering
by Carmelina Costanzo, Roberta Padulano and Tommaso Caloiero
Hydrology 2022, 9(12), 228; https://doi.org/10.3390/hydrology9120228 - 19 Dec 2022
Viewed by 1555
Abstract
Surface and ground waters can be considered the main sources of water supply for agricultural, municipal, and industrial consumers. Over the centuries, the combination of both naturally occurring conditions and humanity’s actions has placed increasing pressure on these water resources. As an example, [...] Read more.
Surface and ground waters can be considered the main sources of water supply for agricultural, municipal, and industrial consumers. Over the centuries, the combination of both naturally occurring conditions and humanity’s actions has placed increasing pressure on these water resources. As an example, climate change and natural variability in the distribution and occurrence of water are among the natural driving forces that complicate the sustainable development of water resources. Recent advances in computer techniques have allowed scientists to develop complex models at different scales to support water-resource planning and management. The Special Issue “Advances in Flow Modeling for Water Resources and Hydrological Engineering” presents a collection of scientific contributions providing a sample of the state-of-the-art research in this field. Full article
Show Figures

Figure 1

16 pages, 2223 KiB  
Article
Future Colorado River Basin Drought and Surplus
by Rama Bedri and Thomas Piechota
Hydrology 2022, 9(12), 227; https://doi.org/10.3390/hydrology9120227 - 14 Dec 2022
Cited by 2 | Viewed by 2083
Abstract
Historical and future drought and surplus periods in the Colorado River basin are evaluated based on eight climate scenarios. Unimpaired streamflow from 17 stations in the Colorado River are evaluated based on U.S. Geological Survey, Bureau of Reclamation, and Coupled Modeled Intercomparison Projection [...] Read more.
Historical and future drought and surplus periods in the Colorado River basin are evaluated based on eight climate scenarios. Unimpaired streamflow from 17 stations in the Colorado River are evaluated based on U.S. Geological Survey, Bureau of Reclamation, and Coupled Modeled Intercomparison Projection 5 downscaled data from 1950–2099. Representative Concentration Pathway (RCP) 4.5 and 8.5 emission scenarios are considered for four climate models (HadGEM2-ES, CNRM-CM5, CanESM2, MI-ROC5). Drought (surplus) quantities, magnitudes, severities, and water year flows are compared for the historical and future periods. Results indicate that there is a significant difference between the historical record and future projections. The results are not consistent in terms of increase of drought or surplus; however, the intensity (as measured by magnitude and duration) will likely increase for both RCP 4.5 and 8.5. The CanESM2 and CNRM-CM5 models project wetter scenarios, and HadGEM2 and MI-ROC5 models project drier scenarios. For the critical Lees Ferry station, models indicate a chance of higher drought and surplus length and magnitude on the order of two times the historical period. In addition, basin wide flow at Lees Ferry had a shift in the future mean ensemble of approximately 3–10% for the water year. Future hydrologic changes will heighten the need for appropriate management and infrastructure options available to adapt to these changes. Full article
Show Figures

Figure 1

18 pages, 4635 KiB  
Article
Daily Streamflow Forecasting in Mountainous Catchment Using XGBoost, LightGBM and CatBoost
by Robert Szczepanek
Hydrology 2022, 9(12), 226; https://doi.org/10.3390/hydrology9120226 - 13 Dec 2022
Cited by 21 | Viewed by 4588
Abstract
Streamflow forecasting in mountainous catchments is and will continue to be one of the important hydrological tasks. In recent years machine learning models are increasingly used for such forecasts. A direct comparison of the use of the three gradient boosting models (XGBoost, LightGBM [...] Read more.
Streamflow forecasting in mountainous catchments is and will continue to be one of the important hydrological tasks. In recent years machine learning models are increasingly used for such forecasts. A direct comparison of the use of the three gradient boosting models (XGBoost, LightGBM and CatBoost) to forecast daily streamflow in mountainous catchment is our main contribution. As predictors we use daily precipitation, runoff at upstream gauge station and two-day preceding observations. All three algorithms are simple to implement in Python, fast and robust. Compared to deep machine learning models (like LSTM), they allow for easy interpretation of the significance of predictors. All tested models achieved Nash-Sutcliffe model efficiency (NSE) in the range of 0.85–0.89 and RMSE in the range of 6.8–7.8 m3s1. A minimum of 12 years of training data series is required for such a result. The XGBoost did not turn out to be the best model for the daily streamflow forecast, although it is the most popular model. Using default model parameters, the best results were obtained with CatBoost. By optimizing the hyperparameters, the best forecast results were obtained by LightGBM. The differences between the model results are much smaller than the differences within the models themselves when suboptimal hyperparameters are used. Full article
(This article belongs to the Special Issue Stochastic and Deterministic Modelling of Hydrologic Variables)
Show Figures

Figure 1

14 pages, 4042 KiB  
Article
Comparing Rain Gauge and Weather RaDAR Data in the Estimation of the Pluviometric Inflow from the Apennine Ridge to the Adriatic Coast (Abruzzo Region, Central Italy)
by Diego Di Curzio, Alessia Di Giovanni, Raffaele Lidori, Mario Montopoli and Sergio Rusi
Hydrology 2022, 9(12), 225; https://doi.org/10.3390/hydrology9120225 - 11 Dec 2022
Cited by 4 | Viewed by 1619
Abstract
Accurate knowledge of the rain amount is a crucial driver in several hydrometeorological applications. This is especially true in complex orography territories, which are typically impervious, thus, leaving most mountain areas ungauged. Due to their spatial and temporal coverage, weather radars can potentially [...] Read more.
Accurate knowledge of the rain amount is a crucial driver in several hydrometeorological applications. This is especially true in complex orography territories, which are typically impervious, thus, leaving most mountain areas ungauged. Due to their spatial and temporal coverage, weather radars can potentially overcome such an issue. However, weather radar, if not accurately processed, can suffer from several limitations (e.g., beam blocking, altitude of the observation, path attenuation, and indirectness of the measurement) that can hamper the reliability of the rain estimates performed. In this study, a comparison between rain gauge and weather radar retrievals is performed in the target area of the Abruzzo region in Italy, which is characterized by a heterogeneous orography ranging from the seaside to Apennine ridge. Consequently, the Abruzzo region has an inhomogeneous distribution of the rain gauges, with station density decreasing with the altitude reaching approximately 1500 m a.s.l. Notwithstanding, pluviometric inflow spatial distribution shows a subregional dependency as a function of four climatic and altimetric factors: coastal, hilly, mountain, and inner plain areas (i.e., Marsica). Such areas are used in this analysis to characterize the radar retrieval vs. rain gauge amounts in each of those zones. Compared to previous studies on the topic, the analysis presented the importance of an accurate selection of the climatic and altimetric subregional areas where the radar vs. rain gauge comparison is undertaken. This aspect is not only of great importance to correct biases in radar retrieval in a more selective way, but it also paves the way for more accurate hydrometeorological applications (e.g., hydrological model initialization and quantification of aquifer recharge), which, in general, require the accurate knowledge of rain amounts upstream of a basin. To fill the gap caused by the uneven rain gauge distribution, ordinary Kriging (OK) was applied on a regional scale to obtain 2D maps of rainfall data, which were cumulated on a monthly and yearly basis. Weather radar data from the Italian mosaic were also considered, in terms of rain rate retrievals and cumulations performed on the same time frame used for rain gauges. The period considered for the analysis was two continuous years: 2017 and 2018. The output of the elaborations included raster maps for both radar and interpolated rain gauges, where each pixel contained a rainfall quantity. Although the results showed a general underestimation of the weather radar data, especially in mountain and Marsica areas, they were within the 95% confidence interval of the OK estimation. Our analysis highlighted that the average bias between radar and rain gauges, in terms of precipitation amounts, was a function of altitude and was almost constant in each of the selected areas. This achievement suggests that after a proper selection of homogeneous target areas, radar retrieval can be corrected using the denser network of rain gauges typically distributed at lower altitudes, and such correction can be extended at higher altitudes without loss of generality. Full article
Show Figures

Figure 1

14 pages, 2372 KiB  
Article
Application of GIS Techniques in Identifying Artificial Groundwater Recharging Zones in Arid Regions: A Case Study in Tissamaharama, Sri Lanka
by Tiran Kariyawasam, Vindhya Basnayake, Susantha Wanniarachchi, Ranjan Sarukkalige and Upaka Rathnayake
Hydrology 2022, 9(12), 224; https://doi.org/10.3390/hydrology9120224 - 10 Dec 2022
Cited by 2 | Viewed by 2431
Abstract
Groundwater resources are severely threatened not only in terms of their quality but also their quantity. The availability of groundwater in arid regions is highly important as it caters to domestic needs, irrigation, and industrial purposes in those areas. With the increasing population [...] Read more.
Groundwater resources are severely threatened not only in terms of their quality but also their quantity. The availability of groundwater in arid regions is highly important as it caters to domestic needs, irrigation, and industrial purposes in those areas. With the increasing population and human needs, artificial recharging of groundwater has become an important topic because of rainfall scarcity, high evaporation, and shortage of surface water resources in arid regions. However, this has been given the minimum attention in the context of Sri Lanka. Therefore, the current research was carried out to demarcate suitable sites for the artificial recharging of aquifers with the help of geographic information system (GIS) techniques, in one of the water-scarce regions in Sri Lanka. Tissamaharama District Secretariat Division (DSD) is located in Hambanthota district. This region faces periodic water stress with a low-intensity seasonal rainfall pattern and a lack of surface water sources. Hydrological, geological, and geomorphological parameters such as rainfall, soil type, slope, drainage density, and land use patterns were considered to be the most influential parameters in determining the artificial recharging potential in the study area. The GIS tools were used to carry out a weighted overlay analysis to integrate the effects of each parameter into the potential for artificial groundwater recharge. The result of the study shows that 14.60% of the area in the Tissamaharama DSD has a very good potential for artificial groundwater recharge, while 41.32% has a good potential and 39.03% and 5.05% have poor and very poor potential for artificial groundwater recharge, respectively. The southern part of the DSD and the Yala nature reserve areas are observed to have a higher potential for artificial groundwater recharge than the other areas of Tissamaharama DSD. It is recommended to test the efficiency and effects of groundwater recharge using groundwater models by simulating the effects of groundwater recharge in future studies. Therefore, the results of the current research will be helpful in effectively managing the groundwater resources in the study area. Full article
Show Figures

Figure 1

19 pages, 8024 KiB  
Article
Hydrological and Hydraulic Modeling Applied to Flash Flood Events in a Small Urban Stream
by Leonardo Souza Bruno, Tiago Souza Mattos, Paulo Tarso Sanches Oliveira, André Almagro and Dulce Buchala Bicca Rodrigues
Hydrology 2022, 9(12), 223; https://doi.org/10.3390/hydrology9120223 - 09 Dec 2022
Cited by 6 | Viewed by 3126
Abstract
In flood area mapping studies, hydrological-hydraulic modeling has been successfully applied around the world. However, the object of study of most of the research developed in Brazil is medium to large channels that use topographical and hydrometeorological data of coarse spatial and temporal [...] Read more.
In flood area mapping studies, hydrological-hydraulic modeling has been successfully applied around the world. However, the object of study of most of the research developed in Brazil is medium to large channels that use topographical and hydrometeorological data of coarse spatial and temporal resolution. Thus, the aim of this study is to investigate coupled modeling in a small urban channel, using high-resolution data, in the simulation of flood events in a small urban channel, located in Campo Grande, Mato Grosso do Sul. In this study, we used the HEC-HMS and HEC-RAS programs, where topographic information, land use, land cover, and observed data from rain gauges, water level, and flow sensors from 2015 to 2018 were used as input data. To calibrate and validate the hydrological model, four events were used that occurred during the monitoring period, while in the hydraulic model we chose a historical event that caused great disturbances. We then generated flood scenarios with representative synthetic rainfall for a basin, with return times of 5, 10, 50, and 100 years. We observed a good fit in the calibration and validation of the HEC-HMS, with values of R2 = 0.93, RMSE = 1.29, and NSE = 0.92. In HEC-RAS, we obtained values of R2 = 0.93, RMSE = 1.29, and NSE = 0.92 for the calibration, and in the validation, real images of the event prove the computed flood spot sources. We observed that rain with a return time of less than five years provides areas of flooding in several regions of the channel, and in critical channeled sections, the elevation and speed of the flow reach 5 m and 3 m·s−1, respectively. Our results indicate that the channel already has a natural tendency towards flooding in certain stretches, which become more compromised due to land use and coverage and local conditions. We conclude that the high-resolution coupled modeling generated information that represents local conditions as well, showing how potential failures of drainage in extreme scenarios are possible, thus enabling the planning of adaptations and protection measures against floods. Full article
Show Figures

Figure 1

21 pages, 14871 KiB  
Article
Groundwater Variability in a Semi-Arid River Basin, Central India
by M. Niranjannaik, Amit Kumar, Zafar Beg, Abhilash Singh, Somil Swarnkar and Kumar Gaurav
Hydrology 2022, 9(12), 222; https://doi.org/10.3390/hydrology9120222 - 07 Dec 2022
Cited by 5 | Viewed by 2479
Abstract
The Betwa River basin, a semi-arid catchment that has been classified as a major hotspot of groundwater depletion in Central India. The rainfall and streamflow intermittency have affected agricultural practices due to the variability of groundwater availability for irrigation. This study evaluates the [...] Read more.
The Betwa River basin, a semi-arid catchment that has been classified as a major hotspot of groundwater depletion in Central India. The rainfall and streamflow intermittency have affected agricultural practices due to the variability of groundwater availability for irrigation. This study evaluates the spatial and temporal variations of groundwater level (GWL) in the last 25 years (1993–2018) in the catchment. We applied a nonparametric Seasonal Trend decomposition based on the Loess (STL) method to decompose the GWL time series into the seasonal, trend, and remainder components. We observed that the GWL in the northeastern regions of the basin has depleted about 3–5 mbgl in the last two decades. During the same period, the basin has experienced a reduction in the rainfall magnitude (2.07 mm/yr). We observed that the overexploitation of groundwater for irrigation and rainfall variability have greatly impacted the GWL condition in the study area. Further, if the groundwater extraction continues at present rates, the Betwa River basin may experience severe depletion in the future. Full article
(This article belongs to the Section Water Resources and Risk Management)
Show Figures

Figure 1

31 pages, 2005 KiB  
Article
Trivariate Joint Distribution Modelling of Compound Events Using the Nonparametric D-Vine Copula Developed Based on a Bernstein and Beta Kernel Copula Density Framework
by Shahid Latif and Slobodan P. Simonovic
Hydrology 2022, 9(12), 221; https://doi.org/10.3390/hydrology9120221 - 07 Dec 2022
Cited by 4 | Viewed by 1502
Abstract
Low-lying coastal communities are often threatened by compound flooding (CF), which can be determined through the joint occurrence of storm surges, rainfall and river discharge, either successively or in close succession. The trivariate distribution can demonstrate the risk of the compound phenomenon more [...] Read more.
Low-lying coastal communities are often threatened by compound flooding (CF), which can be determined through the joint occurrence of storm surges, rainfall and river discharge, either successively or in close succession. The trivariate distribution can demonstrate the risk of the compound phenomenon more realistically, rather than considering each contributing factor independently or in pairwise dependency relations. Recently, the vine copula has been recognized as a highly flexible approach to constructing a higher-dimensional joint density framework. In these, the parametric class copula with parametric univariate marginals is often involved. Its incorporation can lead to a lack of flexibility due to parametric functions that have prior distribution assumptions about their univariate marginal and/or copula joint density. This study introduces the vine copula approach in a nonparametric setting by introducing Bernstein and Beta kernel copula density in establishing trivariate flood dependence. The proposed model was applied to 46 years of flood characteristics collected on the west coast of Canada. The univariate flood marginal distribution was modelled using nonparametric kernel density estimation (KDE). The 2D Bernstein estimator and beta kernel copula estimator were tested independently in capturing pairwise dependencies to establish D-vine structure in a stage-wise nesting approach in three alternative ways, each by permutating the location of the conditioning variable. The best-fitted vine structure was selected using goodness-of-fit (GOF) test statistics. The performance of the nonparametric vine approach was also compared with those of vines constructed with a parametric and semiparametric fitting procedure. Investigation revealed that the D-vine copula constructed using a Bernstein copula with normal KDE marginals performed well nonparametrically in capturing the dependence of the compound events. Finally, the derived nonparametric model was used in the estimation of trivariate joint return periods, and further employed in estimating failure probability statistics. Full article
(This article belongs to the Special Issue Modern Developments in Flood Modelling)
Show Figures

Graphical abstract

14 pages, 3053 KiB  
Article
Effects of Antecedent Precipitation Amount and COVID-19 Lockdown on Water Quality along an Urban Gradient
by Daniel Ramirez, Heejun Chang and Katherine Gelsey
Hydrology 2022, 9(12), 220; https://doi.org/10.3390/hydrology9120220 - 05 Dec 2022
Cited by 1 | Viewed by 1543
Abstract
Water quality is affected by multiple spatial and temporal factors, including the surrounding land characteristics, human activities, and antecedent precipitation amounts. However, identifying the relationships between water quality and spatially and temporally varying environmental variables with a machine learning technique in a heterogeneous [...] Read more.
Water quality is affected by multiple spatial and temporal factors, including the surrounding land characteristics, human activities, and antecedent precipitation amounts. However, identifying the relationships between water quality and spatially and temporally varying environmental variables with a machine learning technique in a heterogeneous urban landscape has been understudied. We explore how seasonal and variable precipitation amounts and other small-scale landscape variables affect E. coli, total suspended solids (TSS), nitrogen-nitrate, orthophosphate, lead, and zinc concentrations in Portland, Oregon, USA. Mann–Whitney tests were used to detect differences in water quality between seasons and COVID-19 periods. Spearman’s rank correlation analysis was used to identify the relationship between water quality and explanatory variables. A Random Forest (RF) model was used to predict water quality using antecedent precipitation amounts and landscape variables as inputs. The performance of RF was compared with that of ordinary least squares (OLS). Mann–Whitney tests identified statistically significant differences in all pollutant concentrations (except TSS) between the wet and dry seasons. Nitrate was the only pollutant to display statistically significant reductions in median concentrations (from 1.5 mg/L to 1.04 mg/L) during the COVID-19 lockdown period, likely associated with reduced traffic volumes. Spearman’s correlation analysis identified the highest correlation coefficients between one-day precipitation amounts and E. coli, lead, zinc, and TSS concentrations. Road length is positively associated with E. coli and zinc. The Random Forest (RF) model best predicts orthophosphate concentrations (R2 = 0.58), followed by TSS (R2 = 0.54) and nitrate (R2 = 0.46). E. coli was the most difficult to model and had the highest RMSE, MAE, and MAPE values. Overall, the Random Forest model outperformed OLS, as evaluated by RMSE, MAE, MAPE, and R2. The Random Forest was an effective approach to modeling pollutant concentrations using both categorical seasonal and COVID data along with continuous rain and landscape variables to predict water quality in urban streams. Implementing optimization techniques can further improve the model’s performance and allow researchers to use a machine learning approach for water quality modeling. Full article
(This article belongs to the Section Hydrology–Climate Interactions)
Show Figures

Figure 1

61 pages, 13851 KiB  
Article
Partial Desalination of Saline Groundwater, including Flowback Water, to Produce Irrigation Water
by David D. J. Antia
Hydrology 2022, 9(12), 219; https://doi.org/10.3390/hydrology9120219 - 05 Dec 2022
Cited by 2 | Viewed by 2143
Abstract
Globally, more than 50 million ha of arable land is irrigated with saline water. The majority of this saline irrigation water is derived from saline groundwater. Global irrigation requirements may increase from 270 million ha in 2014 to about 750 million ha by [...] Read more.
Globally, more than 50 million ha of arable land is irrigated with saline water. The majority of this saline irrigation water is derived from saline groundwater. Global irrigation requirements may increase from 270 million ha in 2014 to about 750 million ha by 2050 as the global population increases to 9.1 billion people. The majority of this additional irrigation water is likely to come from saline groundwater sources. Desalination of irrigation water increases crop yield. A combination of high water volume requirements and low crop yields requires that, for widespread usage, the desalinated irrigation water product will require a delivery price of <USD 0.5 m3. This study considers five passive desalination routes (n-Fe0; n-Fe3O4; Fe0:Fe(b)@C0 polymer; n-Fe0:Fe(b) polymer; n-Fe(b) polymer) that may potentially achieve this goal: A common desalination mechanism is identified for the Fe0:Fe(b)@C0 polymer; n-Fe0:Fe(b) polymer; and n-Fe(b) polymer routes. The analysis establishes that the n-Fe(b) polymer route may be able to achieve (with a reaction time of 1 h) an 80% to 90% desalination of saline groundwater or flowback water (12.3 g NaCl L−1; EC = 17.6 dSm−1), to form partially desalinated irrigation water (1.2 to 2.4 g NaCl L−1; EC = 2 to 3.4 dSm−1) with an associated reduction in the sodium adsorption ratio (SAR) from 125 to between 1.2 and 2.5, for a potential material (n-Fe(b) polymer) treatment cost of <USD 0.01 m−3, after considering polymer reuse and recycle, but excluding all other plant and other operating costs. The examples demonstrate that the polymers can be used to create: (i) a desalinated stationary hydrodynamic plume, containing 47,123 m3 water (1 to 2.5 g NaCl L−1), within 157,080 m3 porous rock forming a confined, saline aquifer (18.59 g NaCl L−1), to act as a reservoir of desalinated water (96 m3 d−1) for irrigation, with the potential to produce >960 m3 d−1 as required; (ii) a desalinated, perched, stationary, shallow groundwater mound, located above the regional water table, containing >200 m3 of desalinated water. Full article
(This article belongs to the Special Issue Groundwater Management)
Show Figures

Figure 1

22 pages, 9911 KiB  
Article
Wetland Vulnerability Metrics as a Rapid Indicator in Identifying Nature-Based Solutions to Mitigate Coastal Flooding
by Narcisa Gabriela Pricope and Greer Shivers
Hydrology 2022, 9(12), 218; https://doi.org/10.3390/hydrology9120218 - 02 Dec 2022
Cited by 2 | Viewed by 2939
Abstract
Flood mitigation in low-gradient, tidally-influenced, and rapidly urbanizing coastal locations remains a priority across a range of stakeholders and communities. Wetland ecosystems act as a natural flood buffer for coastal storms and sea level rise (SLR) while simultaneously providing invaluable benefits to urban [...] Read more.
Flood mitigation in low-gradient, tidally-influenced, and rapidly urbanizing coastal locations remains a priority across a range of stakeholders and communities. Wetland ecosystems act as a natural flood buffer for coastal storms and sea level rise (SLR) while simultaneously providing invaluable benefits to urban dwellers. Assessing the vulnerability of wetlands to flood exposure under different SLR scenarios and vegetation responses to climatic variability over time allows for management actions, such as nature-based solutions, to be implemented to preserve wetland ecosystems and the services they provide. Nature-based solutions (NBSs) are a type of green infrastructure that can contribute to flood mitigation through the management and restoration of the ecosystems that provide socio-environmental benefits. However, identifying the flood mitigation potential provided by wetlands and the suitability for NBS implementation depends on the ecological condition and environmental exposure. We propose that wetland vulnerability assessments can be used as a rapid method to quantify changes in ecosystem dynamics and flood exposure and to prioritize potential locations of NBSs implementation. We quantified exposure risk using 100- and 500-year special flood hazard areas, 1–10 ft of sea level rise scenarios, and high-tide flooding and sensitivity using timeseries analyses of Landsat 8-derived multispectral indices as proxies for wetland conditions at subwatershed scales. We posit that wetland areas that are both highly vulnerable to recurrent flooding and degrading over time would make good candidate locations for NBS prioritization, especially when they co-occur on or adjacently to government-owned parcels. In collaboration with local governmental agencies responsible for flood mitigation in the coastal sub-watersheds of the City of New Bern and New Hanover County, North Carolina, we conducted field verification campaigns and leveraged local expert knowledge to identify optimal NBS priority areas. Our results identified several government-owned parcels containing highly vulnerable wetland areas that can be ranked and prioritized for potential NBS implementation. Depending on the biophysical characteristics of the area, NBS candidate wetland types include brackish and freshwater marshes and riverine swamp forests, even though the predominant wetland types by area are managed loblolly pinelands. This study underscores the critical importance of conserving or restoring marshes and swamp forests and provides a transferable framework for conducting scale-invariant assessments of coastal wetland condition and flood exposure as a rapid method of identifying potential priority areas for nature-based solutions to mitigate coastal flooding. Full article
(This article belongs to the Special Issue Modern Developments in Flood Modelling)
Show Figures

Figure 1

18 pages, 5884 KiB  
Article
Analysis of the Hydraulic Efficiency of a Steerable Detention Tank—Simulation Studies
by Kamil Pochwat and Henrique Pizzo
Hydrology 2022, 9(12), 217; https://doi.org/10.3390/hydrology9120217 - 30 Nov 2022
Cited by 2 | Viewed by 1371
Abstract
The article contains the results of the first part of the research on the analysis of the operation of the retention device cooperating with the drainage system—steerable detention tank and concerns model simulation studies. The obtained results are an introduction to conducting laboratory [...] Read more.
The article contains the results of the first part of the research on the analysis of the operation of the retention device cooperating with the drainage system—steerable detention tank and concerns model simulation studies. The obtained results are an introduction to conducting laboratory tests. The planned research was carried out on the basis of the theory of experimental planning and hydrodynamic modelling, in which the systems of hydraulic parameters of the drainage system and hydrological of the catchment were selected. In total, over a thousand hydrodynamic simulations were carried out using SWMM 5.1. The planned analyses had two main goals. Firstly, to verify the possibility of reducing the rainwater volume flow in the drainage system by means of controllable devices enabling cooperation with the drainage system in various hydraulic conditions of the drainage system. Secondly, determining the impact of the connection method (parallel or serial) of the device enabling retention and cooperation with the sewage system on the efficiency of the system. The conducted analyses showed that the use of a retention device cooperating with the drainage system may significantly reduce the amount of sewage outfall from system, depending on the capacity of a single micro-accumulator, even up to 83% (in the analysed data range). It was also shown that the method of connecting the device to the network has an influence on the efficiency of the system in depend on hydraulic conditions. Full article
(This article belongs to the Special Issue Stormwater/Drainage Systems and Wastewater Management)
Show Figures

Figure 1

20 pages, 5643 KiB  
Article
Forecasting High-Flow Discharges in a Flashy Catchment Using Multiple Precipitation Estimates as Predictors in Machine Learning Models
by Andre D. L. Zanchetta, Paulin Coulibaly and Vincent Fortin
Hydrology 2022, 9(12), 216; https://doi.org/10.3390/hydrology9120216 - 30 Nov 2022
Viewed by 1533
Abstract
The use of machine learning (ML) for predicting high river flow events is gaining prominence and among its non-trivial design decisions is the definition of the quantitative precipitation estimate (QPE) product included in the input dataset. This study proposes and evaluates the use [...] Read more.
The use of machine learning (ML) for predicting high river flow events is gaining prominence and among its non-trivial design decisions is the definition of the quantitative precipitation estimate (QPE) product included in the input dataset. This study proposes and evaluates the use of multiple concurrent QPEs to improve the performance of a ML model towards the forecasting of the discharge in a flashy urban catchment. Multiple extreme learning machine (ELM) models were trained with distinct combinations of QPEs from radar, reanalysis, and gauge datasets. Their performance was then assessed in terms of goodness of fit and contingency analysis for the prediction of high flows. It was found that multi-QPEs models overperformed the best of its single-QPE counterparts, with gains in Kling-Gupta efficiency (KGE) values up to 4.76% and increase of precision in detecting high flows up to 7.27% for the lead times in which forecasts were considered “useful”. The novelty of these results suggests that the implementation of ML models could achieve better performance if the predictive features related to rainfall data were more diverse in terms of data sources when compared with the currently predominant use of a single QPE product. Full article
(This article belongs to the Section Hydrological and Hydrodynamic Processes and Modelling)
Show Figures

Figure 1

19 pages, 4930 KiB  
Article
Assessment of Atmospheric Correction Processors and Spectral Bands for Satellite-Derived Bathymetry Using Sentinel-2 Data in the Middle Adriatic
by Ljerka Vrdoljak and Jelena Kilić Pamuković
Hydrology 2022, 9(12), 215; https://doi.org/10.3390/hydrology9120215 - 30 Nov 2022
Cited by 6 | Viewed by 1882
Abstract
Satellite-derived bathymetry (SDB) based on multispectral satellite images (MSI) from the satellite’s optical sensors is a recent technique for surveying shallow waters. Sentinel-2 satellite mission with an open access policy and high spatial, radiometric, and temporal resolution of MSI-s started a new era [...] Read more.
Satellite-derived bathymetry (SDB) based on multispectral satellite images (MSI) from the satellite’s optical sensors is a recent technique for surveying shallow waters. Sentinel-2 satellite mission with an open access policy and high spatial, radiometric, and temporal resolution of MSI-s started a new era in the mapping of coastal bathymetry. More than 90 percent of the electromagnetic (EM) signal received by satellites is due to the atmospheric path of the EM signal. While Sentinel-2 MSI Level 1C provides top-of-atmosphere reflectance, Level 2A provides bottom-of-atmosphere reflectance. The European Space Agency applies the Sen2Cor algorithm for atmospheric correction (AC) to model the atmospheric path of the signal and reduce the MSI reflectance from L1C to L2A over the land area. This research evaluated the performance of different image-based AC processors, namely: Sen2Cor, Acolite, C2RCC, and iCOR for SDB modelling. The empirical log band ratio algorithm was applied to a time series of Sentinel-2 MSI in the middle Adriatic. All AC processors outperformed Sentinel-L2A MSI for SDB. Acolite and iCOR demonstrated accurate performance with a correlation coefficient higher than 90 percent and the RMSE under 2 m for depths up to 20 m. C2RCC produced more robust bathymetry models and was able to retrieve the depth information from more scenes than any other correction. Furthermore, a switch model combining different spectral bands improved mapping in shallow waters, demonstrating the potential of SDB technology for the effective mapping of shallow waters. Full article
Show Figures

Figure 1

20 pages, 8537 KiB  
Article
Numerical and Physical Modeling of Ponte Liscione (Guardialfiera, Molise) Dam Spillways and Stilling Basin
by Monica Moroni, Myrta Castellino and Paolo De Girolamo
Hydrology 2022, 9(12), 214; https://doi.org/10.3390/hydrology9120214 - 28 Nov 2022
Cited by 1 | Viewed by 1508
Abstract
Issues such as the design or reauditing of dams due to the occurrence of extreme events caused by climatic change are mandatory to address to ensure the safety of territories. These topics may be tackled numerically with Computational Fluid Dynamics and experimentally with [...] Read more.
Issues such as the design or reauditing of dams due to the occurrence of extreme events caused by climatic change are mandatory to address to ensure the safety of territories. These topics may be tackled numerically with Computational Fluid Dynamics and experimentally with physical models. This paper describes the 1:60 Froude-scaled numerical model of the Liscione (Guardialfiera, Molise, Italy) dam spillway and the downstream stilling basin. The k-ω SST turbulence model was chosen to close the Reynolds-averaged Navier–Stokes equations (RANS) implemented in the commercial software Ansys Fluent ®. The computation domain was discretized using a grid with hexagonal meshes. Experimental data for model validation were gathered from the 1:60 scale physical model of the Liscione dam spillways and the downstream riverbed of the Biferno river built at the Laboratory of Hydraulic and Maritime Constructions of the Sapienza University of Rome. The model was scaled according to the Froude number and fully developed turbulent flow conditions were reproduced at the model scale (Re > 10,000). From the analysis of the results of both the physical and the numerical models, it is clear that the stilling basin is undersized and therefore insufficient to manage the energy content of the fluid output to the river, with a significant impact on the erodible downstream river bottom in terms of scour depths. Furthermore, the numerical model showed that a less vigorous jet-like flow is obtained by removing one of the sills the dam is supplied with. Full article
(This article belongs to the Special Issue Modern Developments in Flood Modelling)
Show Figures

Figure 1

17 pages, 3259 KiB  
Article
Understanding Dry and Wet Conditions in the Vietnamese Mekong Delta Using Multiple Drought Indices: A Case Study in Ca Mau Province
by Huynh Vuong Thu Minh, Pankaj Kumar, Tran Van Ty, Dinh Van Duy, Tran Gia Han, Kim Lavane and Ram Avtar
Hydrology 2022, 9(12), 213; https://doi.org/10.3390/hydrology9120213 - 28 Nov 2022
Cited by 6 | Viewed by 1991
Abstract
Globally, hydrometeorological hazards have large impacts to agriculture output, as well as human well-being. With climate change derived increasing frequency of extreme weather conditions, the situation has becoming more severe. This study strives to evaluate both dry and wet conditions in the Vietnamese [...] Read more.
Globally, hydrometeorological hazards have large impacts to agriculture output, as well as human well-being. With climate change derived increasing frequency of extreme weather conditions, the situation has becoming more severe. This study strives to evaluate both dry and wet conditions in the Vietnamese Mekong Delta (VMD), also known as the rice basket of the Southeast Asian region. Different meteorological parameters from the last three decades were used to develop drought indices for Ca Mau province to investigate their impact on agricultural output. For this purpose, the standard precipitation index (SPI), the agricultural rainfall index (ARI), and the standardized precipitation evapotranspiration index (SPEI) were used in this study. Results highlight that Ca Mau has a peculiar characteristic of the whole VMD in that dry periods persist well into the wet season extending the duration of drought events. The role of storms, including tropical storms, and El Niño cannot be ignored as extreme events, which both change humidity, as well as rainfall. It is also found that the drought situation has caused significant damage to both rice and shrimp outputs in almost 6000 hectares. The assessment contributes to an improved understanding of the pattern of unpredictable rainfall and meteorological anomaly conditions in Ca Mau. The findings of this paper are important for both policymakers and practitioners in designing more robust plans for water resource management. Full article
(This article belongs to the Special Issue Drought and Water Scarcity: Monitoring, Modelling and Mitigation)
Show Figures

Figure 1

15 pages, 3901 KiB  
Article
Farmers’ Perception of Climate Change and Its Impacts on Agriculture
by Ramesh Shrestha, Biplob Rakhal, Tirtha Raj Adhikari, Ganesh Raj Ghimire, Rocky Talchabhadel, Dinee Tamang, Radhika KC and Sanjib Sharma
Hydrology 2022, 9(12), 212; https://doi.org/10.3390/hydrology9120212 - 28 Nov 2022
Cited by 5 | Viewed by 6005
Abstract
Climate change and climate variability drive rapid glacier melt and snowpack loss, extreme precipitation and temperature events, and alteration of water availability in the Himalayas. There is increasing observational evidence of climate change impacts on water resource availability and agricultural productivity in the [...] Read more.
Climate change and climate variability drive rapid glacier melt and snowpack loss, extreme precipitation and temperature events, and alteration of water availability in the Himalayas. There is increasing observational evidence of climate change impacts on water resource availability and agricultural productivity in the central Himalayan region. Here, we assess the farmers’ perception of climate change and its impacts on agriculture in western Nepal. We interviewed 554 households and conducted eight focus group discussions to collect farmers’ perceptions of temperature and rainfall characteristics, water availability, onset and duration of different seasons, and the impacts of such changes on their lives and livelihoods. Our results indicate that the farmers’ perceptions of rising annual and summer temperatures are consistent with observations. Perception, however, contradicts observed trends in winter temperature, as well as annual, monsoon, and winter precipitation. In addition, farmers are increasingly facing incidences of extreme events, including rainfall, floods, landslides, and droughts. These hazards often impact agricultural production, reducing household income and exacerbating the economic impacts on subsistence farmers. Integrated assessment of farmers’ perceptions and hydrometeorological observations is crucial to improving climate change impact assessment and informing the design of mitigation and adaptation strategies. Full article
(This article belongs to the Special Issue Accounting for Climate Change in Water and Agriculture Management)
Show Figures

Figure 1

20 pages, 4005 KiB  
Article
Numerical Modeling of Seawater Intrusion in Wadi Al-Jizi Coastal Aquifer in the Sultanate of Oman
by Javed Akhtar, Ahmad Sana, Syed Mohammed Tauseef and Hitoshi Tanaka
Hydrology 2022, 9(12), 211; https://doi.org/10.3390/hydrology9120211 - 27 Nov 2022
Cited by 4 | Viewed by 2183
Abstract
The Sultanate of Oman is an arid country in the Arabian Peninsula suffering from insufficient freshwater supplies and extremely hot weather conditions. The only source of recharge is rainfall, which is scarce and varies with space and time, for the aquifers being overexploited [...] Read more.
The Sultanate of Oman is an arid country in the Arabian Peninsula suffering from insufficient freshwater supplies and extremely hot weather conditions. The only source of recharge is rainfall, which is scarce and varies with space and time, for the aquifers being overexploited for the last few decades. This has led to depleting groundwater levels and seawater intrusion into coastal aquifers. In the present study, Ground Modeling System (GMS) was employed in Wadi Al-Jizi, which is one of the important aquifers in the Al Batinah coastal plain that caters to the needs of the country’s 70% agriculture. MODFLOW and MT3DMS were used to simulate the groundwater levels and solute transport, respectively. These models were calibrated under steady and transient conditions using observed data from twenty monitoring wells for a period of seventeen years (year 2000–2016). After validation, the model was utilized to predict the salinity intrusion due to changes in groundwater abstraction rates and sea level rise owing to climatic change. These predictions show that, by the year 2040, salinity intrusion (TDS > 12,800 mg/L) will transgress by 0.80 km inland if the current abstraction rates are allowed to be maintained. Further deterioration of groundwater quality is anticipated in the following years due to the increased pumping rates. The models and the results from the present study may be utilized for the effective management of groundwater resources in the Wadi Al-Jizi aquifer. Full article
(This article belongs to the Section Surface Waters and Groundwaters)
Show Figures

Figure 1

16 pages, 2007 KiB  
Article
Water Footprint Assessment for Irrigated Paddy Cultivation in Walawe Irrigation Scheme, Sri Lanka
by Higgoda K. Janani, Himasha Dilshani Abeysiriwardana, Upaka Rathnayake and Ranjan Sarukkalige
Hydrology 2022, 9(12), 210; https://doi.org/10.3390/hydrology9120210 - 25 Nov 2022
Cited by 2 | Viewed by 2222
Abstract
Water footprint (WF) is a comprehensive summation of the volume of freshwater consumed directly and indirectly in all the steps of the production chain of a product. The water footprint concept has been widely used in agricultural water resources management. Water for irrigation [...] Read more.
Water footprint (WF) is a comprehensive summation of the volume of freshwater consumed directly and indirectly in all the steps of the production chain of a product. The water footprint concept has been widely used in agricultural water resources management. Water for irrigation is supplied in Sri Lanka to farmers at no cost, and thus the question is arising, whether the current management strategies the authorities and the farmers follow are appropriate to achieve productive water utilization. Therefore, this study aims at evaluating the water footprint of rice production in an irrigation scheme in the dry zone of Sri Lanka, the Walawe irrigation scheme. Due to the unreliability of the rainfall in the study area paddy cultivation depends entirely on irrigation, thus, the WFblue, in other terms the volume of water evaporated from the irrigation water supply is considered as the total WF (WFtot) in this study. Actual crop evapotranspiration (equivalent to ETblue) was estimated based on the Penman-Monteith (P-M) model integrating effective rainfall, and crop coefficient published in Sri Lankan Irrigation Design Guidelines. The study spanned for three irrigation years from 2018–2021. Actual irrigation water issued to the field was estimated based on the data recorded by the government body responsible for irrigation water management of the area—Mahaweli Authority of Sri Lanka. The total volume of percolated water was computed employing the water balance method while assuming runoff is negligible. Results show that the average annual WFblue found to be 2.27 m3/kg, which is higher than global and national WFtot. As the crop yield in the study area (6.5 ton/ha) is also higher than the global (4.49 ton/ha) and national (3.5 ton/ha) yields, a conclusion was drawn that the irrigation water usage (CWUTblue) in the area may be significantly higher. It was then noted the higher CWUTblue was due to relatively higher evapotranspiration in the area. Thus, it is vital to reduce excess water usage by shifting irrigation practices from flooded irrigation to the System of Rice Intensification (SRI). Full article
(This article belongs to the Topic Hydrology and Water Resources in Agriculture and Ecology)
Show Figures

Figure 1

21 pages, 4733 KiB  
Article
Hydro-Climate Variability and Trend Analysis in the Jemma Sub-Basin, Upper Blue Nile River, Ethiopia
by Kidist Hilemicael Gonfa, Tena Alamirew and Assefa M Melesse
Hydrology 2022, 9(12), 209; https://doi.org/10.3390/hydrology9120209 - 24 Nov 2022
Cited by 4 | Viewed by 2008
Abstract
Understanding hydro-climate variability in areas where communities are strongly dependent on subsistence natural resource-based economies at finer spatial resolution can have substantial benefits for effective agricultural water management. This study investigated the hydro-climate variability and trend of the Jemma sub-basin, in the Upper [...] Read more.
Understanding hydro-climate variability in areas where communities are strongly dependent on subsistence natural resource-based economies at finer spatial resolution can have substantial benefits for effective agricultural water management. This study investigated the hydro-climate variability and trend of the Jemma sub-basin, in the Upper Blue Nile (Abbay) basin, using Mann–Kendall test, Sen’s slope estimator, and Standardized Precipitation Index (SPI). Climate data from 11 weather stations inside the basin and two major streams were used for the statistical analysis. The climate data were also correlated with the ENSO phenomenon to explain drivers of the variability. The results show that the sub-basin has been experiencing normal to moderate variability in the annual and Kiremt season rainfalls, but high variability and declining trend for 73% of the minor (Belg) season rainfall, negatively affecting the planting of short-cycle crops that account for about 20% of crop production in the study area. Generally, strong El Nińo (SST anomaly >1) has been correlated to a substantial decline in the Belg season rainfall. Stream-flow variability has also been found to be very high (CV > 30%) in both river flow monitoring stations. Subsequently, ensuring agricultural water security for short-cycle crop production seems to be a risky and daunting task unless supplemented with groundwater conjunctive use or water harvesting. Full article
(This article belongs to the Special Issue Stochastic and Deterministic Modelling of Hydrologic Variables)
Show Figures

Figure 1

22 pages, 3111 KiB  
Article
Soil Erosion, Sediment Yield, and Runoff Modeling of the Megech Watershed Using the GeoWEPP Model
by Mulugeta Admas, Assefa M. Melesse, Brook Abate and Getachew Tegegne
Hydrology 2022, 9(12), 208; https://doi.org/10.3390/hydrology9120208 - 22 Nov 2022
Cited by 3 | Viewed by 1929
Abstract
Modeling soil erosion, sediment yield, and runoff are crucial for managing reservoir capacity, water quality, and watershed soil productivity. However, the monitoring and modeling of soil erosion and sedimentation rates in developing countries such as Ethiopia is not well practiced; thus, the reservoir [...] Read more.
Modeling soil erosion, sediment yield, and runoff are crucial for managing reservoir capacity, water quality, and watershed soil productivity. However, the monitoring and modeling of soil erosion and sedimentation rates in developing countries such as Ethiopia is not well practiced; thus, the reservoir capacity is diminishing at faster rates. In this study, the soil erosion, sediment yield, and runoff in the Megech watershed, Upper Blue Nile Basin, Ethiopia were modeled using the physically-based geospatial interface, the Water Erosion Prediction Project (GeoWEPP). The GoWEPP model was calibrated and validated at the Angereb sub-watershed and simulated to representative sites to capture the spatiotemporal variability of soil erosion and sediment yield of the Megech watershed. The model parameter sensitivity analysis showed that the hydraulic conductivity (Ke) for all soil types was found to be the dominant parameter for runoff simulation, while rill erodibility (Kr), hydraulic conductivity (Ke), critical shear stress (τc), and inter rill erodibility (Ki) were found to be sensitive for sediment yield and soil loss simulation. The model calibration (2000–2002) and validation (2003–2004) results showed the capability of the GeoWEPP model; with R2 and NSE values, respectively, of 0.94 and 0.94 for calibration; and 0.75 and 0.65 for validation. In general, the results show that the sediment yield in the study watershed varied between 10.3 t/ha/year to 54.8 t/ha/year, with a weighted mean value of 28.57 t/ha/year. The GeoWEPP model resulted in higher sediment value over that of the design sediment yield in the study basin, suggesting the implementation of the best watershed management practices to reduce the rates of watershed sediment yield. Moreover, the mean soil loss rate for the Angerb sub-watershed was found to be 32.69 t/ha/year. Full article
(This article belongs to the Section Soil and Hydrology)
Show Figures

Figure 1

16 pages, 1827 KiB  
Article
Hydropolitical System Archetypes: Feedback Structures, Physical Environments, Unintended Behaviors, and a Diagnostic Checklist
by Mohammadreza Shahbazbegian and Roohollah Noori
Hydrology 2022, 9(12), 207; https://doi.org/10.3390/hydrology9120207 - 22 Nov 2022
Cited by 5 | Viewed by 2752
Abstract
Hydropolitics is defined as the systematic study of conflict and cooperation in transboundary water basins, affecting around 40% of the world’s population. There has been great advancement in studies endeavoring to explore linkages between hydropolitical drivers and hydropolitical situations in transboundary basins. To [...] Read more.
Hydropolitics is defined as the systematic study of conflict and cooperation in transboundary water basins, affecting around 40% of the world’s population. There has been great advancement in studies endeavoring to explore linkages between hydropolitical drivers and hydropolitical situations in transboundary basins. To add to this, we posit that hydropolitics would benefit from a system thinking approach that has remained less addressed in the literature. For this purpose, considering a transboundary basin as a system, this study is built on the main principle of system dynamics, which implies that a system’s structure determines its behavior. Incorporating system archetypes into hydropolitics can provide a framework for assessing hydropolitical behavior according to the potential structure of archetypes. In this paper, we discuss five hydropolitical system archetypes and their feedback loop structures, the required physical environments, and potential unintended behavior over time. Finally, an example of a diagnostic checklist is presented that will help riparian states recognize patterns of behavior they may face in the future. This paper lays the groundwork for gaining insight into using system archetypes in projecting plausible hydropolitical behaviors and understanding past behaviors in transboundary basins. Full article
(This article belongs to the Collection Feature Papers of Hydrology)
Show Figures

Figure 1

Previous Issue
Next Issue
Back to TopTop