Technical Note

Establishing and Operating (Pilot Phase) a Telemetric Streamflow Monitoring Network in Greece

1
Institute for Environmental Research & Sustainable Development, National Observatory of Athens, I. Metaxa & Vas. Pavlou, P. Penteli, 15236 Athens, Greece
2
Independent Researcher, 24150 Kalamata, Greece
3
Independent Researcher, 18345 Athens, Greece
*
Author to whom correspondence should be addressed.
Hydrology 2023, 10(1), 19; https://doi.org/10.3390/hydrology10010019
Submission received: 8 November 2022 / Revised: 3 January 2023 / Accepted: 3 January 2023 / Published: 10 January 2023
(This article belongs to the Special Issue Advances in River Monitoring)

Abstract

:
This paper describes HYDRONET, a telemetry-based prototype of a streamflow monitoring network in the Greek territory, where such data are sparse. HYDRONET provides free and near-real-time online access to data. Instead of commercially available stations, in-house-designed and -built telemetric stations were installed, which reduced the equipment cost by approximately 50%. The labour of hydrometric campaigns was reduced by applying a new maximum-entropy method to estimate the discharge from surface velocity observations. Here, we describe these novelty elements succinctly. The potential of HYDRONET to provide civil protection services is exemplified by a flood warning demonstrator for Kalamata’s City Centre. The network’s operation, including the hydraulic criteria for monitoring site selection, the characteristics of the telemetric equipment, the operational monitoring and hydrometric procedures, and the specifics of data transmission, quality control, and storage are described in detail, along with experiences with problems encountered during this pilot phase.

1. Introduction

Streamflow data are essential in planning for the use and in managing (decision-making) of surface water resources, as well as for hydraulic design, hydrological services, and in research. To serve these purposes well, these data must be not only properly collected and managed but also freely accessible (cf. Resolution 25, WMO Cg-XIII, 1999). Progress in data science (databases-DB, geographical information systems-GIS, and web services) and in observational technologies, i.e., remote e-monitoring via advanced telecommunications, enable data systems to respond to the needs for effective data sharing and adaptable service delivery [1]. However, various adversities compromise the achievement of these socially important goals. The main adversity is the lack of adequate funds for operating and maintaining the monitoring networks and their electronic instrumentation, with remote sensing and telecom capabilities, which require resources and trained staff [2]. To partly counter the high cost of modern monitoring hardware, hydrologists, especially those in research settings, have turned to developing their own devices using off-the-shelf/out-of-the-box components [3,4], e.g., taking advantage, among other developments, of open-source controllers such as Arduino [5], particularly for laboratory applications.
Monitoring is critical for understanding the links of water resources to climate and uncertain future projections. A historical digression gives a useful perspective for the Greek situation. Since the 1950s, streamflow has been monitored by the Public Power Corporation, which has been gauging large rivers in mountainous areas for prospective sites of hydroelectric power plants, and by the Ministries of Public Works and of Agriculture, as a part of their water resources development, flood protection, and land reclamation activities. The responsibilities and competences for Greece’s water resources were generally fragmented, being dispersed among ministries and their agencies; public access to the data did not exist. This uncoordinated monitoring approach continues even today, with the several operating telemetric networks collecting streamflow information at the regional or local scale independently from each other and each applying its own procedures.
This work presents the pilot streamflow monitoring network HYDRONET (https://hydronet.noa.gr, accessed on 3 September 2022), established and operated by the Hydrology Group (HYDRO Group) at the Institute for Environmental Research and Sustainable Development (IERSD) of the National Observatory of Athens (NOA) and embedded in the project Hydro-Telemetric Network of Surface Waters: Gauging instruments, smart technologies, installation and operation (HydroNet, 2018–2021). HydroNet is a part of the Research Infrastructure of Greece HIMIOFoTS: Hellenic Integrated Marine-Inland waters Observing Forecasting and offshore Technology System that is included in the relevant National and European Road Maps (https://www.esfri.eu/national-roadmaps, accessed on 3 September 2022). Open Hydrosystem Information Network (OpenHi.net) is the inland-waters component of HIMIOFoTS that encompasses the HydroΝet project. OpenHi.net is mainly a soft infrastructure, as described in Mamassis et al. 2021 [6], where HYDRONET is only outlined. Here, we describe HYDRONET in detail.
HydroNet provides a comprehensive framework for the collection, transmission, handling, and use of surface water data that combines technological innovations and advanced scientific methods with efficient use of resources; free, near-real-time, online data access is an essential characteristic of HydroNet. It particularly aims to address the need for estimating, by inexpensive means, the discharge at cross-sections of streams where no prior data exist. An aspiration of HYDRONET is that its principles of design, installation, and operation may be adopted as a guide to establishing hydrometric networks in the Hellenic territory.
Our instrumentation is designed for field work in a network; its added value is its lower cost. The scientific added value is a sound and robust method for estimating the discharge from observed surface velocities. The paper presents: in Section 2, HYDRONET’s stations in the Attica region (mainly in and around Athens) and in the Peloponnese, the hydrometric stations’ siting criteria, characteristics, and monitoring procedures, the data storage and quality control, the problems experienced during the network’s operation and innovative hydrometric methods; in Section 3, the in-house-developed hydro-telemetric station and flood warning demonstrator; and the account closes with Section 4, Discussion, Conclusions, and Outlook.

2. Materials and Methods

2.1. Description of HYDRONET

The HYDRO Group at IERSD/NOA has participated in two projects in which new hydro-telemetric systems were installed and operated: (a) as coordinator in TELEFLEUR (1998–2001), Telematics-assisted Handling of Flood Emergencies In Urban Areas, with the Kifissos River basin in Athens/Attica as a demonstrator [7,8], in which the emphasis was on increasing the flood warning time by entering the forecasted rain as input to the hydro-model, and (b) as a partner in DEUCALION (2014–2018), Assessment of flood flows in Greece under conditions of hydroclimatic variability: Development of physically-established conceptual-probabilistic framework and computational tools, in which four stream/river catchments, in Attica and Attica-Boeotia and in Arcadia and Messinia in the Peloponnese, were monitored [9]. HYDRONET is based largely on the experience gained in those projects; furthermore, some HYDRONET stations are sited in cross-sections also monitored in DEUCALION, enriching the DB of observations.
In its current, pilot phase, HYDRONET operates 16 stations, aspiring to establish time series of high-quality streamflow data, at present mainly for risk assessment of hydrological extremes but, in the long-term, for water resources management as well. Observations are transmitted in real-time to a server at NOA, where they are processed automatically (format harmonisation), quality-controlled, and stored; access to the DB is free via https://hydronet.noa.gr/en/data/, accessed on 3 September 2022. Due to the system’s ability to access observations in real-time, flood warning is a prime service prospect. Six of HYDRONET’s stations have been designed and constructed by NOA and ten are commercial (consisting of commercially available parts: A/D logger, communication modem, and sensor); six stations are located in Attica/Attica-Boeotia and ten in the Peloponnese, seven in the western, and three in the eastern water districts, see Figure 1 and Table 1.
The selection of stream basins to be monitored was guided by the local socio-economic, land-use, and environmental characteristics, with emphasis on the safety of the population in flood prone areas. Population density and economic activities (industry/tourism/transport) were important for the selection of the Kifissos basin (Athens) and the Sarantapotamos basin in Western Attica-Boeotia. Similar reasons guided the selection of the river basins of Nedon (traverses the city of Kalamata), Pamissos (just west of Kalamata, near its airport), and, to a lesser degree, Selas (tourism and agriculture), all in Messinia (Southwestern Peloponnese). Significant floods and flash floods have occurred in Attica, especially in the Kifissos river basin [7,8], in the Sarantapotamos basin, as well as in its neighbouring watershed (15 November 2017, town of Mandra, 25 deaths), while Kalamata’s City Centre is susceptible to flooding (6–7 September 2016, near-overflow of Nedon, overflow of smaller streams in the surrounding areas, municipality of Kalamata, 2 deaths). Agriculture is important in the river basin of Evrotas, Laconia (Southeastern Peloponnese) as well as around the upstream reaches of Nedon, Selas, and Pamissos rivers in Messinia. River Loussios flows through the mountainous Arcadia in Central Peloponnese and is a tributary of the Alpheios River (Western Peloponnese water district); it was chosen due to its excellent ecological status, which, in addition to the cultural–historical importance of the area, offers opportunities for alternative, environment-based tourism, including hiking, and canoe–kayak–rafting activities. Figure 2 shows in greater detail the basins with the locations of the monitoring stations of HYDRONET. The climatological conditions, particularly in areas in which HYDRONET stations operate, are summarised in the Appendix A.
From a techno–economical point of view, proximity (PR) to NOA ensures reduced on-site access time and costs and efficient field campaigns (FC) and station maintenance (SM) (see Table 1), thus contributing to HYDRONET’s viability. For example, the stations in southern Peloponnese can be visited for maintenance in a two-day visit from Kalamata, while Loussios (Station 9) lies on the way (with a small deviation) from Athens to Messinia. Another criterion is the hydro-team’s prior involvement (PI) in the prospective areas that secures familiarity with the local settings and people; e.g., Alagonia, Station 12, is on private property, while Selas (Station 16) and Sarantapotamos (Station 7) are hosted, respectively, on the guarded grounds of Costa Navarino hotel and of a recycling industry (electric power, secured). Enlarging our existing DB (DB) is also significant.

2.2. Station Siting, Equipment and Operations, Data Handling, and Malfunctions

Here, we describe the hydraulic criteria for the selection of the monitoring site, the characteristics of the telemetric equipment, the operational monitoring and hydrometric procedures, and the specifics of data transmission, quality control, and storage.

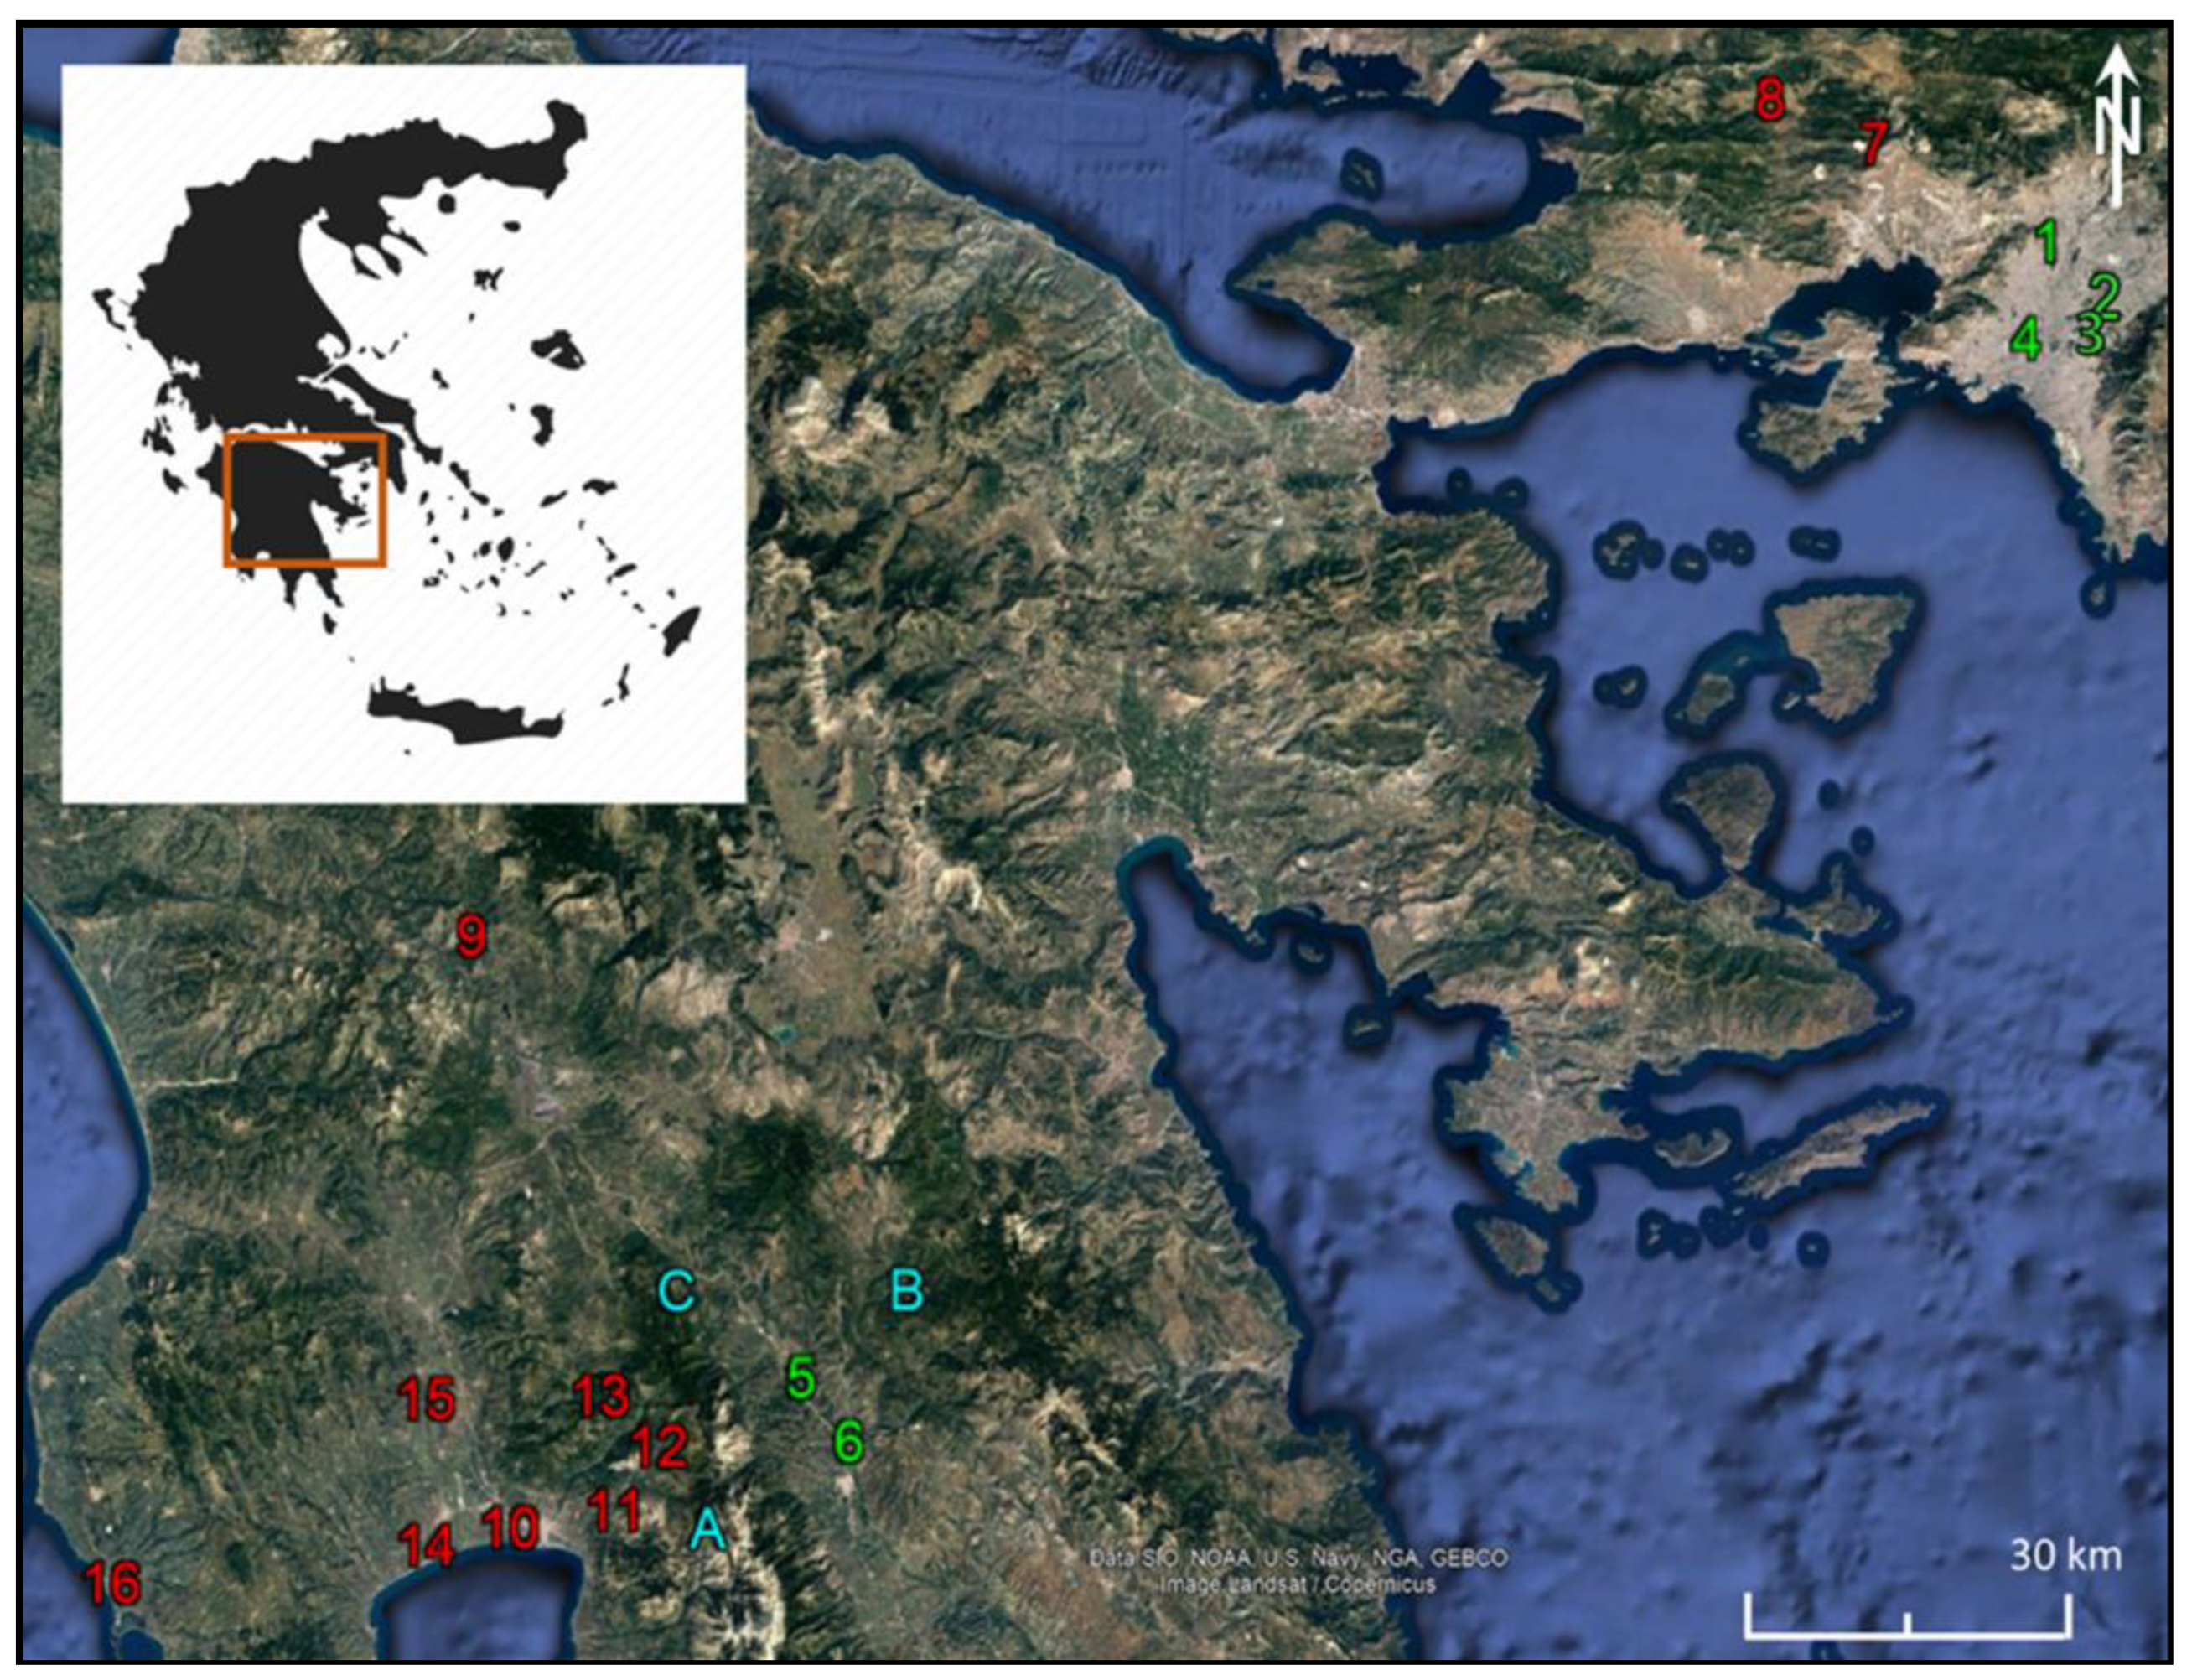
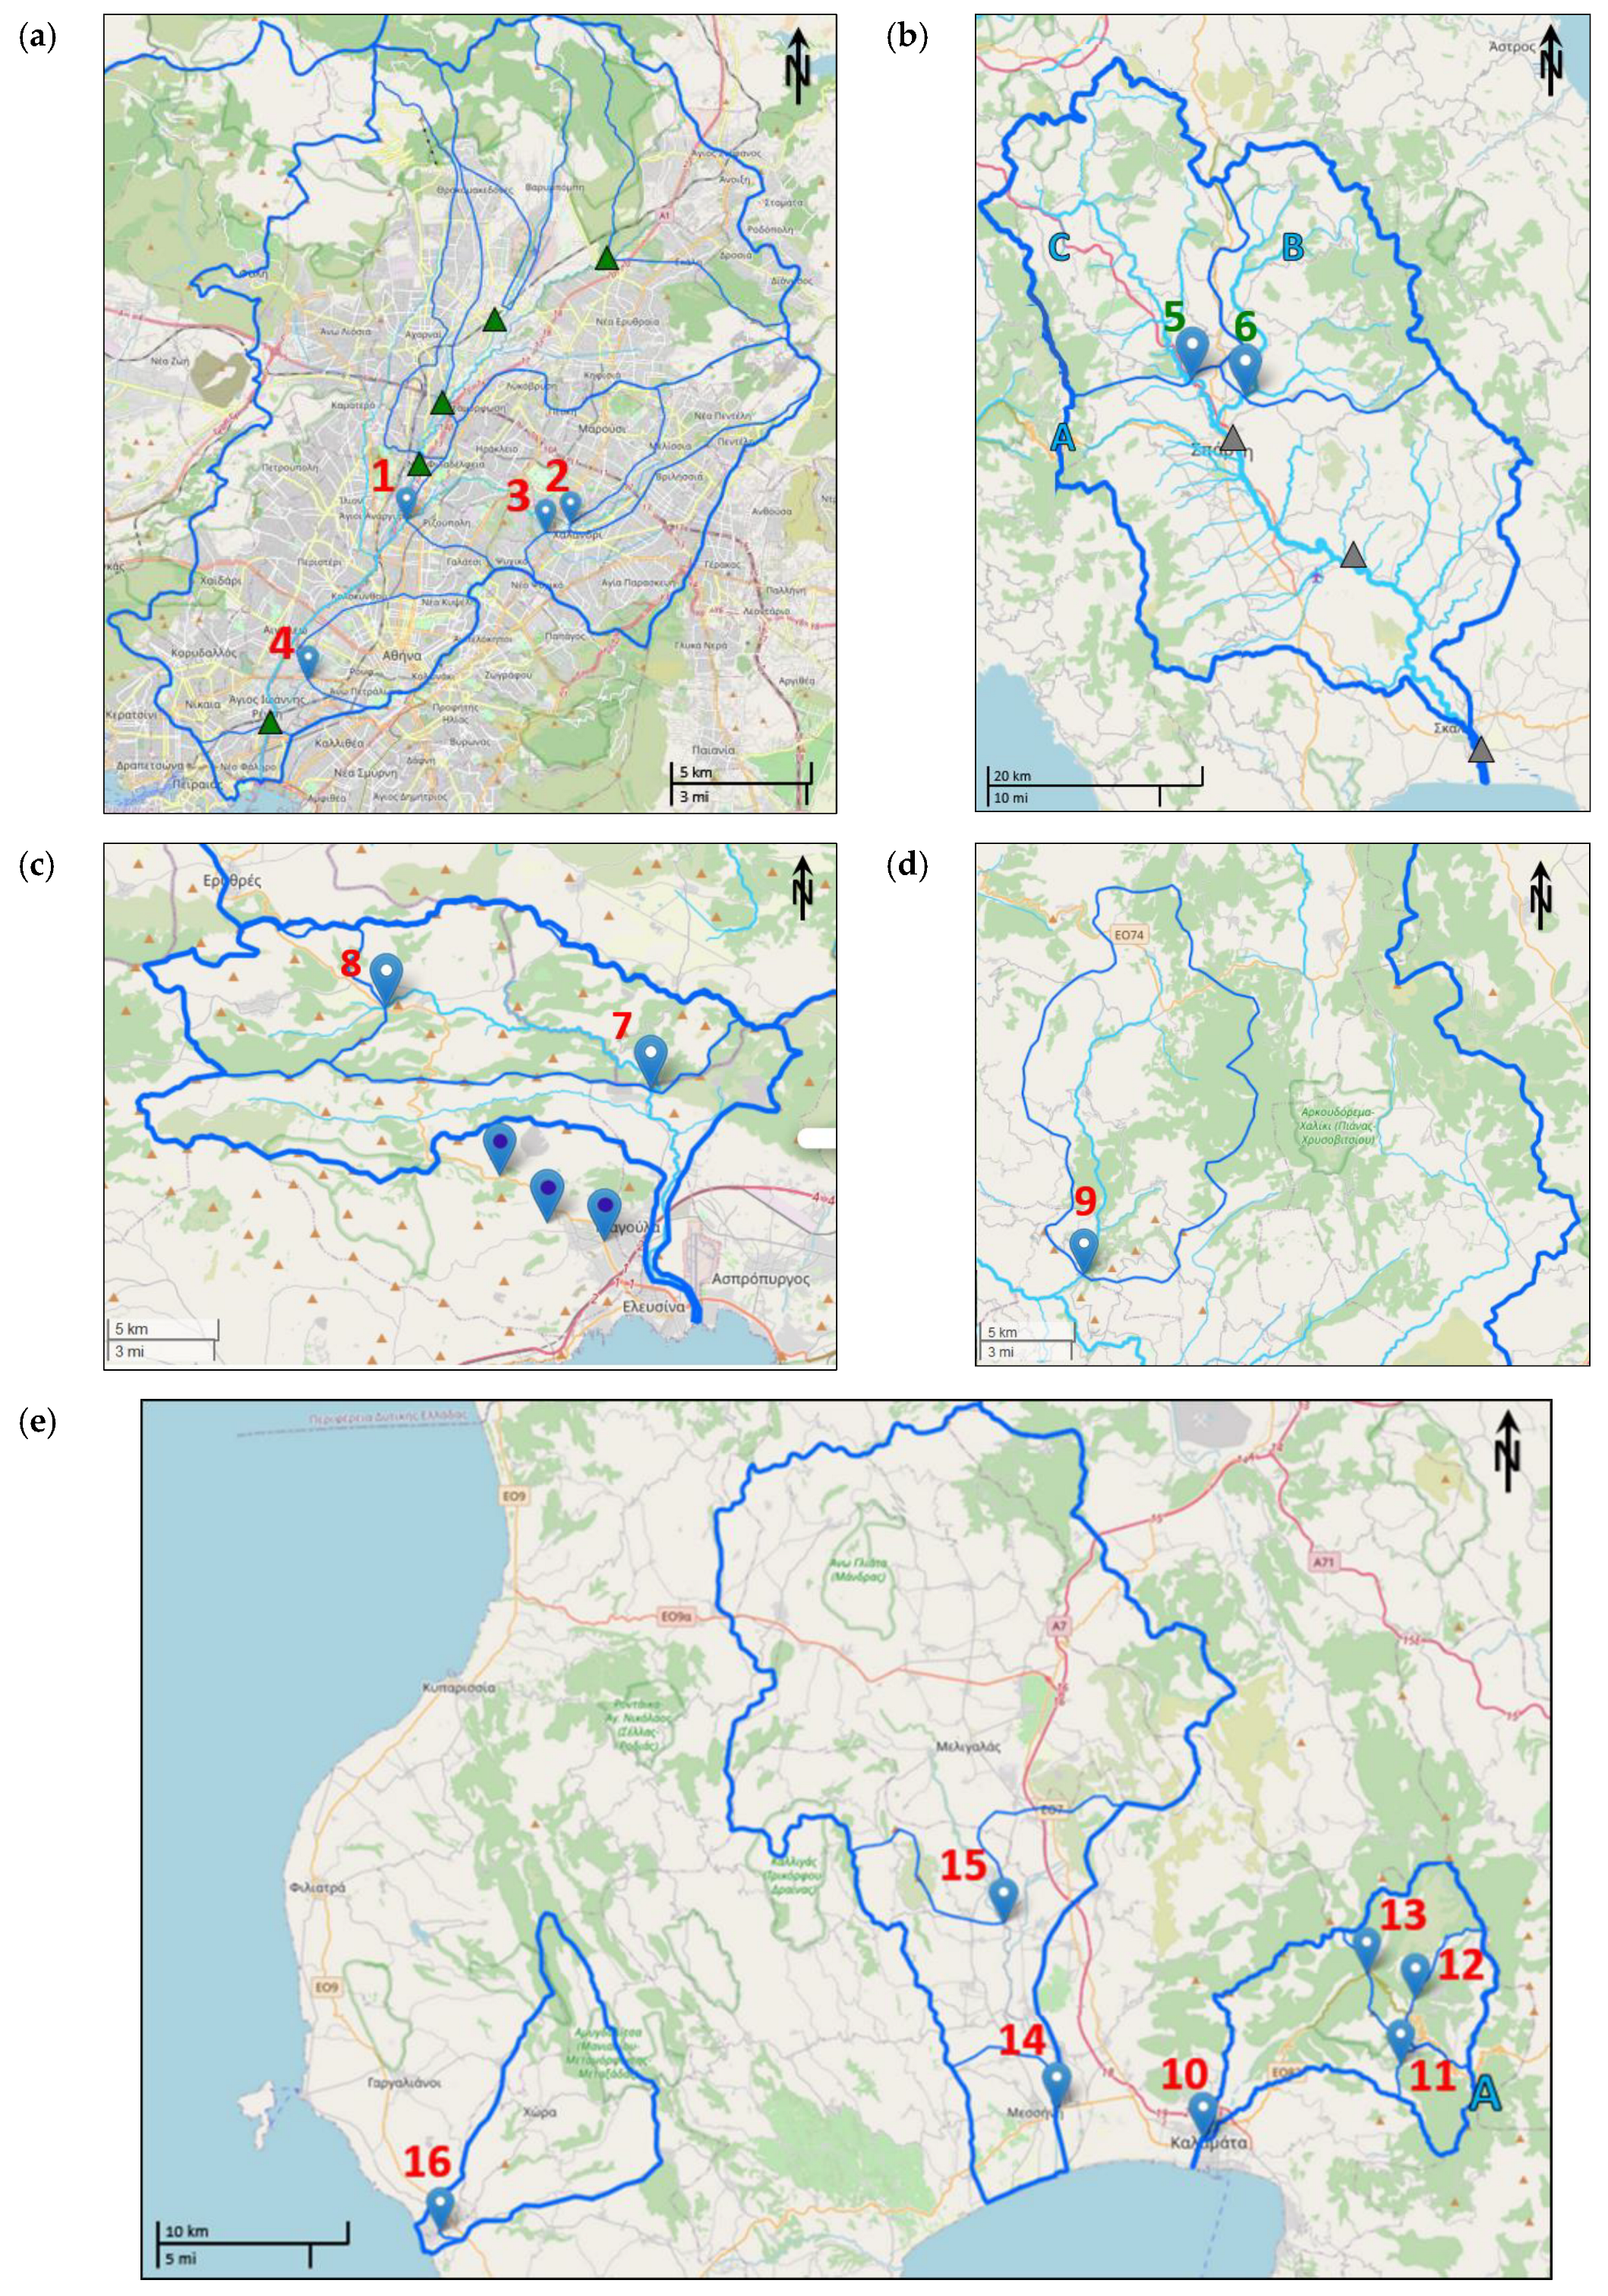
2.2.1. Siting and Installation of Stations

Hydraulic suitability criteria were applied for the siting of monitoring stations in the selected basins. The cross-sections, natural or constructed, had to be well-formed, stable, and relatively narrow—ideally at bridges—and easily accessible for observations during field campaigns. Only four monitoring stations have natural cross-sections: at the rivers Evrotas, Loussios, and Selas and at the Alagonia stream; in all other cases, the cross-sections are made of concrete or lined with stone masonry. In a typical installation, the sensing equipment is mounted either on the face of a bridge or on a metallic arm affixed to a channel sidewall under the bridge. In the absence of a bridge, the sensor is mounted on a Γ-shaped metal construction fixed on the bank overlooking the stream, while the remainder of the equipment is safeguarded against flood damage, see Figure 3. Generally, for protection against vandalism, care is taken to install the equipment in places that are out of sight or difficult to access.

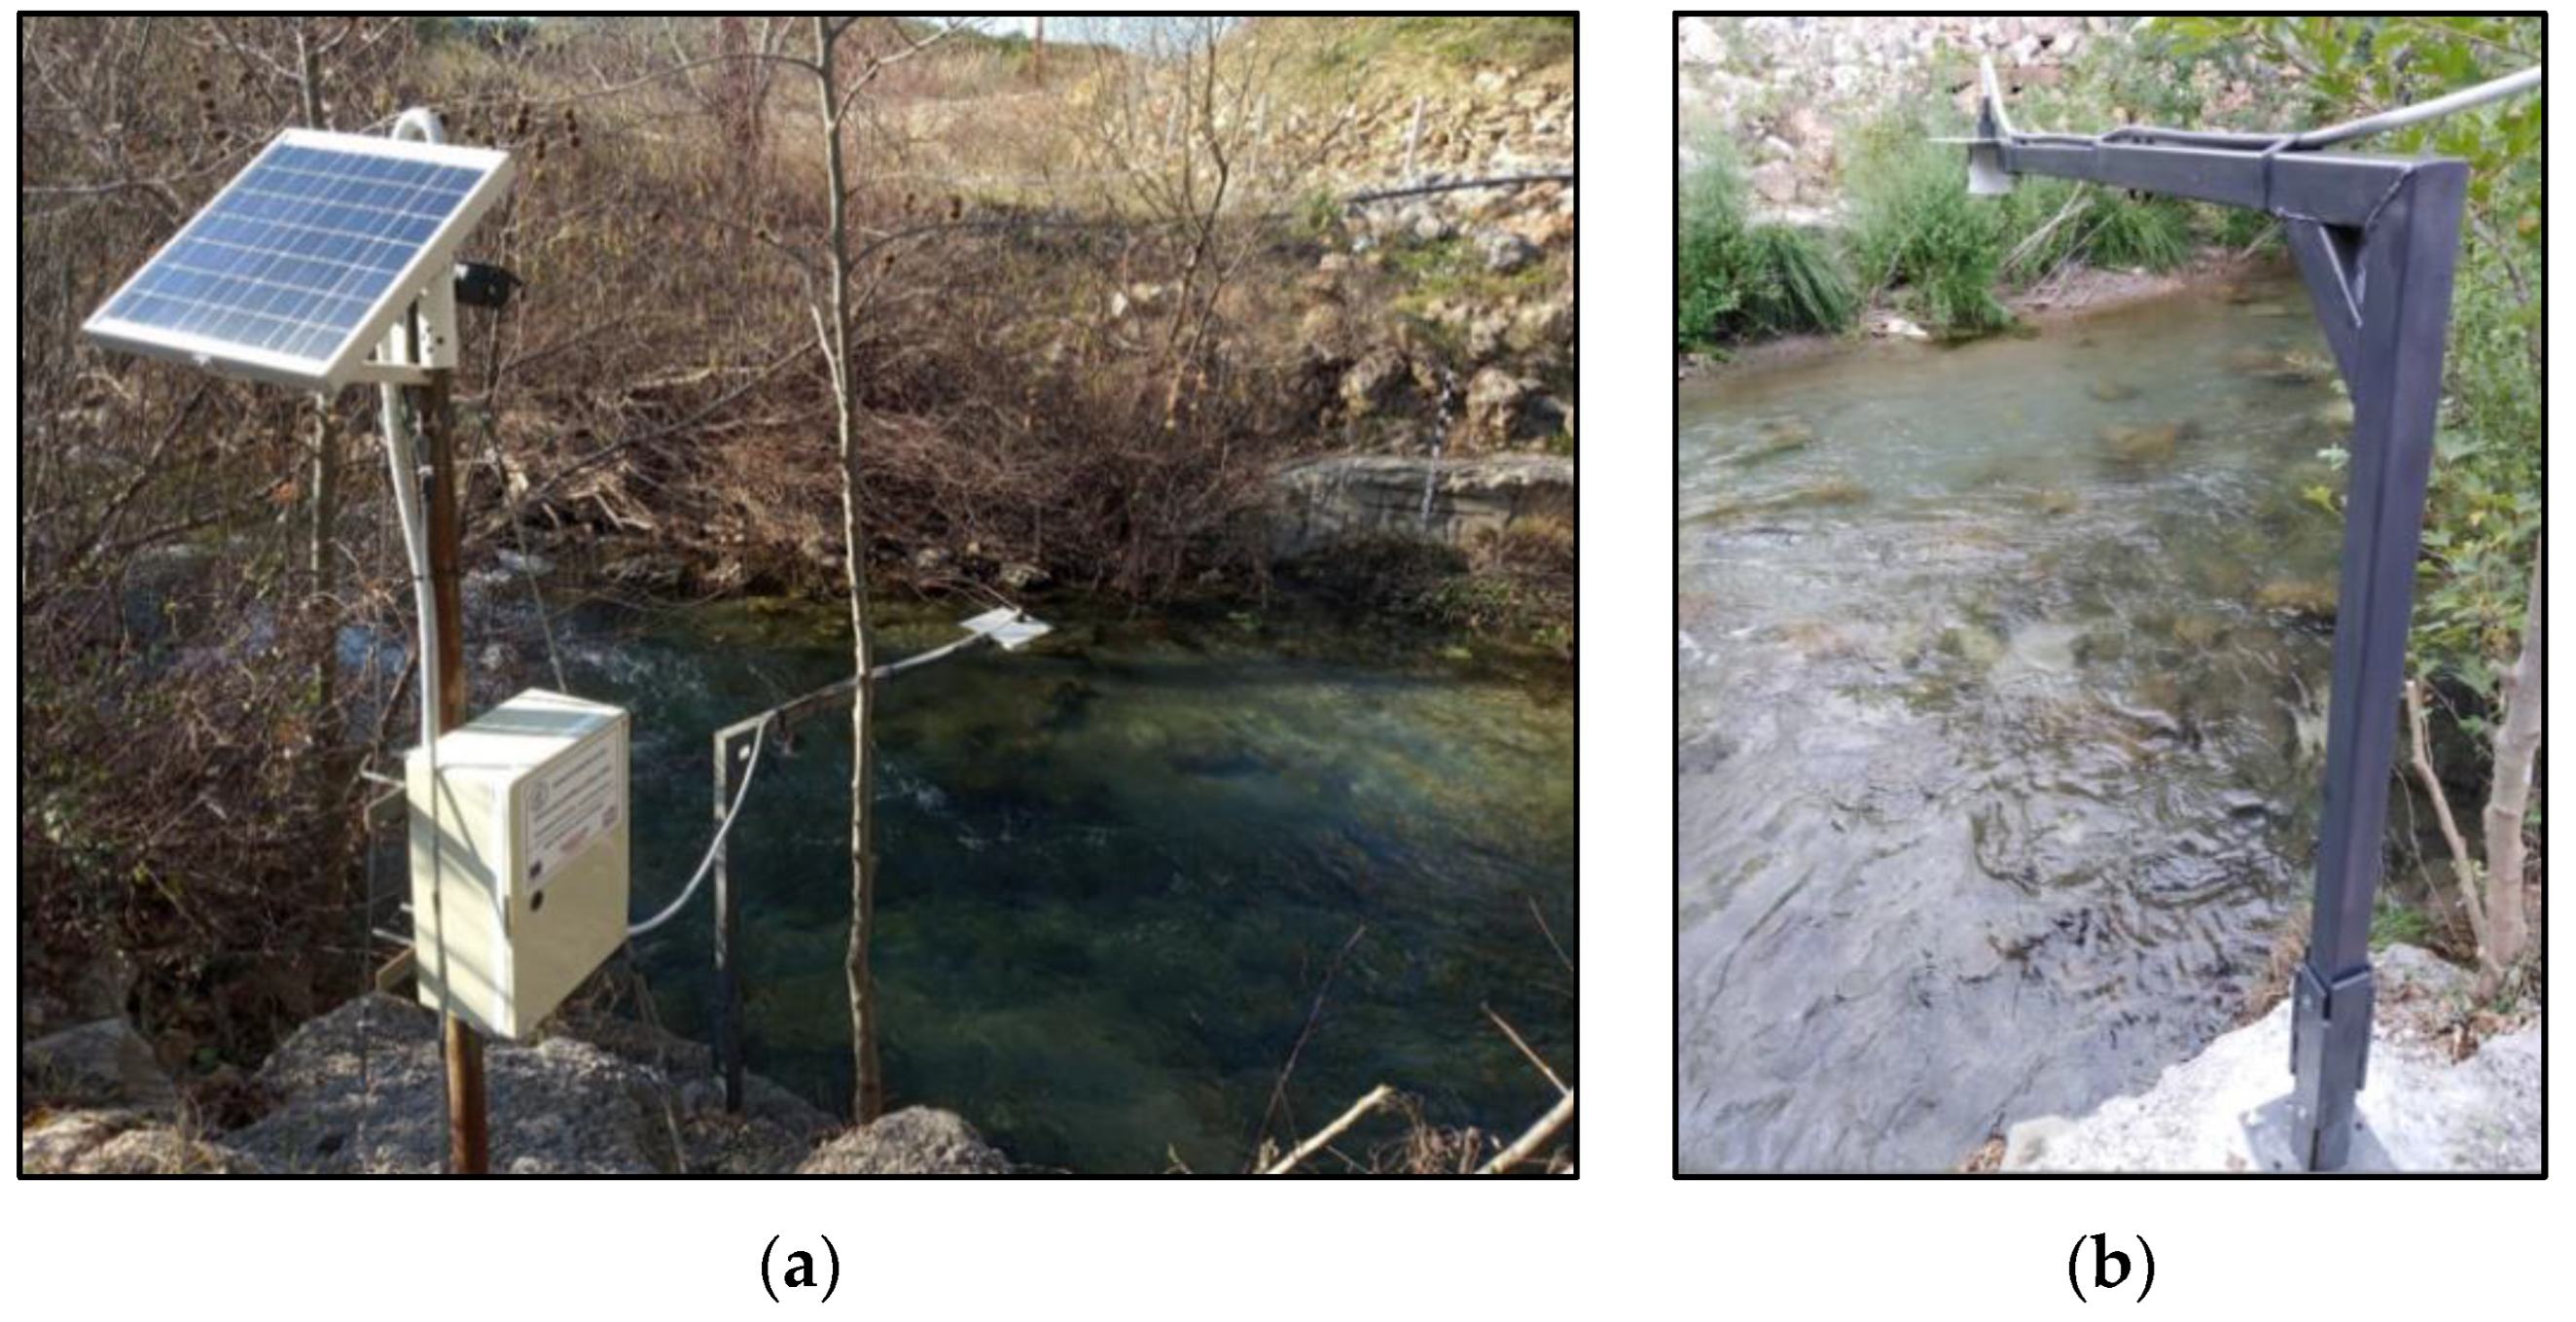
2.2.2. Monitoring Equipment and Technical Operations

The commercial stations (telemetric, CTM, and piezometric, PM, Table 1) are timed to the local standard time (LST) of Greece (winter time of Greece, LST = UTC + 2 h), fixed throughout the year and employing a common format when logging the data. The in-house-built stations HTM (described in detail in Section 3.1) take their timing directly from the internet and are timed in UTC time. Table 2 lists the monitoring sensors, along with the logging and telecommunications units. The CTM stations are equipped with a data logger, a modem, an ultrasonic water level sensor (infers the distance to the water surface from the travel time of a pulse emitted by the sensor and reflected to it by the water surface), air thermometer, and, in some stations, rain gauge. Campbell Scientific SR50A and SR50AT sensors are used in CTM stations; SR50AT has an internal sensor for measuring the air temperature, while stations with SR50A have an external air temperature sensor (e.g., thermistor YSI) mounted inside a radiation shield assembly (consisting of five white aluminium discs or of a perforated plastic pipe and a screen placed in the northern side of the base of the ultrasonic sensor). The air temperature is needed to correct water level observations made with ultrasonic sensors for temperature-induced variations of the speed of sound. These stations can be programmed to accommodate a rain gauge as well as other instruments measuring, e.g., solar radiation, wind speed and direction, etc. The stations are powered by a battery that is charged either by a photovoltaic panel or by main power supply to ensure continuous monitoring and telecommunications without supervision. To avoid telecommunication problems, a scheduled restart of the modem is performed twice per day through the data logger.
Problems can arise when the internet connection is interrupted (we have not experienced speed problems). If such interruptions were to occur, HTM stations do not record data because they receive time from the internet; fortunately, no such events have yet occurred. Data storage on the integrated circuit board during internet interruption is planned for a new version of the station. The data of the commercial stations are stored and sent upon internet restoration.
The piezometric sensors (PM) are placed inside a protective apparatus (e.g., a perforated pipe) fixed in the stream in order not to be affected by mud or endangered by floating debris. Their programming and data collection are possible only on-site (at the station), as they lack telecommunication capabilities. Atmospheric pressure data, required to correct the stages recorded by the piezometers in the rivers Pamissos and Loussios, are obtained freely from the network of meteorological stations (Vantage class, Davis Instr.) of I. Karamitsos, http://www.weather-messinia.gr/weather/, accessed on 3 September 2022.
We note that reducing equipment costs was our prime motivation while also meeting the required quality criteria. The dBI6 Pulsar sensor used in our station has better specifications than the Campbell station’s SR50AT and costs less (2019 prices): dBI6 €862, SR50AT €1490. Both systems were installed at the Dance Hall monitoring station of Nedon River in Kalamata and compared for 3 months: results were absolutely comparable. Campbell’s CR300 data-logger costs €970; our system transmits the measured data directly to the server at NOA. The GPRS modem of the Campbell station costs €279; in our system, a modem and a thermistor are on the integrated circuit (IC) board. For the Campbell station: solar panel €124, battery €19, and box €186. The total cost of the Campbell system is €3068. The total cost of the in-house-built system is €1480; it includes dBI6 Pulsar, IC board and labour, solar panel, battery, and box; the camera is extra at €160.

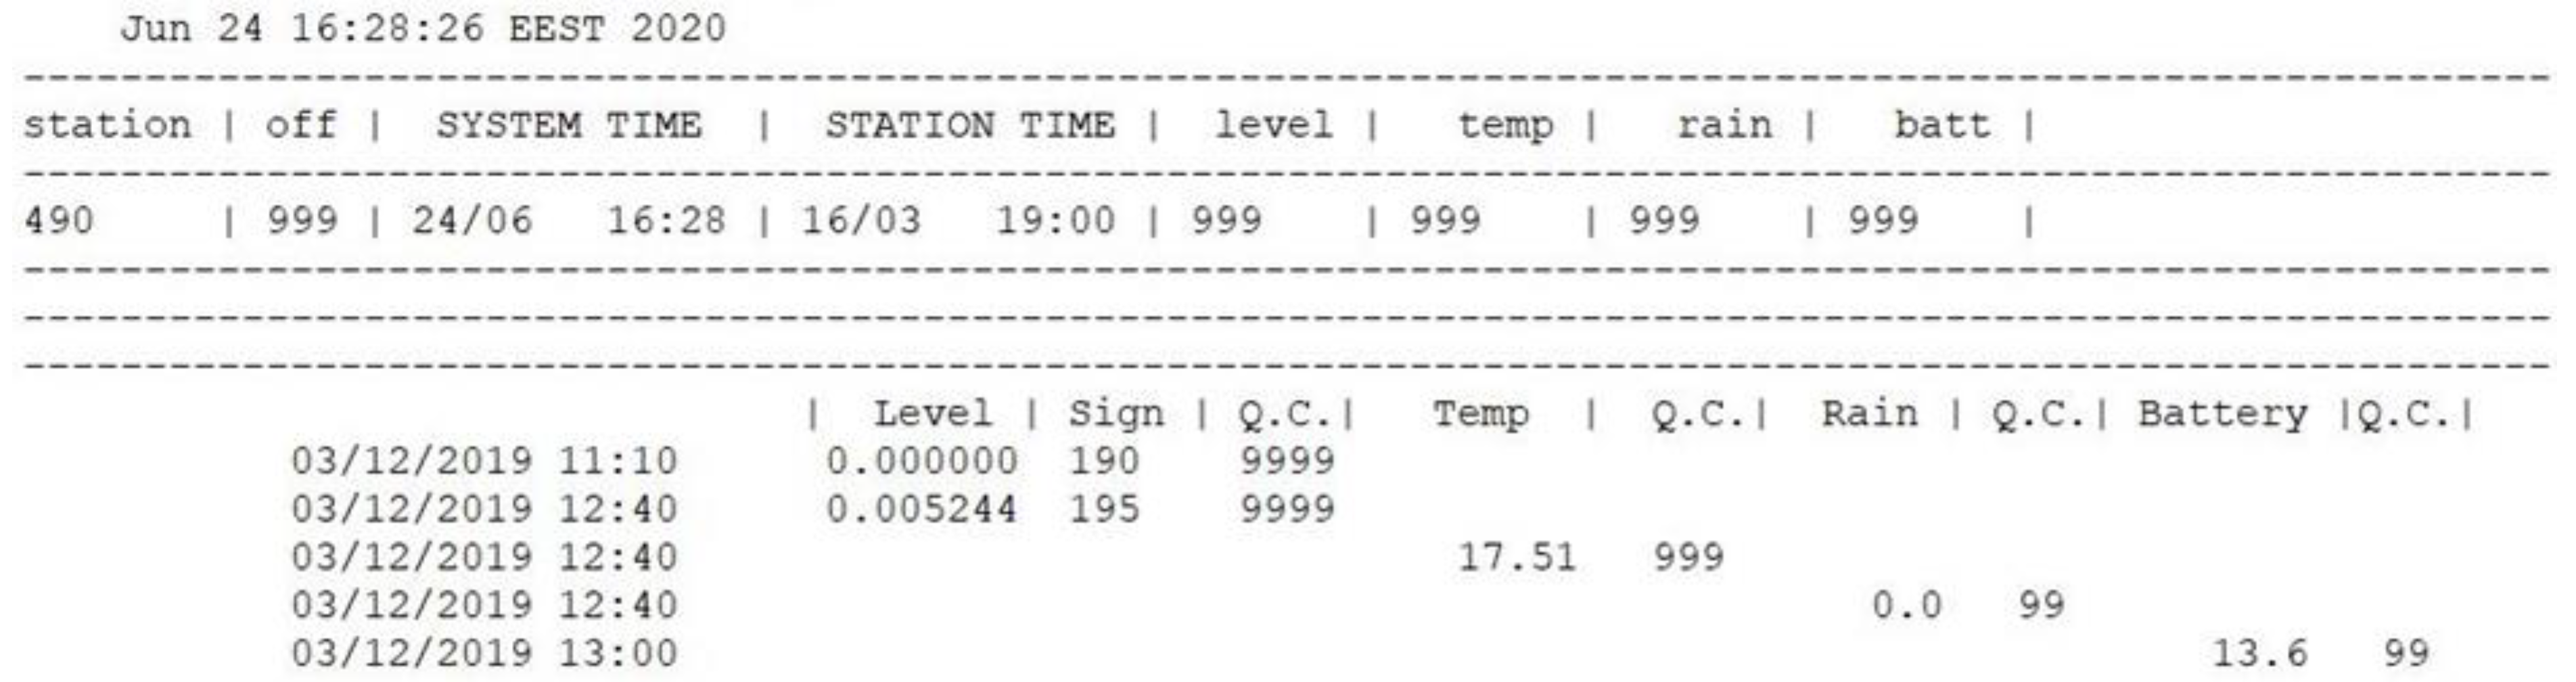
2.3. Data Storage and Quality Control

All measurements are recorded every 10 min; the telemetric stations send their data every 10 min to the HYDRONET server for automatic processing and storage. These raw data are treated for missing and/or duplicate records, quality checked, flagged, and subsequently placed in the DB of HYDRONET. Because the ultrasonic sensors measure stage by a remote sensing technique, they may be influenced by various interferences leading to faulty measurements. Telecommunication may also cause errors, as the stations may be located in remote areas with poor cellular network coverage. The operational status of all stations is checked automatically twice a day and reported to the network supervisors, via e-mail sent by the HYDRONET server. The actual observations are validated through the scheduled hydrometric campaigns, measuring water stage and using current meters, when flow conditions permit, and via optical methods (and Acoustic Doppler Current Profiler (ADCP), where feasible). In addition, remotely sensed stages are compared to optically observed “surveyors staff” readings.

2.3.1. Data Handling: Pre-Processing, Format Homogenisation, and Gap-Filling

Different measuring devices/data loggers save the data in files using different types of encoding and file formats. Therefore, the first processing of raw data concerns their decoding, i.e., the conversion of files from the encoded format of data loggers to a format that can be read by any software. In particular, data from the Hobo data loggers (piezometric and rainfall) as well as data from the Weatherlink software of Davis meteorological stations are encrypted and must be converted to a widely readable format (e.g., .txt or .csv file), using the relevant software of each company. At this point, it should be noted that the data from the CTM and the HTM stations are already in .txt format. During pre-processing, the data files are also homogenised. In order to consolidate data from the new stations together with the pre-existing ones and create a single database that would allow us to use a single input format for the quality control procedure, executable codes in Formula Translation version 1990 (FORTRAN 90) programing language were created that convert all data files to a common format, namely TOA5. Figure 4 (left) shows the flow chart of the procedures for data handling.
The final, homogenised output file has six parameters: (1) water level (m)—instantaneous value taken every 10 min and corrected on the basis of air temperature, (2) water level signal quality—instantaneous value taken every 10 min, (3) air temperature (°C)—instantaneous value every 10 min, (4) rainfall depth (mm)—cumulative over 10 min period, (5) battery voltage (V)—minimum value within 10 min period, and (6) quality of the GPRS communication of the station with the server.
After the data from all stations have acquired the same format, they are processed by using a FORTRAN 90 code to find and fill any records that may be missing. Records may be missing for some time interval (discontinuity of time series) either due to recorder malfunction or due to signal loss during transmission (e.g., power outage or inadequate mobile telephony signal). Discontinuous time series can also occur due to the mode of operation of the sensor/recorder, as, for example, happens with rainfall stations with a Hobo event-logger, where recording takes place only when an event occurs, i.e., rainfall.

2.3.2. Data Quality Control (QC) and Assessment of the Operational Status of the Stations

Incorporating a specially designed code in FORTRAN 90 programming language, the data are checked initially for physical plausibility, according to the sensor specifications and the physical characteristics of the river cross-section (‘range-test’), as shown in Figure 4 (right). Threshold values for performing the QC checks at each station separately are stored in a specific station information file, HYDROstn.INF file, which contains also the station’s code and the distance of the water level sensor to the stream bed. Four checks are performed during the QC procedure: (1) check for value existence; missing values are marked by the logger with “−6999“, (2) value less than some physical or operational limit, (3) value greater than some physical or operational limit, and (4) abrupt changes—comparison with moving averages, 3 h (18 values) for water level and 1 h (6 values) for air temperature.
These windows have been selected considering the characteristics of the monitored basins according to the experience gained in the projects TELEFLEUR and DEUCALION. Nevertheless, it is possible to have data wrongfully flagged as suspicious (“warning”). Therefore, when such a flag is present, the data values have to be checked manually to identify the nature of the flag. For example, two such cases occurred at the Profitis Daniel station on 11 June 2021, and on 30 April 2020, (Figure 5); in Figure 5a, the water stage rose by 1.9 m in 10 min time, and in Figure 5b, it seems that it rose 2.5 m, again in 10 min, but in the first case, it is an actual rainfall–runoff event, while in the second it is a “chance” error, as no precipitation occurred (perhaps a bird flying below the sensor). This is one of the reasons why no modifications are made to the raw data (except for negative stage values that are set to zero and missing values set to −99). Another reason is to allow for the application of a different quality control scheme that may be desired by a potential user. Instead, false measurements of a parameter are quality-flagged, according to the four-digit scheme presented in Figure A2 in the Appendix A, where each test affects a certain digit of the flag; these flags should be considered as inseparable from a datum itself.
To assess the operational status of the stations, a code was created in FORTRAN90 to utilize the QC results in order to easily identify malfunctions and erroneous/suspicious values. The results of the audit are recorded in a separate (output) file that is sent through a scheduled automated dispatch to those in charge of monitoring the operation of the network. The code checks the raw data handling logs to (a) identify offline status and reference the last record of the file and (b) detect operational problems on the basis of the frequency/persistence of errors reported in the QC output files, using as error identification codes the quality indicators of each parameter (flags), as defined in Figure A2. The output file is in .txt format and provides the results of the above operations and checks in two consolidated tables. In the first table, the value 999 is recorded as an alert value in the output file; otherwise (acceptable values of quality indicators) the value 0 (zero) is written. Furthermore, a second table, detailing the records of the parameter for which an unacceptable QC index value was detected, has been added to the original one, so that the reader can derive maximum information about the “problematic” record. A sample of the output file is shown in Figure 6.
Table 3 provides information on the occurrence of problems due to technical reasons as well as due to environmental conditions and vandalism (2 years, 2020–2021, fully operational HYDRONET).
After two years of HYDRONET’s operation, some remarks can be made regarding its functioning:
  • HTM and CTM stations show no differences in durability under normal conditions.
  • Most blanks in the records are due either to flooding, power failure, or human-caused damages, such as thefts of batteries, cables, or PV panels. The problem of flooding of Station 1 was due to the location of the box: during a heavy storm, surface water flowed on top of the box due to the inclination of the terrain, which was not anticipated. In Station 15, the battery has been repeatedly stolen by roaming vandals.
  • Low signal quality is very seldom, indicating the good selection of the stations’ locations regardless of the altitude and the surrounding vegetation.

2.3.3. Field Work and System Maintenance

Hydrometric field campaigns are organised (a) in order to establish rating curves at the monitoring stations and (b) for research in advanced methods to improve hydrometric practice (see Section 2.4., HYDRONET Hydraulics). WMO [10] standards and procedures are generally followed. Velocities are measured with a current meter, a surface velocity radar (SVR) or by image velocimetry. At least three persons participate in each field campaign for increased safety (e.g., securing a wire rope across the stream at the river banks). Velocities are sampled at the standard 20–60–80 percent depths (or only at 20–80, or at 60 percent, depending on the water depth), except for specific cases in which the velocity field is sampled densely with a current meter, and comparative surface velocity measurements are made with SVR and video.
The stations are visited systematically (e.g., once every six months) to inspect the sites for any changes in the cross-sections and for sensors’ maintenance as specified by the manufacturers. If a malfunction occurs, the necessary repair is to be realized within two weeks (provided the essential spare parts/consumables are available). A maintenance/operation report is produced every six months, describing the operational efficiency of each station through suitable quality indicators (e.g., % of working time, % of measurement errors, etc.), any operational problems encountered, and the undertaken maintenance/rectification activities. Most problems encountered concern human-induced damages (theft, vandalism), internet coverage/reset, flood debris drifts, sediment depositions or bed scour, extreme weather conditions, battery failure, or cable damage from animals/thefts, Table 3.

2.4. HYDRONET Hydraulics: Streamflow Estimation from Surface Velocity Measurements

HYDRONET’s rating curves Q(h) had to be developed by inexpensive means and up to flood flows at cross-sections of streams where no flow data existed so that the readily monitored stages h may be converted to flows Q. This called for considering non-traditional methods, improving them, if needed. The common practice of point-sampling velocities with a current meter in a cross-section is tedious and can be dangerous even at non-extreme flows (limit: velocity (m/s) × depth (m) = “1”), becoming prohibitive at high flows. Furthermore, the Acoustic Doppler Current Profiler (ADCP), which measures velocities on the basis of the frequency shift (Doppler effect) of a transmitted signal scattered back to the transceiver from particles in the water [10], is too expensive for installation and routine use in small streams that may be also difficult to access; moreover, while velocities can be also measured with a portable Doppler sensor by wading into the stream, the hydrographer may again be exposed to risks.
In contrast, measuring a stream’s surface velocities, v surf, can be a suitable hydrometric method if velocities at points on the free surface can be related to the depth-averaged velocity V at those points. The viability of that hydrometric alternative rests, therefore, on the ability (a) to sense surface velocities remotely by non-invasive means and (b) to estimate the ratio fv = V/ v surf. The first demand may be met through the use of a hand-held radar (e.g., [11]) or by application of image velocimetry (e.g., [12,13]); for the latter, one may also evaluate citizen-videos [14] (sometimes the only available information on extreme flood events). However, a convenient constant fv-ratio, such as the default value fv = 0.86 [15], is by hydraulic reasoning approximate (ISO 748:2007, 2007, [16]) and may misestimate the discharge markedly. Analysing streamflow data from mostly medium-to-small French rivers (in 90% of cases: Q < 10.2 m3/s, hydraulic radius Rh < 0.63 m, width b < 24.8 m), Hauet [17] found fv-values ranging from ~0.7 to 0.95 (5% to 95% quantiles). Bjerklie et al. [18] evaluated a large set of streamflow records from rivers across the USA (mean values: Q = 483 m3/s, top width B = 94.4 m, depth d = 2.32 m) and found a large variability of the maximum-to-mean velocity ratio (cf. their Figure 2b). There is, thus, interest in improving the accuracy of fv-estimates [19].
To this end, Koussis et al. [20] proposed on the basis of fv = V/ v surf as a function of the momentum distribution coefficient β, an integral flow measure that quantifies the velocity dispersion. In two-dimensional (2D) flow,
β = 1 d d v 2 d y / V 2 = 1 + σ / μ 2 = 1 + C v 2  
where d is the depth, μ = V the mean velocity of the profile, σ its standard deviation, and Cv = σ/μ the coefficient of variation. The variability of fv is explained well by β, which varies mildly in turbulent streamflows, β ≈ 1.03–1.15 [21]. Therefore, fv-values linked to a monitoring site’s geometry and roughness through the dependence fv(β) can facilitate estimating the flow rate; β is larger for rough, irregular, and compact cross-sections and smaller for smooth, regular, and wide cross-sections. Generally, because a variable macro- and micro-geometry (roughness) shape the turbulent flow field, the variability of fv(β) must be analysed hydromechanically (such a study is currently under way). However, the integral nature of β and its small range of variability endow that maximum-entropy method with robustness, as shown in two field cases reported in [20]. Since, in a quasi-2D analysis, a shallow streamflow is represented by velocity profiles sampled at several verticals, the maximum-entropy theory was used to derive a velocity distribution over the depth d, v ME y / d ;  y is the distance from the bed. This distribution (inset, Figure 7), however, behaves near the free surface ‘unphysically’ ( v surf → ∞); it was, therefore, truncated at V + σ, i.e., v surf = V + σ (corresponds approximately to the 84th percentile of the Gaussian CDF). v surf was used to calculate fv vs. β data in the range 1.01 ≤ β ≤ 1.15, that are regressed by fv(β) = 8.0843 β2 − 18.708 β + 11.551 (R2 = 0.99).
It is worth noting that the surface velocity derived via the truncation at y/d = 0.841 coincides with the surface velocity of a logarithmic profile vLOG(y/d = 1) with the same mean and standard deviation, i.e., the same Cv or β. Figure 7 shows the two (normalised) profiles for V = 1 and σ = 0.16 or Cv = 0.16 and β = 1.0256. The maximum-entropy and the logarithmic-law equations are also displayed in Figure 7. The imperfect agreement between these profiles has no serious consequence in the discharge estimation because, in this maximum-entropy method, fv = V/ v surf is function of the integral measure β. Note that Le Coz et al. [22] and Hauet [17] also report that the log-profile fits streamflow data up to y/d ≈ 0.7, while a constant velocity approximates the data better for y/d ≥ 0.7.
Testing the method at two of the monitored cross-sections with variable bathymetry and roughness, one at the river Loussios and the other at the river Evrotas, has demonstrated its ability to estimate the discharge solely from surface velocity observations with ±5% accuracy referenced to discharge determined from in-stream densely sampled velocities. In contrast, indiscriminant application of the default ratio fv = 0.86 gave mixed results; in the case of the river Loussios, the error was small (−2%); however, the discharge of Evrotas River was over-estimated by ~17% (see [20] for details). This is not surprising since fv = 0.86 holds for a fairly uniform profile with β ≈ 1.03, more typical of large streams (Figure 3 in [23]), and corroborated by the data reported in [15] (p. 133). Furthermore, this new maximum-entropy method affords the flexibility of adapting the fv-ratios to the variable depth and streambed material that typically exist at cross-sections of natural streams. However, the uncertainty of measurements should be assessed regularly, e.g., during hydrometric campaigns, by sampling at least at 1—y/d = 0 (~surface), 0.2, 0.6, and 0.8.

3. Results

3.1. Technological Innovations

To reduce the cost of monitoring equipment (materials, operating, and maintenance costs) a prototype hydro-telemetry system was designed and built. This system combines custom hardware and software and intelligent detection technologies with low-cost telecommunications, at approximately 50% of the price of a comparable commercial system (cost basis 2019). The HTM-HYDRONET tele-hydrometric station consists of a central unit, sensors, a digital camera, and a photovoltaic panel; its block diagram is shown in Figure 8a.
The central unit of the HTM-HYDRONET telemetry station is the control board, shown in Figure 8b, that encompasses the following: a microprocessor—a GSM modem with GSM multiband antenna and mobile network SIM card, an industrial-grade memory card, and a serial communication port (RS232) for maintenance checks and reprogramming; a pulse count port for digital input from a rain gauge, an analog port for reading thermistor input (temperature measurement), an analog port for input of a 4–20 mA type sensor with 10 bits resolution, a serial communication port (RS232) for an external camera, and an adaptation circuit for SDI-12 sensors (a serial communication protocol allowing the data logger to monitor several microprocessor-controlled sensors at the same time using just one input port, only three wires per sensor with maximum length of 65 m, and one supply voltage of 12 V DC); and a controlled voltage supply for two sensors—a battery solar charge controller, voltage stabilizers for the circuit boards, and connection terminals. The central unit is placed in a waterproof box that also contains the sealed re-chargeable lead acid battery of 12 V/12 Ah, cables, and connection terminals (see Figure 8c).
To keep the overall cost of the station low and the power consumption optimized, a selection of specific sensors was undertaken and the station was adapted to them, without the provision of using alternatives, at least for the prototype design and construction phase (5 + 1 stations). The most expensive component of the station was the ultrasonic water level sensor (dbi6 PULSAR). The sensors accompanying the current version of the HTM-HYDRONET stations are
  • Distance ultrasonic sensor with a 4–20 mA output (for measuring water level);
  • Tipping bucket rain gauge;
  • Thermistor of standard resistance 10 KΩ @ 25 °C (for measuring air temperature).
The VGA digital camera (resolution 640 × 480 pixels), which is an innovation and important addition of this design, is powered by 12 V DC only at the time of the photo shooting and during the transfer of the picture via the RS-232 port. The camera has an infrared LED and an automatic UV filter. When there is enough light, the photo is in colour, while in a dark environment, the infrared LEDs light up, and the photo is black and white. When installed, the station also has an external mobile antenna and is powered by a solar panel. The camera is used only for video surveillance; it can only take fixed pictures (not a video-camera).
Data and photos are transmitted to the HYDRONET server every 10 min via mobile internet. In addition to low cost, the advantages of the system are flexibility in programming, low maintenance cost, and the possible extension of its capabilities with additional sensors (e.g., it is already compatible with multi-parameter water quality sensors via the SDI-12 communication protocol). Six stations have been produced and installed in streams in Attica and in Evrotas River, Laconia (see Figure 2). Figure 9 shows a diagram of the rainfall and the corresponding hydrograph at Profitis Daniel station (Station 4 in Figure 2a, Athens area) as well as consecutive pictures captured automatically by the station’s camera, also informing on the general conditions prevailing in the stream, e.g., regarding debris and vegetation that may affect the flow conditions in the river bed.

3.2. A HYDRONET Service Demonstrator

Next, we sketch a flood warning service (demonstrator) for Kalamata, the regional urban centre through which Nedon River outflows to the sea, as shown in Figure 2e. The Kalamata monitoring station of Nedon River was initially sited at Baka’s Quarry overfall, approximately 3 km upstream of its present position near the Dance Hall. Stages were gauged ~2 m from the overfall edge; the sensor was attached to a metal rig placed inside a heavy pipe (its base bolted onto concrete), by necessity mounted inside the stream (see Figure 10a). The site was abandoned after massive floating debris hit the exposed sensor assembly, lifting it from its anchoring in the large flood of September 2016 (see Figure 10b). Those data and citizens’ observations allow for the estimation of the conveying capacity of Nedon’s choke-prone covered part (twin rows of columns support) next to the city centre. A rainfall–runoff model of Nedon’s basin [9] may be setup to assess the flood risk of Kalamata’s centre instead of assigning the return period of the rainfall to the peak discharge via a rational–formula model, as is often used in ungauged basins [24]. (Past flows at Baka’s Quarry can be routed downstream as kinematic (travel time) or diffusive (attenuation) wave, based on the channel morphology [25,26,27]).
However, monitoring at the city outskirts (Baka’s Quarry) gives hardly time to alert the public of an impending flood; the warning system must encompass the entire basin. Figure 11 shows the Nedon river basin, with tributaries, and the hydrographs of the small flood of December 2020, recorded at upstream stations and at the Dance Hall station. The lags of the peaks yield ~3 h as warning time, but with the rate of rise as flood precursor, that time doubles to ~6 h.

4. Discussion, Conclusions, and Outlook

HYDRONET is a telemetry-based prototype of a streamflow monitoring network in the Greek territory, where such data are sparse. HYDRONET provides free access to data and uses resources efficiently. We addressed the high cost of equipment, a major impediment to establishing hydrometric networks (see the Introduction), by designing and building our own telemetric stations, at the cost of slightly less than 50% of comparable commercial stations (the accuracy of the sensors used in our equipment is actually higher and our station is more energy-efficient). A new station and a commercial station were installed at the Dance Hall monitoring station of Nedon River in Kalamata and were compared for three months: the results were absolutely comparable. Because the time in our system is taken from the internet, an internet connection failure stops the operation until the connection is restored; this results in some data loss as well. In the planned update of our station, we intend to add an internal clock and on-board memory to store data measured over a brief elapsed time span (say, one day) to guard against data loss during a potential internet connection failure.
Furthermore, the maximum-entropy-based velocity profile developed during the HydroNet project contributed to efficient hydrometric campaigns. That velocity profile enables robust estimation of the discharge from observations of the surface velocity, with the ratio fv = V/vsurf as function of the momentum distribution coefficient β, an integral flow measure that quantifies the velocity dispersion.
An example of HYDRONET’s potential to provide civil protection services is the flood warning demonstrator for Kalamata’s City Centre; importantly, HYDRONET’s data are being presently used to assess the flood risk of Kalamata’s centre. The recently completed evaluation of HIMIOFoTS ascertained the success of the Hydro.Net project. However, sustained operation of HYDRONET, even in its pilot form, requires secure financing to cover the costs of equipment (damages, wear, thefts, and vandalism) and operation (maintenance and hydrometric campaigns), the costs of equipment and maintenance being major challenges. The Basin of Kifissos River—where most of Greater Athens is located—is a prime area for HYDRONET’s expansion, complement stations already installed there and aiming to assist civil protection authorities, a task successfully demonstrated in the TELEFLEUR project ca. 20 years ago [7] but, since then, ignored by the regional and central administrations.
The outlook regarding these matters is generally uncertain: NOA can provide modest funds to partly support the operation of the network, while (mostly EC) funds for purchasing equipment—yet only commercial, which negates a significant achievement of this project—will be made available through the Greek administration. The eagerly anticipated continuation of the Hydro.Net project in a second phase of HIMIOFoTS (approved in 2014 as a seven-year project but initiated in 2018 as a three-year pilot project, with a severely reduced budget) is not secured: it will be decided in a future competition. Needless to say, such delays and stop-and-(uncertain) go circumstances undermine the long-term viability of the infrastructure.

Author Contributions

Conceptualization and methodology, K.M. and A.D.K.; design of the quality control scheme, S.L. and B.E.P.; quality control code development, B.E.P.; data curation code development, B.E.P., D.K., I.K. and D.K.; update, B.E.P. and D.K.; validation, K.M., S.L. and A.D.K.; investigation, A.D.K., G.V. and E.R.; resources, K.M.; data curation, S.L., B.E.P., N.K., I.K., D.K., K.M., E.R. and T.K.; writing—original draft preparation, A.D.K. and K.M.; writing—review and editing, S.L.; supervision, K.M. and A.D.K.; project administration, K.M.; funding acquisition, K.M. All authors have read and agreed to the published version of the manuscript.

Funding

This work was supported by the Hellenic General Secretariat for Research and Technology (Project HYDRO-NET: Hydro-Telemetric Networks of Surface Water, as a part of the Hellenic Integrated Marine and Inland Water Observing, Forecasting and Offshore Technology System, HIMIOFoTS (MIS5002739).

Institutional Review Board Statement

Not applicable.

Informed Consent Statement

Not applicable.

Data Availability Statement

Water stage and rainfall data from the stations of HYDRONET network are freely accessible from https://system.openhi.net/, accessed on 3 September 2022. The Thission Meteorological Station belongs to the IERSD of NOA, and its data have been provided freely to the authors of this work.

Acknowledgments

The authors appreciate the collaboration of Ioannis Karamitsos, who provides freely the data from his network of meteorological stations in Messinia, http://www.weather-messinia.gr/weather/, accessed on 3 September 2022. The Thission automatic actinometric–meteorological station belongs to the IERSD of NOA and its data have been provided freely to the authors of this work.

Conflicts of Interest

The authors declare no conflict of interest.

Appendix A

Appendix A.1. Climatic Data

The orography of the Greek mainland is dominated by the Pindos mountain range, running NW to SE and dividing the country into eastern and western parts, with distinctly different climatic parameters: climate becomes drier from west to east and cooler from south to north. Figure A1 shows climatic maps from the site of the Hellenic National Meteorological Service (http://climatlas.hnms.gr/sdi/, accessed on 3 September 2022) [28]. The highest mean annual temperatures occur in southern Greece, mainly in Attica and the coastal areas of the Peloponnese, in the Aegean islands and Crete (Athens Basin, 17.5–18.5 °C), while the lowest values occur in the north of the country and in the highlands of the Peloponnese (near Loussios basin, <11.5 °C) and of Crete. The lowest mean annual sunshine duration is recorded at the north-central and central mountain complexes of the Greek peninsula; sunshine duration increases towards the south and the coasts with the maximum observed at the coasts of Crete and at the southern coastal areas (near Selas basin, 2734 h/year and Attica, 2650 h/year). The mean annual rainfall is much higher in the west (>900 mm) than in the east (<600 mm). For example, the mean annual rainfall in Athens Basin is ~400 mm, while in Kalamata and near Selas basin it is 600–800 mm and near Loussios basin > 1100 mm (all climatic data are from the above-mentioned site). Rainfall during the summer is rare and episodic (storms). Relative humidity is highest, >70%, on the country’s western coasts, in the Ionian islands and in the eastern Aegean islands. The lowest values, <64%, are observed in the mainland and in Crete (in Attica, <60%).
Figure A1. Climatic maps of the area of HYDRONET. Stations located in Athens basin are not shown due to scale limits. (a) Average annual rainfall (mm), (b) Average annual temperature (°C). Maps available from http://climatlas.hnms.gr/sdi/, accessed on 3 September 2022 [28] and modified by the authors.
Hydrology 10 00019 g0a1

Appendix A.2. Data Quality Control

Figure A2. Quality tests applied on the data recorded by NOA’s automatic stations.
Hydrology 10 00019 g0a2

References

  1. Pecora, S.; Lins, H.F. E-monitoring the nature of water. Hydrol. Sci. J. 2020, 65, 683–698. [Google Scholar] [CrossRef]
  2. Tauro, F.; Selker, J.; van de Giesen, N.; Abrate, T.; Uijlenhoet, R.; Porfiri, M.; Manfreda, S.; Caylor, K.; Moramarco, T.; Benveniste, J. Measurements and Observations in the XXI century (MOXXI): Innovation and multidisciplinarity to sense the hydrological cycle. Hydrol. Sci. J. 2018, 63, 169–196. [Google Scholar] [CrossRef] [Green Version]
  3. Wickert, A. The ALog: Inexpensive, Open-Source, Automated Data Collection in the Field. Bull. Ecol. Soc. Am. 2014, 95, 166–176. [Google Scholar] [CrossRef] [Green Version]
  4. Livoroi, A.; Conti, A.; Foianesi, L.; Tosi, F.; Aleotti, F.; Poggi, M.; Tauro, F.; Toth, E.; Grimaldi, S.; Mattoccia, S. On the Deployment of Out-of-the-Box Embedded Devices for Self-Powered River Surface Flow Velocity Monitoring at the Edge. Appl. Sci. 2021, 11, 7027. [Google Scholar] [CrossRef]
  5. Cressey, D. Age of the Arduino. Nature 2017, 544, 125–126. [Google Scholar] [CrossRef]
  6. Mamassis, N.; Mazi, K.; Dimitriou, E.; Kalogeras, D.; Malamos, N.S.; Lykoudis, S.; Koukouvinos, A.; Tsirogiannis, I.; Papageorgaki, I.; Papadopoulos, A.; et al. OpenHi.net: A synergistically built, national-scale infrastructure for monitoring the surface waters of Greece. Water 2021, 13, 2779. [Google Scholar] [CrossRef]
  7. Koussis, A.D.; Lagouvardos, K.; Mazi, K.; Kotroni, V.; Sitzmann, D.; Lang, J.; Zaiss, H.; Buzzi, A.; Malguzzi, P. Flood forecasts for an urban basin with integrated hydro-meteorological model. J. Hydrol. Eng. 2003, 8, 1–11. [Google Scholar] [CrossRef]
  8. Mazi, K.; Koussis, A.D. The July 8, 2002 storm over Athens: Analysis of the Kifissos River/Canal overflows. Adv. Geosci. 2006, 7, 301–306. [Google Scholar] [CrossRef] [Green Version]
  9. Savvidou, E.; Efstratiadis, A.; Koussis, A.D.; Koukouvinos, A.; Skarlatos, D. The curve number concept as a driver for delineating hydrological response units. Water 2018, 10, 194. [Google Scholar] [CrossRef] [Green Version]
  10. World Meteorological Organization. Manual on Stream Gauging, Vol. I Fieldwork, WMO-No.1044; WMO: Geneva, Switzerland, 2010. [Google Scholar]
  11. Welber, M.; Le Coz, J.; Laronne, J.; Zolezzi, G.; Zamler, D.; Dramais, G.; Hauet, A.; Salvaro, M. Field assessment of noncontact stream gauging using portable surface velocity radars (SVR). Water Resour. Res. 2016, 52, 1108–1126. [Google Scholar] [CrossRef]
  12. LeGrand, M.; Luce, J.; Metcalfe, R.; Buttle, J. Development of an inexpensive automated streamflow monitoring system. Hydrol. Process. 2020, 34, 3021–3023. [Google Scholar] [CrossRef]
  13. Rozos, E.; Dimitriadis, P.; Mazi, K.; Lykoudis, S.; Koussis, A.D. On the Uncertainty of the Image Velocimetry Method Parameters. Hydrology 2020, 7, 65. [Google Scholar] [CrossRef]
  14. Rozos, E.; Mazi, K.; Lykoudis, S. On the Accuracy of Particle Image Velocimetry with Citizen Videos—Five Typical Case Studies. Hydrology 2022, 9, 72. [Google Scholar] [CrossRef]
  15. Rantz, S.E. Measurement and Computation of Streamflow; US Geological Survey: Reston, VA, USA, 1982; Volume 1, p. 137. [Google Scholar] [CrossRef]
  16. ISO 748: 2007; Hydrometry–Measurement of Liquid Flow in Open Channels Using Current-Meters or Floats. 2007. Available online: https://www.iso.org/standard/37573.html (accessed on 13 November 2021).
  17. Hauet, A. Stream Gauging Techniques: Velocity-Area, ADCP, Dilution, Volumetric…; Training Course on Stream Gauging; IAHR WMO IAHS Training: Lyon, France, 2018; Available online: https://riverflow2018.inrae.fr/program-2/training-course-on-stream-gauging/ (accessed on 15 April 2022).
  18. Bjerklie, D.M.; Fulton, J.W.; Dingman, S.L.; Canova, M.G.; Minear, J.T.; Moramarco, T. Fundamental hydraulics of cross sections in natural rivers: Preliminary analysis of a large data set of acoustic Doppler flow measurements. Water Resour. Res. 2020, 56, e2019WR025986. [Google Scholar] [CrossRef]
  19. Bandini, F.; Lüthi, B.; PeñaHaro, S.; Borst, C.; Liu, J.; Karagkiolidou, S.; Hu, X.; Lemaire, G.G.; Bjerg, P.L.; BauerGottwein, P. A drone-borne method to jointly estimate discharge and Manning’s roughness of natural streams. Water Resour. Res. 2021, 57, e2020WR028266. [Google Scholar] [CrossRef]
  20. Koussis, A.D.; Dimitriadis, P.; Lykoudis, S.; Kappos, N.; Katsanos, D.; Koletsis, I.; Psiloglou, B.; Rozos, E.; Mazi, K. Discharge estimation from surface-velocity observations by a maximum-entropy based method. Hydrol. Sci. J. 2022, 67, 451–461. [Google Scholar] [CrossRef]
  21. Chow, V.T. Open-Channel Hydraulics; International Edition; McGraw-Hill Inc.: Singapore, 1973. [Google Scholar]
  22. Le Coz, J.; Hauet, A.; Pierrefeu, G.; Dramais, G.; Camenen, B. Performance of image-based velocimetry (LSPIV) applied to flash-flood discharge measurements in Mediterranean rivers. J. Hydrol. 2010, 394, 42–52. [Google Scholar] [CrossRef] [Green Version]
  23. Shen, C.; Niu, J.; Anderson, E.J.; Phanikumar, M.S. Estimating longitudinal dispersion in rivers using acoustic doppler current profilers. Adv. Water Res. 2010, 33, 615–623. [Google Scholar] [CrossRef]
  24. Efstratiadis, A.; Koussis, A.D.; Koutsoyiannis, D.; Mamassis, N. Flood design recipes vs. reality: Can predictions for ungauged basins be trusted? Nat. Hazards Earth Syst. Sci. 2014, 14, 1417–1428. [Google Scholar] [CrossRef]
  25. Koussis, A.D. Theoretical Estimations of Flood Routing Parameters. J. Hydraul. Div. ASCE 1978, 104, 109–115. [Google Scholar] [CrossRef]
  26. Koussis, A.D. Assessment and review of the hydraulics of storage flood routing 70 years after the presentation of the Muskingum method. Hydrol. Sci. J. 2009, 54, 43–61. [Google Scholar] [CrossRef]
  27. Koussis, A.D. Reply to the Discussion of An assessment review of the hydraulics of storage flood routing 70 years after the presentation of the Muskingum method, by M. Perumal. Hydrol. Sci. J. 2010, 55, 1431–1441. [Google Scholar] [CrossRef]
  28. Climatic Maps and Data. Available online: http://climatlas.hnms.gr/sdi/ (accessed on 3 September 2022).
Figure 1. HYDRONET coverage in Attica-Boeotia and in the Peloponnese: in-house-built stations are indicated by green numbers, commercial stations by red numbers; blue letters indicate rain gauges. The numbers of the stations and the corresponding names are listed in Table 1.
Hydrology 10 00019 g001
Figure 2. HYDRONET—red numerals indicate stations, see Table 1, and dark blue lines basin borders: (a) Kifissos river basin, Attica, (b) Evrotas river basin, Laconia, (c) Sarantapotamos river basin, Attica/Boeotia, (d) Loussios sub-basin of Alpheios River, Arcadia, (e) Selas (west), Pamissos (centre), and Nedon (east) river basins, Messinia. Letters in (b,e) indicate rain gauges; triangles in (a,b) indicate stations of partners in OpenHi.net; and stations without numbers in (c) belong to NOA but are not part of HYDRONET.
Hydrology 10 00019 g002
Figure 3. HTM Evrotas station: (a) installation on the right bank of the river looking downstream, and (b) close-up photo of the sensor assembly.
Hydrology 10 00019 g003
Figure 4. Block diagrams: (left) Diagram of the process of checking and filling in gaps and (right) diagram of the procedure for quality control of the data.
Hydrology 10 00019 g004
Figure 5. Hydrographs flagged with “warning” in two cases of abrupt water stage changes 10 min time at Prophitis Daniel station exhibiting: (a) an actual hydrograph: increase by 1.9 m and (b) a spontaneous error in measurement. Blue bars indicate rainfall, lines with dots indicate water stage.
Hydrology 10 00019 g005
Figure 6. Sample of the output file report.txt of audit code.
Hydrology 10 00019 g006
Figure 7. Comparison of maximum-entropy and logarithmic velocity profiles; β = 1.0256.
Hydrology 10 00019 g007
Figure 8. HYDRONET station: (a) block diagram, (b) control board, and (c) box interior.
Hydrology 10 00019 g008
Figure 9. Profitis Daniel HTM station. Rainfall (blue bars) and hydrograph (red line) on 14 October 2021 (upper part)—the arrows indicate the stage at the time of the photos in the lower part. (Lower part) shows a picture of the station (left) and consecutive photos captured automatically by the station’s camera, exhibiting the flow conditions in the stream. Rainfall data are from the automatic actinometric–meteorological station of IERSD/NOA at Thission.
Hydrology 10 00019 g009
Figure 10. September 2016 flood at Baka’s Quarry station (inset) (a) and at Alagonia station (b).
Hydrology 10 00019 g010
Figure 11. Demonstrator of a potential HYDRONET service: flood warning for Kalamata’s Centre.
Hydrology 10 00019 g011
Table 1. Stations: home-made telemetric (HTM), commercial telemetric (CTM), piezometric (PM) and rain gauge (RG). Basin selection criteria: (i) flood/drought protection (FD), (ii) environmental– ecological status (E), (iii) economic activity: industry (ID), transport (TR), tourism (TO), and agriculture (AG). Techno–economic installation criteria: (i) proximity to NOA facilities (PR), (ii) efficient field campaigns (FC), (iii) efficient station maintenance (SM), (iv) prior involvement of the hydro-team in the prospective areas (PI), and (v) enlarging the existent database (DB).
REGION or CountyBASIN/Sub-BasinStation NumberBasin Area (km2) *Altitude
(m)
Station
Type
Local
Criteria
Techno–Economic Criteria
ATTICA,
Athens Basin
PODONIFTIS **179.074HTMFD, TR, EPR, FC, SM, PI, DB
Halandri217.0167HTMFD, TR, EPR, FC, SM, PI, DB
Filothei326.0161HTMFD, TR, EPR, FC, SM, PI
PROFITIS DANIEL **416.921HTMFD, TR, EPR, FC, SM, PI, DB
ATTICA-VoiotiaSARANTAPOTAMOS7143.0157CTM & RGFD, TR, ID, EPR, FC, SM, PI, DB
Oinoi847.0333CTM & RGTR, ID, E, AGPR, FC, SM, PI, DB
ArcadiaLOUSSIOS ***9166.3230PMEPI, FC, SM, DB
MessiniaNEDON10123.017CTMFD, TR, E, TOFC, SM, DB
Karveliotis1115.3598CTM & RGFD, TR, EFC, SM, PI, DB
Alagonia1220.0562CTM & RGEFC, SM, PI, DB
Nedousa1351.0392CTMEFC, SM, PI, DB
PAMISSOS14544.05PMFD, E, TR, TO, AGFC, SM, PI
Mavrozoumaina15452.020CTM & RGFD, E, TR, TO, AGFC, SM, PI
SELAS1685.09CTMFD, E, TO, AGPI, DB
Laconia(upper) EVROTAS5444.0224HTMFD, E, TR, AGFC, SM
Kelefina6339.0251HTMFD, E, TR, AGFC, SM
TaygetosA 1301RG SM, PI
VresthenaB 745RG SM, PI
LogganikosC 756RG SM, PI
* Geographic information from https://system.openhi.net, accessed on 3 September 2022; ** sub-basin of Kifissos river basin, contains most of Greater Athens. *** Sub-basin of Alpheios River, which discharges in the Ionian Sea, after passing near Olympia.
Table 2. Stations with types of equipment and software.
No.SensorData LoggerModemTemperatureRain GaugeCommunicationSoftware
1dBI6, PULSARHYDRONET built in-houseThermistor--GPRS modembuilt in-house
2dBI6, PULSARHYDRONET built in-houseThermistor--GPRS modembuilt in-house
3dBI6, PULSARHYDRONET built in-houseThermistor--GPRS modembuilt in-house
4dBI6, PULSARHYDRONET built in-houseThermistor--GPRS modembuilt in-house
5dBI6, PULSARHYDRONET built in-houseThermistor--GPRS modembuilt in-house
6dBI6, PULSARHYDRONET built in-houseThermistor--GPRS modembuilt in-house
7SR50A, Campbell Sci.CR300, Campbell Sci.M100 3G, MaestroType 107, Campbell Sci.7857, Davis Instr.GPRS modemLOGGERNET v.4.5
8SR50A, Campbell Sci.CR200Χ, Campbell Sci.M100 3G, MaestroType 107, Campbell Sci.7857, Davis Instr.GPRS modemLOGGERNET v.4.5
9Hobo U20-001-01, Onset Comp.--Embedded thermistor----HobowarePro v. 3.3.1
10SR50A, Campbell Sci.CR300, Campbell Sci.M100 3G, MaestroType 107, Campbell Sci.--GPRS modemLOGGERNET v.4.5
11SR50A, Campbell Sci.CR200Χ, Campbell Sci.M100 3G, MaestroType 107, Campbell Sci.7857, Davis Instr.GPRS modem *LOGGERNET v.4.5
12SR50A, Campbell Sci.CR200Χ, Campbell Sci.M100 3G, MaestroType 107, Campbell Sci.--GPRS modemLOGGERNET v.4.5
13SR50A, Campbell Sci.CR200Χ, Campbell Sci.M100 3G, MaestroType 107, Campbell Sci.-GPRS modemLOGGERNET v.4.5
14Hobo U20-001-04, Onset Comp.--Embedded thermistor----HobowarePro v. 3.3.1
15SR50AΤ, Campbell Sci.CR200Χ, Campbell Sci.M100 3G, Maestro 7857, Davis Instr.GPRS modemLOGGERNET v.4.5
16SR50A, Campbell Sci.CR200Χ, Campbell Sci.M100 3G, MaestroType 107, Campbell Sci.--GPRS modemLOGGERNET v.4.5
A--Hobo UA-003-64, Onset Comp.--Embedded thermistor300.023, Pronamic--HobowarePro v. 3.3.1
B--Hobo UA-003-64 Onset Comp.--Embedded thermistor300.023, Pronamic--HobowarePro v. 3.3.1
C--Hobo H07-002-04, Onset Comp.----300.023, Pronamic--BoxCar Pro v.4.3
* Modem added to the station in June 2021.
Table 3. Frequency of common problems and errors after data quality control checks of all stations for the time period 2020 and 2021: missing data (blanks) and poor signal quality (SQ).
StationWater Level Sensor MountInstallationBlanks (%)Poor SQ (%)Problem
1bridgecity street/lawn220extreme conditions: water-resistant box flooded
15bridgeprovincial road9.80.01battery stolen and cable of PV panel damaged
11bridgeprovincial road8.10power failure: battery problem
3bridgecity street/lawn5.20power failure: PV panel shaded
6bridgerural road3.70theft: cable of PV panel
4bridgecity street/lawn3.20theft: PV panel
5stream bankrural field2.20power failure: battery problem
2bridgecity street/lawn0.80
10bridgecity street/lawn0.030.03
7bridgeprivate land0.020.04
13bridgeprovincial road0.10.4
8bridgeprovincial road00.06
12wooden bridgeprivate land00.4
16wooden bridgeprivate land00.3
9stream bankRiver00
14bridge bankprovincial road00.01
Disclaimer/Publisher’s Note: The statements, opinions and data contained in all publications are solely those of the individual author(s) and contributor(s) and not of MDPI and/or the editor(s). MDPI and/or the editor(s) disclaim responsibility for any injury to people or property resulting from any ideas, methods, instructions or products referred to in the content.

