Next Issue
Volume 10, March
Previous Issue
Volume 10, January


Hydrology, Volume 10, Issue 2 (February 2023) – 29 articles

Cover Story (view full-size image): 
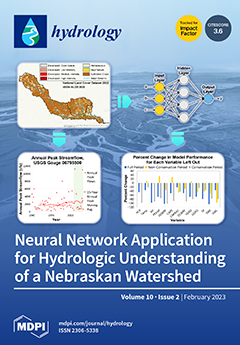
The Shell Creek Watershed (SCW) is a rural Nebraskan watershed with a history of flooding. Since 2005, a variety of conservation practices have been employed in SCW that have been credited with attenuating flood severity there. This study investigated the impacts of 13 different controlling factors on flooding at SCW using an artificial neural network-based rainfall–runoff model. Additionally, flood frequency analysis and drought severity analysis were conducted. Special emphasis was placed on understanding how flood trends change in light of conservation practices to determine whether any relation exists between the conservation practices and flood peak attenuation, as the conservation plan implemented in the watershed provides a unique opportunity to examine the potential impacts of conservation practices on the watershed. View this paper
  • Issues are regarded as officially published after their release is announced to the table of contents alert mailing list.
  • You may sign up for e-mail alerts to receive table of contents of newly released issues.
  • PDF is the official format for papers published in both, html and pdf forms. To view the papers in pdf format, click on the "PDF Full-text" link, and use the free Adobe Reader to open them.
Order results
Result details
Section
Select all
Export citation of selected articles as:
19 pages, 10760 KiB  
Article
Reservoir Capacity Estimation by the Gould Probability Matrix, Drought Magnitude, and Behavior Analysis Methods: A Comparative Study Using Canadian Rivers
by Tribeni C. Sharma and Umed S. Panu
Hydrology 2023, 10(2), 53; https://doi.org/10.3390/hydrology10020053 - 20 Feb 2023
Cited by 1 | Viewed by 1450
Abstract
Among the various methods for estimating reservoir volumes, the Gould probability matrix (GPM) method has been touted as a powerful method for estimating reservoir volumes. The other methods in vogue are the Behavior analysis (BA) with the latest induction of the Drought magnitude [...] Read more.
Among the various methods for estimating reservoir volumes, the Gould probability matrix (GPM) method has been touted as a powerful method for estimating reservoir volumes. The other methods in vogue are the Behavior analysis (BA) with the latest induction of the Drought magnitude (DM) method. A comparison of the above methods in terms of ease, efficiency, and relative merits from each other is currently lacking in the literature. This paper compares the above three methods with a detailed analysis of the GPM method using the monthly flows from 16 Canadian rivers at the draft ratios of 75 and 50% with the probability of failure of 2.5, 5 and 10%. The results reported in this paper indicate that fifteen zones are sufficient in the GPM method to yield the reservoir capacity for the Canadian rivers while requiring no standardization of the data, similar to the BA method. In the DM method, standardized monthly flow sequences in combination with a scaling parameter Φ yielded effective drought length, which, when multiplied by drought intensity and the average of 12 monthly standard deviations, resulted in the appropriate values of reservoir capacity. The results of this paper affirm that the GPM method offers little special merit in obtaining reservoir capacity in view of the rigor of computational efforts and uncertainty in the correction factors for significantly autocorrelated (dependent) annual flows. The DM method was found to be comparable to the BA method, though it requires standardization of the monthly flow data. The study suggests that all three methods result in comparable estimates of reservoir capacity for nearly independent annual flows with a slight edge to the Behavior analysis (BA) method. Full article
(This article belongs to the Section Statistical Hydrology)
Show Figures

Figure 1

22 pages, 3267 KiB  
Article
Quantitative Estimation of Rainfall from Remote Sensing Data Using Machine Learning Regression Models
by Yacine Mohia, Rafik Absi, Mourad Lazri, Karim Labadi, Fethi Ouallouche and Soltane Ameur
Hydrology 2023, 10(2), 52; https://doi.org/10.3390/hydrology10020052 - 16 Feb 2023
Viewed by 2896
Abstract
To estimate rainfall from remote sensing data, three machine learning-based regression models, K-Nearest Neighbors Regression (K-NNR), Support Vector Regression (SVR), and Random Forest Regression (RFR), were implemented using MSG (Meteosat Second Generation) satellite data. Daytime and nighttime data from a rain gauge are [...] Read more.
To estimate rainfall from remote sensing data, three machine learning-based regression models, K-Nearest Neighbors Regression (K-NNR), Support Vector Regression (SVR), and Random Forest Regression (RFR), were implemented using MSG (Meteosat Second Generation) satellite data. Daytime and nighttime data from a rain gauge are used for model training and validation. To optimize the results, the outputs of the three models are combined using the weighted average. The combination of the three models (hereafter called Com-RSK) markedly improved the predictions. Indeed, the MAE, MBE, RMSE and correlation coefficient went from 23.6 mm, 10.0 mm, 40.6 mm and 89% for the SVR to 20.7 mm, 5.5 mm, 37.4 mm, and 94% when the models were combined, respectively. The Com-RSK is also compared to a few methods using the classification in the estimation, such as the ECST Enhanced Convective Stratiform Technique (ECST), the MMultic technique, and the Convective/Stratiform Rain Area Delineation Technique (CS-RADT). The Com-RSK show superior performance compared to ECST, MMultic and CS-RADT methods.The Com-RSK is also compared to the two products of satellite estimates, namely CMORPH and CHIRPS. The results indicate that Com-RSK performs better than CMORPH and CHIRPS according to MBE, RMSE and CC (coefficient correlation). A comparison with three types of satellite precipitation estimation products, such as global product, regional product, and near real-time product, is performed. Overall, the methodology developed here shows almost the same results as regional product methods and exhibits better results than near real-time and global product methods. Full article
(This article belongs to the Special Issue Recent Advances in Water and Water Resources Engineering)
Show Figures

Figure 1

18 pages, 3181 KiB  
Article
Characterizing Trace Metal Contamination and Partitioning in the Rivers and Sediments of Western Europe Watersheds
by Aline Grard and Jean-François Deliège
Hydrology 2023, 10(2), 51; https://doi.org/10.3390/hydrology10020051 - 16 Feb 2023
Viewed by 1685
Abstract
Adsorption and desorption processes occurring on suspended and bed sediments were studied in two datasets from western Europe watersheds (Meuse and Mosel). Copper and zinc dissolved and total concentrations, total suspended sediment concentrations, mass concentrations, and grain sizes were analyzed. Four classes of [...] Read more.
Adsorption and desorption processes occurring on suspended and bed sediments were studied in two datasets from western Europe watersheds (Meuse and Mosel). Copper and zinc dissolved and total concentrations, total suspended sediment concentrations, mass concentrations, and grain sizes were analyzed. Four classes of mineral particle size were determined. Grain size distribution had to be considered in order to assess the trace metal particulate phase in the water column. The partitioning coefficients of trace metals between the dissolved and particulate phases were calculated. The objective of this study was to improve the description of the processes involved in the transportation and fate of trace metals in river aquatic ecosystems. Useful data for future modelling, management and contamination assessment of river sediments were provided. As it is confirmed by a literature review, the copper and zinc partitioning coefficients calculated in this study are reliable. The knowledge related to copper and zinc (e.g., partitioning coefficients) will allow us to begin investigations into environmental modelling. This modelling will allow us to consider new sorption processes and better describe trace metal and sediment fates as well as pressure–impact relationships. Full article
(This article belongs to the Special Issue Novel Approaches in Contaminant Hydrology and Groundwater Remediation)
Show Figures

Figure 1

17 pages, 9809 KiB  
Article
Comparison of Tree-Based Ensemble Algorithms for Merging Satellite and Earth-Observed Precipitation Data at the Daily Time Scale
by Georgia Papacharalampous, Hristos Tyralis, Anastasios Doulamis and Nikolaos Doulamis
Hydrology 2023, 10(2), 50; https://doi.org/10.3390/hydrology10020050 - 12 Feb 2023
Cited by 4 | Viewed by 2225
Abstract
Merging satellite products and ground-based measurements is often required for obtaining precipitation datasets that simultaneously cover large regions with high density and are more accurate than pure satellite precipitation products. Machine and statistical learning regression algorithms are regularly utilized in this endeavor. At [...] Read more.
Merging satellite products and ground-based measurements is often required for obtaining precipitation datasets that simultaneously cover large regions with high density and are more accurate than pure satellite precipitation products. Machine and statistical learning regression algorithms are regularly utilized in this endeavor. At the same time, tree-based ensemble algorithms are adopted in various fields for solving regression problems with high accuracy and low computational costs. Still, information on which tree-based ensemble algorithm to select for correcting satellite precipitation products for the contiguous United States (US) at the daily time scale is missing from the literature. In this study, we worked towards filling this methodological gap by conducting an extensive comparison between three algorithms of the category of interest, specifically between random forests, gradient boosting machines (gbm) and extreme gradient boosting (XGBoost). We used daily data from the PERSIANN (Precipitation Estimation from Remotely Sensed Information using Artificial Neural Networks) and the IMERG (Integrated Multi-satellitE Retrievals for GPM) gridded datasets. We also used earth-observed precipitation data from the Global Historical Climatology Network daily (GHCNd) database. The experiments referred to the entire contiguous US and additionally included the application of the linear regression algorithm for benchmarking purposes. The results suggest that XGBoost is the best-performing tree-based ensemble algorithm among those compared. Indeed, the mean relative improvements that it provided with respect to linear regression (for the case that the latter algorithm was run with the same predictors as XGBoost) are equal to 52.66%, 56.26% and 64.55% (for three different predictor sets), while the respective values are 37.57%, 53.99% and 54.39% for random forests, and 34.72%, 47.99% and 62.61% for gbm. Lastly, the results suggest that IMERG is more useful than PERSIANN in the context investigated. Full article
Show Figures

Figure 1

15 pages, 1393 KiB  
Article
Assessing Hydrological Simulations with Machine Learning and Statistical Models
by Evangelos Rozos
Hydrology 2023, 10(2), 49; https://doi.org/10.3390/hydrology10020049 - 10 Feb 2023
Cited by 1 | Viewed by 1998
Abstract
Machine learning has been used in hydrological applications for decades, and recently, it was proven to be more efficient than sophisticated physically based modelling techniques. In addition, it has been used in hybrid frameworks that combine hydrological and machine learning models. The concept [...] Read more.
Machine learning has been used in hydrological applications for decades, and recently, it was proven to be more efficient than sophisticated physically based modelling techniques. In addition, it has been used in hybrid frameworks that combine hydrological and machine learning models. The concept behind the latter is the use of machine learning as a filter that advances the performance of the hydrological model. In this study, we employed such a hybrid approach but with a different perspective and objective. Machine learning was used as a tool for analyzing the error of hydrological models in an effort to understand the source and the attributes of systematic modelling errors. Three hydrological models were applied to three different case studies. The results of these models were analyzed with a recurrent neural network and with the k-nearest neighbours algorithm. Most of the systematic errors were detected, but certain types of errors, including conditional systematic errors, passed unnoticed, leading to an overestimation of the confidence of some erroneously simulated values. This is an issue that needs to be considered when using machine learning as a filter in hybrid networks. The effect of conditional systematic errors can be reduced by naively combining the simulations (mean values) of two or more hydrological models. This simple technique reduces the magnitude of conditional systematic errors and makes them more discoverable to machine learning models. Full article
Show Figures

Figure 1

26 pages, 6225 KiB  
Article
Use of UAV Monitoring to Identify Factors Limiting the Sustainability of Stream Restoration Projects
by Jakub Langhammer, Theodora Lendzioch and Jakub Šolc
Hydrology 2023, 10(2), 48; https://doi.org/10.3390/hydrology10020048 - 10 Feb 2023
Cited by 2 | Viewed by 1886
Abstract
The detection and mapping of riverscapes with Unmanned Aerial Vehicles (UAVs, drones) provide detailed, reliable, and operable spatial information in hydrological sciences, enhancing conventional field survey techniques. In this study, we present the results of long-term, optical RGB (red, green, blue) UAV monitoring [...] Read more.
The detection and mapping of riverscapes with Unmanned Aerial Vehicles (UAVs, drones) provide detailed, reliable, and operable spatial information in hydrological sciences, enhancing conventional field survey techniques. In this study, we present the results of long-term, optical RGB (red, green, blue) UAV monitoring of stream restoration projects to identify the positive and negative features that affect their sustainability. We determined quantitative and qualitative aspects of restoration, such as the restoration effect, the dynamics of fluvial processes, hydrological connectivity, and riparian vegetation. The study was based on six years of UAV monitoring in three restored streams in Prague, Czech Republic. The multitemporal riverscape models from the photogrammetric reconstruction served as a basis for the visual assessment, compliant with the standard hydromorphological assessment. Such a combined approach extends the potential of UAV monitoring by allowing for the use of existing classification schemes and data and the objective detection of critical features. The study pointed to the significant discrepancies in channel geometry between the planned restorations and realized restorations in all assessed projects as a general phenomenon. Multitemporal, optical RGB UAV monitoring then detected issues in qualitative aspects that limit restoration quality, such as water overuse, extensive eutrophication, or inefficient riparian shading. Full article
Show Figures

Figure 1

16 pages, 5393 KiB  
Article
Water Level Forecasting in Tidal Rivers during Typhoon Periods through Ensemble Empirical Mode Decomposition
by Yen-Chang Chen, Hui-Chung Yeh, Su-Pai Kao, Chiang Wei and Pei-Yi Su
Hydrology 2023, 10(2), 47; https://doi.org/10.3390/hydrology10020047 - 10 Feb 2023
Cited by 6 | Viewed by 1627
Abstract
In this study, a novel model that performs ensemble empirical mode decomposition (EEMD) and stepwise regression was developed to forecast the water level of a tidal river. Unlike more complex hydrological models, the main advantage of the proposed model is that the only [...] Read more.
In this study, a novel model that performs ensemble empirical mode decomposition (EEMD) and stepwise regression was developed to forecast the water level of a tidal river. Unlike more complex hydrological models, the main advantage of the proposed model is that the only required data are water level data. EEMD is used to decompose water level signals from a tidal river into several intrinsic mode functions (IMFs). These IMFs are then used to reconstruct the ocean and stream components that represent the tide and river flow, respectively. The forecasting model is obtained through stepwise regression on these components. The ocean component at a location 1 h ahead can be forecast using the observed ocean components at the downstream gauging stations, and the corresponding stream component can be forecast using the water stages at the upstream gauging stations. Summing these two forecasted components enables the forecasting of the water level at a location in the tidal river. The proposed model is conceptually simple and highly accurate. Water level data collected from gauging stations in the Tanshui River in Taiwan during typhoons were used to assess the feasibility of the proposed model. The water level forecasting model accurately and reliably predicted the water level at the Taipei Bridge gauging station. Full article
(This article belongs to the Special Issue Modern Developments in Flood Modelling)
Show Figures

Figure 1

16 pages, 991 KiB  
Review
Comprehensive Flood Risk Assessment: State of the Practice
by Neil S. Grigg
Hydrology 2023, 10(2), 46; https://doi.org/10.3390/hydrology10020046 - 10 Feb 2023
Cited by 3 | Viewed by 3574
Abstract
A comprehensive assessment of flood hazards will necessitate a step-by-step analysis, starting with hydrometeorological examinations of runoff and flow, followed by an assessment of the vulnerability of those at risk. Although bodies of knowledge about these topics are large, flood risk assessments face [...] Read more.
A comprehensive assessment of flood hazards will necessitate a step-by-step analysis, starting with hydrometeorological examinations of runoff and flow, followed by an assessment of the vulnerability of those at risk. Although bodies of knowledge about these topics are large, flood risk assessments face data challenges such as climate change, population growth, and shifting land uses. Recent studies have provided comprehensive reviews of advances in the water sciences arena, and in a complementary way, this paper reviews the state of the practice of assessing flood risk, include flood scenarios, hydrometeorology, inundation modeling, flood frequency analysis, interrelationships with water infrastructure, and vulnerability of people and places. The research base for each of these topics is extensive. Some of the tools in these areas, such as hydrologic modeling, have research advances that extend back decades, whereas others, such as numerical weather prediction, have more room to evolve. It’s clear from all studies that data is crucial along the progression from atmospheric conditions to the impact on flood victims. How data are provided and shared and how they are used by stakeholders in flood risk reduction continue to evolve. Improved availability of data and uses of emerging tools of data science and machine learning are needed to assess and mitigate flood risks. Continued the development of key tools is also required, especially to improve the capability to assemble them effectively on user platforms. Full article
Show Figures

Figure 1

14 pages, 3482 KiB  
Article
The Impact of Urban Land-Use Regimes on the Stream Vegetation and Quality of a Mediterranean City
by Georgios Theodosiou and Sampson Panajiotidis
Hydrology 2023, 10(2), 45; https://doi.org/10.3390/hydrology10020045 - 09 Feb 2023
Cited by 1 | Viewed by 1530
Abstract
Urban streams are ecosystems of great ecological and hydrological importance for human environments. However, they face pressure on biodiversity, hydromorphology, and water quality. In this study, an urban riparian system of a Mediterranean city (Thessaloniki, Greece) which interacts with several land-use classes, namely [...] Read more.
Urban streams are ecosystems of great ecological and hydrological importance for human environments. However, they face pressure on biodiversity, hydromorphology, and water quality. In this study, an urban riparian system of a Mediterranean city (Thessaloniki, Greece) which interacts with several land-use classes, namely forests, pastures, cultivations, industrial-commercial infrastructure, and light and dense urban fabric, is assessed. The analyzed data were collected by implementing mainly QBR and ancillary RMP protocols on 37 plots of the Dendropotamos stream. The QBR protocol provided an assessment of total riparian vegetation cover, cover structure and quality, as well as channel alterations. The RMP protocol was used to enhance the quantitative assessment of dominant tree and shrub cover. Parts of Dendropotamos surrounded by agricultural (median QBR score: 27.5), industrial (50), and dense residential areas (27.5) suffer, in general, from low riparian vegetation cover, bad vegetation structure and quality, the continuous presence of alien/introduced species, and channel alterations. A variety of riparian habitat conditions characterize the sparse residential areas (60) where cover structure and quality of vegetation is improved. The reduction in grazing pressure has improved the riparian habitat in the greatest part of Dendropotamos that is surrounded by semi-natural pastures (65). Within forested areas (85), the stream conditions are considered quasi-natural. All previous land uses are differentiated in terms of the dominant trees found in the vegetation of Dendropotamos: Platanus orientalis in forested areas, alien Ailanthus altissima mainly in residential and industrial areas, and native shrubs, e.g., Quercus coccifera and Pyrus spinosa, in pastures. The QBR protocol could be a valuable tool in urban environment planning to help identify areas with potential for restoration, such as those with moderate residential pressure. Full article
Show Figures

Figure 1

16 pages, 3913 KiB  
Article
Comparison of Spatio-Temporal Variability of Daily Maximum Flows in Cold-Season (Winter and Spring) in Southern Quebec (Canada)
by Ali Arkamose Assani
Hydrology 2023, 10(2), 44; https://doi.org/10.3390/hydrology10020044 - 07 Feb 2023
Viewed by 1279
Abstract
Quebec has experienced a significant decrease in the amount of snow and an increase in temperature during the cold season. The objective of this study is to analyze the impacts of these climate changes on the spatio-temporal variability of the daily maximum flows [...] Read more.
Quebec has experienced a significant decrease in the amount of snow and an increase in temperature during the cold season. The objective of this study is to analyze the impacts of these climate changes on the spatio-temporal variability of the daily maximum flows generated by snowmelt in winter and spring using several statistical tests of correlation (spatial variability) and long-term trend (temporal variability). The study is based on the analysis of flows measured in 17 watersheds (1930–2019) grouped into three hydroclimatic regions. Regarding the spatial variability, the correlation analysis revealed that in winter, the flows are positively correlated with the agricultural area and the daily maximum winter temperature. In the spring, the flows are positively correlated with the drainage density and the snowfall but negatively correlated with the area of wetlands and the daily maximum spring temperature. As for temporal variability (long-term trend), the application of eight statistical tests revealed a generalized increase in flows in winter due to early snowmelt. In the spring, despite the decreased snow cover, no negative trend was observed due to the increase in the spring rainfall, which compensates for the decrease in the snowfall. This temporal evolution of flows in the spring does not correspond to the predictions of climate models. These predict a decrease in the magnitude of spring floods due to the decrease in the snowfall in southern Quebec. Full article
(This article belongs to the Section Hydrology–Climate Interactions)
Show Figures

Figure 1

12 pages, 2699 KiB  
Article
Revisiting of a Three-Parameter One-Dimensional Vertical Infiltration Equation
by George Kargas, Dimitrios Koka and Paraskevi A. Londra
Hydrology 2023, 10(2), 43; https://doi.org/10.3390/hydrology10020043 - 06 Feb 2023
Viewed by 1387
Abstract
In the present study, the three-parameter one-dimensional vertical infiltration equation recently proposed by Poulovassilis and Argyrokastritis is examined. The equation includes the saturated hydraulic conductivity (Ks), soil sorptivity (S), and an additional parameter c; it is valid for all infiltration times. [...] Read more.
In the present study, the three-parameter one-dimensional vertical infiltration equation recently proposed by Poulovassilis and Argyrokastritis is examined. The equation includes the saturated hydraulic conductivity (Ks), soil sorptivity (S), and an additional parameter c; it is valid for all infiltration times. The c parameter is a fitting parameter that depends on the type of porous medium. The equation is characterized by the incorporation of the exact contribution of the pressure head gradient to flow during the vertical infiltration process. The application of the equation in eight porous media showed that it approaches to the known two-parameter Green–Ampt infiltration equation for parameter c = 0.300, while it approaches to the two-parameter infiltration equation of Talsma–Parlange for c = 0.750, which are the two extreme limits of the cumulative infiltration of soils. The c parameter value of 0.500 can be representative of the infiltration behavior of many soils for non-ponded conditions, and consequently, the equation can be converted into a two-parameter one. The determination of Ks, S, and c using one-dimensional vertical infiltration data from eight soils was also investigated with the help of the Excel Solver application. The results showed that when all three parameters are considered as adjustment parameters, accurate predictions of S and Ks are not achieved, while if the parameter c is fixed at 0.500, the prediction of S and Ks is very satisfactory. Specifically, in the first case, the maximum relative error values were 33.29% and 39.53% for S and Ks, respectively, while for the second case, the corresponding values were 13.25% and 17.42%. Full article
Show Figures

Figure 1

16 pages, 3794 KiB  
Article
Modeling Surface Water–Groundwater Interactions: Evidence from Borkena Catchment, Awash River Basin, Ethiopia
by Wallelegn Jene Gobezie, Ermias Teferi, Yihun T. Dile, Haimanote K. Bayabil, Gebiaw T. Ayele and Girma Y. Ebrahim
Hydrology 2023, 10(2), 42; https://doi.org/10.3390/hydrology10020042 - 03 Feb 2023
Cited by 3 | Viewed by 2071
Abstract
The availability of sufficient water resources is critical for sustainable social and economic development globally. However, recurrent drought has been a precursor to inadequate water supply in the case of Borkena Catchment, Awash River Basin, Ethiopia. To support the conjunctive use and management [...] Read more.
The availability of sufficient water resources is critical for sustainable social and economic development globally. However, recurrent drought has been a precursor to inadequate water supply in the case of Borkena Catchment, Awash River Basin, Ethiopia. To support the conjunctive use and management of surface water and groundwater in Borkena Catchment, an integrated model was developed using the SWAT–MODFLOW model. The model was designed to operate on a monthly time scale. The change in the water balance obtained from the SWAT–MODFLOW model provides a quantitative means to assess the effect of the climate variability and changes, as well as the impact of human activities, on water resources. To advance the understanding at the regional and local scales, surface water–groundwater interactions in the Borkena Catchment geochemical information and piezometer maps were integrated. The results show that the groundwater recharge in the study area is approximately 122 mm/a. The surface water–groundwater interaction results show that the areas around Harbu and Dessie are characterized as losing rivers, while the areas around Kemisse-Chefa and the highlands of Kutaber, where the Borkena River originates, are characterized as gaining rivers. A geochemical analysis indicated that there is an inter-basin groundwater transfer from the Abbay to the Awash basin. The integrated model generated key temporal and spatial information that is useful for the sustainable conjunctive management of surface and groundwater in Borkena Catchment for climate resilience in the face of climate variability and increasing demand. Full article
Show Figures

Figure 1

18 pages, 3490 KiB  
Article
Precipitation, Vegetation, and Groundwater Relationships in a Rangeland Ecosystem in the Chihuahuan Desert, Northern Mexico
by Carlos G. Ochoa, Federico Villarreal-Guerrero, Jesús A. Prieto-Amparán, Hector R. Garduño, Feng Huang and Carlos Ortega-Ochoa
Hydrology 2023, 10(2), 41; https://doi.org/10.3390/hydrology10020041 - 01 Feb 2023
Viewed by 2170
Abstract
For this study, conducted in a semiarid (318 mm) rangeland setting in the Chihuahuan Desert region in northern Mexico, we evaluated the seasonal and interannual variability of precipitation, vegetation, and groundwater relations. Between 2012 and 2014, a series of soil and water conservation [...] Read more.
For this study, conducted in a semiarid (318 mm) rangeland setting in the Chihuahuan Desert region in northern Mexico, we evaluated the seasonal and interannual variability of precipitation, vegetation, and groundwater relations. Between 2012 and 2014, a series of soil and water conservation practices (e.g., land imprinting, contour furrows, and planting of native shrub species) were conducted in several areas within the 2500 ha study site. Since 2014, the site has been gradually instrumented to monitor several hydrologic variables, including rainfall, soil water content, and groundwater. The Normalized Difference Vegetation Index (NDVI) and Normalized Difference Infrared Index (NDII) vegetation indices were used to evaluate vegetation conditions between 2007 and 2021, before and after the treatment. Soil water content and groundwater began to be monitored in 2014 and 2016, respectively. Study results show that NDVI and NDII values were higher in the years following the treatment. A negative trend in NDVI values was observed in the years before restoration and reversed in the post-treatment years. The relatively low levels of soil water content obtained every year followed a seasonal response to precipitation inputs characterized by a quick rise and decline at the 0.2 m depth and a more gradual rise and decline for sensors at 0.5 m and 0.8 m depths. A positive trend in groundwater levels has been observed since the onset of monitoring in 2016, with seasonal groundwater levels rising between 0.7 m and 1.3 m for most years, except for 2020, when levels dropped 1 m. The yearly recharge of the aquifer ranged between 102 mm and 197 mm. The conservation practices employed have positively affected the state of the rangeland ecosystem. The upward trends in NDVI, NDII, and groundwater levels observed in the post-treatment years were partly attributed to improved land conditions. The findings of this study contribute to the improved understanding of land use and environmental relations in summer precipitation-dominated rangeland ecosystems. Full article
Show Figures

Figure 1

18 pages, 4608 KiB  
Article
Preliminary Analyses of the Hydro-Meteorological Characteristics of Hurricane Fiona in Puerto Rico
by Carlos E. Ramos Scharrón, José Javier Hernández Ayala, Eugenio Y. Arima and Francis Russell
Hydrology 2023, 10(2), 40; https://doi.org/10.3390/hydrology10020040 - 01 Feb 2023
Cited by 3 | Viewed by 2655
Abstract
The Caribbean has displayed a capacity to fulfill climate change projections associated with tropical cyclone-related rainfall and flooding. This article describes the hydrometeorological characteristics of Hurricane Fiona in Puerto Rico in September 2022 in terms of measured and interpolated rainfall and observed peak [...] Read more.
The Caribbean has displayed a capacity to fulfill climate change projections associated with tropical cyclone-related rainfall and flooding. This article describes the hydrometeorological characteristics of Hurricane Fiona in Puerto Rico in September 2022 in terms of measured and interpolated rainfall and observed peak flows relative to previous tropical cyclones from 1899 to 2017. Hurricane Fiona ranks third overall in terms of island-wide total rainfall and fourth in terms of daily rainfall. Maximum daily rainfall during Hurricane Fiona exceeded those previously reported (excluding Hurricane María in 2017) in the eastern interior and eastern portions of the island. In terms of peak flows, no value approached the world’s or Puerto Rico’s flood envelope, although 69% of the observations are considered ‘exceptional’. About 26% and 29% of all peak flows were in the 5–10 year and 10–25 year recurrence interval ranges, respectively, yet none matched the 25-year levels. The highest peak flows were concentrated in the central-eastern and southeastern regions. Even though Hurricane María provoked a more extreme hydrometeorological response, some of Hurricane Fiona’s hydro-meteorological characteristics were among the highest ever recorded in Puerto Rico, particularly for the south-central and eastern portions of the island, and it displayed the island’s current level of vulnerability to extreme rainfall. Full article
(This article belongs to the Section Hydrology–Climate Interactions)
Show Figures

Figure 1

2 pages, 175 KiB  
Editorial
Editorial to the Special Issue “Hydrological Applications and Cooperation Projects in Developing Countries”
by Alain Dezetter and Alessio Radice
Hydrology 2023, 10(2), 39; https://doi.org/10.3390/hydrology10020039 - 31 Jan 2023
Viewed by 984
Abstract
Most of the global population lives in developing countries that are highly prone to hydrological phenomena (such as monsoons, floods, cyclones, droughts, aridity, etc [...] Full article
18 pages, 3155 KiB  
Article
A Qualitative Assessment of River Plumes Coupling SWAT Model Simulations and a Beach Optical Monitoring System
by Nada Joumar, Soumaya Nabih, Antonis Chatzipavlis, Adonis Velegrakis, Thomas Hasiotis, Ourania Tzoraki, Jamal Eddine Stitou El Messari and Lahcen Benaabidate
Hydrology 2023, 10(2), 38; https://doi.org/10.3390/hydrology10020038 - 30 Jan 2023
Viewed by 1740
Abstract
The study of plumes occurring at the mouth of small rivers of temporal flow is a challenging task due to the lack of sedimentological and flow data of appropriate spatiotemporal scales. The present contribution examined the case of a typical un-gauged intermittent Mediterranean [...] Read more.
The study of plumes occurring at the mouth of small rivers of temporal flow is a challenging task due to the lack of sedimentological and flow data of appropriate spatiotemporal scales. The present contribution examined the case of a typical un-gauged intermittent Mediterranean stream located in Northern Crete (Xiropotamos river). The SWAT (soil and water assessment tool) model was used to simulate and reproduce the hydrological behavior of the adjacent intermittent (Giofyros) river discharging at the same beach, the basin of which has the same geomorphological and hydrological characteristics. The output of the calibrated SWAT model was used to simulate daily flow data for the year 2014. The results were then considered together with the results of the RGB analysis of optical datasets of high spatio-temporal resolution for the same period, derived from a beach optical monitoring system (BOMS). The RGB analysis of the optical (TIMEX) imagery was shown to be a useful technique to identify and classify coastal plumes by using the spatio-temporal variability of pixel properties. The technique was also shown to be useful for the (qualitative) validation of the SWAT output and could be further improved by the collection of ‘ground truth’ data. Full article
Show Figures

Figure 1

16 pages, 3611 KiB  
Article
Analyzing Spatial Trends of Precipitation Using Gridded Data in the Fez-Meknes Region, Morocco
by Ridouane Kessabi, Mohamed Hanchane, Tommaso Caloiero, Gaetano Pellicone, Rachid Addou and Nir Y. Krakauer
Hydrology 2023, 10(2), 37; https://doi.org/10.3390/hydrology10020037 - 27 Jan 2023
Cited by 3 | Viewed by 2390
Abstract
The aim of this paper was to present a precipitation trend analysis using gridded data at annual, seasonal and monthly time scales over the Fez-Meknes region (northern Morocco) for the period 1961–2019. Our results showed a general decreasing trend at an annual scale, [...] Read more.
The aim of this paper was to present a precipitation trend analysis using gridded data at annual, seasonal and monthly time scales over the Fez-Meknes region (northern Morocco) for the period 1961–2019. Our results showed a general decreasing trend at an annual scale, especially over the mountain and the wetter parts of the region, which was statistically significant in 72% of the grid points, ranging down to −30 mm per decade. A general upward trend during autumn, but still non-significant in 95% of the grid points, was detected, while during winter, significant negative trends were observed in the southwest (−10 to −20 mm per decade) and northeast areas (more than −20 mm per decade) of the region. Spring rainfall significantly decreased in 86% of the grid points, with values of this trend ranging between 0 and −5 mm per decade in the upper Moulouya and −5 to −10 mm per decade over the rest of the region (except the northwest). At a monthly time scale, significant negative trends were recorded during December, February, March and April, primarily over the northeast Middle Atlas and the northwest tip of the region, while a significant upward trend was observed during the month of August, especially in the Middle Atlas. These results could help decision makers understand rainfall variability within the region and work out proper plans while taking into account the effects of climate change. Full article
(This article belongs to the Section Hydrology–Climate Interactions)
Show Figures

Figure 1

23 pages, 2607 KiB  
Perspective
Past, Present, and Future of Using Neuro-Fuzzy Systems for Hydrological Modeling and Forecasting
by Yik Kang Ang, Amin Talei, Izni Zahidi and Ali Rashidi
Hydrology 2023, 10(2), 36; https://doi.org/10.3390/hydrology10020036 - 26 Jan 2023
Cited by 1 | Viewed by 1951
Abstract
Neuro-fuzzy systems (NFS), as part of artificial intelligence (AI) techniques, have become popular in modeling and forecasting applications in many fields in the past few decades. NFS are powerful tools for mapping complex associations between inputs and outputs by learning from available data. [...] Read more.
Neuro-fuzzy systems (NFS), as part of artificial intelligence (AI) techniques, have become popular in modeling and forecasting applications in many fields in the past few decades. NFS are powerful tools for mapping complex associations between inputs and outputs by learning from available data. Therefore, such techniques have been found helpful for hydrological modeling and forecasting, including rainfall–runoff modeling, flood forecasting, rainfall prediction, water quality modeling, etc. Their performance has been compared with physically based models and data-driven techniques (e.g., regression-based methods, artificial neural networks, etc.), where NFS have been reported to be comparable, if not superior, to other models. Despite successful applications and increasing popularity, the development of NFS models is still challenging due to a number of limitations. This study reviews different types of NFS algorithms and discusses the typical challenges in developing NFS-based hydrological models. The challenges in developing NFS models are categorized under six topics: data pre-processing, input selection, training data selection, adaptability, interpretability, and model parameter optimization. At last, future directions for enhancing NFS models are discussed. This review–prospective article gives a helpful overview of the suitability of NFS techniques for various applications in hydrological modeling and forecasting while identifying research gaps for future studies in this area. Full article
(This article belongs to the Special Issue Stochastic and Deterministic Modelling of Hydrologic Variables)
Show Figures

Figure 1

21 pages, 1944 KiB  
Article
An Evaluation of Factors Influencing the Resilience of Flood-Affected Communities in China
by Wenping Xu, Yingchun Xie, Qimeng Yu and David Proverbs
Hydrology 2023, 10(2), 35; https://doi.org/10.3390/hydrology10020035 - 25 Jan 2023
Cited by 3 | Viewed by 2087
Abstract
In recent years, the acceleration of urbanization processes coupled with more frequent extreme weather including more severe flood events, have led to an increase in the complexity of managing community flood resilience. This research presents an empirical study to explore the factors influencing [...] Read more.
In recent years, the acceleration of urbanization processes coupled with more frequent extreme weather including more severe flood events, have led to an increase in the complexity of managing community flood resilience. This research presents an empirical study to explore the factors influencing community flood resilience in six communities located in the Hubei Province of China. The study presents the development of a flood resilience evaluation index system, comprising the use of the decision-making trial and evaluation laboratory (DEMATEL) and interpretative structural modeling method (ISM) methods. The results show that the three most important factors affecting the flood resilience capacity of the community are (i) the investment in disaster prevention, (ii) disaster relief capacity and (iii) flood control and drainage capacity. The differences between the six communities were analyzed across four dimensions to reveal the strengths and weaknesses of the communities across these dimensions and in terms of their overall resilience. By analyzing the causal hierarchical relationship that affects community flood resilience, this study helps to enhance community resilience to flood disasters and reduce disaster risk. These findings are conducive to enhancing the sustainable development of urban communities and are expected to provide scientific guidance for community risk management and strategic decision-making. Full article
Show Figures

Figure 1

21 pages, 2973 KiB  
Article
Fuzzy Unsteady-State Drainage Solution for Land Reclamation
by Christos Tzimopoulos, Nikiforos Samarinas, Kyriakos Papadopoulos and Christos Evangelides
Hydrology 2023, 10(2), 34; https://doi.org/10.3390/hydrology10020034 - 24 Jan 2023
Cited by 2 | Viewed by 1740
Abstract
Very well-drained lands could have a positive impact in various soil health indicators such as soil erosion and soil texture. A drainage system is responsible for properly aerated soil. Until today, in order to design a drainage system, a big challenge remained to [...] Read more.
Very well-drained lands could have a positive impact in various soil health indicators such as soil erosion and soil texture. A drainage system is responsible for properly aerated soil. Until today, in order to design a drainage system, a big challenge remained to find the subsurface drain spacing because many of the soil and hydraulic parameters present significant uncertainties. This fact also creates uncertainties to the overall physical problem solution, which, if not included in the preliminary design studies and calculations, could have bad consequences for the cultivated lands and soils. Finding the drain spacing requires the knowledge of the unsteady groundwater movement, which is described by the linear Boussinesq equation (Glover-Dumm equation). In this paper, the Adomian solution to the second order unsteady linear fuzzy partial differential one-dimensional Boussinesq equation is presented. The physical problem concerns unsteady drain spacing in a semi-infinite unconfined aquifer. The boundary conditions, with an initially horizontal water table, are considered fuzzy and the overall problem is translated to a system of crisp boundary value problems. Consequently, the crisp problem is solved using an Adomian decomposition method (ADM) and useful practical results are presented. In addition, by application of the possibility theory, the fuzzy results are translated into a crisp space, enabling the decision maker to make correct decisions about both the drain spacing and the future soil health management practices, with a reliable degree of confidence. Full article
(This article belongs to the Special Issue Groundwater Management)
Show Figures

Figure 1

32 pages, 6796 KiB  
Article
Determination of Environmental Flows in Data-Poor Estuaries—Wami River Estuary in Saadani National Park, Tanzania
by Amartya K. Saha, Japhet Kashaigili, Fredrick Mashingia, Halima Kiwango, Mercy Asha Mohamed, Michael Kimaro, Mathias Msafiri Igulu, Patroba Matiku, Rosemary Masikini, Rashid Tamatamah, Ismail Omary, Tumaini Magesa, Pendo Hyera, Roman Evarist and Maria C. Donoso
Hydrology 2023, 10(2), 33; https://doi.org/10.3390/hydrology10020033 - 23 Jan 2023
Cited by 4 | Viewed by 1935
Abstract
Land use changes and mounting water demands reduce freshwater inflows into estuaries, impairing estuarine ecosystems and accelerating coastal seawater intrusion. However, determining minimum river inflows for management guidelines is hampered by a lack of ecosystem-flow link data. This study describes the development of [...] Read more.
Land use changes and mounting water demands reduce freshwater inflows into estuaries, impairing estuarine ecosystems and accelerating coastal seawater intrusion. However, determining minimum river inflows for management guidelines is hampered by a lack of ecosystem-flow link data. This study describes the development of freshwater inflow guidelines for the Wami Estuary, combining scarce river flow data, hydrological modeling, inferring natural salinity regime from vegetation zonation and investigating freshwater requirements of people/wildlife. By adopting the Building Blocks Methodology, a detailed Environmental Flows Assessment was performed to know the minimum water depth/quality seasonal requirements for vegetation, terrestrial/aquatic wildlife and human communities. Water depth requirements were assessed for drought and normal rainfall years; corresponding discharges were obtained by a hydrological model (HEC-RAS) developed for the river channel upstream of estuary. Recommended flows were well within historically occurring flows. However, given the rapidly increasing water demand coupled with reduction in basin water storage due to deforestation/wetland loss, it is critical to ensure these minimum flows are present, without which essential ecosystem services (fisheries, water quality, mangrove forest resources and wildlife/tourism) will be jeopardized. The EFA process is described in painstaking detail to provide a reference for undertaking similar studies in data-poor regions worldwide. Full article
(This article belongs to the Special Issue Aquatic Ecosystems and Water Resources)
Show Figures

Figure 1

22 pages, 6102 KiB  
Article
Hydrogeochemical and Stable Isotope Data of the Groundwater of a Multi-Aquifer System in the Maknessy Basin (Mediterranean Area, Central Tunisia)
by Zouhour Moussaoui, Matteo Gentilucci, Khyria Wederni, Naima Hidouri, Monji Hamedi, Zahra Dhaoui and Younes Hamed
Hydrology 2023, 10(2), 32; https://doi.org/10.3390/hydrology10020032 - 22 Jan 2023
Cited by 2 | Viewed by 2424
Abstract
The Maknessy plain in central Tunisia is one of the most important agricultural basins in Tunisia. Given the semi-arid climate conditions, the irrigation of cultivated crops relies principally on the abstraction from groundwater resources. The assessment of the quality of the used water [...] Read more.
The Maknessy plain in central Tunisia is one of the most important agricultural basins in Tunisia. Given the semi-arid climate conditions, the irrigation of cultivated crops relies principally on the abstraction from groundwater resources. The assessment of the quality of the used water for agricultural purposes is crucial for safe production. Thus, the objective of this work is to assess the physicochemical quality of the irrigation water resources in this catchment area using a combined chemical, isotopic, and statistical approach. The waters analyzed are represented by two types of groundwater, mainly calcium hyper chloride and calcium sulfate. A multivariate statistical analysis (PCA and HCA) and a geochemical approach have been applied to study water quality as a function of chemical parameters, showing that the EC and TDS are the parameters influencing water quality. The stable isotopic compositions of the sampled waters range from −7.53 to −4.90% vs. VSMOW and from −53.6 to −32.2% vs. VSMOW for δ18O and δ2H; they show the exchange between groundwater and rock and the evaporation effect. The isotopic data form three groups such as recent water, paleowater, and mixing water indicate the evaporation effect and interaction of the groundwater, and confirm that this aquifer has been recharged by current rainwater. So, these aquifers were recharged by precipitation derived from a mixture of cloud masses from the Atlantic Ocean and the Mediterranean Sea. The findings of this research are of important relevance for effective water resources management in this agro-based region. Indeed, the increased exploitation of these resources will induce a continuous reduction in the available resources and progressive degradation of the used water quality that may adversely impact the safe agricultural production and the economic resilience of the local population. Full article
Show Figures

Figure 1

22 pages, 4845 KiB  
Article
Assessing the Potential of Combined SMAP and In-Situ Soil Moisture for Improving Streamflow Forecast
by Shimelis Asfaw Wakigari and Robert Leconte
Hydrology 2023, 10(2), 31; https://doi.org/10.3390/hydrology10020031 - 20 Jan 2023
Cited by 1 | Viewed by 1731
Abstract
Soil moisture is an essential hydrological variable for a suite of hydrological applications. Its spatio-temporal variability can be estimated using satellite remote sensing (e.g., SMOS and SMAP) and in-situ measurements. However, both have their own strengths and limitations. For example, remote sensing has [...] Read more.
Soil moisture is an essential hydrological variable for a suite of hydrological applications. Its spatio-temporal variability can be estimated using satellite remote sensing (e.g., SMOS and SMAP) and in-situ measurements. However, both have their own strengths and limitations. For example, remote sensing has the strength of maintaining the spatial variability of near-surface soil moisture, while in-situ measurements are accurate and preserve the dynamics range of soil moisture at both surface and larger depths. Hence, this study is aimed at (1) merging the strength of SMAP with in-situ measurements and (2) exploring the effectiveness of merged SMAP/in-situ soil moisture in improving ensemble streamflow forecasts. The conditional merging technique was adopted to merge the SMAP-enhanced soil moisture (9 km) and its downscaled version (1 km) separately with the in-situ soil moisture collected over the au Saumon watershed, a 1025 km2 watershed located in Eastern Canada. The random forest machine learning technique was used for downscaling of the near-surface SMAP-enhanced soil moisture to 1 km resolution, whereas the exponential filter was used for vertical extrapolation of the SMAP near-surface soil moisture. A simple data assimilation technique known as direct insertion was used to update the topsoil layer of a physically-based distributed hydrological model with four soil moisture products: (1) the merged SMAP/in-situ soil moisture at 9 and 1 km resolutions; (2) the original SMAP-enhanced (9 km), (3) downscaled SMAP-enhanced (1 km), and (4) interpolated in-situ surface soil moisture. In addition, the vertically extrapolated merged SMAP/in-situ soil moisture and subsurface (rootzone) in-situ soil moisture were used to update the intermediate layer of the model. Results indicate that downscaling of the SMAP-enhanced soil moisture to 1 km resolution improved the spatial variability of soil moisture while maintaining the spatial pattern of its original counterpart. Similarly, merging of the SMAP with in- situ soil moisture preserved the dynamic range of in-situ soil moisture and maintained the spatial heterogeneity of SMAP soil moisture. Updating of the top layer of the model with the 1 km merged SMAP/in-situ soil moisture improved the ensemble streamflow forecast compared to the model updated with either the SMAP-enhanced or in-situ soil moisture alone. On the other hand, updating the top and intermediate layers of the model with surface and vertically extrapolated SMAP/in-situ soil moisture, respectively, did not further improve the accuracy of the ensemble streamflow forecast. Overall, this study demonstrated the potential of merging the SMAP and in-situ soil moisture for streamflow forecast. Full article
Show Figures

Graphical abstract

17 pages, 2020 KiB  
Article
Influences of Urban Discharges and Urban Heat Effects on Stream Temperature
by Anja Svane Kolath and Sara Egemose
Hydrology 2023, 10(2), 30; https://doi.org/10.3390/hydrology10020030 - 19 Jan 2023
Cited by 3 | Viewed by 1898
Abstract
Urban areas with dark and impermeable surfaces are known to have a heating effect on air and still water compared to surrounding areas, called the urban heat island effect (UHI). UHI and stormwater discharges’ collective impact on stream temperature, especially regarding seasonal changes, [...] Read more.
Urban areas with dark and impermeable surfaces are known to have a heating effect on air and still water compared to surrounding areas, called the urban heat island effect (UHI). UHI and stormwater discharges’ collective impact on stream temperature, especially regarding seasonal changes, is a less-studied field. In this study, the temperature effect of the urban village Aarslev on Stream Vindinge in Southern Denmark was examined. Loggers (ID A–L) were placed in Stream Vindinge in 2020–2021, measuring temperature (°C) and pressure (kPa). Outlets were analyzed with respect to origin: Direct stormwater outlets (rain ÷ basin), stormwater delayed by ponds (rain + basin), common overflow, and common sewage from WWTP. Data showed the stream temperature rise through Aarslev village in all months (except March) with 0.3–1.9 °C, most notably in the summer months. A one-way ANOVA confirmed that the upstream station A and downstream station K were significantly different (p-values < 0.001). No significant difference in temperatures between the different outlet types was found. An increase in stream temperature was observed in response to rain events, followed by a temperature decrease. This was assumed to be a “first heat flush”. This was speculated to mean less optimal conditions for trout and sensitive macroinvertebrates not because of heat shock, but rather to lower O2 concentrations and higher mineralization. River and lake temperatures are projected to increase, and this effect might become more pronounced. A decrease in stream temperature was observed after the village (station L). Therefore, it was concluded that the rise in temperature through the village was due to UHI. Full article
(This article belongs to the Special Issue Stormwater/Drainage Systems and Wastewater Management)
Show Figures

Figure 1

32 pages, 13422 KiB  
Article
ML-Based Streamflow Prediction in the Upper Colorado River Basin Using Climate Variables Time Series Data
by Pouya Hosseinzadeh, Ayman Nassar, Soukaina Filali Boubrahimi and Shah Muhammad Hamdi
Hydrology 2023, 10(2), 29; https://doi.org/10.3390/hydrology10020029 - 19 Jan 2023
Cited by 10 | Viewed by 3042
Abstract
Streamflow prediction plays a vital role in water resources planning in order to understand the dramatic change of climatic and hydrologic variables over different time scales. In this study, we used machine learning (ML)-based prediction models, including Random Forest Regression (RFR), Long Short-Term [...] Read more.
Streamflow prediction plays a vital role in water resources planning in order to understand the dramatic change of climatic and hydrologic variables over different time scales. In this study, we used machine learning (ML)-based prediction models, including Random Forest Regression (RFR), Long Short-Term Memory (LSTM), Seasonal Auto- Regressive Integrated Moving Average (SARIMA), and Facebook Prophet (PROPHET) to predict 24 months ahead of natural streamflow at the Lees Ferry site located at the bottom part of the Upper Colorado River Basin (UCRB) of the US. Firstly, we used only historic streamflow data to predict 24 months ahead. Secondly, we considered meteorological components such as temperature and precipitation as additional features. We tested the models on a monthly test dataset spanning 6 years, where 24-month predictions were repeated 50 times to ensure the consistency of the results. Moreover, we performed a sensitivity analysis to identify our best-performing model. Later, we analyzed the effects of considering different span window sizes on the quality of predictions made by our best model. Finally, we applied our best-performing model, RFR, on two more rivers in different states in the UCRB to test the model’s generalizability. We evaluated the performance of the predictive models using multiple evaluation measures. The predictions in multivariate time-series models were found to be more accurate, with RMSE less than 0.84 mm per month, R-squared more than 0.8, and MAPE less than 0.25. Therefore, we conclude that the temperature and precipitation of the UCRB increases the accuracy of the predictions. Ultimately, we found that multivariate RFR performs the best among four models and is generalizable to other rivers in the UCRB. Full article
(This article belongs to the Special Issue Stochastic and Deterministic Modelling of Hydrologic Variables)
Show Figures

Graphical abstract

13 pages, 3056 KiB  
Article
Evaluation of Ensemble Inflow Forecasts for Reservoir Management in Flood Situations
by Juliana Mendes and Rodrigo Maia
Hydrology 2023, 10(2), 28; https://doi.org/10.3390/hydrology10020028 - 19 Jan 2023
Cited by 1 | Viewed by 1713
Abstract
This paper describes the process of analysis and verification of ensemble inflow forecasts to the multi-purpose reservoir of Aguieira, located in the Mondego River, in the center of Portugal. This process was performed to select and validate the reference inflows for the management [...] Read more.
This paper describes the process of analysis and verification of ensemble inflow forecasts to the multi-purpose reservoir of Aguieira, located in the Mondego River, in the center of Portugal. This process was performed to select and validate the reference inflows for the management of a reservoir with flood control function. The ensemble inflow forecasts for the next 10-day period were generated forcing a hydrological model with quantitative precipitation forecasts from the High-Resolution Model (HRES) and the Ensemble Prediction System (EPS) of the European Center for Medium-range Weather Forecasts (ECMWF). Due to the uncertainty of the ensemble forecasts, a reference forecast to be considered for operational decisions in the management of reservoirs and to take protection measures from floods was proved necessary. This reference forecast should take into account the close agreement of the various forecasts performed for the same period as also the adjustment to the corresponding observed data. Thus, taking into account the conclusions derived from the evaluation process of the consistency and the quality of the ensemble forecasts, the reference inflow forecast to the Aguieira reservoir was defined by the maximum value of the ensemble in the first 72 h of the forecast period and by the 75th percentile in the following hours (from 72 to 240 h). Full article
Show Figures

Figure 1

21 pages, 11632 KiB  
Article
Application of Neural Networks for Hydrologic Process Understanding at a Midwestern Watershed
by Annushka Aliev, Sinan Rasiya Koya, Incheol Kim, Jongwan Eun, Elbert Traylor and Tirthankar Roy
Hydrology 2023, 10(2), 27; https://doi.org/10.3390/hydrology10020027 - 18 Jan 2023
Viewed by 1538
Abstract
The Shell Creek Watershed (SCW) is a rural watershed in Nebraska with a history of chronic flooding. Beginning in 2005, a variety of conservation practices have been employed in the watershed. Those practices have since been credited with attenuating flood severity and improving [...] Read more.
The Shell Creek Watershed (SCW) is a rural watershed in Nebraska with a history of chronic flooding. Beginning in 2005, a variety of conservation practices have been employed in the watershed. Those practices have since been credited with attenuating flood severity and improving water quality in SCW. This study investigated the impacts of 13 different controlling factors on flooding at SCW by using an artificial neural network (ANN)-based rainfall-runoff model. Additionally, flood frequency analysis and drought severity analysis were conducted. Special emphasis was placed on understanding how flood trends change in light of conservation practices to determine whether any relation exists between the conservation practices and flood peak attenuation, as the strategic conservation plan implemented in the watershed provides a unique opportunity to examine the potential impacts of conservation practices on the watershed. The ANN model developed in this study showed satisfactory discharge–prediction performance, with a Kling–Gupta Efficiency (KGE) value of 0.57. It was found that no individual controlling variable used in this study was a significantly better predictor of flooding in SCW, and therefore all 13 variables were used as inputs, which resulted in the satisfactory ANN model discharge–prediction performance. Furthermore, it was observed that after conservation planning was implemented in SCW, the magnitude of anomalous peak flows increased, while the magnitude of annual peak flows decreased. However, more comprehensive assessment is necessary to identify the relative impacts of conservation practices on flooding in the basin. Full article
Show Figures

Figure 1

32 pages, 54099 KiB  
Article
Flood Risk Assessment and Mapping: A Case Study from Australia’s Hawkesbury-Nepean Catchment
by Matthew Kelly, Imogen Schwarz, Mark Ziegelaar, Andrew B. Watkins and Yuriy Kuleshov
Hydrology 2023, 10(2), 26; https://doi.org/10.3390/hydrology10020026 - 17 Jan 2023
Cited by 6 | Viewed by 4319
Abstract
Floods are the most common and costliest natural disaster in Australia. Australian flood risk assessments (FRAs) are mostly conducted on relatively small scales using modelling outputs. The aim of this study was to develop a novel approach of index-based analysis using a multi-criteria [...] Read more.
Floods are the most common and costliest natural disaster in Australia. Australian flood risk assessments (FRAs) are mostly conducted on relatively small scales using modelling outputs. The aim of this study was to develop a novel approach of index-based analysis using a multi-criteria decision-making (MCDM) method for FRA on a large spatial domain. The selected case study area was the Hawkesbury-Nepean Catchment (HNC) in New South Wales, which is historically one of the most flood-prone regions of Australia. The HNC’s high flood risk was made distinctly clear during recent significant flood events in 2021 and 2022. Using a MCDM method, an overall Flood Risk Index (FRI) for the HNC was calculated based on flood hazard, flood exposure, and flood vulnerability indices. Inputs for the indices were selected to ensure that they are scalable and replicable, allowing them to be applied elsewhere for future flood management plans. The results of this study demonstrate that the HNC displays high flood risk, especially on its urbanised floodplain. For the examined March 2021 flood event, the HNC was found to have over 73% (or over 15,900 km2) of its area at ‘Severe’ or ‘Extreme’ flood risk. Validating the developed FRI for correspondence to actual flooding observations during the March 2021 flood event using the Receiver Operating Characteristic (ROC) statistical test, a value of 0.803 was obtained (i.e., very good). The developed proof-of-concept methodology for flood risk assessment on a large spatial scale has the potential to be used as a framework for further index-based FRA approaches. Full article
Show Figures

Figure 1

7 pages, 187 KiB  
Editorial
Acknowledgment to the Reviewers of Hydrology in 2022
by Hydrology Editorial Office
Hydrology 2023, 10(2), 25; https://doi.org/10.3390/hydrology10020025 - 17 Jan 2023
Viewed by 1136
Abstract
High-quality academic publishing is built on rigorous peer review [...] Full article
Previous Issue
Next Issue
Back to TopTop