Next Issue
Volume 11, April
Previous Issue
Volume 11, February


Atmosphere, Volume 11, Issue 3 (March 2020) – 92 articles

Cover Story (view full-size image): 
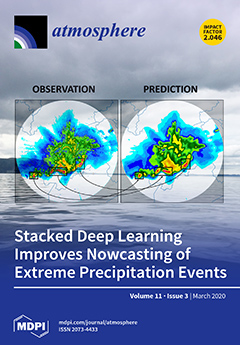
One of the most crucial applications of radar-based precipitation nowcasting systems is the short-term forecast of extreme rainfall. A novel method to improve deep learning prediction skills of extreme rainfall regimes is presented based on model stacking. A convolutional neural network is trained to combine an ensemble of deep learning models along with orographic features, doubling the prediction skills with respect to the ensemble members and their average on extreme rain rates, and outperforming them on all rain regimes. The ensemble is built by training four models with the same architecture over different rainfall thresholds. This combination can reach the same skill of Lagrangian persistence on extreme rain rates while retaining a superior performance on lower rain regimes. View this paper.
  • Issues are regarded as officially published after their release is announced to the table of contents alert mailing list.
  • You may sign up for e-mail alerts to receive table of contents of newly released issues.
  • PDF is the official format for papers published in both, html and pdf forms. To view the papers in pdf format, click on the "PDF Full-text" link, and use the free Adobe Reader to open them.
Order results
Result details
Section
Select all
Export citation of selected articles as:
12 pages, 3992 KiB  
Article
Generation of Viable Bacterial and Fungal Aerosols during Biomass Combustion
by Ekaterina Mirskaya and Igor E. Agranovski
Atmosphere 2020, 11(3), 313; https://doi.org/10.3390/atmos11030313 - 24 Mar 2020
Cited by 3 | Viewed by 2385
Abstract
Biomass combustion is known to be one of the main contributors to air pollution. However, the influence of biomass burning on the distribution of viable bacterial and fungal aerosols is uncertain. This study aimed to examine survivability of bacteria and fungi in the [...] Read more.
Biomass combustion is known to be one of the main contributors to air pollution. However, the influence of biomass burning on the distribution of viable bacterial and fungal aerosols is uncertain. This study aimed to examine survivability of bacteria and fungi in the post-combustion products, and to investigate the aerosolization of viable cells during combustion of different types of organic materials. Laboratory experiments included a small-scale combustion of organic materials contaminated with microorganisms in order to determine the survivability of microbes in the combustion products and the potential aerosolization of viable cells during combustion. Field experiments were completed during intentional and prescribed biomass burning events in order to investigate the aerosolization mechanisms that are not available at the laboratory scale. Laboratory experiments did not demonstrate aerosolization of microorganisms during biomass combustion. However, the relatively high survival rate of bacteria in the combustion products ought to be accounted for, as the surviving microorganisms can potentially be aerosolized by high velocity natural air flows. Field investigations demonstrated significant increase in the bioaerosol concentration above natural background during and after biomass combustion. Full article
(This article belongs to the Special Issue Detection and Monitoring of Bioaerosols)
Show Figures

Figure 1

19 pages, 3755 KiB  
Article
Pillars of Solution for the Problem of Winter PM2.5 Variability in Fresno—Effects of Local Meteorology and Emissions
by Thishan Dharshana Karandana Gamalathge, Mark C. Green and William R. Stockwell
Atmosphere 2020, 11(3), 312; https://doi.org/10.3390/atmos11030312 - 23 Mar 2020
Cited by 1 | Viewed by 3302
Abstract
The mass composition of Particulate Matter (PM) with an aerodynamic diameter of 2.5 microns (PM2.5) in San Joaquin Valley (SJV) is dominated by ammonium nitrate (NH4NO3), a secondary pollutant. The goal of this research was the investigation [...] Read more.
The mass composition of Particulate Matter (PM) with an aerodynamic diameter of 2.5 microns (PM2.5) in San Joaquin Valley (SJV) is dominated by ammonium nitrate (NH4NO3), a secondary pollutant. The goal of this research was the investigation of the relationship between emissions, meteorology and PM2.5 concentrations in Fresno for the winter season. It was found that location of sites near emission sources such as freeways compared with residential sites strongly affected measured PM2.5 concentrations. It was found that although long-term trends showed declines in both emissions and PM2.5 concentrations, there was substantial variability between the years in the PM2.5–emissions relationship. Much of the yearly variation in the relationship between emissions and PM2.5 concentrations can be attributed to yearly variations in weather, such as atmospheric stability, precipitation frequency and average wind speed. There are moderate correlations between PM2.5 concentrations and temperature differences between nearby surface stations at varying elevations which explains some of the daily and seasonal variation in PM2.5. Occurrence of precipitation was related to low PM 2.5, although the higher wind speeds and lower atmospheric stability associated with precipitation likely explain some of the low PM2.5 as well as washout of PM. Full article
(This article belongs to the Special Issue Atmospheric Aerosols in North America)
Show Figures

Figure 1

16 pages, 4066 KiB  
Article
Improvement of Fog Simulation by the Nudging of Meteorological Tower Data in the WRF and PAFOG Coupled Model
by Wonheung Kim, Seong Soo Yum, Jinkyu Hong and Jae In Song
Atmosphere 2020, 11(3), 311; https://doi.org/10.3390/atmos11030311 - 23 Mar 2020
Cited by 16 | Viewed by 3250
Abstract
Improvement of fog simulation accuracy was investigated for the fogs that occurred on the south coast of the Korean Peninsula using the WRF (3D) and PAFOG (1D) coupled model. In total, 22 fog cases were simulated and accuracy of the fog simulation was [...] Read more.
Improvement of fog simulation accuracy was investigated for the fogs that occurred on the south coast of the Korean Peninsula using the WRF (3D) and PAFOG (1D) coupled model. In total, 22 fog cases were simulated and accuracy of the fog simulation was examined based on Critical Success Index, Hit Rate and False Alarm Rate. The performance of the coupled WRF-PAFOG model was better than that of the single WRF model as expected. However, much more significant improvement appeared only when the data from a 300 m meteorological tower was not only used for the initial conditions but also nudged during the simulation. Moreover, a proper prescription of soil moisture was found to be important for accurate fog simulation especially for the fog cases with prior precipitation since efficient moisture supply from the precipitation-soaked soil might have been critical for fog formation. It was also demonstrated that with such optimal coupled model setting, a coastal radiation fog event with prior precipitation could be very realistically simulated: the fog onset and dissipation times matched so well with observation. In detail, radiative cooling at the surface was critical to form a surface inversion layer as the night fell. Then the vapor flux from the precipitation-soaked surface was confined within the inversion layer to form fog. It is suggested that a proper prescription of soil moisture in the model based on observations, if readily available, could be a cost-effective method for improving operational fog forecasting, considering the fact that tall meteorological towers are a rarity in the world. Full article
(This article belongs to the Special Issue Observation, Simulation and Predictability of Fog )
Show Figures

Figure 1

13 pages, 3958 KiB  
Article
Compositional Characteristics of Atmospheric Aerosols during a Consecutive High Concentration Episode in Seoul, Korea
by Hee-Jung Ko, Seung Joo Song, Jeong Eun Kim, Jung-Min Song and Joo Wan Cha
Atmosphere 2020, 11(3), 310; https://doi.org/10.3390/atmos11030310 - 22 Mar 2020
Cited by 2 | Viewed by 2697
Abstract
This study focuses on the temporal variation in the compositional characteristics of atmospheric aerosols in Seoul, South Korea, during the consecutive high aerosol concentration episode from 30 December 2013 to 2 January 2014. The temporal variations in the observed physical, optical, and chemical [...] Read more.
This study focuses on the temporal variation in the compositional characteristics of atmospheric aerosols in Seoul, South Korea, during the consecutive high aerosol concentration episode from 30 December 2013 to 2 January 2014. The temporal variations in the observed physical, optical, and chemical properties show that there were three distinct episodes during the period: haze, mixed haze/Asian dust, and Asian dust episodes. For the haze period, the concentration of secondary inorganic aerosols increased and both secondary inorganic aerosols and calcium species exhibited simultaneously high concentrations during the mixed haze/Asian dust period. The neutralization factors by ammonia in the haze periods were higher as 1.03 than the other periods, meanwhile the neutralization contribution by calcium carbonate was relatively higher as 1.39 during the Asian dust episode. The backward trajectory analysis showed that concentrations of SO42−, NO3, and NH4+ were relatively high when air masses moved over East China. Principal component analysis showed that water-soluble components originated from soil dust/incineration, secondary aerosols/biomass burning, and road dust from the haze aerosol. For the mixed haze/Asian dust episode, the major source of aerosols was estimated to have originated from soil dust, pollutants from fossil fuel combustion, biomass burning, and sea-salt emissions. Furthermore, the main sources of ionic species in the Asian dust aerosols were estimated to be sea-salt/soil dust, secondary aerosols/coal combustion, and road dust. Full article
(This article belongs to the Section Aerosols)
Show Figures

Graphical abstract

16 pages, 4622 KiB  
Article
Understanding the Variability of West African Summer Monsoon Rainfall: Contrasting Tropospheric Features and Monsoon Index
by Akintomide Afolayan Akinsanola and Wen Zhou
Atmosphere 2020, 11(3), 309; https://doi.org/10.3390/atmos11030309 - 22 Mar 2020
Cited by 16 | Viewed by 5253
Abstract
West African Summer Monsoon (WASM) rainfall exhibits large variability at interannual and decadal timescales, causing droughts and floods in many years. Therefore it is important to investigate the major tropospheric features controlling the WASM rainfall and explore its potential to develop an objective [...] Read more.
West African Summer Monsoon (WASM) rainfall exhibits large variability at interannual and decadal timescales, causing droughts and floods in many years. Therefore it is important to investigate the major tropospheric features controlling the WASM rainfall and explore its potential to develop an objective monsoon index. In this study, monthly mean reanalysis data from the National Centers for Environmental Prediction/National Center for Atmospheric Research (NCEP/NCAR) and monthly rainfall data from three gridded observations during the 65-year period of 1950–2014 were employed. Dry and wet rainfall years were identified using a standardized precipitation index. In a composite analysis of wet and dry years, the dynamical features controlling the WASM exhibit an obvious contrast between these years, and a weaker (stronger) African Easterly Jet (Tropical Easterly Jet) is observed during the wet years. Also, a well-developed and deep low-level westerly flow at about 850 hPa is evident in wet years while an obvious reversal is observed in dry years. Considering this, the main regions of the two easterly jet streams and low-level westerly wind are proposed for objectively defining an effective WASM index (WASMI). The results indicate that the WASMI defined herein can reflect variations in June–September rainfall over West Africa. The index exhibits most of the variabilities observed in the rainfall series, with high (low) index values occurring in the 1950–1960s (1970–1980s), suggesting that the WASMI is skilled in capturing the respective wet and dry rainfall episodes over the region. Also, the WASMI is significantly correlated (r = 0.8) with summer monsoon rainfall, which further affirms that it can indicate not only variability but also the intensity of WASM rainfall. Full article
(This article belongs to the Special Issue Trends in Hydrological and Climate Extremes in Africa)
Show Figures

Figure 1

16 pages, 3063 KiB  
Article
Global Dimming and Brightening Features during the First Decade of the 21st Century
by Nikolaos Hatzianastassiou, Eleftherios Ioannidis, Marios-Bruno Korras-Carraca, Maria Gavrouzou, Christos D. Papadimas, Christos Matsoukas, Nikolaos Benas, Angeliki Fotiadi, Martin Wild and Ilias Vardavas
Atmosphere 2020, 11(3), 308; https://doi.org/10.3390/atmos11030308 - 21 Mar 2020
Cited by 24 | Viewed by 4865
Abstract
Downward surface solar radiation (SSR) trends for the first decade of the 2000s were computed using a radiative transfer model and satellite and reanalysis input data and were validated against measurements from the reference global station networks Global Energy Balance Archive (GEBA) and [...] Read more.
Downward surface solar radiation (SSR) trends for the first decade of the 2000s were computed using a radiative transfer model and satellite and reanalysis input data and were validated against measurements from the reference global station networks Global Energy Balance Archive (GEBA) and Baseline Surface Radiation Network (BSRN). Under all-sky conditions, in spite of a somewhat patchy structure of global dimming and brightening (GDB), an overall dimming was found that is weaker in the Northern than in the Southern Hemisphere (−2.2 and −3.1 W m−2, respectively, over the 2001–2009 period). Dimming is observed over both land and ocean in the two hemispheres, but it is more remarkable over land areas of the Southern Hemisphere. The post-2000 dimming is found to have been primarily caused by clouds, and secondarily by aerosols, with total cloud cover contributing −1.4 W m−2 and aerosol optical thickness −0.7 W m−2 to the global average dimming of −2.65 W m−2. The evaluation of the model-computed GDB against BSRN and GEBA measurements indicates a good agreement, with the same trends for 65% and 64% of the examined stations, respectively. The obtained model results are in line with other studies for specific world regions and confirm the occurrence of an overall solar dimming over the globe during the first decade of 21st century. This post-2000 dimming has succeeded the global brightening observed in the 1990s and points to possible impacts on the ongoing global warming and climate change. Full article
(This article belongs to the Section Climatology)
Show Figures

Figure 1

20 pages, 2988 KiB  
Article
Evaluation of Meteorological Drought and Flood Scenarios over Kenya, East Africa
by Brian Ayugi, Guirong Tan, Rouyun Niu, Zeyao Dong, Moses Ojara, Lucia Mumo, Hassen Babaousmail and Victor Ongoma
Atmosphere 2020, 11(3), 307; https://doi.org/10.3390/atmos11030307 - 21 Mar 2020
Cited by 72 | Viewed by 8058
Abstract
This work examines drought and flood events over Kenya from 1981 to 2016 using the Standardized Precipitation–Evapotranspiration Index (SPEI). The spatiotemporal analysis of dry and wet events was conducted for 3 and 12 months. Extreme drought incidences were observed in the years 1987, [...] Read more.
This work examines drought and flood events over Kenya from 1981 to 2016 using the Standardized Precipitation–Evapotranspiration Index (SPEI). The spatiotemporal analysis of dry and wet events was conducted for 3 and 12 months. Extreme drought incidences were observed in the years 1987, 2000, 2006, and 2009 for SPEI-3, whilst the SPEI-12 demonstrated the manifestation of drought during the years 2000 and 2006. The SPEI showed that the wettest periods, 1997 and 1998, coincided with the El Nino event for both time steps. SPEI-3 showed a reduction in moderate drought events, while severe and extreme cases were on the increase tendencies towards the end of the twentieth century. Conversely, SPEI-12 depicted an overall increase in severe drought occurrence over the study location with ab observed intensity of −1.54 and a cumulative frequency of 64 months during the study period. Wet events showed an upward trend in the western and central highlands, while the rest of the regions showed an increase in dry events during the study period. Moreover, moderate dry/wet events predominated, whilst extreme events occurred least frequently across all grid cells. It is apparent that the study area experienced mild extreme dry events in both categories, although moderately severe dry events dominated most parts of the study area. A high intensity and frequency of drought was noted in SPEI-3, while the least occurrences of extreme events were recorded in SPEI-12. Though drought event prevailed across the study area, there was evidence of extreme flood conditions over the recent decades. These findings form a good basis for next step of research that will look at the projection of droughts over the study area based on regional climate models. Full article
(This article belongs to the Special Issue Climate Events and Extreme Weather)
Show Figures

Figure 1

28 pages, 4875 KiB  
Article
Spatiotemporal Trends of Aerosols over Urban Regions in Pakistan and Their Possible Links to Meteorological Parameters
by Gohar Ali, Yansong Bao, Waheed Ullah, Safi Ullah, Qin Guan, Xulin Liu, Lin Li, Yuhong Lei, Guangwen Li and Jun Ma
Atmosphere 2020, 11(3), 306; https://doi.org/10.3390/atmos11030306 - 21 Mar 2020
Cited by 35 | Viewed by 5114
Abstract
Aerosol optical depth (AOD) has become one of the most crucial parameters for climate change assessment on regional and global scales. The present study investigates trends in AOD using long-term data derived from moderate resolution imaging spectro-radiometer (MODIS) over twelve regions in Pakistan. [...] Read more.
Aerosol optical depth (AOD) has become one of the most crucial parameters for climate change assessment on regional and global scales. The present study investigates trends in AOD using long-term data derived from moderate resolution imaging spectro-radiometer (MODIS) over twelve regions in Pakistan. Different statistical tests are used to assess the annual and seasonal trends in AOD. Results reveal increasing AOD trends over most of the selected regions with an obvious increase over the north and northeastern parts of the study area. Annually, increasing trends (0.0002–0.0047 year−1) were observed over seven regions, with three being statistically significant. All the selected regions experience increasing AOD trends during the winter season with six being statistically significant while during the summer season seven regions experience increasing AOD trends and the remaining five exhibit the converse with two being statistically significant. The changes in the sign and magnitude of AOD trends have been attributed to prevailing meteorological conditions. The decreasing rainfall and increasing temperature trends mostly support the increasing AOD trend over the selected regions. The high/low AOD phases during the study period may be ascribed to the anomalies in mid-tropospheric relative humidity and wind fields. The summer season is generally characterized by high AOD with peak values observed over the regions located in central plains, which can be attributed to the dense population and enhanced concentration of industrial and vehicular emissions over this part of the study area. The results derived from the present study give an insight into aerosol trends and could form the basis for aerosol-induced climate change assessment over the study area. Full article
(This article belongs to the Section Aerosols)
Show Figures

Figure 1

13 pages, 2230 KiB  
Article
Gaseous Emissions from a Seagoing Ship under Different Operating Conditions in the Coastal Region of China
by Chunjiang Bai, Ying Li, Bingxin Liu, Zhaoyi Zhang and Peng Wu
Atmosphere 2020, 11(3), 305; https://doi.org/10.3390/atmos11030305 - 21 Mar 2020
Cited by 15 | Viewed by 3181
Abstract
Pollution caused by ship emissions has drawn attention from various countries. Because of the high density of ships in ports, channels, and anchorages and their proximity to the densely populated areas, ship emissions will considerably impact these areas. Herein, a Chinese seagoing ship [...] Read more.
Pollution caused by ship emissions has drawn attention from various countries. Because of the high density of ships in ports, channels, and anchorages and their proximity to the densely populated areas, ship emissions will considerably impact these areas. Herein, a Chinese seagoing ship is selected and a platform is established for monitoring the ship emissions to obtain detailed characteristics of the ship’s nearshore emissions. The ship navigation and pollution emission data are obtained under six complete operating conditions, i.e., berthing, manoeuvring in port, acceleration in a channel, cruising, deceleration before anchoring, and anchoring. This study analyzes the concentrations of the main emission gases (O2, NOX, SO2, CO2, and CO) and the average emission factors (EFs) of the pollution gases (NOX, SO2, CO2, and CO) based on the engine power under different operating conditions. Results show that the change in O2 concentration reflects the load associated with the main engine of the ship. The NOX, SO2, and CO2 emission concentrations are the highest during cruising, whereas the peak CO emission concentration is observed during anchoring. The average EFs of NOX and SO2 based on the power of the main engine are the highest during cruising, and those of CO2 and CO are the highest after anchoring. The ship EFs are different during acceleration and deceleration. By comparing the EFs along the coast of China and the global EFs commonly used to perform the emission inventory calculations in China, the NOX EFs under different operating conditions is observed to be generally lower than the global EFs under the corresponding operating conditions. Furthermore, the SO2 EF is considerably affected by the sulfur content in the fuel oil and the operating conditions of the ship. The average CO2 EFs are higher than the global EFs commonly used during cruising, and the CO EFs are higher than the global EFs under all the conditions. Our results help to supplement the EFs for this type of ship under different operating conditions, resolve the lack of emission data under anchoring conditions, and provide data support to conduct nearshore environmental monitoring and assessment. Full article
(This article belongs to the Special Issue Traffic-Related Air Pollution and Its Impacts on Human Health)
Show Figures

Figure 1

13 pages, 13098 KiB  
Article
Wave-Tracking in the Surf Zone Using Coastal Video Imagery with Deep Neural Networks
by Jinah Kim, Jaeil Kim, Taekyung Kim, Dong Huh and Sofia Caires
Atmosphere 2020, 11(3), 304; https://doi.org/10.3390/atmos11030304 - 21 Mar 2020
Cited by 14 | Viewed by 5542
Abstract
In this paper, we propose a series of procedures for coastal wave-tracking using coastal video imagery with deep neural networks. It consists of three stages: video enhancement, hydrodynamic scene separation and wave-tracking. First, a generative adversarial network, trained using paired raindrop and clean [...] Read more.
In this paper, we propose a series of procedures for coastal wave-tracking using coastal video imagery with deep neural networks. It consists of three stages: video enhancement, hydrodynamic scene separation and wave-tracking. First, a generative adversarial network, trained using paired raindrop and clean videos, is applied to remove image distortions by raindrops and to restore background information of coastal waves. Next, a hydrodynamic scene of propagated wave information is separated from surrounding environmental information in the enhanced coastal video imagery using a deep autoencoder network. Finally, propagating waves are tracked by registering consecutive images in the quality-enhanced and scene-separated coastal video imagery using a spatial transformer network. The instantaneous wave speed of each individual wave crest and breaker in the video domain is successfully estimated through learning the behavior of transformed and propagated waves in the surf zone using deep neural networks. Since it enables the acquisition of spatio-temporal information of the surf zone though the characterization of wave breakers inclusively wave run-up, we expect that the proposed framework with the deep neural networks leads to improve understanding of nearshore wave dynamics. Full article
(This article belongs to the Special Issue Waves and Wave Climate Analysis and Modeling)
Show Figures

Figure 1

17 pages, 6135 KiB  
Article
Spatiotemporal Variations of Precipitation in China Using Surface Gauge Observations from 1961 to 2016
by Yunfei Su, Chuanfeng Zhao, Yuan Wang and Zhanshan Ma
Atmosphere 2020, 11(3), 303; https://doi.org/10.3390/atmos11030303 - 20 Mar 2020
Cited by 42 | Viewed by 3149
Abstract
Long-term precipitation trend is a good indicator of climate and hydrological change. The data from 635 ground stations are used to quantify the temporal trends of precipitation with different intensity in China from 1961 to 2016. These sites are roughly uniformly distributed in [...] Read more.
Long-term precipitation trend is a good indicator of climate and hydrological change. The data from 635 ground stations are used to quantify the temporal trends of precipitation with different intensity in China from 1961 to 2016. These sites are roughly uniformly distributed in the east or west regions of China, while fewer sites exist in the western region. The result shows that precipitation with a rate of <10 mm/day dominates in China, with a fraction of >70%. With a 95% confidence level, there is no significant temporal change of annually averaged precipitation in the whole of China. Seasonally, there are no significant temporal changes except for a robust decreasing trend in autumn. Spatially, significant differences in the temporal trends of precipitation are found among various regions. The increasing trend is the largest in Northwest China, and the decreasing trend is the largest in North China. The annually averaged number of precipitation days shows a decreasing trend in all regions except for Northwest China. Regarding precipitation type, the number of light precipitation days shows a robust decreasing trend for almost all regions, while other types show no significant change. Considering the high frequency, the temporal trends of light precipitation could highly explain the temporal variation of the total precipitation amount in China. Full article
(This article belongs to the Section Meteorology)
Show Figures

Figure 1

15 pages, 2877 KiB  
Article
Irrigation Groundwater Quality Characteristics: A Case Study of Cyprus
by Georgios Nikolaou, Damianos Neocleous, Christos Christophi, Theodosia Heracleous and Marinos Markou
Atmosphere 2020, 11(3), 302; https://doi.org/10.3390/atmos11030302 - 20 Mar 2020
Cited by 16 | Viewed by 3925
Abstract
This study was conducted in order to investigate possible quality changes in Cyprus’ groundwater resources over a 10-year period of pumping and to check the suitability of primary irrigation water. Water samples (n = 890) from private wells in agricultural areas were analyzed [...] Read more.
This study was conducted in order to investigate possible quality changes in Cyprus’ groundwater resources over a 10-year period of pumping and to check the suitability of primary irrigation water. Water samples (n = 890) from private wells in agricultural areas were analyzed from 2009 to 2018 to determine various physicochemical properties. The sodium adsorption ratio (SAR) and residual sodium carbonate (RSC) were also calculated to evaluate potential soil degradation issues. Sodium, chloride and sulphate were found to be the predominant ions in groundwater. Quality evaluation showed possible restrictions in groundwater use for irrigation in relation to its salt content and the toxicity of specific ions having adverse effects on sensitive and several moderately sensitive crops. In particular, an increasing trend was observed in pumped groundwater for boron ion concentrations. Nevertheless, all samples evaluated were suitable for irrigation in terms of soil sodicitation and soil infiltration rate. This study indicates that in order to maintain long-term agricultural sustainability it is imperative to develop strategic plants to mitigate the adverse effects of water-pumped quality deterioration on soils and crops. Precision agriculture techniques may be adapted for better water and nutrient input/output management, thus protecting groundwater from salinization in agricultural areas. These results, among others, may be a useful tool to enhance the ability of Cyprus’s agricultural water sector to adapt to observed and anticipated climate impacts. Full article
(This article belongs to the Special Issue Adaptation of Cyprus Agriculture to Climate Change)
Show Figures

Figure 1

21 pages, 777 KiB  
Article
A Statistical Investigation of Mesoscale Precursors of Significant Tornadoes: The Italian Case Study
by Roberto Ingrosso, Piero Lionello, Mario Marcello Miglietta and Gianfausto Salvadori
Atmosphere 2020, 11(3), 301; https://doi.org/10.3390/atmos11030301 - 20 Mar 2020
Cited by 16 | Viewed by 4125
Abstract
In this study, mesoscale environments associated with 57 significant tornadoes occurring over Italy in the period 2000–2018 are analyzed. The role of the vertical Wind Shear in the lower and middle troposphere, in terms of low-level shear (LLS) and deep-level shear (DLS), and [...] Read more.
In this study, mesoscale environments associated with 57 significant tornadoes occurring over Italy in the period 2000–2018 are analyzed. The role of the vertical Wind Shear in the lower and middle troposphere, in terms of low-level shear (LLS) and deep-level shear (DLS), and of the convective available potential energy (CAPE) as possible precursors of significant tornadoes is statistically investigated. Wind shear and CAPE data are extracted from the ERA-5 and ERA-Interim reanalyses. Overall, the study indicates that: (a) values of these variables in the two uppermost quartiles of their statistical distribution significantly increases the probability of tornado occurrences; (b) the probability increases for increasing values of LLS and DLS, and (c) is maximum when either wind shear or CAPE are large. These conclusions hold for both the reanalysis datasets and do not depend upon the season and/or the considered area. With the possible exception of weak tornadoes, which are not included in our study, our results show that large wind shear, in the presence of medium-to-high values of CAPE, are reliable precursors of tornadoes. Full article
(This article belongs to the Section Meteorology)
Show Figures

Figure 1

20 pages, 6348 KiB  
Article
Improving Ensemble Forecasting Using Total Least Squares and Lead-Time Dependent Bias Correction
by Aida Jabbari and Deg-Hyo Bae
Atmosphere 2020, 11(3), 300; https://doi.org/10.3390/atmos11030300 - 19 Mar 2020
Cited by 10 | Viewed by 2771
Abstract
Numerical weather prediction (NWP) models produce a quantitative precipitation forecast (QPF), which is vital for a wide range of applications, especially for accurate flash flood forecasting. The under- and over-estimation of forecast uncertainty pose operational risks and often encourage overly conservative decisions to [...] Read more.
Numerical weather prediction (NWP) models produce a quantitative precipitation forecast (QPF), which is vital for a wide range of applications, especially for accurate flash flood forecasting. The under- and over-estimation of forecast uncertainty pose operational risks and often encourage overly conservative decisions to be made. Since NWP models are subject to many uncertainties, the QPFs need to be post-processed. The NWP biases should be corrected prior to their use as a reliable data source in hydrological models. In recent years, several post-processing techniques have been proposed. However, there is a lack of research on post-processing the real-time forecast of NWP models considering bias lead-time dependency for short- to medium-range forecasts. The main objective of this study is to use the total least squares (TLS) method and the lead-time dependent bias correction method—known as dynamic weighting (DW)—to post-process forecast real-time data. The findings show improved bias scores, a decrease in the normalized error and an improvement in the scatter index (SI). A comparison between the real-time precipitation and flood forecast relative bias error shows that applying the TLS and DW methods reduced the biases of real-time forecast precipitation. The results for real-time flood forecasts for the events of 2002, 2007 and 2011 show error reductions and accuracy improvements of 78.58%, 81.26% and 62.33%, respectively. Full article
(This article belongs to the Section Meteorology)
Show Figures

Figure 1

21 pages, 7655 KiB  
Article
A Building-Block Urban Meteorological Observation Experiment (BBMEX) Campaign in Central Commercial Area in Seoul
by Moon-Soo Park, Jae-Young Byon, Baek-Jo Kim, Woosuk Choi, Kwang-Min Myung, Sang-Hyun Lee, Tae-Il Cho, Jung-Hoon Chae, Jae-Sik Min, Minsoo Kang, Joon-Bum Jee, Sang-Heon Kim and Chang-Rae Cho
Atmosphere 2020, 11(3), 299; https://doi.org/10.3390/atmos11030299 - 19 Mar 2020
Cited by 3 | Viewed by 3946
Abstract
High-resolution meteorological information is essential for attaining sustainable and resilient cities. To elucidate high-resolution features of surface and air temperatures in high-rise building blocks (BBs), a 3-dimensional BB meteorological observation experiment (BBMEX) campaign was designed. The campaign was carried out in a central [...] Read more.
High-resolution meteorological information is essential for attaining sustainable and resilient cities. To elucidate high-resolution features of surface and air temperatures in high-rise building blocks (BBs), a 3-dimensional BB meteorological observation experiment (BBMEX) campaign was designed. The campaign was carried out in a central commercial area in Seoul during a heat-wave event period (5−6 August) in 2019. Several types of fixed instrument were deployed, a mobile meteorological observation cart (MOCA) and a vehicle were operated periodically. The surface temperature was determined to be strongly dependent on the facial direction of a building, and sunlit or shade by surrounding obstacles. Considerable increases in surface temperature on the eastern facades of buildings before noon, on horizontal surfaces near noon, and on the western facades in the afternoon could provide more energy in BBs than over a flat surface. The air temperatures in the BB were higher than those at the Seoul station by 0.1−2.2 °C (1.1−1.9 °C) in daytime (night-time). The MOCA revealed that the surface and air temperatures in a BB could be affected by many complex factors, such as the structure of the BBs, shades, as well as the existence of facilities that mitigate heat stresses, such as ground fountains and waterways. Full article
(This article belongs to the Special Issue Urban Meteorology)
Show Figures

Figure 1

18 pages, 1529 KiB  
Article
Warm Rain in Southern West Africa: A Case Study at Savè
by Irene Reinares Martínez, Jean-Pierre Chaboureau and Jan Handwerker
Atmosphere 2020, 11(3), 298; https://doi.org/10.3390/atmos11030298 - 19 Mar 2020
Cited by 3 | Viewed by 2507
Abstract
A warm-rain episode over southern West Africa is analyzed using unprecedented X-band radar observations from Savè, Benin and a Large-Eddy Simulation (LES) over a 240 × 240 km 2 domain. While warm rain contributes to 1% of the total rainfall in the LES, [...] Read more.
A warm-rain episode over southern West Africa is analyzed using unprecedented X-band radar observations from Savè, Benin and a Large-Eddy Simulation (LES) over a 240 × 240 km 2 domain. While warm rain contributes to 1% of the total rainfall in the LES, its spatial extent accounts for 24% of the area covered by rainfall. Almost all the warm-rain cells tracked in the observation and the LES have a size between 2 and 10 km and a lifetime varying from 5 to 60 min. During the nighttime, warm-rain cells are caused by the dissipation of large deep-convection systems while during the daytime they are formed by the boundary-layer thermals. The vertical extension of the warm-rain cells is limited by vertical wind shear at their top. In the simulation, their top is 1.6 km higher with respect to the radar observations due to the large-scale environment given by wrong initial conditions. This study shows the challenge of simulating warm rain in southern West Africa, a key phenomenon during the little dry season. Full article
Show Figures

Figure 1

13 pages, 289 KiB  
Article
Tourists’ Perceptions on Climate Change in Lisbon Region
by Filomena Clemente, António Lopes and Vitor Ambrósio
Atmosphere 2020, 11(3), 297; https://doi.org/10.3390/atmos11030297 - 18 Mar 2020
Cited by 11 | Viewed by 3622
Abstract
The interface between climate change and tourism is multifaceted and complex. This research aims to understand the relationship established between the tourists’ concerns regarding the impacts of climate change and the risks that may arise and the willingness to pay (WTP) a supplementary [...] Read more.
The interface between climate change and tourism is multifaceted and complex. This research aims to understand the relationship established between the tourists’ concerns regarding the impacts of climate change and the risks that may arise and the willingness to pay (WTP) a supplementary fee, and what its value should be, in the tourist packages for environmental sustainability. The empirical phase of this research is presented in the form of a problem: “Will tourists be willing to pay a supplementary fee on tourist packages for environmental sustainability?”. To answer this question, a methodology was implemented in which a questionnaire was given to tourists, and the results were elaborated with several descriptive and multivariate statistics were elaborated. The results show that most tourists are not yet willing to pay a supplementary fee on tourist packages for environmental sustainability, but that this value increases with increasing concern about the risks associated with climate change. This research is intended to contribute to the development of more effective policies, in a bottom-up approach, to manage the risks related to climate change, facilitating successful adaptation. Full article
(This article belongs to the Special Issue Tourism Climatology: Past, Present and Future)
18 pages, 5987 KiB  
Article
Recovering Climate Data from Documentary Sources: A Study on the Climate in the South of Spain from 1792 to 1808
by Fernando S. Rodrigo
Atmosphere 2020, 11(3), 296; https://doi.org/10.3390/atmos11030296 - 18 Mar 2020
Cited by 6 | Viewed by 2648
Abstract
This work analyses new climate data on Southern Spain during the period 1792–1808. The data source is the periodical Correo Mercantil de España y sus Indias (Mercantile Mail of Spain and the Spanish Indies), which published weekly summaries of the weather conditions in [...] Read more.
This work analyses new climate data on Southern Spain during the period 1792–1808. The data source is the periodical Correo Mercantil de España y sus Indias (Mercantile Mail of Spain and the Spanish Indies), which published weekly summaries of the weather conditions in Spain over this period. The study focuses on the southern provinces, providing 2788 new records, some of them corresponding to areas with no previously recorded data (Córdoba, Jaén). The analysis indicates the predominance of cold and dry winters, cold and wet springs, warm and dry summers, and variable autumn conditions, cold and humid in the western provinces while warm and dry in the eastern provinces. Some examples of these situations are discussed. Full article
(This article belongs to the Special Issue Long Term Climate Variability in the Mediterranean Region)
Show Figures

Graphical abstract

18 pages, 6686 KiB  
Article
O3 Sensitivity and Contributions of Different NMHC Sources in O3 Formation at Urban and Suburban Sites in Shanghai
by Haotian Lin, Ming Wang, Yusen Duan, Qingyan Fu, Wenhao Ji, Huxiong Cui, Dan Jin, Yanfen Lin and Kun Hu
Atmosphere 2020, 11(3), 295; https://doi.org/10.3390/atmos11030295 - 17 Mar 2020
Cited by 29 | Viewed by 3951
Abstract
Ground-level ozone (O3) pollution is still one of the priorities and challenges for air pollution control in the Yangtze River Delta (YRD) region of China. Understanding the relationship of O3 with its precursors and contributions of different sources in O [...] Read more.
Ground-level ozone (O3) pollution is still one of the priorities and challenges for air pollution control in the Yangtze River Delta (YRD) region of China. Understanding the relationship of O3 with its precursors and contributions of different sources in O3 formation is essential for the development of an O3 control strategy. This study analyzed O3 sensitivity to its precursors using a box model based on online observations of O3, non-methane hydrocarbons (NMHCs), nitrogen oxides (NOx), and carbon monoxide (CO) at an urban site and a suburban site in Shanghai in July 2017. Anthropogenic sources of NMHCs were identified using the positive matrix factorization (PMF) receptor model, and then contributions of different sources in O3 formation were estimated by the observation-based model (OBM). The relative incremental reactivity (RIR) values calculated by the OBM suggest that O3 formation at the urban site was in the NMHC-limited regime, while O3 formation at the suburban site tended between the transition regime and the NMHC-limited regime. Vehicular emission and liquefied petrochemical gas (LPG) use or aged air mass were found to be the two largest contributors at the urban and suburban sites in July, followed by paint and solvent use, and the petrochemical industry. However, from the perspective of O3 formation, vehicular emission and paint and solvent use were the largest two contributors at two sites due to the higher RIR values for paint and solvent use. In addition, the influence of transport on O3 sensitivity was identified by comparing O3 sensitivity at the suburban site across two days with different air mass paths. The result revealed that O3 formation in Shanghai is not only related to local emissions but also influenced by emissions from neighboring provinces. These findings on O3–NMHC–NOX sensitivity, contributions of different sources in O3 formation, and influence of transport could be useful for O3 pollution control in the YRD region. Nevertheless, more quantitative analyses on transport and further evaluation of the uncertainty of the OBM are still needed in future. Full article
(This article belongs to the Special Issue Emissions, Transport and Fate of Pollutants in the Atmosphere)
Show Figures

Figure 1

17 pages, 5947 KiB  
Article
Measuring on-Road Vehicle Hot Running NOx Emissions with a Combined Remote Sensing–Dynamometer Study
by Robin Smit and Daniel Kennedy
Atmosphere 2020, 11(3), 294; https://doi.org/10.3390/atmos11030294 - 16 Mar 2020
Cited by 2 | Viewed by 3040
Abstract
This study explores the correlation in measured hot running NO/CO2 ratios by a remote sensing device (RSD) and dynamometer testing. Two large diesel cars (E4/E5) are tested on the dynamometer in hot running conditions using a new drive cycle developed for this [...] Read more.
This study explores the correlation in measured hot running NO/CO2 ratios by a remote sensing device (RSD) and dynamometer testing. Two large diesel cars (E4/E5) are tested on the dynamometer in hot running conditions using a new drive cycle developed for this study and then driven multiple times past the RSD. A number of verification and correction steps are conducted for both the dynamometer and RSD data. A new time resolution adjustment of RSD acceleration values proves important. Comparison of RSD and dynamometer data consistently shows a strong weighted correlation varying from +0.89 to +0.95, despite the high level of variability observed in the RSD measurements. This provides further evidence that relative changes in mean NO/CO2 ratios as measured with the RSD should provide robust emissions data for trend analysis studies and as inputs for regional emissions models. However, a positive bias of approximately 25 ppm NO/% CO2 is observed for the RSD, and bias correction of RSD measurements should be considered pending further testing. Full article
(This article belongs to the Special Issue Roadside Air Pollution)
Show Figures

Figure 1

15 pages, 805 KiB  
Article
North Atlantic Hurricane Winds in Warmer than Normal Seas
by Jill C. Trepanier
Atmosphere 2020, 11(3), 293; https://doi.org/10.3390/atmos11030293 - 16 Mar 2020
Cited by 8 | Viewed by 4232
Abstract
Tropical cyclones devastate coastlines around the world. The United States and surrounding areas experienced catastrophic extreme events in recent hurricane seasons. Understanding extreme hurricanes and how they change in a warming ocean environment is of the utmost importance. This study makes use of [...] Read more.
Tropical cyclones devastate coastlines around the world. The United States and surrounding areas experienced catastrophic extreme events in recent hurricane seasons. Understanding extreme hurricanes and how they change in a warming ocean environment is of the utmost importance. This study makes use of the historical, positive relationship between average summer sea surface temperatures (SSTs) and maximum hurricane wind speeds across the North Atlantic Basin from 1854–2018. Geographically weighted regression shows how the relationship between hurricane winds and SSTs varies across space. Each localized slope is used to increase historical wind speeds to represent winds in a three-degree Celsius warmer-than-average sea surface. The winds are then used to estimate the maximum intensity of the thirty-year hurricane (one with a 3.3% annual probability of occurrence) across the hexagonal grid using extreme value statistics. Viewing the results spatially allows for geographic patterns to emerge in the overall risk of major hurricane occurrence in warm SST environments. This study showcases the difference in the historical extreme compared to the potential future extreme in the hopes to better inform those charged with making important, life-saving decisions along the U.S. and neighboring coasts. Full article
(This article belongs to the Special Issue Atmospheric Hazards)
Show Figures

Figure 1

16 pages, 3455 KiB  
Article
Simultaneous Measurements of Chemical Compositions of Fine Particles during Winter Haze Period in Urban Sites in China and Korea
by Minhan Park, Yujue Wang, Jihyo Chong, Haebum Lee, Jiho Jang, Hangyul Song, Nohhyeon Kwak, Lucille Joanna S. Borlaza, Hyunok Maeng, Enrique Mikhael R. Cosep, Ma. Cristine Faye J. Denna, Shiyi Chen, Ilhwa Seo, Min-Suk Bae, Kyoung-Soon Jang, Mira Choi, Young Hwan Kim, Moonhee Park, Jong-Sik Ryu, Sanghee Park, Min Hu and Kihong Parkadd Show full author list remove Hide full author list
Atmosphere 2020, 11(3), 292; https://doi.org/10.3390/atmos11030292 - 16 Mar 2020
Cited by 8 | Viewed by 3926
Abstract
We performed simultaneous measurements of chemical compositions of fine particles in Beijing, China and Gwangju, Korea to better understand their sources during winter haze period. We identified PM2.5 events in Beijing, possibly caused by a combination of multiple primary combustion sources (biomass [...] Read more.
We performed simultaneous measurements of chemical compositions of fine particles in Beijing, China and Gwangju, Korea to better understand their sources during winter haze period. We identified PM2.5 events in Beijing, possibly caused by a combination of multiple primary combustion sources (biomass burning, coal burning, and vehicle emissions) and secondary aerosol formation under stagnant conditions and/or dust sources under high wind speeds. During the PM2.5 events in Gwangju, the contribution of biomass burning and secondary formation of nitrate and organics to the fine particles content significantly increased under stagnant conditions. We commonly observed the increases of nitrogen-containing organic compounds and biomass burning inorganic (K+) and organic (levoglucosan) markers, suggesting the importance of biomass burning sources during the winter haze events (except dust event cases) at both sites. Pb isotope ratios indicated that the fraction of Pb originated from possibly industry and coal combustion sources increased during the PM2.5 events in Gwangju, relative to nonevent days. Full article
(This article belongs to the Special Issue Chemical Analysis Methods for Particle-Phase Pollutants)
Show Figures

Figure 1

23 pages, 6037 KiB  
Article
Climatology and Spatiotemporal Analysis of North Atlantic Rapidly Intensifying Hurricanes (1851–2017)
by Kathleen M. Benedetto and Jill C. Trepanier
Atmosphere 2020, 11(3), 291; https://doi.org/10.3390/atmos11030291 - 16 Mar 2020
Cited by 12 | Viewed by 4654
Abstract
In recent decades, the scientific ability to project tropical cyclone (TC) intensities and tracks has improved. Hurricanes undergoing the process of rapid intensification (RI) have created new barriers in formulating predictions of TC paths and peak velocities. Current research suggests the warming climate [...] Read more.
In recent decades, the scientific ability to project tropical cyclone (TC) intensities and tracks has improved. Hurricanes undergoing the process of rapid intensification (RI) have created new barriers in formulating predictions of TC paths and peak velocities. Current research suggests the warming climate may produce more intense TCs with a higher probability of undergoing RI during their life cycle. The increased likelihood of rapidly intensifying TCs necessitates the development of an RI climatology spanning the current North Atlantic record. A time series count analysis suggests a significant increasing trend of RI events in the Atlantic basin by 29.1% (17%–45%) from the years 1900 to 2017. For the entire basin, the peak frequency occurs in September, followed by August, then October. Gulf of Mexico events tend to occur more regularly over June, July, August, and September, while Atlantic storms peak in August, September, and October. The onset of RI typically begins in the Western Caribbean and Gulf of Mexico, west of 85° W. The lifetime maximum intensity typically occurs in the Gulf of Mexico basin. Density analysis suggests the locations of lifetime maximum intensities (LMIs) in rapidly intensifying TCs are clustered through space. It should be noted that these results are dependent upon the HURDAT record of events. This research is necessary in order to find substantive trends in RI events that may aid future predictions of tropical cyclones; therefore, potentially decreasing the lives lost and the cost of damage that these storms are known to cause. Full article
(This article belongs to the Special Issue Atmospheric Hazards)
Show Figures

Figure 1

25 pages, 2996 KiB  
Article
Selected Metals in Urban Road Dust: Upper and Lower Silesia Case Study
by Justyna Rybak, Magdalena Wróbel, Jan Stefan Bihałowicz and Wioletta Rogula-Kozłowska
Atmosphere 2020, 11(3), 290; https://doi.org/10.3390/atmos11030290 - 16 Mar 2020
Cited by 19 | Viewed by 3356
Abstract
In this study, urban road dust (URD) samples were collected in two populated agglomerations of Wrocław and Katowice (Lower and Upper Silesia) in Poland. Both the total concentrations of URD-bound Mn, Ni, Cu, Zn, As, Rb, Ba, Cr, Mg, and Al and concentrations [...] Read more.
In this study, urban road dust (URD) samples were collected in two populated agglomerations of Wrocław and Katowice (Lower and Upper Silesia) in Poland. Both the total concentrations of URD-bound Mn, Ni, Cu, Zn, As, Rb, Ba, Cr, Mg, and Al and concentrations of their water-soluble fraction were determined. The contamination characteristics and health risk related to these elements were assessed. Contamination level assessment was done by Pollution Load Index (PLI), which indicated much higher pollution of Katowice agglomeration than Wrocław. The enrichment factor values (EF) showed that the most elements in both Katowice and Wrocław orginated from anthropogenic sources. The calculations of geo-accumulation index (Igeo) showed that Zn and As are the key pollutants in Katowice; and in the Wrocław region, Cu, Zn, Cr, and Ni are. The principle component analysis (PCA) and correlation analysis provide information about the potential sources of metals. Additionally, a positive matrix factorization (PMF) was performed and four factors in PMF analysis were found and then interpreted by comparing to the source profiles. Three contamination sources were revealed: fossil fuel combustion, road traffic and industrial emissions. Although the main source of studied metals in Lower Silesia is road traffic, in Upper Silesia, domestic heating with the use of hard and brawn coal and industrial activity predominates. Human exposure to individual toxic metals through road dust was assessed for both children and adults. By calculating the average daily dose (ADD) via ingestion, inhalation, and dermal contact, it was found that ingestion and then dermal contact were the greatest exposure pathways for humans in Katowice and Wrocław. Children had greater health risks than adults. According to the health risk assessment, the overall non-carcinogenic risks in both urban areas was rather low. The only exception was As bound to urban road dust in Katowice agglomeration, which indicates risk for children when ingested. The total excess cancer risk (ECR) was also lower than the acceptable level (10−6–10−4) for both adults and children, although ECR for Katowice was closer to this limit. Full article
(This article belongs to the Special Issue Particulate Matters Emission in Poland)
Show Figures

Figure 1

14 pages, 2065 KiB  
Article
Development of Multiple Linear Regression for Particulate Matter (PM10) Forecasting during Episodic Transboundary Haze Event in Malaysia
by Samsuri Abdullah, Nur Nazmi Liyana Mohd Napi, Ali Najah Ahmed, Wan Nurdiyana Wan Mansor, Amalina Abu Mansor, Marzuki Ismail, Ahmad Makmom Abdullah and Zamzam Tuah Ahmad Ramly
Atmosphere 2020, 11(3), 289; https://doi.org/10.3390/atmos11030289 - 16 Mar 2020
Cited by 48 | Viewed by 5647
Abstract
Malaysia has been facing transboundary haze events every year in which the air contains particulate matter, particularly PM10, which affects human health and the environment. Therefore, it is crucial to develop a PM10 forecasting model for early information and warning [...] Read more.
Malaysia has been facing transboundary haze events every year in which the air contains particulate matter, particularly PM10, which affects human health and the environment. Therefore, it is crucial to develop a PM10 forecasting model for early information and warning alerts to the responsible parties in order for them to mitigate and plan precautionary measures during such events. Therefore, this study aimed to develop and compare the best-fitted model for PM10 prediction from the first hour until the next three hours during transboundary haze events. The air pollution data acquired from the Malaysian Department of Environment spanned from the years 2005 until 2014 (excluding years 2007–2009), which included particulate matter (PM10), ozone (O3), nitrogen oxide (NO), nitrogen dioxide (NO), carbon monoxide (CO), sulfur dioxide (SO2), wind speed (WS), ambient temperature (T), and relative humidity (RH) on an hourly basis. Three different stepwise Multiple Linear Regression (MLR) models for predicting the PM10 concentration were then developed based on three different prediction hours, namely t+1, t+2, and t+3. The PM10, t+1 model was the best MLR model to predict PM10 during transboundary haze events compared to PM10,.t+2 and PM10,t+3 models, having the lowest percentage of total error (28%) and the highest accuracy of 46%. A better prediction and explanation of PM10 concentration will help the authorities in getting early information for preserving the air quality, especially during transboundary haze episodes. Full article
(This article belongs to the Section Air Quality)
Show Figures

Figure 1

14 pages, 5069 KiB  
Article
Influence of Atmospheric Circulation on Aerosol and its Optical Characteristics in the Pearl River Delta Region
by Yilin Liu, Jianjun He, Xin Lai, Chenwei Zhang, Lei Zhang, Sunling Gong and Huizheng Che
Atmosphere 2020, 11(3), 288; https://doi.org/10.3390/atmos11030288 - 16 Mar 2020
Cited by 11 | Viewed by 3042
Abstract
At present, few studies have focused on the impact of circulation patterns on aerosol pollution in the Pearl River delta region (PRD) region based on the objective circulation classification method. Based on PM2.5 observation data, meteorological observation data, Aerosol Robotic Network (AERONET) [...] Read more.
At present, few studies have focused on the impact of circulation patterns on aerosol pollution in the Pearl River delta region (PRD) region based on the objective circulation classification method. Based on PM2.5 observation data, meteorological observation data, Aerosol Robotic Network (AERONET) aerosol observation data and European Center for Medium-Range Weather Forecasting (ECMWF) ERA (European Reanalysis)-Interim data in the PRD during 2013 to 2017, the air pollution level, meteorological conditions, and aerosol optical and radiation characteristics in different circulation patterns are studied in this paper. Using ECMWF ERA-Interim sea level pressure, nine circulation patterns were determined based on the T-mode principal component analysis (PCA) combined with the k-means clustering method. There were significant differences in PM2.5 values under different circulation patterns, indicating that the change of atmospheric circulation is an important factor driving the change of air quality. The prevailing wind in winter (northerly wind) facilitates the transport of pollutants from the north of the PRD and forms severe air pollution, while the prevailing wind in summer (southerly wind) brings clean air from the South China Sea; additionally, a high frequency of precipitation benefits the wet scavenging of pollutants, resulting in improved air quality in the PRD region. The impact of circulation patterns on the AOD (aerosol optical depth) is basically similar to that of the PM2.5 concentration. The study also found that the annual average total radiation was negatively correlated with the annual average PM2.5 concentration. In future, we plan to identify which methods and data are suitable for circulation classification in the PRD region. Full article
(This article belongs to the Special Issue Emissions, Transport and Fate of Pollutants in the Atmosphere)
Show Figures

Figure 1

25 pages, 4870 KiB  
Article
The Influence of Meteorology and Air Transport on CO2 Atmospheric Distribution over South Africa
by Xolile G. Ncipha, Venkataraman Sivakumar and Oupa E. Malahlela
Atmosphere 2020, 11(3), 287; https://doi.org/10.3390/atmos11030287 - 16 Mar 2020
Cited by 6 | Viewed by 3636
Abstract
This paper demonstrates the role of meteorology and air transport in influencing the South African atmospheric CO2 distribution. CO2 data from December 2004 to December 2009 acquired by the Tropospheric Emission Spectrometer (TES) instrument onboard the Aura satellite were used to [...] Read more.
This paper demonstrates the role of meteorology and air transport in influencing the South African atmospheric CO2 distribution. CO2 data from December 2004 to December 2009 acquired by the Tropospheric Emission Spectrometer (TES) instrument onboard the Aura satellite were used to establish the CO2 vertical distribution at selected regions in South Africa. The Hybrid Single-Particle Lagrangian Integrated Trajectories (HYSPLIT) atmospheric model backward trajectories were used to determine the long-range air transport impacting on South African CO2 atmospheric distribution and to detect the source areas of air masses impacting on South Africa’s atmosphere. The study found that long-range air transport can result in the accumulation or dilution of atmospheric CO2 at various sites in South Africa, depending on the source region and type of air flow. The long-range air transport from different source regions at the upper air level between the 700 and 500 hPa stable layers and the layer above 500 hPa strengthens the inhomogeneity in the vertical distribution of CO2, which is caused by the decoupling effect of the upper air stable layers. This long-range air transport also involves intercontinental air transport. Full article
(This article belongs to the Section Meteorology)
Show Figures

Figure 1

15 pages, 2240 KiB  
Article
Quantitative Fluxes of the Greenhouse Gases CH4 and CO2 from the Surfaces of Selected Polish Reservoirs
by Renata Gruca-Rokosz
Atmosphere 2020, 11(3), 286; https://doi.org/10.3390/atmos11030286 - 15 Mar 2020
Cited by 10 | Viewed by 3540
Abstract
Research carried out in the years 2009–2011 and 2018–2019 sought to determine the magnitudes of fluxes of methane (CH4) and carbon dioxide (CO2) from the surfaces of three eutrophic reservoirs in SE Poland. The “static chamber” method was deployed [...] Read more.
Research carried out in the years 2009–2011 and 2018–2019 sought to determine the magnitudes of fluxes of methane (CH4) and carbon dioxide (CO2) from the surfaces of three eutrophic reservoirs in SE Poland. The “static chamber” method was deployed at five or six stations located along the reservoirs, where the water column at its deepest slightly exceeds 2 m. Obtained values for the fluxes of CH4 varied across a wide (0–2513.48 mmol·m−2·d−1) range, with many of these values therefore exceeding those characteristics for large tropical reservoirs. The reservoirs studied were not found to differ significantly in terms of average CH4 flux, however. Where obtained values for CO2 fluxes in the range from −10.96 to 621.69 mmol·m−2·d−1 were concerned, most fell within the range given for temperate-zone reservoirs, while differences between reservoirs were noted for average values in this case. Full article
Show Figures

Figure 1

27 pages, 5987 KiB  
Article
Analysis of Air Pollution in Urban Areas with Airviro Dispersion Model—A Case Study in the City of Sheffield, United Kingdom
by Said Munir, Martin Mayfield, Daniel Coca, Lyudmila S Mihaylova and Ogo Osammor
Atmosphere 2020, 11(3), 285; https://doi.org/10.3390/atmos11030285 - 15 Mar 2020
Cited by 19 | Viewed by 7395
Abstract
Two air pollutants, oxides of nitrogen (NOx) and particulate matter (PM10), are monitored and modelled employing Airviro air quality dispersion modelling system in Sheffield, United Kingdom. The aim is to determine the most significant emission sources and their spatial variability. NOx [...] Read more.
Two air pollutants, oxides of nitrogen (NOx) and particulate matter (PM10), are monitored and modelled employing Airviro air quality dispersion modelling system in Sheffield, United Kingdom. The aim is to determine the most significant emission sources and their spatial variability. NOx emissions (ton/year) from road traffic, point and area sources for the year 2017 were 5370, 6774, and 2425, whereas those of PM10 (ton/year) were 345, 1449, and 281, respectively, which are part of the emission database. The results showed three hotspots of NOx, namely the Sheffield City Centre, Darnall and Tinsley Roundabout (M1 J34S). High PM10 concentrations were shown mainly between Sheffield Forgemasters International (a heavy engineering steel company) and Meadowhall Shopping Centre. Several emission scenarios were tested, which showed that NOx concentrations were mainly controlled by road traffic, whereas PM10 concentrations were controlled by point sources. Spatiotemporal variability and public exposure to air pollution were analysed. NOx concentration was greater than 52 µg/m3 in about 8 km2 area, where more than 66 thousand people lived. Models validated by observations can be used to fill in spatiotemporal gaps in measured data. The approach used presents spatiotemporal situation awareness maps that could be used for decision making and improving the urban infrastructure. Full article
(This article belongs to the Special Issue Atmospheric Dispersion of Pollutants in Urban Environments)
Show Figures

Graphical abstract

20 pages, 4154 KiB  
Article
The Comprehensive Study of Low Thermospheric Sodium Layers during the 24th Solar Cycle
by Yuchang Xun, Guotao Yang, Jihong Wang, Lifang Du, Zelong Wang, Jing Jiao, Xuewu Cheng, Faquan Li and Xu Zou
Atmosphere 2020, 11(3), 284; https://doi.org/10.3390/atmos11030284 - 14 Mar 2020
Cited by 4 | Viewed by 2667
Abstract
The low thermospheric sodium layer (LTSL) is the separate sodium atom layer above 105 km. Based on 11,607 h of lidar observations from Yanqing (40.5° N, 116.0° E) from 2010 to 2016, we found 38 LTSLs wherein the peak densities were more than [...] Read more.
The low thermospheric sodium layer (LTSL) is the separate sodium atom layer above 105 km. Based on 11,607 h of lidar observations from Yanqing (40.5° N, 116.0° E) from 2010 to 2016, we found 38 LTSLs wherein the peak densities were more than five percent above those of the main sodium layers. This work presents the peak altitudes, peak local times and peak densities of the LTSLs as well as the long-term characteristics of the seasonal and inter-annual variations of LTSLs. We analyzed the correlation between the LTSL and sporadic E layer (Es). The seasonal variation trends of the occurrences of LTSL and Es are similar, and the results showed that 95% of the LTSLs were accompanied by Es. We also found that 69% of the LTSL cases exhibited apparent downward phase progressions, while the descending rates of the LTSLs are consistent with the phase speeds of the tide. Full article
Show Figures

Figure 1

Previous Issue
Next Issue
Back to TopTop