Article

Influence of Atmospheric Circulation on Aerosol and its Optical Characteristics in the Pearl River Delta Region

1
School of Atmospheric Sciences, Chengdu University of Information Technology, Chengdu 610225, China
2
State Key Laboratory of Severe Weather & Key Laboratory of Atmospheric Chemistry of CMA, Chinese Academy of Meteorological Sciences, Beijing 100081, China
*
Authors to whom correspondence should be addressed.
Atmosphere 2020, 11(3), 288; https://doi.org/10.3390/atmos11030288
Submission received: 30 January 2020 / Revised: 11 March 2020 / Accepted: 13 March 2020 / Published: 16 March 2020
(This article belongs to the Special Issue Emissions, Transport and Fate of Pollutants in the Atmosphere)

Abstract

:
At present, few studies have focused on the impact of circulation patterns on aerosol pollution in the Pearl River delta region (PRD) region based on the objective circulation classification method. Based on PM2.5 observation data, meteorological observation data, Aerosol Robotic Network (AERONET) aerosol observation data and European Center for Medium-Range Weather Forecasting (ECMWF) ERA (European Reanalysis)-Interim data in the PRD during 2013 to 2017, the air pollution level, meteorological conditions, and aerosol optical and radiation characteristics in different circulation patterns are studied in this paper. Using ECMWF ERA-Interim sea level pressure, nine circulation patterns were determined based on the T-mode principal component analysis (PCA) combined with the k-means clustering method. There were significant differences in PM2.5 values under different circulation patterns, indicating that the change of atmospheric circulation is an important factor driving the change of air quality. The prevailing wind in winter (northerly wind) facilitates the transport of pollutants from the north of the PRD and forms severe air pollution, while the prevailing wind in summer (southerly wind) brings clean air from the South China Sea; additionally, a high frequency of precipitation benefits the wet scavenging of pollutants, resulting in improved air quality in the PRD region. The impact of circulation patterns on the AOD (aerosol optical depth) is basically similar to that of the PM2.5 concentration. The study also found that the annual average total radiation was negatively correlated with the annual average PM2.5 concentration. In future, we plan to identify which methods and data are suitable for circulation classification in the PRD region.

1. Introduction

In recent years, China’s economic development has expanded rapidly. The demand and consumption of energy have increased significantly. Human activities have led to an increase in the emission of various pollutants. These directly discharged pollutants form air pollution in the atmosphere through transportation, diffusion and chemical transformation [1,2,3], endangering human health [4] and restricting the sustainable development of the social economy.
The Pearl River delta (PRD), located at the southern end of China’s coastline, is the second largest delta and one of the most densely populated urban agglomerations in China [5]. According to the Chinese environmental bulletin, the annual numbers of days in which PM2.5 exceeds the national secondary standard (the limit of the daily average PM2.5 concentration is 75 μg·m−3) were 87, 42, 67, 39, 35 and 57 days from 2013 to 2017, respectively [6]. According to the WHO’s assessment of the disease burden caused by air pollution in 2016 [7], about 6.5 million deaths globally are related to air pollution every year, nearly 90% of which occur in low-income and middle-income countries. Long-term or short-term exposure to a high concentration of particulate matter can induce and aggravate respiratory diseases, cardiovascular diseases, metabolic diseases, cancer, etc. Previous studies revealed that PM2.5 in 2015 in China contributed as much as 40.3% to total stroke deaths, 33.1% to acute lower respiratory infection deaths, 26.8% to ischemic heart disease deaths, 23.9% to lung cancer deaths, 18.7% to chronic obstructive pulmonary disease deaths, 30.2% to total deaths combining ischemic heart disease, stroke, chronic obstructive pulmonary disease, and lung cancer, and 15.5% to deaths from all causes [4]. Therefore, it is necessary to continuously undertake air pollution control measures in China. Air pollution is affected by pollutant emission sources, topography, the underlying surface, meteorological conditions, photochemical reactions and other factors [1,2,8,9,10]. Surrounded by mountains on three sides, the PRD region is influenced by the subtropical monsoon climate, and the terrain is relatively complex. The rapid economic development has led to an increase in pollutant emissions, and the acceleration of urbanization has also led to the change of underlying surface types in the PRD region, which affects local circulation, pollutant diffusion and transport processes. According to the analysis of regional sources, the particulate matter in Guangzhou, Foshan and Jiangmen mainly comes from local emissions, among which Guangzhou and Foshan are the most important source cities of particulate matter in the period of heavy pollution in the Pearl River Delta, while Zhongshan is the city which is most likely to cause pollution weather due to the transport of particulate matter [11,12].
The weather situation is one of the important factors modulating the change of pollutant concentrations. The weather conditions leading to the composite pollution events in the PRD region mainly include continental cold high pressure, tropical cyclone, degraded high pressure, subtropical high pressure, low-pressure troughs, and uniform pressure fields [13,14,15]. A previous study analyzed the process of cold air in autumn and winter in the PRD region, and the results showed good air quality during the passage of cold air. However, in the early stage of a cold front or high pressure, air pollution is easily caused due to the temperature inversion layer and pollutant transport from the north of PRD. In addition, the warming period after cold air is usually under the control of a denature-high-pressure ridge, with a low wind speed and a temperature inversion layer, resulting in severe pollution [16,17]. In the above studies, circulation patterns are classified subjectively by researchers, so the research period is relative short (mostly for several months), which leads to a small number of samples. Individual differences may exist in the classification results. Using the objective classification method, many studies have analyzed the relationship between air pollution and circulation patterns in Beijing–Tianjin–Hebei, the Yangtze River delta, the Sichuan basin, and Northwest China [6,18,19,20,21,22].
As far as we know, few studies have focused on the relation between air quality and circulation patterns based on an objective classification method in the PRD region. Based on the European Centre for Medium-Range Weather Forecasting (ECMWF) ERA (European Reanalysis)-Interim reanalysis data, conventional meteorological station observation data, radiation observation data, pollutant concentration observation data, and aerosol optical depth (AOD) of Aerosol Robotic Network (AERONET) observation data, this paper classifies the circulation patterns using the objective weather classification method and analyzes the impact of different atmospheric circulations on the PM2.5 concentrations and AOD in the PRD region.

2. Data and Methods

2.1. Study Area

As shown in Figure 1, the PRD region is located in the central and southern part of Guangdong province, including Guangzhou, Shenzhen, Zhuhai, Dongguan, Zhongshan, Foshan, Jiangmen, Huizhou and Zhaoqing, as well as the two special administrative regions of Hong Kong and Macao. By the end of 2017, the permanent resident population in this region reached 61.5 million, making it the region with the largest population in Guangdong Province. With complex terrain, the PRD is a typical subtropical monsoon climate area. In summer, this region experiences high temperatures and heavy precipitation, while in winter, it is warm and humid. The average annual temperature is 21–23 °C; the temperature is 13–15 °C in winter and above 28 °C in summer [23].

2.2. Meteorological Data

Hourly meteorological observation data from 2013 to 2017 were used in this paper, including 2 m temperature (T2), 2 m relative humidity (RH2), 10 m wind speed (WS10) and wind direction (WD10), and precipitation (PRE). The daily total solar radiation data start from May 1957, and there are 130 radiation observation stations (including removed stations) in China [24]. Daily total solar radiation data from the Guangzhou station from 2013 to 2017 were selected for analysis. The locations of meteorological stations are shown in Figure 1a Conventional meteorological and radiation data were acquired from the National Meteorological Information Center (NMIC) [25].

2.3. Reanalysis Data

The ERA-Interim reanalysis data [26] are transitional data prepared by the ECMWF for new-generation data. The time interval of these data is six hours (00:00 UTC, 06:00 UTC, 12:00 UTC, 18:00 UTC), and the data started on January 1979, including surface data and barometric surface data for 37 layers from 1000 to 1 hPa [27]. Compared with other times, the 00:00 UTC reanalysis data assimilate a large amount of meteorological sounding observation data and have high accuracy. In this paper, sea level pressure (SLP) is used for classification. The daily vertical velocity and horizontal wind component data are used for flow field analysis. Boundary layer height (BLH) data are used to investigate the relation between circulation patterns and BLH. All the data selected above are from January 2013 to December 2017 at 00:00 UTC (the corresponding local time is 8:00 a.m.) with a resolution of 0.25° × 0.25°.

2.4. PM2.5 Concentration and AOD Data

Hourly PM2.5 concentration data from 2013 to 2017 in the PRD were acquired from the China National Environmental Monitoring Centre (CNEMC) [28] and were measured by the micro-oscillating balance method (TEOM from Rupprecht & Patashnick Co., Inc., Albany, NY, USA) and the β absorption method (BAM 1020 from Met One Instrument Inc., Grants Pass, OR, USA or Tianhong Co., Wuhan, China or Xianhe Co., Shijiazhuang, China); these data passed a quality control test conducted before releasing the data. The distribution of air quality observation stations in the PRD is shown in Figure 1b.
AOD refers to the integral aerosol extinction coefficient in the vertical direction, which is an important parameter to measure the attenuation capability of aerosol particles to solar radiation and can well reflect the concentration of aerosols in atmosphere. In general, the larger the AOD, the more turbid the atmosphere, and vice versa.
The Aerosol Robotic Network (AERONET) uses the ce-318 full-automatic solar direct/scattering radiometer, which can measure direct and scattered radiation in seven bands of the sun. There are three levels of these data: Unscreened Level 1.0 products, cloud-tested Level 1.5 products and Level 2.0 products through cloud detection and quality control [29,30]. This paper selects AOD data (Level 2.0) from Hong Kong polytechnic university station and Sheungshui station from 2013 to 2017 (Figure 1b).

2.5. Objective Circulation Classification

There are five kinds of objective weather classification methods, namely, the correlation method, cluster analysis method, principal component analysis method, fuzzy method and nonlinear method [7,19]. T-mode principal component analysis (PCA) combined with k-means clustering is selected to classify circulation patterns objectively in this paper, and it is divided into two steps. First, the principal components that can objectively express sea level pressure are obtained by principal component analysis. From January 2013 to December 2017, there are 1826 days in total. Taking the 00:00 UTC sea level pressure of 6161 points of each day as a line, a 1826 × 6161 matrix was created, and the data were standardized. Through T-mode principal component analysis, a principal component that can objectively express the sea level pressure of 6161 grid points was obtained. According to the principle of 85% cumulative variance contribution, two principal components were selected to achieve the purpose of dimension reduction [31]. This method can accurately reflect the characteristics of the original circulation field and will not change too much due to the adjustment of the parting object, and the obtained space–time field is more stable [32]. Second, a k-means clustering method was used to classify the principal components obtained in the first step, and the specific classification number was determined by the criterion function.

2.6. Statistical Analysis Method

To analyze the relationship between weather conditions and aerosol pollution, some statistical methods, such as correlation analysis, regression analysis and variance analysis, were used in this paper. Correlation analysis is a common statistical analysis method to measure the degree of correlation between two variables. In this paper, the Pearson correlation coefficient was used, which is also the most commonly used correlation coefficient. The double-tailed t-test was used to test the significance of correlation coefficients. Regression analysis was used to judge the trend of variables and test the significance of the trend. If the slope obtained by the regression analysis was greater than (less than) zero at a 95% confidence interval, this showed a significant increase (decrease) trend. The variance analysis method can be used to determine whether there are significant differences between two or more groups of data. This method can determine the influence of the variation of controllable factors. The one-way analysis of variance was used in this paper.

3. Results and Discussion

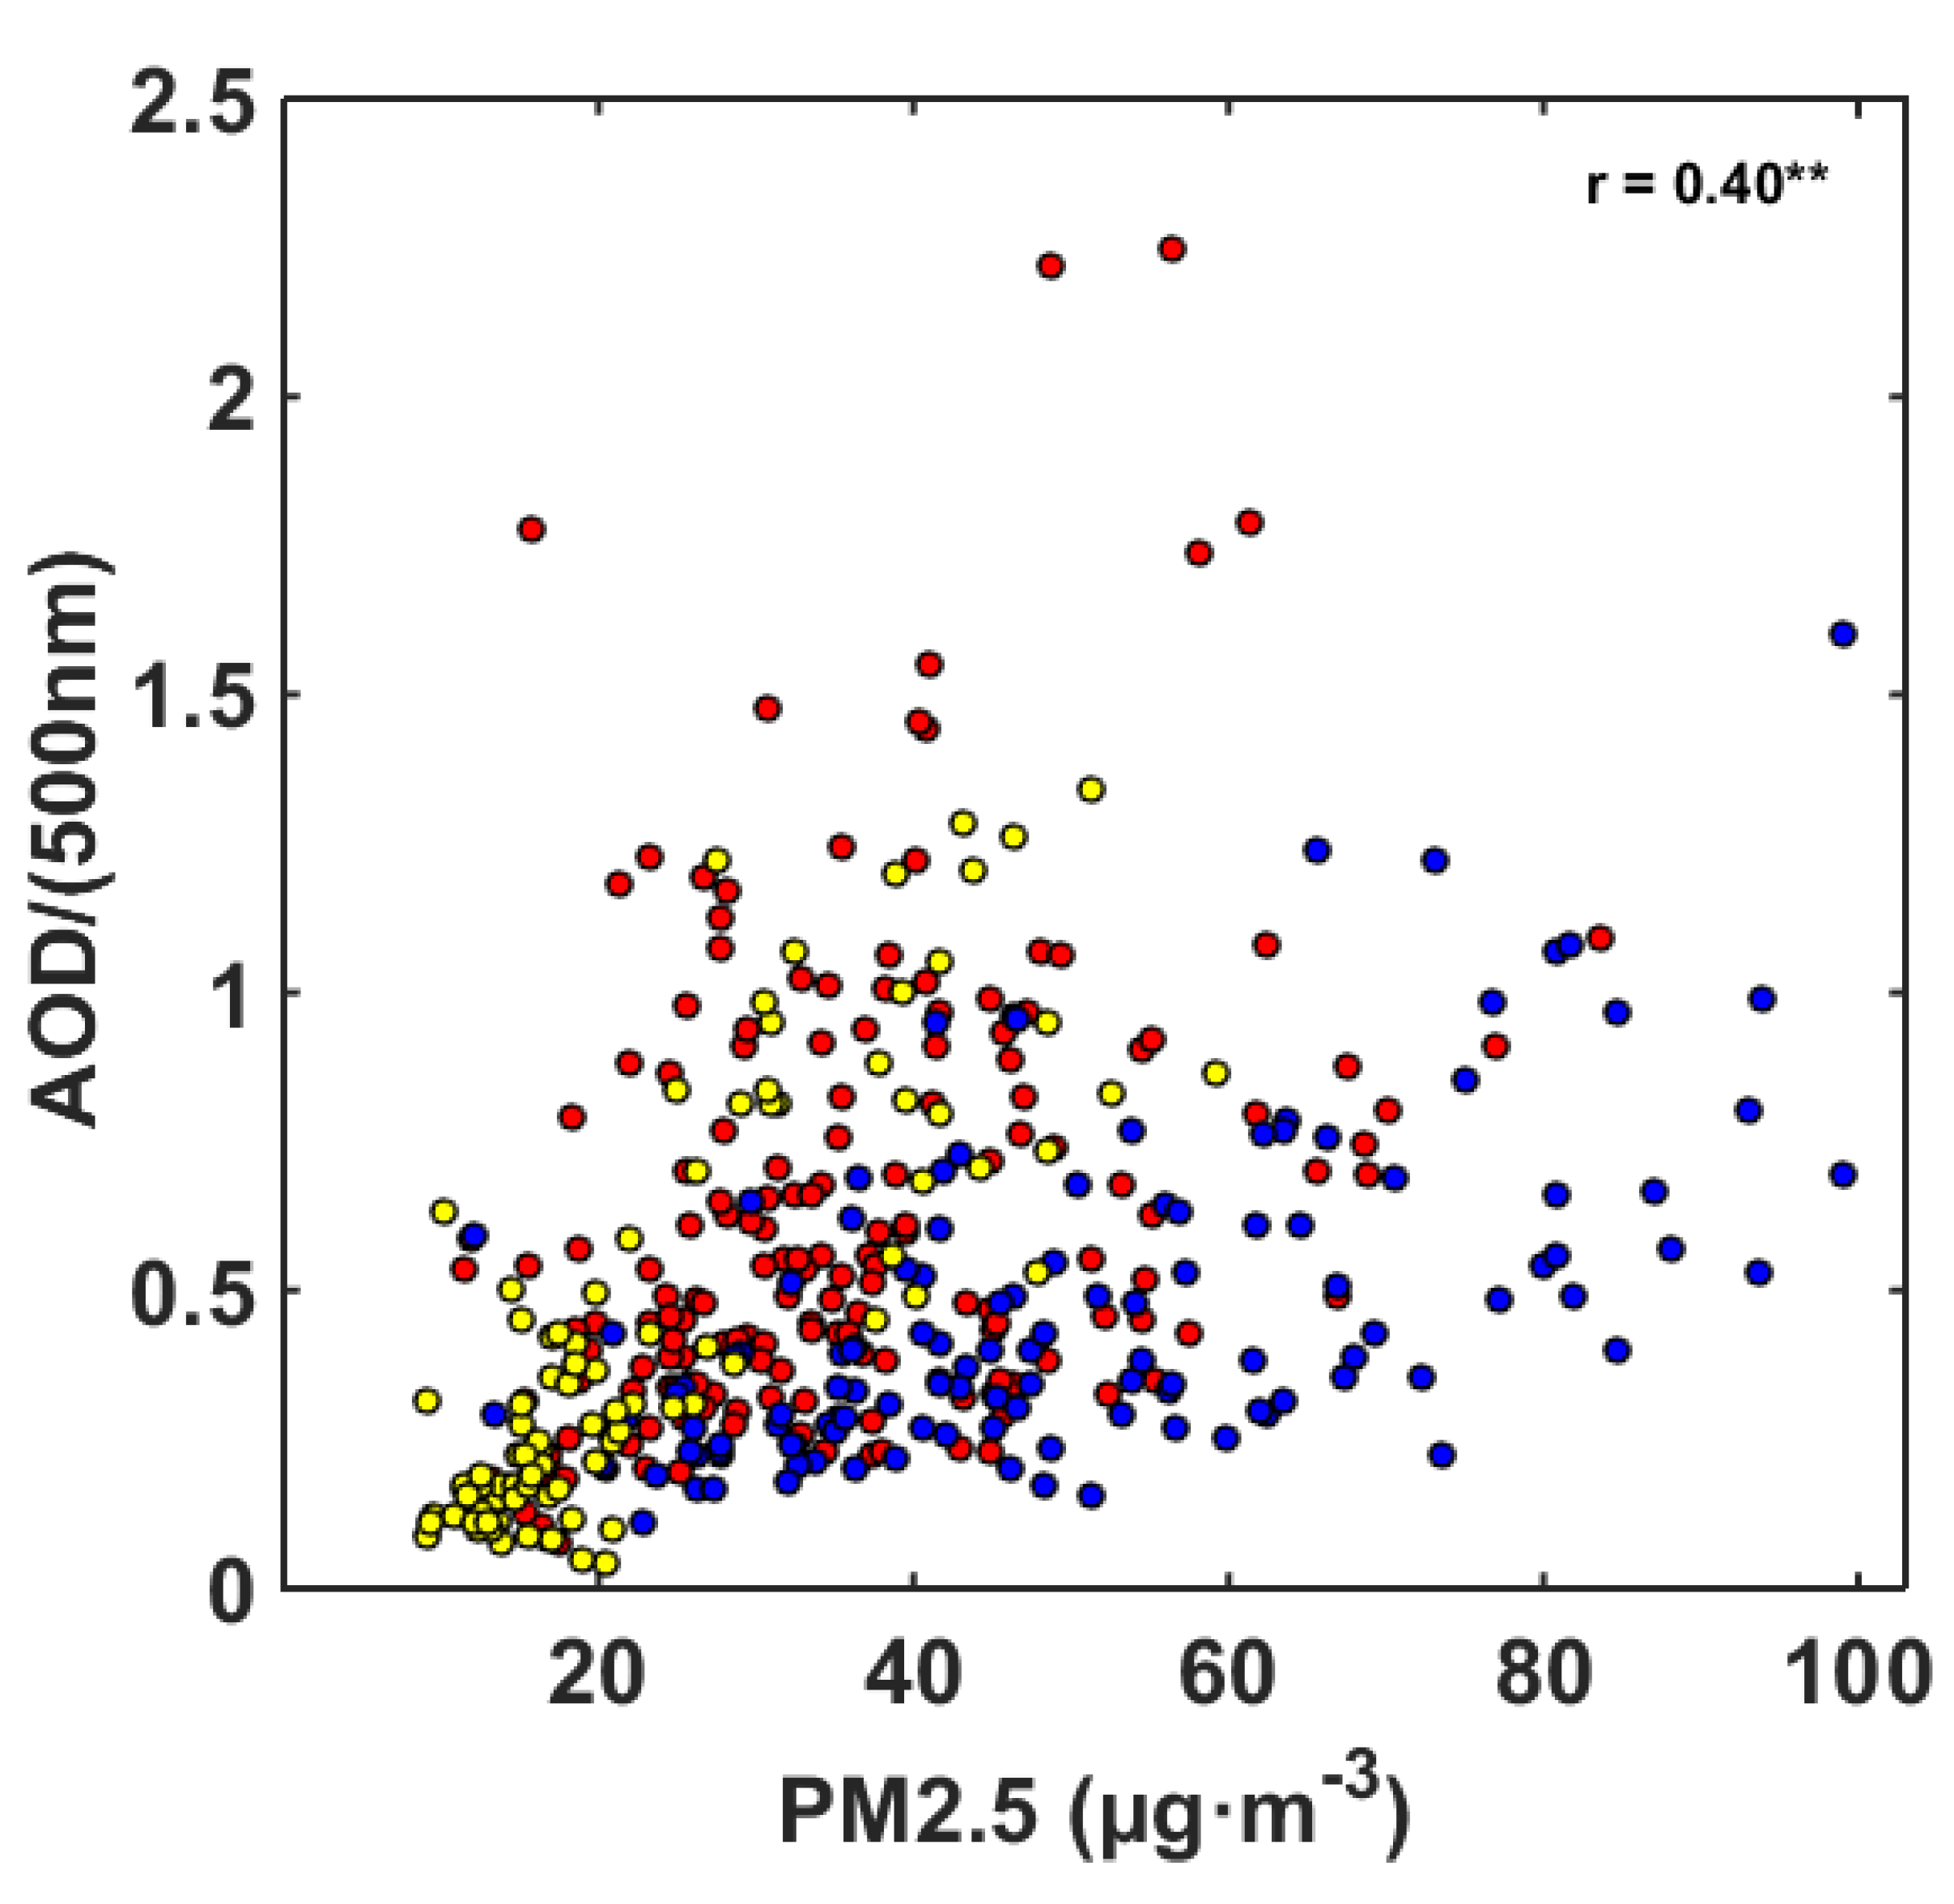
3.1. PM2.5 Concentration Trends and Optical Characteristics

The average daily PM2.5 concentration in the PRD during 2013 to 2017 is shown in Figure 2. The days for which the daily PM2.5 concentration exceeded 75 μg·m−3 (national air quality level II standard) reached 106 days, which only accounted for 6% of the total. China’s industry is in a period of rapid development. According to the Chinese environmental bulletin, the annual average of PM2.5 concentrations in China from 2013 to 2017 was 72, 62, 50, 47 and 43 μg·m−3, respectively [6]. Compared with other regions, such as the Beijing–Tianjin–Hebei region, Yangtze River Delta and Sichuan Basin region, the overall air quality in the PRD was not particularly bad [33]. However, the national air quality standard in China is far from the international standard of the World Health Organization (WHO). The PM2.5 concentration in the PRD is only meeting the Interim target-1 (IT-1) set by the WHO. The air quality guideline (AQG) recognized by WHO is that the annual average concentration and 24-hour average concentration limits of PM2.5 are 10 μg·m−3 and 25 μg·m−3, respectively [34]. If the concentration exceeds this standard, the risk of death will increase significantly. Therefore, according to this standard, there is significant improvement required to prevent and control air pollution in the PRD.
As shown in Figure 2, the concentration of PM2.5 in the PRD had an obvious periodic change, with a trough in summer and peak in winter. Low PM2.5 concentrations appeared in June, July and August, with monthly averages of 21.7, 23.7 and 27.4 μg·m−3, respectively. High values appeared in October, November, December and January, with monthly means of 47.1, 45.7, 58.4 and 59.8 μg·m−3, respectively. A regression analysis showed that PM2.5 decreased significantly in the PRD (p < 0.05), with a decrease of 2.81 μg·m−3·yr−1 (2.19–3.43). With a decrease of 4.12 μg·m−3·yr−1 (2.70–5.58) in winter and 0.37 μg·m−3·yr−1 (−0.40–1.13) in summer, the decreasing trend seems more obvious in winter than in summer. Because of adverse meteorological conditions in winter, the obvious decrease of PM2.5 in winter implies that air pollution control policies are very effective in the PRD. Compared with the whole country, the seasonal variation of anthropogenic emissions of particulate matter was not obvious in the PRD region [35]. Thus, the seasonal variation of PM2.5 concentration was shown to be mainly due to meteorological condition changes, pollutant regional transport, chemical reactions and precursor transport indirectly affected by meteorological conditions.
Figure 3 shows the daily total radiation in the PRD from 2013 to 2017. In recent years, the average daily total radiation in the PRD has been on the rise, with a rate of 0.22 MJ·m−2·yr−1. Regression analysis showed that the increase trend of total radiation in the PRD is significant (p < 0.05). Seasonal difference of increasing trends of total radiation is not obvious. Aerosol absorbs and scatters solar radiation, which is one of the factors affecting total radiation. The correlation coefficient between the average annual total radiation and PM2.5 concentration is −0.86, which implies that the decrease of PM2.5 concentration may be one of the reasons for the increase of total radiation in the PRD. Figure 4 shows the scatter diagram of the daily AOD in Hong Kong and the near-surface PM2.5 concentration in Shenzhen. AOD was significantly correlated with near-surface PM2.5 concentration (p < 0.05), with a correlation coefficient of 0.4, which is shown in the upper right corner of Figure 4. In addition, the correlation between AOD and PM2.5 is the highest in summer, with a correlation coefficient of 0.80, followed by winter, with a correlation coefficient of 0.56. The lowest correlation is in spring and autumn with a correlation coefficient of 0.35.

3.2. Weather Characteristics of Different Circulation Patterns

Based on the ECMWF ERA-Interim sea level pressure reanalysis data at 00:00 UTC, nine circulation patterns were determined using T-mode PCA combined with the k-means clustering method (Figure 5). The occurrence frequencies of circulation patterns in each season are shown in Figure 6. Figure 7 shows the wind rose maps under different weather conditions, and Figure 8 shows the vertical velocity distribution and wind flow at 850 hPa for different weather conditions. Table 1 shows the average values of meteorological elements for different circulation patterns. The corresponding weather characteristics of different circulation patterns are shown below.
CT1, CT4 and CT7 occur mainly in summer. CT1 is the most frequent circulation type, with an occurrence frequency of 16.0%. This circulation type is related to the first rainy season in South China. The PRD is located in the rear of the weak high pressure, and the wind near the ground and at 850 hPa is southerly, with a relatively low WS10 and BLH and a relatively high T2, RH2 and PRE. CT4 is the least frequent circulation type of all, with an occurrence frequency of 7.1%. The PRD region is located in or near to the center of low pressure, and has a relatively high T2 and RH2 and southwesterly wind. CT7, with a frequency of 11.6%, occurs mainly in summer. A relatively weak low-pressure area appears in southern PRD, with a rising movement in most areas. The southwesterly strong winds occur in most regions of PRD. In addition, this type corresponds to relatively high T2 and RH2, and sufficient PRE.
CT2, CT3 and CT5 occur mainly in winter. CT2 represents the strongest cold air process, followed by CT5 and CT3. For CT2, the occurrence frequency is 8.8%. A cold high-pressure area controls southern China, and its center is close to Guangdong. Affected by cold and high pressure, a typical winter weather pattern with large northeasterly wind, low T2 and RH2, and less PRE appears in the PRD region. Cold air flows over Nanling and Wuyi mountains, forming a downdraft in the PRD region. The strong cold air and wind shear leads to the enhancement of turbulence and formation of a deep boundary layer. For CT5, the occurrence frequency is 14.5%. The PRD is located in the front of the cold anticyclone. The weather is similar to that of CT2, but the intensity is weaker than that of CT2. For CT3, the occurrence frequency is 13.0%. The PRD is located at the edge of the cold high pressure, with a relatively gentle downward movement and a small pressure gradient. The static weather is characterized by a relatively small northeasterly wind and BLH, and relatively high T2 and RH2.
CT6, CT8 and CT9 appear mainly in spring and autumn, with an occurrence frequency of 8.5%, 11.0% and 9.4%, respectively. For CT6, with a relatively low atmospheric pressure and pressure gradient, easterly small winds are prevalent in the PRD region. Weather patterns with high T2, and low RH2 and BLH appear easily in this circulation type. For CT8, affected by the periphery of a subtropical high, warm and humid air flow appears in the PRD region, which easily forms PRE. CT9 is a weak air cold process. The weather is characterized by relatively low RH2 and PRE.

3.3. Relation between Different Circulation Patterns and Near-surface PM2.5 Concentration

Figure 9 is a box diagram of PM2.5 concentration for nine circulation patterns. The total differences in PM2.5 concentrations between different circulation patterns are significant based on a one-way analysis of variance (p < 0.05). The average PM2.5 concentrations for CT1 to CT9 are 24.5, 49.7, 54.9, 32.7, 49.2, 34.5, 22.1, 39.4 and 43.6 μg·m-3, respectively. Based on a one-way analysis of variance between PM2.5 concentrations in two circulation patterns (Table 2), most of the differences in PM2.5 concentration corresponding to different circulation patterns are significant (p < 0.05), indicating that the evolution of atmospheric circulation is an important factor driving the change of air quality in the PRD region. Furthermore, this indirectly indicates that the classification of circulation patterns is reasonable.
Frequent precipitation is of benefit for the removal of pollutants in summer. On the other hand, southerly wind brings clean air flow from the South China Sea in the PRD region. PM2.5 concentration is low for summer circulation patterns (CT1, CT4 and CT7). For CT4, the PRD is located in or near to the center of the low-pressure system. A convergence zone appears in the PRD region, which negatively impacts pollutant diffusion and makes it easy to accumulate pollutants. Hence, the PM2.5 concentration in CT4 is the highest in the three summer circulation types (CT1, CT4 and CT7).
Although WS10 and BLH are relatively large in winter (CT2, CT3 and CT5), the air pollution in the PRD region is more serious than that in summer. This is due to large-scale downdraft (Figure 8) suppressing pollutant vertical diffusion, less PRE (Table 1) reducing the wet removal of pollutants, and northerly wind (Figure 7), which is favorable for pollutant transport from the Yangtze River Delta and central China. The cold high-pressure system is dynamic and moves from the north to south in east China. As cold air begins to affect South China, the PRD is located in front of the cold front, and the wind increases gradually. With the passage of the cold front, the PRD is under the control of a cold high-pressure pattern. After the passage of the cold air, the PRD is located to the rear of the cold high-pressure pattern and is affected by southward warm and wet airflow. The strong cold air process (CT2 and CT5) brings a large northerly wind and is beneficial to the removal of pollutants. A weak cold air process (CT3 and CT9) negatively affects the diffusion and removal of pollutants; meanwhile, it brings pollutants from east and central China, resulting in severe air pollution in the PRD region. Similar results have been detected in previous studies [36]. When the high pressure moves to the South China Sea, the PRD is affected by clean and humid air from the south, resulting in low PM2.5 concentration and good air quality (CT8).

3.4. Aerosol Optical and Radiation Characteristics under Different Circulation Patterns

Figure 10a is an AOD box diagram for nine circulation patterns. The AOD value corresponding to each circulation type is basically similar to the PM2.5 concentration (Figure 9). However, there is nonconformity between AOD and PM2.5 concentration in CT4 and CT6. In these circulation patterns, the AOD is high, while the near-surface PM2.5 concentration is low. CT4 and CT6 easily form typhoons or tropical cyclones. The strong winds and heavy PRE brought by typhoons or tropical cyclones enable near-surface pollutants to be well dispersed and removed, but also bring particles with a larger diameter from the ocean, and pollutants that diffuse to the upper atmosphere also cause high AOD [37]. In addition, the northern winds caused by typhoons or tropical cyclones in the process of moving northward into the East China Sea may also transport pollutants from the north to the PRD, causing a high AOD [38].
Figure 10b shows the box chart of total radiation for different circulation patterns. The influence of different circulation patterns on total radiation is obvious. The total radiations of CT1, CT4, CT6 and CT7 are high, while the total radiations of CT2, CT3 and CT5 are low. The relationship between the total radiation reaching the ground and circulation patterns is contrary to PM2.5 concentration and AOD. Aerosol is one of the important factors affecting solar radiation reaching the ground. Aerosol particles scatter and absorb the short-wave radiation of the sun and weaken the total solar radiation reaching the ground [39]. Although the AOD is high for CT4 and CT6, the total solar radiation reaching the ground is high. This phenomenon indicates that near-surface aerosols may play an important role in the total solar radiation reaching the ground by absorbing and scattering radiation; however, this needs more supporting research and evidence. In addition to aerosols, the seasonal variation of radiation also impacts the relationship between the circulation patterns and total solar radiation. Because CT4 occurs mainly in summer, the total solar radiation reaching the ground is high.

4. Conclusions

As far as we know, few studies have focused on the impact of circulation patterns on aerosol pollution in the PRD region based on an objective circulation classification method. Using conventional meteorological observation data, meteorological reanalysis data, ground radiation observation data, and near-surface PM2.5 concentration and AOD observation data, this paper analyzes the temporal variation of aerosol and its optical characteristics, classifies atmospheric circulation patterns, and investigates the impact of atmospheric circulation on local meteorological conditions and aerosol pollution in the PRD region during 2013 to 2017. The main results are noted below.
The PM2.5 concentration in the Pearl River Delta showed a significant downward trend (p < 0.05). A high (low) PM2.5 concentration appears in winter (summer). Because anthropogenic emission does not have obvious seasonal variation, an obvious seasonal variation of PM2.5 concentration may be related to the seasonal variation of meteorological conditions. Significant differences in PM2.5 concentrations corresponding to different circulation patterns are found, indicating that the evolution of atmospheric circulation is an important factor driving air quality changes in the PRD. Generally, atmospheric diffusion conditions and removal ability in winter are worse than those in summer in the PRD region. In winter, a strong cold air process can well diffuse and remove pollutants in the PRD region, while a weakened cold air process and static weather negatively impact pollutant diffusion. The prevailing wind in winter (northerly wind) makes it easy to transport pollutants from the north of PRD and forms severe air pollution. In summer, the prevailing wind (southerly wind) brings clean air from South China Sea, and a high frequency of precipitation is beneficial to the wet scavenging of pollutants, resulting in improved air quality in the PRD region. When the PRD is located in or near to the center of the low-pressure system, a convergence zone forms in the PRD region, which negatively impacts pollutant diffusion in summer. The relationship between AOD and the circulation patterns is basically similar to the relationship between near-surface PM2.5 concentration and circulation patterns. In a typhoon or tropical cyclone (CT4 and CT6), the AOD is relatively high, while near-surface PM2.5 concentration is relatively low in the PRD region. The influence of different circulation patterns on total radiation is obvious. A negative correlation exists between the annual total radiation and annual PM2.5 concentration. In recent years, the decrease of PM2.5 concentration in the PRD may be one of the reasons for the increase of total radiation.
There are many methods to classify circulation patterns objectively. Furthermore, only sea level pressure may not be sufficient for circulation classification. In fact, some typical weather systems, such as the periphery of a typhoon or tropical cyclone and subtropical highs, are not well identified in this paper. In future, we plan to identify which methods and data are suitable for circulation classification in the PRD region.

Author Contributions

Writing—original draft preparation, Y.L., and J.H.; writing—review and editing, J.H., and X.L.; visualization, C.Z., and L.Z.; supervision, J.H., X.L., S.G., and H.C.; funding acquisition, J.H, and S.G. All authors have read and agree to the published version of the manuscript.

Funding

This work was supported by the National Natural Science Foundation of China (No. 91744209, 41975131, 41705080), the CAMS Basis Research Project (No. 2017Y001, 2019Z009), CAMS Science and Technology Development Fund (2018KJ020), and the CMA Innovation Team for Haze-fog Observation and Forecasts.

Conflicts of Interest

The authors declare no conflict of interest.

References

  1. Wu, D.; Tie, X.; Li, C.; Ying, Z.; Lau, A.K.; Huang, J.; Deng, X.; Bi, X. An extremely low visibility event over the Guangzhou region: A case study. Atmos. Environ. 2005, 39, 6568–6577. [Google Scholar] [CrossRef]
  2. Wu, D.; Tie, X.; Deng, X. Chemical characterizations of soluble aerosols in southern China. Chemosphere 2006, 64, 749–757. [Google Scholar] [CrossRef]
  3. Wu, D. Review of China’s haze weather in recent ten years. J. Environ. Sci. 2012, 32, 257–269. [Google Scholar]
  4. Song, C.; He, J.; Wu, L.; Jin, T.; Chen, X.; Li, R.; Ren, P.; Zhang, L.; Mao, H. Health burden attributable to ambient PM2.5 in China. Environ. Pollut. 2017, 223, 575–586. [Google Scholar] [CrossRef] [PubMed]
  5. Chen, Y.; Jiang, W.M.; Guo, W.L.; Guo, W.L.; Miao, S.G.; Chen, X.Y.; Ji, C.P.; Wang, X.Y. Effects of urban agglomeration development on local atmospheric pollutant diffusion in the Pearl River delta region. J. Environ. Sci. 2005, 25, 700–710. [Google Scholar]
  6. 2013–2017 China Environmental Quality Bulletin [2018-05-31]. Available online: http://www.mee.gov.cn/hjzl/zghjzkgb/lnzghjzkgb/ (accessed on 7 January 2020).
  7. Ambient Air Pollution: A Global Assessment of Exposure and Burden of Disease. 2016. Available online: https://www.who.int/phe/publications/air-pollution-global-assessment/en/ (accessed on 10 March 2020).
  8. He, J.; Wu, L.; Mao, H.; Li, R. Effects of meteorological conditions on air quality in Langfang city, Hebei province. Environ. Sci. Res. 2016, 29, 791–799. [Google Scholar]
  9. Zhang, X.Y.; Sun, J.Y.; Wang, Y.Q.; Li, W.J.; Zhang, Q.; Wang, W.G.; Quan, J.N.; Cao, G.L.; Wang, J.Z.; Yang, Y.Q.; et al. The causes of China’s fog-haze and its governance. Chin. Sci. Bull. 2013, 58, 1178–1187. [Google Scholar]
  10. Wang, L.; Wang, Y.; Wang, Y.; Sun, Y.; Ji, D.; Ren, Y. Relationship between different synoptic weather patterns and concentrations of atmospheric pollutants in Beijing during summer and autumn. China Environ. Sci. 2010, 30, 924–930. [Google Scholar]
  11. Wang, W.; Chen, H.S.; Wu, Q.; Wei, L.; Wang, Z.; Li, C.; Chen, D.; Jiang, Z.; Wu, W. Numerical study of PM2.5 regional transport over Pearl River Delta during a winter heavy haze event. Acta Sci. Circumstantiae 2016, 36, 2741–2751. [Google Scholar]
  12. Zhang, X.X. Source Apportionment Based on Long-Term PM Compositional Monitoring at Multiple Stations over the Pearl River Delta. Master’s Thesis, South China University of Technology, Guangzhou, China, 2018. [Google Scholar]
  13. Lai, A.Q.; Chen, X.Y.; Liu, Y.M.; Wang, X.M.; Fan, Q. Characteristics of complex pollution with high concentrations of PM2.5 and O3 over the Pearl River Delta, China. Acta Sci. Nat. Univ. Sunyatseni 2018, 57, 30–36. [Google Scholar]
  14. Wang, W.D.; Chen, H.S.; Yao, X.F.; Zheng, H.T.; Yan, P.Z.; Wu, W.W.; Xu, X.Y.; Huang, J.L.; Wang, Z.F. A Study of the Meteorological Conditions and Synoptic Factors in Pollution Episodes of Zhongshan during 2013. Environ. Monit. China 2016, 32, 44–52. [Google Scholar]
  15. Wang, Y.; Wang, Z.; Chen, X.; Wang, Z.; Fan, S.; Chen, D.; Wu, Q. Impact of typical meteorological conditions on air pollution over Pearl River Delta in autumn. Acta Sci. Circumstantiae 2017, 37, 3229–3239. [Google Scholar]
  16. Zhang, H.Y.; Wang, X.S.; Lu, K.D.; Zhang, Y. Impact of Typical Meteorological Conditions on the O3 and PM10 Pollution Episodes in the Pearl River Delta in Autumn. Acta Sci. Nat. Univ. Pekin. 2014, 50, 565–576. [Google Scholar]
  17. Xiao, X.; Fan, S.J.; Su, R. Characteristics of a regional air pollution process over the Pearl River Delta during October 2011. Acta Sci. Circumstantiae 2014, 34, 290–296. [Google Scholar]
  18. Xu, J.M.; Chang, L.Y.; Ma, J.H.; Mao, Z.C.; Chen, L.; Cao, Y. Objective synoptic weather classification on PM2.5 pollution during autumn and winter seasons in Shanghai. Acta Sci. Circumstantiae 2016, 36, 4303–4314. [Google Scholar]
  19. Zhang, Y.; Wang, S.G.; Jia, X.W.; Lian, J.B.; Zhang, X.L.; Yang, X. Study on an objective synoptic typing method for air pollution weather in North China during winter half year. Acta Sci. Circumstantiae 2018, 38, 3826–3833. [Google Scholar]
  20. He, J.; Gong, S.; Zhou, C.; Lu, S.; Wu, L.; Chen, Y.; Yu, Y.; Zhao, S.; Yu, L.; Yin, C. Analyses of winter circulation types and their impacts on haze pollution in Beijing. Atmos. Environ. 2018, 192, 94–103. [Google Scholar] [CrossRef] [Green Version]
  21. Sun, Y.; Niu, T.; He, J.; Ma, Z.; Liu, P.; Xiao, D.; Hu, J.; Yang, J.; Yan, X. Classifcation of circulation patterns during the formation and dissipation of continuous pollution weather over the Sichuan Basin, China. Atmos. Environ. 2020, 223, 117244. [Google Scholar] [CrossRef]
  22. He, J.; Yu, Y.; Xie, Y.; Mao, H.; Wu, L.; Liu, N.; Zhao, S. Numerical model-based artificial neural network model and its application for quantifying impact factors of urban air quality. Water Air Soil Pollut. 2016, 227, 235. [Google Scholar] [CrossRef]
  23. Huang, Z.Z.; Li, C.M.; Zhai, Z.H.; Ye, W.R. Impacts of climate warming on phenophases in Guangdong. Ecol. Environ. Sci. 2012, 21, 991–996. [Google Scholar]
  24. Liu, C.H.; Deng, X.J.; Zhu, B. Characteristics of GSR of China’s three major economic regions in the past 10 years and its relationship with O3 and PM2.5. China Environ. Sci. 2018, 38, 2820–2829. [Google Scholar]
  25. The National Meteorological Information Center (NMIC). Available online: http://data.cma.cn/ (accessed on 20 September 2019).
  26. The ECWMF ERA-Interim reanalysis data. Available online: https://www.ecmwf.int/en/forecasts/datasets/reanalysis-datasets/era-interim (accessed on 20 September 2019).
  27. Ma, C.C.; Yu, Y.; He, J.J.; Chen, X.; Xie, J. Analyses of Simulation Result in Loess Plateau by WRF Model with Two Reanalysis Data. Plateau Meteorol. 2014, 33, 698–711. [Google Scholar]
  28. The China National Environmental Monitoring Centre (CNEMC). Available online: http://106.37.208.233:20035/ (accessed on 20 September 2019).
  29. Dubovik, O.; Smirnov, A.; Holben, B.N.; King, M.D.; Kaufman, Y.J.; Eck, T.F.; Slutsker, I. Accuracy assessments of aerosol optical properties retrieved from Aerosol Robotic Network (AERONET) Sun and sky radiance measurements. J. Geophys. Res. Atmos. 2000, 105, 9791–9806. [Google Scholar] [CrossRef] [Green Version]
  30. Zhang, J.P.; Zhu, T.; Zhang, Q.H.; Li, C.C.; Shu, H.L.; Ying, Y.; Dai, Z.P.; Wang, X.; Liu, X.Y.; Liang, A.M.; et al. The impact of circulation patterns on regional transport pathways and air quality over Beijing and its surroundings. Atmos. Chem. Phys. 2012, 12, 5031–5053. [Google Scholar] [CrossRef] [Green Version]
  31. Huth, R. An inter comparison of computer-assisted circulation classification methods. Int. J. Climatol. 1996, 16, 893–922. [Google Scholar] [CrossRef]
  32. Huth, R.; Beck, C.; Philipp, A.; Demuzere, M.; Ustrnul, Z.; Cahynová, M.; Kyselý, J.; Tveito, O.E. Classifications of atmospheric circulation patterns. Ann. N. Y. Acad. Sci. 2008, 1146, 105–152. [Google Scholar] [CrossRef]
  33. Hou, X.; Zhu, B.; Kumar, K.R.; Lu, W. Inter-annual variability in fine particulate matter pollution over China during 2013–2018: Role of meteorology. Atmos. Environ. 2019, 214, 116842. [Google Scholar] [CrossRef]
  34. WHO. Air Quality Guidelines for Particulate Matter, Ozone, Nitrogen Dioxide and Sulfur Dioxide. 2005. Available online: https://apps.who.int/iris/bitstream/handle/10665/69477/WHO_SDE_PHE_OEH_06.02_eng.pdf;jsessionid=2FD62D84E408995F617A1AB71E86159C?sequence=1 (accessed on 10 March 2020).
  35. Zheng, Z.Y. A Evaluation Study of Anthropogenic Particulate Emissions Inventories Using Remote Sensing Data in the PRD Region. Master’s Thesis, South China University of Technology, Guangzhou, China, 2011. [Google Scholar]
  36. Fan, S.J.; Wang, A.Y.; Fan, Q.; Liu, J.; Wang, B.M. Atmospheric boundary layer concept model of the Pearl River Delta and its application. J. Trop. Meteorol. 2005, 21, 286–292. [Google Scholar]
  37. Zhao, Q.; Yang, S.Z.; Qiao, Y.L.; Yuan, G.Y. Analysis of the Optical Characteristic of Littoral Aerosol Influenced by Typhoon. Acta Opt. Sin. 2008, 11, 2046–2050. [Google Scholar] [CrossRef]
  38. Li, C.C.; Lau, A.K.; Mao, J.; Chen, A. An Aerosol Pollution Episode in Hong Kong with Remote Sensing Products of MODIS and LIDAR. Q. J. Appl. Meteorol. 2004, 6, 641–650. [Google Scholar]
  39. Coakley, J.A.; Cess, R.D.; Yurevich, F.B. The Effect of Tropospheric Aerosols on the Earth’s Radiation Budget: A Parameterization for Climate Models. J. Atmos. Sci. 1983, 40, 116–138. [Google Scholar] [CrossRef] [Green Version]
Figure 1. (a) The location of the study area (red box) and (b) sites map of meteorological observation stations (red points), air quality observation stations (green points), Aerosol Robotic Network (AERONET) stations (blue points), and radiation observation station (black point) in the Pearl River Delta (PRD) region.
Atmosphere 11 00288 g001
Figure 2. Daily average PM2.5 concentration from 2013 to 2017 (the red solid line is the fitting line using the linear regression model).
Atmosphere 11 00288 g002
Figure 3. Daily average total radiation from 2013 to 2017 (the red solid line is the fitting line using the linear regression model).
Atmosphere 11 00288 g003
Figure 4. Scatter diagram of the daily aerosol optical depth (AOD) in Hong Kong and near-surface PM2.5 concentration in Shenzhen during 2013 to 2017 (the yellow points represent summer data, the blue points represent winter data, and the red points represent spring and autumn data; the symbol ”**” indicates that the correlation coefficient is significant at the level of 0.01).
Atmosphere 11 00288 g004
Figure 5. Mean sea level pressure and frequency for each circulation type in the PRD region from 2013 to 2017.
Atmosphere 11 00288 g005
Figure 6. Seasonal variation of the occurrence frequency of the nine circulation patterns during 2013–2017.
Atmosphere 11 00288 g006
Figure 7. Wind rose maps under different circulation conditions. The color bar represents the range of wind speed; the radius represents wind frequency.
Atmosphere 11 00288 g007
Figure 8. The vertical velocity distribution and horizontal wind field at 850 hPa for each circulation pattern (a negative value is downdraft and positive value is updraft).
Atmosphere 11 00288 g008
Figure 9. Box chart of PM2.5 concentration for nine circulation patterns (the box boundaries indicate the first and third quartiles, the middle lines indicate median values, lines above and under the box indicate the maximum and minimum values, and the solid dots indicate average values).
Atmosphere 11 00288 g009
Figure 10. Box chart of AOD (a) and total radiation (b) for nine circulation patterns in the PRD region (box boundaries indicate the first and third quartiles, the middle lines indicate median values, lines above and under the box indicate the maximum and minimum values, and the solid dots indicate average values).
Atmosphere 11 00288 g010
Table 1. Mean meteorological conditions for each circulation type in the Pearl River Delta region from 2013 to 2017 (WS10: 10 m wind speed; WD10: 10 m wind direction; RH2: 2 m relative humidity; T2: 2 m temperature; PRE: precipitation; BLH: boundary layer height).
TypeOccurrence Frequency (%)WS10 (m/s)WD10 (°)RH2 (%)T2 (◦C)PRE (mm/day)BLH (m)
CT116.01.91155.783.527.59.69480.8
CT28.82.4273.764.313.01.44689.0
CT313.01.7688.680.319.62.64518.7
CT47.12.07177.979.728.99.84491.1
CT514.52.3077.473.015.91.95603.5
CT68.52.05133.676.726.34.74513.2
CT711.62.17165.982.428.49.95506.5
CT811.01.86117.584.223.35.65460.8
CT99.42.2781.974.722.03.14563.3
Average 2.09119.177.622.85.45536.3
Table 2. The p-value of the variance analysis of PM2.5 concentration between different circulation patterns (the symbols “*”, “**” and “***” mean that the difference between the two groups is significant at the levels of 0.05, 0.01 and 0.001, respectively, and the symbol “/” means that the difference is not significant at the level of 0.05).
TypeCT1CT2CT3CT4CT5CT6CT7CT8CT9
CT1 ***************/******
CT2 *****/***********
CT3 ******************
CT4 ***/*********
CT5 ***********
CT6 ********
CT7 ******
CT8 *
CT9

