Article

Spatiotemporal Variations of Precipitation in China Using Surface Gauge Observations from 1961 to 2016

1
State Key Laboratory of Earth Surface Processes and Resource Ecology, College of Global Change and Earth System Science, Beijing Normal University, Beijing 100875, China
2
Division of Geology and Planetary Science, California Institute of Technology, Pasadena, CA 91125, USA
3
Numerical Weather Prediction Center of China Meteorological Administration, Beijing 100081, China
*
Author to whom correspondence should be addressed.
Atmosphere 2020, 11(3), 303; https://doi.org/10.3390/atmos11030303
Submission received: 16 February 2020 / Revised: 9 March 2020 / Accepted: 18 March 2020 / Published: 20 March 2020
(This article belongs to the Section Meteorology)

Abstract

:
Long-term precipitation trend is a good indicator of climate and hydrological change. The data from 635 ground stations are used to quantify the temporal trends of precipitation with different intensity in China from 1961 to 2016. These sites are roughly uniformly distributed in the east or west regions of China, while fewer sites exist in the western region. The result shows that precipitation with a rate of <10 mm/day dominates in China, with a fraction of >70%. With a 95% confidence level, there is no significant temporal change of annually averaged precipitation in the whole of China. Seasonally, there are no significant temporal changes except for a robust decreasing trend in autumn. Spatially, significant differences in the temporal trends of precipitation are found among various regions. The increasing trend is the largest in Northwest China, and the decreasing trend is the largest in North China. The annually averaged number of precipitation days shows a decreasing trend in all regions except for Northwest China. Regarding precipitation type, the number of light precipitation days shows a robust decreasing trend for almost all regions, while other types show no significant change. Considering the high frequency, the temporal trends of light precipitation could highly explain the temporal variation of the total precipitation amount in China.

1. Introduction

Precipitation is a critical component in the hydrologic cycle and ecology system on both global and regional scales [1,2,3,4,5]. It also plays an essential role in the energy transport by storing or releasing latent heat in the climate system [6,7]. Therefore, characterizing the spatial distribution and temporal trends of precipitation is crucial both for improving the physical understanding of regional climate dynamics and for evaluating weather and climate models. Ultimately, it can help manage water for agriculture and deal with flood crisis, especially for a country with frequent drought and flooding such as China.
Various factors could affect the temporal and spatial patterns of precipitation on regional and global scales, including the natural variabilities, such as El-Nino/Southern Oscillation [8], the soil moisture [9], the surface temperature [2,10,11], and the aerosols [12,13,14,15,16,17,18]. As indicated by [2], when climate changes, there are changes in precipitation in the intensity, frequency, and duration. In China, whether precipitation trends are driven by greenhouse gases or anthropogenic aerosols has been under debate for a while. Qian et al. [19] analyzed the surface precipitation data and suggested that increasing aerosols could result in a decreasing trend of light and middle precipitation by serving as cloud condensation nuclei (CCN). Such a hypothesis about the microphysical aerosol effect on precipitation in China was corroborated by the climatic simulations using a state-of-the-art global climate model [20]. Thus, it is important to examine the precipitation variation from an observational perspective.
Long-term precipitation datasets have been obtained from different sources. The rain gauge measurements, ground and satellite remote sensing observations, and model outputs have generally been used for the analysis of precipitation [7,21,22,23,24]. As indicated by [23], there are non-negligible random errors and biases in the satellite precipitation retrievals because of the indirect nature of the relationship between the observation signal and the precipitation, the inadequate sampling, and algorithm imperfections. By contrast, rain gauges give relatively accurate point measurements, while suffering from sample volume, particularly over ocean and mountain regions.
Using the rain gauge observations, several studies have been carried out to obtain the precipitation characteristics in China [25,26,27,28,29,30], particularly regarding the extreme precipitation events. Liu et al. [26] described the spatial and temporal variation of precipitation observed daily at 272 weather stations operated by the China Meteorological Administration (CMA) from 1960 to 2000. They found that precipitation in China increased by 2% over that period, while the frequency of precipitation events decreased by 10%. Zhang et al. [29] examined the spatial and temporal variation of precipitation over China using 160 stations from 1951 to 2005. It showed that precipitation in China is uneven in space and time, and its complex temporal structure and spatial variations are different in each season. Chen et al. [31] carried out spatial interpolation to daily precipitation in China to get gridded precipitation from 1951 to 2005. Miao et al. [27] investigated the temporospatial features of hourly precipitation during the warm season over mainland China from 1991 to 2012 and revealed the basic information about the variation of the frequency, intensity, and total amount of precipitation. Zhou and Wang [30] showed the sensitivity of precipitation to long-term warming and found a high sensitivity for the weak precipitation days. While these studies provide basic information about the characteristics of precipitation over China, the change in the number of precipitation days has rarely been investigated. Moreover, the characteristics of precipitation found by previous studies are not always consistent. Furthermore, the station sites that are used are limited and uneven in either East China or West China, and the study period is also limited without accounting for the precipitation after 2010 for most studies.
Here, we choose the ground rain gauge stations with the longer precipitation records and roughly uniform spatial distribution to carry out a comprehensive analysis about the temporal trends of relative changes of both precipitation amount and precipitation days over different regions during a long time period from 1961 to 2016. The number of rain gauge network stations adopted in this study reaches 635, which is more than most of the previous studies and with a more uniform spatial distribution. The temporal variation of annually and seasonally averaged precipitation for precipitation amount and for precipitation days with different rain intensity over five classified regions will be analyzed. This can provide more information about the statistical characteristics of different types of precipitation in China, which can help understand the change of atmospheric processes.
The paper is organized as follows. Section 2 describes the data and methods. Section 3 shows the data analysis and results. And Section 4 provides the summary and discussion.

2. Data and Method

2.1. Weather Station and Data

Daily precipitation data were obtained from 2472 stations from the Chinese National Meteorological Center from January 1961 to February 2016 [32]. Considering that the number of observational stations in service has changed with time and there are partial stations with many missing data, we have made two criteria to select the data and observation stations. First, when there are continuously missing data for more than one year from 1961 to 2016 at a station, the observations from that station will not be used. Second, we divide the whole region in China into 1° × 1° grids and only adopt the station with the least missing data to use in every grid. With these two criteria, we roughly make the stations used in this study uniformly distributed in space in eastern or western China. By applying the two criteria, we finally obtained 635 stations in this study, which are shown in Figure 1. Considering what we use is daily precipitation data, we will not interpolate the precipitation data for the time or grids with missing data.

2.2. Precipitation Type and Region Classification

The daily precipitation data at all stations could be classified into six types according to the precipitation intensity (P), which are no (P < 0.1 mm/day), light (0.1 mm/day ≤ P ≤1 mm/day), small (1 mm/day < P ≤ 10 mm/day), middle (10 mm/day < P ≤ 25 mm/day), heavy (25 mm/day < P ≤ 50 mm/day), and severe (P > 50 mm/day) precipitations. Note that trace precipitation with P less than 0.1 mm/day and fogs have been defined as no precipitation. The last four types of precipitations are also called as effective precipitation [33].
We classify the China mainland into five regions based on their different climate characteristics, which are Northwest China (NW), Tibetan Plateau (TP), Northeast China (NE), North China (N), and South China (S), as indicated in Figure 1. The NW belongs to an arid and semi-arid region with a continental temperature monsoon climate. It generally has a relatively large area of dry surface and small amount of precipitation. The TP belongs to a plateau mountain region with a mountain climate. It is generally with strong solar radiation, low temperatures, and large diurnal variation of air temperature, along with significant uneven spatial distribution of precipitation. The NE and N both belong to the mid-latitude monsoon climate, with high temperatures and a large amount of precipitations in summer, and low temperatures and a small amount of precipitation in winter. The annual precipitation amounts in NE and N are both about 300–1000 mm. However, compared to N, the temperature over NE is lower with a larger seasonal variation. The S belongs to a subtropical monsoon climate, with high temperatures, a large amount of precipitations, and relatively weak seasonal variations of atmospheric status. A similar region classification has been adopted in our early study [34]. We will analyze the temporal trend of precipitation in each region, along with the whole of China.

2.3. Statistical Analysis Method

A linear fitting regression analysis for the temporal trend of both time averaged precipitation amount and precipitation day number is adopted in our analysis, which is described as
y = a t + b
where y is the seasonally or yearly averaged precipitation amount or precipitation day number (precipitation days), and t is the time in unit of year, a is the regression coefficient, which denotes the linear trend, b is another regression coefficient, which represents the intercept of linear fitting. The statistical t-test method is used to examine whether the temporal trends of precipitation amount and precipitation days reach statistical significance at a confidence level of 95%.
Considering the significant differences in precipitation amount and precipitation days among different regions, it is not meaningful to compare the temporal trend of precipitation among the different regions in absolute values. Instead, we focus on the temporal trend of relative changes of precipitation amount and the number of precipitation days for each region or station in units of %/10 years, which are defined as the ratio of temporal trends in absolute values to the averages of precipitation amount and precipitation days between 1961 and 2016.

3. Observation-Based Analysis and Results

3.1. Temporal Trends of Precipitation Amount

We first analyze the temporal trends of precipitation amount at every station and region in China. Figure 2 shows the temporal trends of relative changes in annual precipitation amount for all stations examined from 1961 to 2016. The blue solid circles indicate increasing precipitation amount, red open circles denote decreasing precipitation amount, and the large, middle, and small circles represent the stations with increasing (blue) or decreasing (red) precipitation amount > 10%/10 years, 10%/10 years–5%/10 years, and < 5%/10 years, respectively. For all significant temporal changes of precipitation amount with a confidence level of 95%, the stations have been indicated with an extra black ‘O’. Roughly, there are similar numbers for stations with increasing and decreasing trends of precipitation amount, which are 305 and 330 stations, respectively. However, for the stations with significant decadal trends of precipitation amount, the station number (55) with increasing trends is clearly larger than that (26) with decreasing trends. Figure 2 also shows a clear spatial pattern regarding the temporal trends of precipitation amount. Particularly, there is a clear increasing trend of precipitation amount in the NW region, and a clear decreasing trend of precipitation amount in the boundary regions between TP and S, N.
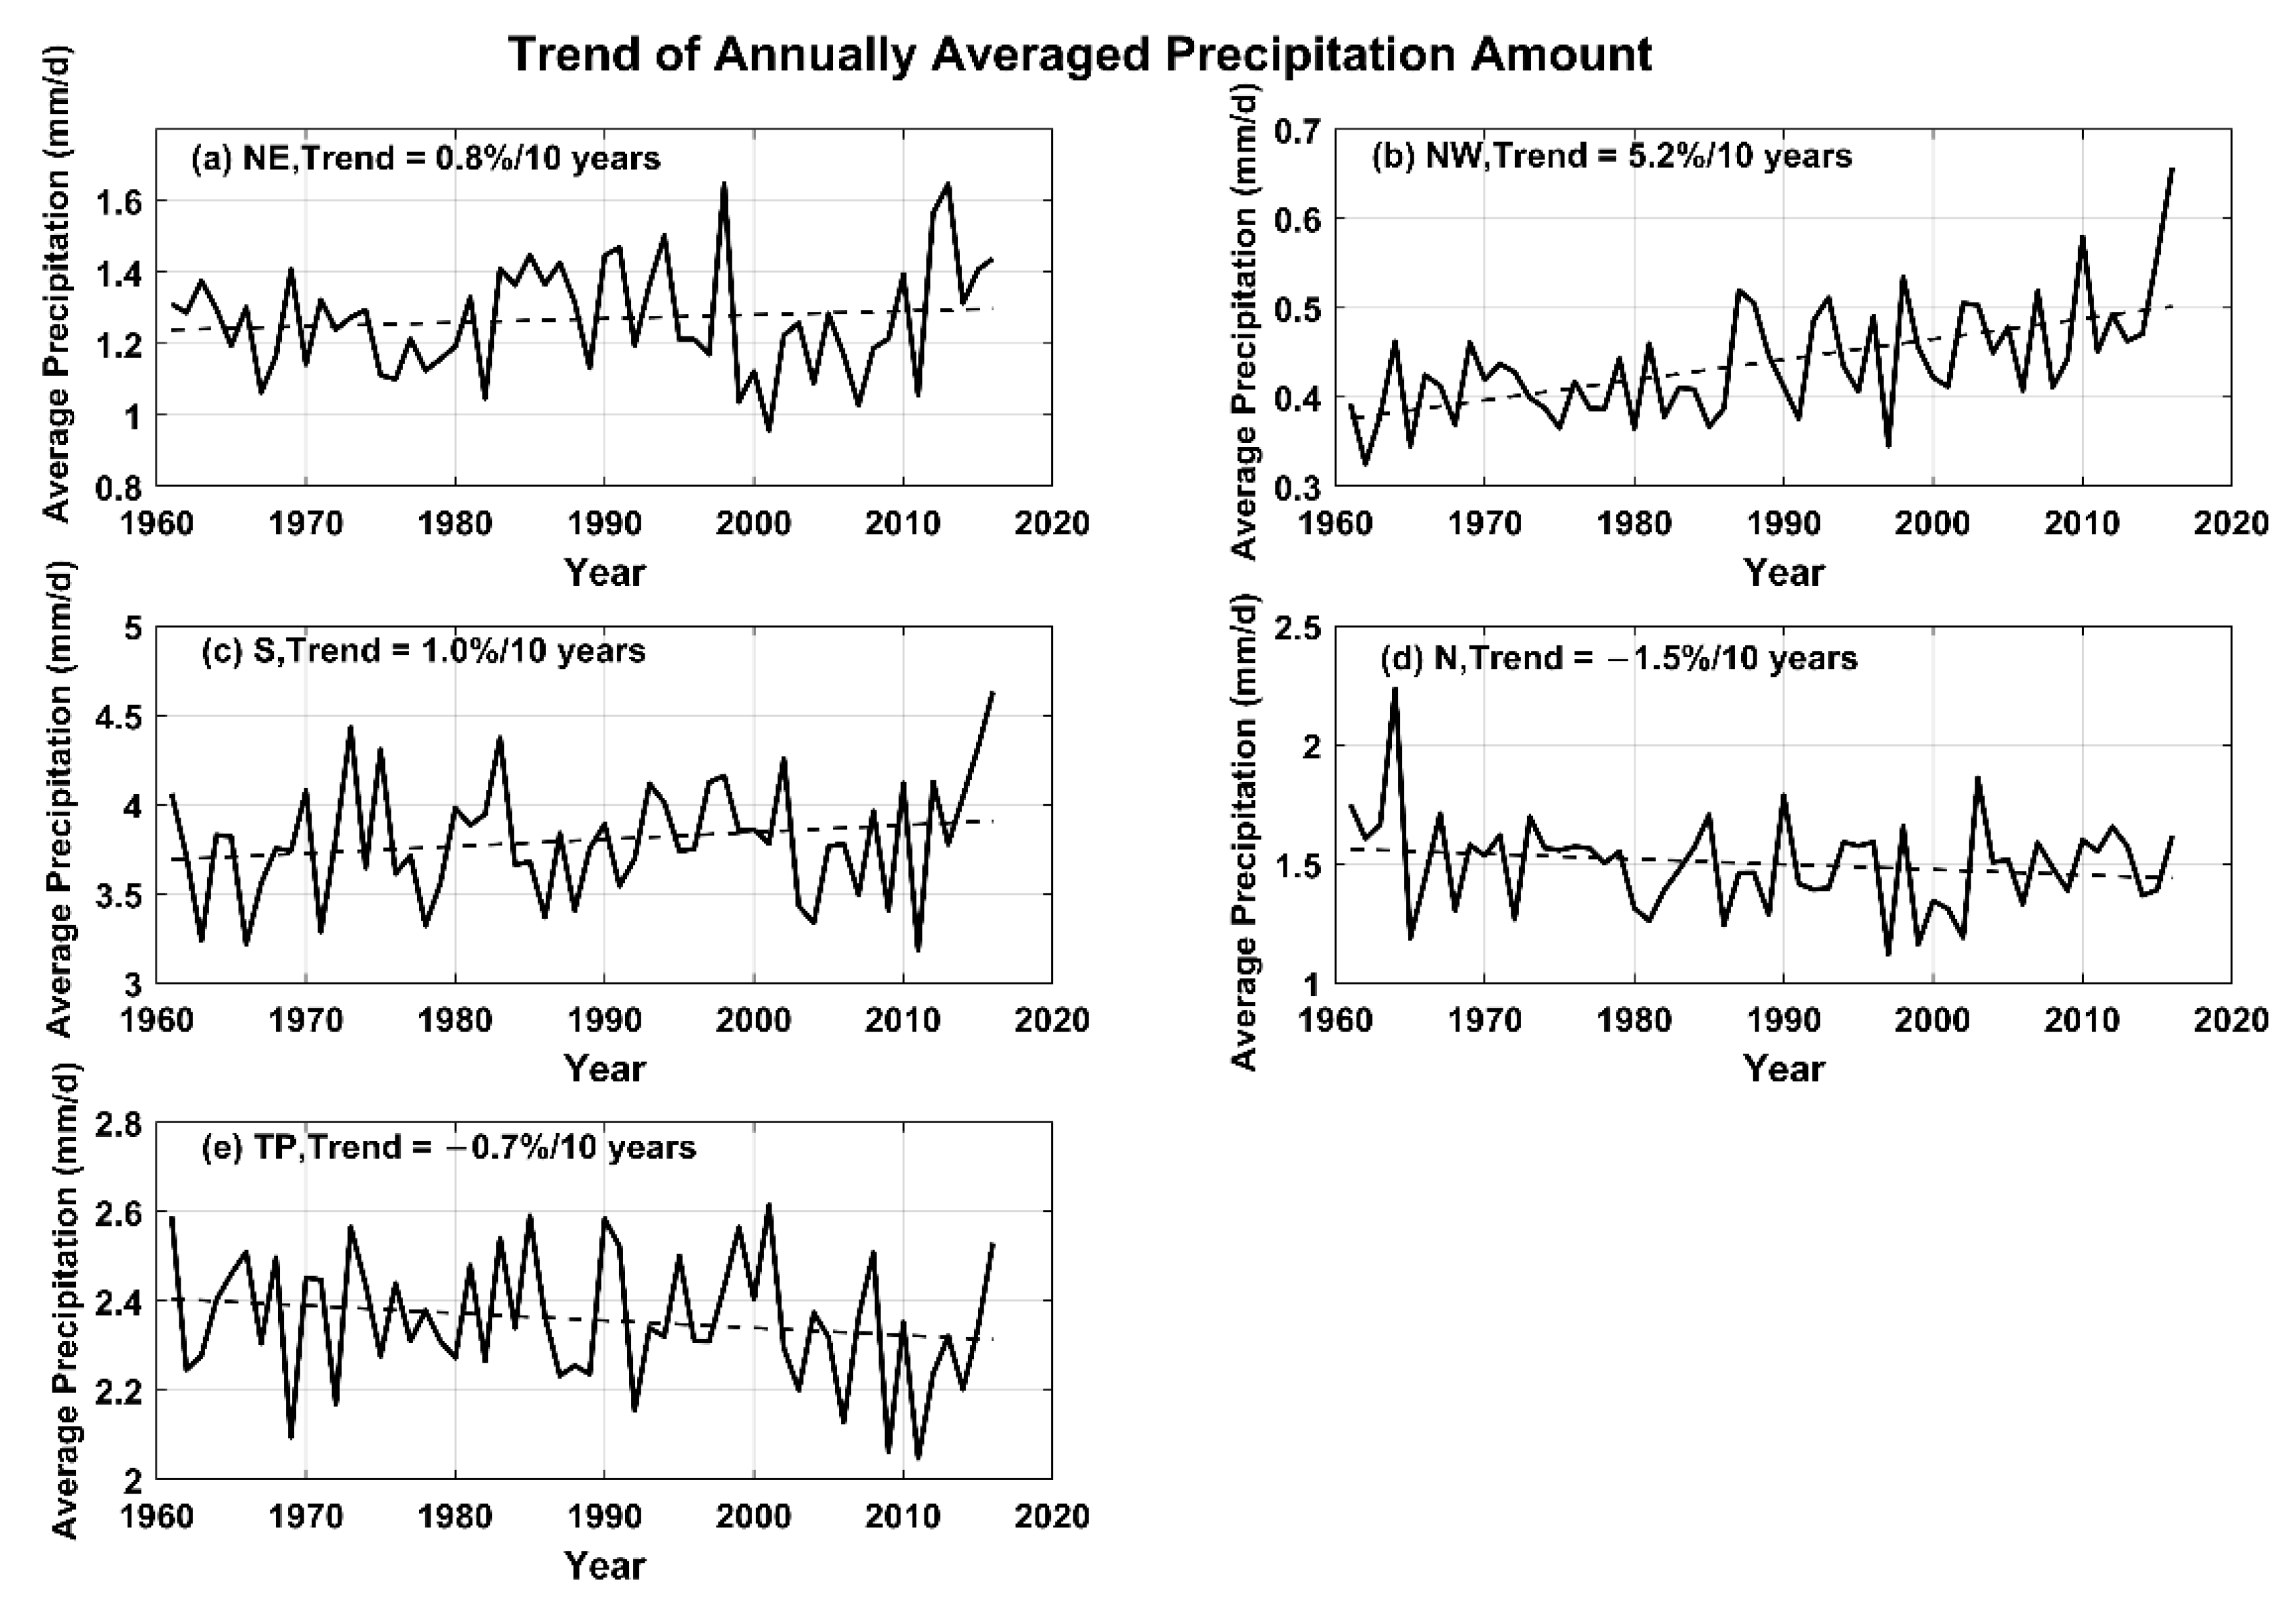
Figure 3 further shows the temporal trends of annually averaged precipitation amount over the five regions we classified in Figure 1. The temporal trends of seasonally averaged precipitation amount over the five regions have also been examined in this study. Table 1 lists the values of temporal trends of both annually and seasonally averaged precipitation amount over the five regions. The bold values shown in Table 1 indicate that they pass the significance test at a confidence level of 95%. Roughly, there are significant increases in precipitation amount in the summer of NW and S regions in the winter of NE and NW regions and in the spring of NE and TP; there are significant decreases in precipitation amount in the summer of TP and autumn of the whole country. Annually averaged, there is a weak (not significant) decreasing trend of precipitation amount in the whole of China, which is −0.11%/10 years. By contrast, there is a strong decreasing trend of seasonally averaged precipitation amount in autumn (−2.6%/10 years), which could contribute a lot to the weak decreasing trend of the annually averaged precipitation amount in China. Consistent with the decreasing trend in China, there are decreasing trends of precipitation amount in N, NE, and TP, with values of −1.7, −0.3, and −0.88 %/10 years, respectively. Differently, there is a weak increasing trend in S with a value of 0.32%/10 years, but a strong increasing trend in NW with a value of 4.4%/10 years. Note that a previous study [26] found that precipitation in China increased by 2% from 1960 to 2000 with an increasing rate of ~0.5%/10 years, different from the weak decreasing trend (−0.11%/10 years) found in this study. The difference could be partly related to the different study periods and observation stations used. Another study [29] showed unclear temporal variation of precipitation amount over the whole of China from 1951 to 2005, while they also showed the decreasing trends of precipitation amount in N and NE and increasing trends of precipitation amount in NW.
The temporal trends of relative changes in the seasonally averaged precipitation amount show different spatial distributions from that of the annually averaged precipitation amount, which are shown in Figure 4. The circles and colors shown in Figure 4 have the same meanings as those shown in Figure 2. In spring, the precipitation amounts show clear increasing trends in Northeast, Northwest, and Tibetan Plateau regions, with a lot of stations passing the significance test at a 95% confidence level. By contrast, the precipitation amount in South China shows a decreasing trend, while with limited stations passing the significance test at a 95% confidence level. In summer, in addition to the Northwest region, there is also an increasing trend of precipitation amount in South China, particularly for those coastal stations that pass the 95% confidence significance test. By contrast, the decreasing trends of precipitation amounts can be found in most stations over Northeast, North China, and Tibetan Plateau regions. In autumn, except for the increasing trends of the precipitation amount in the Northwest region, the seasonally averaged precipitation amount shows clear decreasing trends for most stations in other regions. In winter, except for the south region of the Tibetan Plateau and some coastal sites in the North China region, there are very clear increasing trends of the precipitation amount with many stations passing the 95% confidence significance test.
In summary, there are significant increasing trends of annually and seasonally averaged precipitation amounts for most stations in the Northwest China region. For the South China region, there are decreasing trends in both spring and autumn, and increasing trends in both summer and winter for most stations, causing a weak increasing trend of annually averaged precipitation amount. For the Northeast China region, there are increasing trends in both spring and winter, but decreasing trends in summer and autumn for most stations, causing a weak decreasing trend of annually averaged precipitation amount. For the North China region, there are decreasing trends for most stations in summer, and no clear trends in other seasons. Correspondingly, the annual averaged precipitation amount has shown a weak decreasing trend in North China. For the Tibetan Plateau region, except for the increasing trend in spring, there are decreasing trends in other seasons, particularly for the South region of Tibetan plateau, causing a decreasing trend of annually averaged precipitation amount. While not certain, the temporal variation of precipitation over the TP is likely influenced by its topography, as shown in Figure 1, along with the large-scale circulation, which is beyond the scope of the current study.

3.2. Temporal Trends of Precipitation Days

In addition to the precipitation amount, we also analyzed the temporal trends of precipitation days at every station and region. Figure 5 shows the temporal trends of relative changes in annual precipitation days for all 635 stations from 1961 to 2016. The circles have the same meanings as those shown in Figure 2 except that they are for precipitation days instead of precipitation amount. It shows a very different spatial pattern as that shown for precipitation amount. For most stations in China, there are clear decreasing trends in precipitation days except for the Northwest region, for which there are clear increasing trends in precipitation days except for a few stations. Also different from the results of precipitation amount, the changes in precipitation days are significant for many more stations. Table 2 lists the temporal trends of relative changes of precipitation days in China, along with those in the five regions classified in Figure 1. There are significant decreasing trends in China for the precipitation days, which is −2.9%/10 years, −1.5%/10 years, −2.1%/10 years, −5.9%/10 years, and −2.8 %/10 years for yearly average, spring, summer, autumn, and winter, respectively. In contrast, Liu et al. [26] showed a decreasing trend of precipitation frequency from 1960 to 2000 with a rate of −2.5%/10 years, which is roughly consistent with our finding of −2.9%/10 years. Regionally, there are also significant decreasing trends of annual precipitation days in S, N, NE, and TP, which are −3.5%/10 years, −3.9%/10 years, −1.6%/10 years and −3.8%/10 years, respectively. Differently, there is a significant increasing trend of annual precipitation days in the NW region, which is 1.7%/10 years. The reasons that the precipitation days have these temporal and spatial variations are not clear and need to be further explored in future studies.
Figure 6 further shows the spatial distribution of temporal trends of relative changes in seasonally averaged precipitation days in China. Note that the temporal trends of relative changes in seasonally averaged precipitation days in China, along with those in the five classified regions have also been listed in Table 2. Different temporal trends of precipitation days can be clearly seen over different regions and seasons in Figure 6. The total precipitation day number shows clear decreasing trends in autumn for all regions, which are −7.7, −6.3, −3.3, −0.2, and −6.0 %/10 years in S, N, NE, NW, and TP regions, respectively. For other seasons, the temporal changes of total precipitation day number demonstrate different performance among the five regions. Roughly, there are clear decreases in total precipitation days in spring of S region, in summer of N, NE, and TP regions, in winter of S and TP regions. In contrast, there are clear increases of total precipitation days only in winter of the NW region. One interesting result is found for the temporal trends of relative changes of seasonally averaged precipitation days in NW: there are a large number of stations with significant increasing trends of total precipitation days in spring and winter, along with a considerable number of stations with significant decreasing trends of precipitation days in summer and autumn, particularly in autumn.
Figure 6 shows the similar spatial distribution in temporal trends of relative changes of precipitation days as that in decadal trends of relative changes of precipitation amount shown in Figure 4 except for the winter season (DJF). This implies that the temporal variation in the relative changes of precipitation days could play an important contributing role to the temporal change of precipitation amount. Actually, Miao et al. [27] have also shown that the changes in the precipitation amount resulted mainly from changes in frequency rather than changes in intensity in China.
Considering the impacts of precipitation on local environment (ecology, plants, agriculture, and so on) and water management depend on both the precipitation amount and precipitation days in a season or a year, the precipitation day information shown in Figure 6 along with the precipitation amount information shown in Figure 4 could help a lot for the water management. For example, the increase of precipitation day and amount in Northwest China implies the potential reduction of irrigation needed in this area, and the decreasing precipitation day and increasing precipitation amount in South China in summer and winter imply the increase of heavy precipitation and more storage capability for dams in this region is demanded.

3.3. Temporal Trends of Precipitation Days with Different Intensity

Section 2 has classified the precipitation into six types based on the precipitation intensity. We here examine the precipitation days for these six different types of precipitation. Figure 7 shows the relative frequency for six different types of precipitation in the classified five regions. For all of these five regions, the precipitation with P < 10 mm/day dominates, with a fraction of over 70%. Actually, around 50% of the precipitation events are with P < 2 mm/day. By contrast, the heavy precipitation with P > 25 mm/day has very low occurrence frequencies, which are generally less than 10%. The extreme precipitation events mainly occur in the South China region, with a frequency close to 10%. For other regions, the extreme precipitation events have much less occurrence frequencies, particularly in the Northwest region (<1%). Ning and Qian [34] have also indicated that the precipitation amount associated with weak and middle precipitation events are more than 60% of the total precipitation amount for most regions in China by the annual average. Thus, the temporal trends of total precipitation amount for weak and middle precipitation events should play more important roles rather than that for heavy and severe precipitation events for most regions. Of course, for the South China region with a relatively high frequency of heavy precipitation, the temporal trends of heavy precipitation events should also play an important role.
Figure 8 shows the temporal trends of relative changes of precipitation occurrence frequency for different types of precipitation over the five classified regions along with the whole China region. Averaged for all 635 stations in China, there are significant temporal decreases of precipitation occurrence for both weak and middle precipitation events, among which the decreasing trend of light precipitation is the most significant, which is 5.4%/10 years. In contrast, the heavy precipitation occurrence frequency has an increasing trend, consistent with the findings by Ning and Qian [35]. Differently, the increasing trend we found here does not pass the 95% confidence significance test.
For all the five classified regions, we can see that the sunny days have significant increasing trends in the occurrence frequency, indicating that the precipitation days have significant decreases countrywide. For South China region, the precipitation occurrence frequencies for different types of precipitation show the same temporal trends as that for the whole China region: there are significant decreasing trends for light, small, and middle precipitation, and the annual heavy precipitation days increase with time, causing the total precipitation amount to increase slightly. Note that the light precipitation days decrease at a high rate of 8%/10 years in South China. For the North China region, there are significant decreasing trends of precipitation days for both light and small precipitation. While not significant, there are also decreasing trends of precipitation days for middle and heavy precipitation in North China, which could be as large as 2.0%/10 years, causing the total precipitation amount in North China to decrease. For the Northeast China region, only light precipitation days have a clear decreasing trend, and there are no clear temporal trends for other types of precipitation. The occurrence frequencies of middle and heavy precipitation have slightly decreasing trends with values less than 1%/10 years. As a result, the total precipitation amount has a slightly decreasing trend from 1961 to 2016 in the Northeast China region. For the Tibetan Plateau region, there are decreasing trends for the occurrence frequencies of all types of precipitation, but only those with P < 5 mm/day pass the significance test with a 95% confidence level. Over the Tibetan Plateau region, the decreasing trends of precipitation occurrence frequency are about 9%/10 years for light precipitation, 1%/10 years for middle precipitation, and <1%/10 years for heavy precipitation. For the Northwest China region, there are increasing trends for the occurrence frequencies of all types of precipitation, particularly for those with P > 1 mm/day. The increasing trend of precipitation occurrence frequency is even larger than 10%/10 years for heavy precipitation. All of these make the yearly total precipitation amount in the Northwest China region increase with time from 1961 to 2016.
In every region, the temporal trends of relative changes of precipitation days also vary with season for all types of precipitation. Figures S1–S5 (only available online in the Supplementary Materials) show the temporal trends of occurrence frequencies of different types of precipitation for spring, summer, autumn, and winter in S, N, NE, TP, and NW regions, respectively. We first examine the South China region. There are clear decreasing trends of precipitation days for light, small, and middle precipitation in spring and autumn. In summer, there are decreasing trends for light precipitation in summer and winter, but also a clear increasing trend for heavy precipitation in summer. Shortly, in South China, heavy precipitation increases in summer, and light precipitation decreases in all seasons. Second, we examine the North China region. There are clear decreasing trends of precipitation days for all types of precipitation in summer and autumn, with the light and small precipitation types passing the 95% confidence significance test. A significant decreasing trend in the occurrence frequency is also found for light precipitation in spring. There are no significant temporal trends in the occurrence days for other types of precipitation or for the winter season. Shortly, significant decreasing trends of precipitation days are found in spring, summer, and autumn for light precipitation, and in summer for small precipitation. Third, we examine the Northeast China region. There are significant decreasing trends of precipitation days for light precipitation in summer and autumn and for small precipitation in summer; however, there are significant increasing trends for small precipitation in spring and winter. Fourth, we examine the Tibetan Plateau region. Significant decreasing trends of precipitation days can be found for light precipitation in all seasons, for small precipitation in summer and autumn, and for middle precipitation in summer. By contrast, significant increasing trends of precipitation days are only found in spring for small, middle, and heavy precipitation. Fifth, the temporal trends of precipitation occurrence days in Northwest China are examined. There are slightly decreasing trends of precipitation days for light precipitation and clear increasing trends for other types of precipitation for almost all seasons, while only part of these trends pass the 95% confidence significance test. Shortly, significant increasing trends of precipitation days are found for small and middle precipitation in summer, autumn, and winter, for heavy precipitation in summer and winter, and for light precipitation in winter in Northwest China. In contrast, there are no significant decreasing trends for all types of precipitation in the four seasons.
In summary, there are significantly increasing trends of the sunny days, and significant decreasing trends of occurrence frequency for light precipitation for most regions and most seasons. While multiple reasons could exist, one likely explanation is the increasing aerosol pollution in China, which enhances CCN concentration, reduces cloud droplet mean radius, and suppresses drizzle formation [20]. This mechanism works particularly for light precipitation. For precipitation occurrence days other than light precipitation, there are different temporal trends in different regions and seasons, which indicates that the temporal trends of precipitation occurrence days should be highly related to the location, season, and precipitation type.

3.4. Spatial Pattern for Temporal Trends of Light and Heavy Precipitation Occurrence Days

We have shown robust findings about the decreasing trends of light precipitation days over most regions and in most seasons and increasing trends of heavy precipitation days for all cases when the temporal changes are significant. We next examine the spatial patterns about the temporal trends of both light and heavy precipitation occurrence days using the measurements at all 635 stations.
Figure 9 shows the spatial distributions about the temporal trends of light precipitation occurrence days. The circles have the same meanings as those shown in Figure 3, except that they are for light precipitation occurrence days. For most stations in China, except that in the Northwest region, there are significant decreasing trends of light precipitation occurrence days with a 95% confidence level. The decreasing trends are particularly large in South China, North China and Tibetan Plateau regions, with a lot of stations having decreasing trends larger than 10%/10 years. By contrast, the decreasing trends are much smaller in the Northeast China region.
Figure 10 shows the spatial distributions about the temporal trends of heavy precipitation occurrence days. Compared to that shown in Figure 9 for light precipitation, the spatial pattern for heavy precipitation is much more complex. Roughly, there are more stations with increasing trends than those with decreasing trends for the heavy precipitation occurrence days. At a confidence level of 95%, there are only partial stations with significant temporal changes in the heavy precipitation occurrence days. Different from the regional average values shown in Figures S1–S4, significant decreasing trends of heavy precipitation days also exist in some stations. The increasing trends of heavy precipitation occurrence days mainly occur at stations in South China and Northwest China, and the decreasing trends of heavy precipitation mainly occur at partial stations in Northeast China.
Different spatial patterns have been found among the four seasons for both light and heavy precipitation. Figure 11 shows the spatial distributions about the temporal trends of light precipitation occurrence days in four seasons. In general, Figure 11 shows the similar results regarding the temporal trends of relative changes of the light precipitation days for the five regions using station observations as shown in Figures S1–S4 using the region-average data, while a few unique stations often exist with different temporal changes from most stations in that region. Figure 11 also suggests that there are more stations with significant increasing trends of light precipitation occurrence days in the Northwest region for all seasons, and in the Northeast region in spring and winter; and there are more stations with significant decreasing trends of light precipitation occurrence days in North China, South China, Tibetan Plateau regions for all seasons, and in the Northeast region in summer and autumn.
Figure 12 further shows the spatial distributions of the temporal trends of heavy precipitation occurrence days at all stations in four seasons. In general, there are more stations with significantly increasing trends of heavy precipitation days for almost all regions in four seasons, except for North China in summer and Northeast China in summer and autumn. Particularly, there are clearly more stations with significant increasing trends of heavy precipitation days for South China in summer and winter.

4. Conclusions

Using the meteorological observations at the selected 635 stations from 1961 to 2016, this study reveals the temporal trends of annually and seasonally averaged precipitation amounts and precipitation occurrence frequencies with different rainfall intensities. While the temporal trends of precipitation amount and precipitation occurrence frequency with different rainfall intensities vary substantially with regions and seasons, several robust findings about their statistical characteristics have been found.
The annual averaged precipitation amount shows a weak and insignificant decreasing trend in the whole of China. The precipitation with a rate less than 10 mm/day dominates in China, with a total precipitation fraction of over 70%. In Northwest China, the total precipitation amount shows a clear increasing trend for both annually and seasonally averaged values. By contrast, there are significant decreasing trends of annually averaged precipitation amounts in the boundary regions between the Tibetan Plateau and North China, South China. Seasonally, we can find significant decreasing trends in annually averaged precipitation amounts in autumn.
There are significant increases in sunny days for all regions except the Northwest in China. Except for Northwest China, light precipitation days in general show a robust decreasing trend in China. The decreasing trends are particularly large in South China, North China and Tibetan Plateau regions, with a lot of stations having a decreasing trend larger than 10%/10 years. Considering the high frequency of light and small precipitation (>70%), the decadal trends of precipitation days could highly explain the temporal variation of precipitation amount in China, which is consistent with the previous findings [27].
The temporal trends of heavy precipitation days are much more complex. Generally speaking, there are more stations with increasing trends than those with decreasing trends for heavy precipitation occurrence days. At a confidence level of 95%, there are only limited stations with significant temporal changes of heavy precipitation occurrence days. The increasing trends of heavy precipitation occurrence days mainly occur at stations in South China and Northwest China, and the decreasing trends of heavy precipitation mainly occur at partial stations in Northeast China.
Precipitation amount and occurrence days in different seasons over the five classified regions have also been analyzed, which exhibits different temporal variation patterns. For example, for the Northwest China region, in addition to the increasing trends of precipitation amount in four seasons for most stations, significant increasing trends of precipitation days are also found for small and middle precipitation in summer, autumn, and winter, for heavy precipitation in summer and winter, and for light precipitation in winter. Correspondingly, significant increasing trends in the annually averaged precipitation amount have been found in the Northwest China region. Except for the Northwest China region, there are significantly increasing trends of the sunny days, and significant decreasing trends of occurrence frequency for light precipitation for almost all seasons over most regions. Future studies will be conducted to understand the historical trends of precipitation in China as introduced in this study, by analyzing multiple observed meteorological factors and performing model sensitivity analyses using regional/global climate simulations.

Supplementary Materials

The following are available online at https://www.mdpi.com/2073-4433/11/3/303/s1, Figure S1: The decadal trend of the relative change of precipitation occurrence frequency for different types of precipitation in four seasons over South China (S) region, where P represents precipitation rate. Figure S2: The decadal trend of the relative change of precipitation occurrence frequency for different types of precipitation in four seasons over the North China (N) region, where P represents precipitation rate. Figure S3: The decadal trend of the relative change of precipitation occurrence frequency for different types of precipitation in four seasons over the Northeast China (NE) region, where P represents precipitation rate. Figure S4: The decadal trend of the relative change of precipitation occurrence frequency for different types of precipitation in four seasons over the Tibetan Plateau (TP) region, where P represents precipitation rate. Figure S5: The decadal trend of the relative change of precipitation occurrence frequency for different types of precipitation in four seasons over the Northwest China (NW) region.

Author Contributions

Conceptualization, Y.S. and C.Z.; methodology, Y.S.; software, Y.S.; validation, Y.S., C.Z.; formal analysis, Y.S., Z.M.; investigation, Y.S., C.Z.; resources, Z.M.; data curation, Z.M.; writing—original draft preparation, Y.S.; writing—review and editing, C.Z., Y.W.; visualization, Y.S.; supervision, C.Z.; funding acquisition, C.Z. All authors have read and agreed to the published version of the manuscript.

Funding

This research was funded by the National Natural Science Foundation of China, grant number 41925022, 91837204, and 41575143; the National Key R&D Program on Monitoring, Early Warning and Prevention of Major Natural Disasters, grant number 2017YFC1501403; and the State Key Laboratory of Earth Surface Processes and Resources Ecology.

Acknowledgments

We acknowledge the data support from the Chinese Meteorology Administration. Data used in this study are available online from http://data.cma.cn/data/cdcdetail/dataCode/SURF_CLI_CHN_MUL_DAY_V3.0.html.

Conflicts of Interest

The authors declare no conflict of interest.

References

  1. Adler, R.F.; Huffman, G.J.; Chang, A.; Ferraro, R.; Xie, P.; Janowiak, J.; Rudolf, B.; Schneider, U.; Curtis, S.; Bolvin, D.; et al. The version 2 global precipitation climatology project (GPCP) monthly precipitation analysis (1979–present). J. Hydrometeorol. 2003, 4, 1147–1167. [Google Scholar] [CrossRef]
  2. Trenberth, K.E.; Dai, A.; Rasmussen, R.M.; Parsons, D.B. The changing character of precipitation. Bull. Amer. Meteor. Soc. 2003, 84, 1205–1217. [Google Scholar] [CrossRef]
  3. Jamieson, M.A.; Trowbridge, A.M.; Raffa, K.F.; Lindrot, R.L. Consequences of climate warming and altered precipitation patterns for plant-insect and multitrophic interactions. Plant Physiol. 2012, 160, 1719–1727. [Google Scholar] [CrossRef] [Green Version]
  4. Schneider, U.; Finger, P.; Meyer-Christoffer, A.; Rustemeier, E.; Ziese, M.; Becker, A. Evaluating the Hydrological Cycle over Land Using the Newly-Corrected Precipitation Climatology from the Global Precipitation Climatology Centre (GPCC). Atmosphere 2017, 8, 52. [Google Scholar] [CrossRef] [Green Version]
  5. Siepielski, A.M.; Morrissey, M.B.; Buoro, M.; Carlson, S.M.; Caruso, C.M.; Clegg, S.M.; Coulson, T.; DiBattista, J.; Gotanda, K.M.; Francis, C.D.; et al. Precipitation drives global variation in natural selection. Science 2017, 355, 959–962. [Google Scholar] [CrossRef] [Green Version]
  6. Muller, C.J.; O’Gorman, P.A. An energetic perspective on the regional response of precipitation to climate change. Nat. Clim. Chang. 2011, 1, 266–271. [Google Scholar] [CrossRef]
  7. Zhao, C.; Garrett, T.J. Ground-based remote sensing of precipitation in the Arctic. J. Geophys. Res. 2008, 113, D14204. [Google Scholar] [CrossRef] [Green Version]
  8. Ropelewski, C.F.; Halpert, M.S. Global and regional scale precipitation patterns associated with the El Niño/Southern Oscillation. Mon. Weather Rev. 2013, 115, 985–996. [Google Scholar] [CrossRef] [Green Version]
  9. Koster, R.D.; Dirmeyer, P.A.; Guo, Z.; Bonan, G.; Chan, E.; Cox, P.; Gordon, C.T.; Kanae, S.; Kowalczyk, E.; Lawrence, D.; et al. Regions of strong coupling between soil moisture and precipitation. Science 2004, 305, 1138–1140. [Google Scholar] [CrossRef] [Green Version]
  10. Allan, R.P.; Soden, B.J. Atmospheric warming and the amplification of precipitation extremes. Science 2008, 321, 1481–1484. [Google Scholar] [CrossRef] [Green Version]
  11. Gong, D.; Wang, S. Severe summer rainfall in China associated with the enhanced global warming. Clim. Res. 2000, 16, 51–59. [Google Scholar] [CrossRef]
  12. Garrett, T.J.; Zhao, C.; Dong, X.; Mace, G.G.; Hobbs, P.V. Effects of varying aerosol regimes on low-level Arctic stratus. Geophys. Res. Lett. 2004, 31, L17105. [Google Scholar] [CrossRef] [Green Version]
  13. Gong, D.Y.; Ho, C.-H.; Chen, D.L.; Qian, Y.; Choi, Y.-S.; Kim, J. Weekly cycle of aerosolmeteorology interaction over China. J. Geophys. Res. 2007, 112. [Google Scholar] [CrossRef] [Green Version]
  14. Rosenfeld, D. Suppression of rain and snow by urban and industrial air pollution. Science 2000, 287, 1793–1796. [Google Scholar] [CrossRef] [PubMed]
  15. Kaufman, Y.J.; Tanré, D.; Boucher, O. A satellite view of aerosols in the climate system. Nature 2002, 419, 215–223. [Google Scholar] [CrossRef]
  16. Wang, Y.; Wan, Q.; Meng, W.; Liao, F.; Tan, H.; Zhang, R. Long-term impacts of aerosols on precipitation and lightning over the Pearl River Delta megacity area in China. Atmo. Chem. Phys. 2011, 11, 12421–12436. [Google Scholar] [CrossRef] [Green Version]
  17. Zhao, C.; Klein, S.A.; Xie, S.; Liu, X.; Boyle, J.S.; Zhang, Y. Aerosol First Indirect effects on non-precipitating low-level liquid cloud properties as simulated by CAM5 at ARM sites. Geophys. Res. Lett. 2012, 39, L08806. [Google Scholar] [CrossRef] [Green Version]
  18. Li, J.; Lv, Q.; Zhang, M.; Wang, T.; Kawamoto, K.; Chen, S.; Zhang, B. Effects of atmospheric dynamics and aerosols on the fraction of supercooled water clouds. Atmos. Chem. Phys. 2017, 17, 1847–1863. [Google Scholar] [CrossRef] [Green Version]
  19. Qian, Y.; Gong, D.; Fan, J.; Leung, L.R.; Bennartz, R.; Chen, D.; Wang, W. Heavy pollution suppresses light rain in China: Observations and modeling. J. Geophys. Res. 2009, 114, D00K02. [Google Scholar] [CrossRef]
  20. Wang, Y.; Ma, P.-L.; Jiang, J.; Su, H.; Rasch, P. Towards Reconciling the Influence of Atmospheric Aerosols and Greenhouse Gases on Light Precipitation Changes in Eastern China. J. Geophys. Res. Atmos. 2016, 121, 5878–5887. [Google Scholar] [CrossRef] [Green Version]
  21. Kucera, P.A.; Ebert, E.E.; Turk, F.J.; Levizzani, V.; Kirschbaum, D.; Tapiador, F.J.; Loem, A.; Borsche, M. Precipitation from space: Advancing Earth System Science. Bull. Am. Meteorol. Soc. 2013, 94, 365–375. [Google Scholar] [CrossRef]
  22. Tapiador, F.J.; Turk, F.J.; Petersen, W.; Hou, A.Y.; García-Ortega, E.; Machado, L.A.; Angelis, C.F.; Salio, P.; Kidd, C.; Huffman, G.J.; et al. Global precipitation measurement: Methods, datasets and applications. Atmos. Res. 2012, 104–105, 70–97. [Google Scholar] [CrossRef]
  23. Xie, P.P.; Arkin, P.A. Global precipitation: A 17-year monthly analysis based on gauge observations, satellite estimates, and numerical model output. Bull. Am. Meteorol. Soc. 1997, 78, 2539–2558. [Google Scholar] [CrossRef]
  24. Zhao, C.; Lin, Y.; Wu, F.; Wang, Y.; Li, Z.; Rosenfeld, D.; Wang, Y. Enlarging Rainfall Area of Tropical Cyclones by Atmospheric Aerosols. Geophys. Res. Lett. 2018, 45. [Google Scholar] [CrossRef] [Green Version]
  25. Chou, C.; Lan, C. Changes in the annual range of precipitation under global warming. J. Clim. 2012, 25, 222–235. [Google Scholar] [CrossRef] [Green Version]
  26. Liu, B.; Xu, M.; Henderson, M.; Qi, Y. Observed trends of precipitation amount, frequency, and intensity in China, 1960–2000. J. Geophys. Res. 2005, 110, D08103. [Google Scholar] [CrossRef]
  27. Miao, C.; Sun, Q.; Borthwick, A.G.L.; Duan, Q. Linkage between hourly precipitation events and atmospheric temperature changes over China during the warm season. Sci. Rep. 2016, 6. [Google Scholar] [CrossRef] [PubMed] [Green Version]
  28. Tan, L.; An, Z.; Huh, C.A.; Cai, Y.; Shen, C.C.; Shiau, L.J.; Yan, L.; Cheng, H.; Edwards, R.L. Cyclic precipitation variation on the western Loess Plateau of China during the past four centuries. Sci. Rep. 2014, 4, 6381. [Google Scholar] [CrossRef] [PubMed] [Green Version]
  29. Zhang, Q.; Xu, C.Y.; Zhang, Z.; Chen, Y.D.; Liu, C.L. Spatial and temporal variability of precipitation over China, 1951-2005. Theor. Appl. Climatol. 2009, 95, 53–68. [Google Scholar] [CrossRef]
  30. Zhou, C.; Wang, K. Quantifying the Sensitivity of Precipitation to the Long-Term Warming Trend and Interannual–Decadal Variation of Surface Air Temperature over China. J. Clim. 2017, 30, 3687–3703. [Google Scholar] [CrossRef]
  31. Chen, D.; Ou, T.; Gong, L.; Xu, C.Y.; Li, W.; Ho, C.H.; Qian, W. Spatial interpolation of daily precipitation in China: 1951–2005. Adv. Atmos. Sci. 2010, 27, 1221–1232. [Google Scholar] [CrossRef]
  32. The Data Center of Chinese Meteorological Agency. Available online: http://data.cma.cn/data/cdcdetail/dataCode/SURF_CLI_CHN_MUL_DAY_V3.0.html (accessed on 12 March 2017).
  33. Fu, J.; Qian, W.; Lin, X.; Chen, D. Trends in Graded Precipitation in China from 1961 to 2000. Adv. Atmos. Sci. 2008, 25, 267–278. [Google Scholar] [CrossRef]
  34. Zhao, C.; Chen, Y.; Li, J.; Letu, H.; Su, Y.; Chen, T.; Wu, X. 15-year statistical analysis of cloud characteristics over China using Terra and Aqua MODIS observations. Int. J. Climatol. 2019, 38, 2612–2629. [Google Scholar] [CrossRef]
  35. Ning, L.; Qian, Y. Analyses on Trends of Annual and Seasonal Four Kinds of Daily Precipitation in China. Plateau Meteorol. 2008, 27, 1010–1020. (In Chinese) [Google Scholar]
Figure 1. Spatial distribution of 635 ground weather stations used in this study and region classification. Five regions have been classified, which are Northwest China (NW), Tibetan Plateau (TP), Northeast China (NE), North China (N), and South China (S). The colors represent the ground altitude above sea level.
Atmosphere 11 00303 g001
Figure 2. The decadal trend of the relative change of annually averaged precipitation for all examined 635 ground stations from 1961 to 2016.
Atmosphere 11 00303 g002
Figure 3. The temporal trend of annually averaged precipitation amount for the whole area over the 5 classified regions of (a) Northeast China (NE), (b) Northwest China (NW), (c) South China (S), (d) North China (N), and (e) Tibetan Plateau (TP). The dashed line represents the linear temporal trend. Unit mm/d demotes millimeter per day.
Atmosphere 11 00303 g003
Figure 4. The decadal trends of relative changes of seasonally averaged precipitation amount (unit: % /10 years) in (a) spring (MAM), (b) summer (JJA), (c) autumn (SON), and (d) winter (DJF) at 635 ground stations.
Atmosphere 11 00303 g004
Figure 5. The decadal trend of the relative change of annual precipitation days at 635 stations.
Atmosphere 11 00303 g005
Figure 6. The decadal trend of the relative change of seasonally averaged precipitation days (unit: %/10 years) in (a) spring, (b) summer, (c) autumn, and (d) winter at 635 ground stations.
Atmosphere 11 00303 g006
Figure 7. The relative frequency of precipitation days for different types of precipitation in the classified five regions of Northeast China (NE), Northwest China (NW), South China (S), North China (N), and Tibetan Plateau (TI).
Atmosphere 11 00303 g007
Figure 8. The decadal trend of relative changes of precipitation occurrence frequency for different types of precipitation over (a) the whole China region, along with the five classified regions of (b) South China (S), (c) North China (N), (d) Tibetan Plateau (TP), (e) Northeast China (NE), and (f) Northwest China (NW).
Atmosphere 11 00303 g008
Figure 9. The spatial distributions about the temporal trends of light precipitation occurrence days at 635 ground stations in China.
Atmosphere 11 00303 g009
Figure 10. The spatial distributions about the temporal trends of heavy precipitation occurrence days at 635 ground stations in China.
Atmosphere 11 00303 g010
Figure 11. The spatial distributions about the temporal trends of light precipitation occurrence days (unit: %/10 years) in (a) spring, (b) summer, (c) autumn, and (d) winter at 635 stations.
Atmosphere 11 00303 g011
Figure 12. The spatial distributions about the temporal trends of heavy precipitation occurrence days (unit: %/10 years) in (a) spring, (b) summer, (c) autumn, and (d) winter at 635 stations.
Atmosphere 11 00303 g012
Table 1. Temporal trends of annually and seasonally averaged precipitation amount for the station observations (bold values indicate that they pass the significance test with a 95% confidence level) (unit: %/10 years).
CHINASNNENWTP
ANNUAL−0.111.0−1.50.85.2−0.7
MAM−0.26−1.6−0.45.43.03.4
JJA0.392.4−2.1−1.63.9−1.6
SON−2.6−3.3−2.4−1.73.9−2.1
DJF3.94.12.19.713.8−1.8
Table 2. Decadal trend of annual and seasonal averaged precipitation days in China and its five classified regions (bold values indicate that the changes passed the 95% significance test) (unit: % /10 years).
CHINASNNENWTP
ANNUAL−2.9−3.5−3.9−1.61.7−3.8
MAM−1.5−3.0−2.82.21.0−0.3
JJA−2.1−0.83−4.0−4.10.68−2.1
SON−5.9−7.7−6.3-3.3−0.2−6.0
DJF−2.8−3.4−1.22.27.1−12.3

