

Climate, Volume 10, Issue 8 (August 2022) – 12 articles
Cover Story (view full-size image):
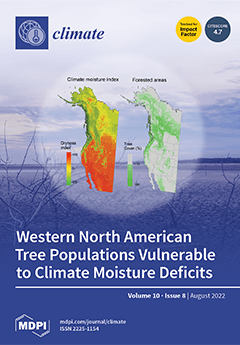
Global climate change has affected forest health and productivity. A highly visible, direct climate impact is dieback caused by drought periods in moisture-limited forest ecosystems. Here, we use a climate moisture index (CMI) to infer drought vulnerabilities. We find that drought impacts that were predicted by negative CMI values over recent decades largely conformed to the observed dieback in Pinus edulis, Populus tremuloides, and Pinus ponderosa in western North America. However, there was one notable counterexample where the observed dieback was caused by a rare extreme drought event that was not apparently linked to directional climate change. Nevertheless, a macro-climatic drought index approach appeared to be generally suitable to identify and forecast the drought threats to the tree populations. View this paper
- Issues are regarded as officially published after their release is announced to the table of contents alert mailing list.
- You may sign up for e-mail alerts to receive table of contents of newly released issues.
- PDF is the official format for papers published in both, html and pdf forms. To view the papers in pdf format, click on the "PDF Full-text" link, and use the free Adobe Reader to open them.
Previous Issue
Next Issue