Next Issue
Volume 13, January
Previous Issue
Volume 12, November


ISPRS Int. J. Geo-Inf., Volume 12, Issue 12 (December 2023) – 38 articles

Cover Story (view full-size image): 
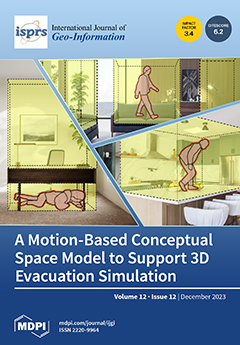
Three-dimensional indoor models are a crucial component for simulating pedestrian evacuations. However, existing 3D indoor models cannot fully represent indoor environments to simulate 3D pedestrian motions in evacuations since spaces above/below some physical components (e.g., desks, chairs) are largely overlooked. This paper presents a conceptual space model that fully captures six 3D pedestrian motions (e.g., low crawling, bent-over walking). We first present the definition and parameterisation of the motions. Next, the definition and specifications of three types of space components are articulated based on the motions. Finally, the concepts are implemented using a voxel-based approach and demonstrated using an illustrative example. This work advances 3D indoor modelling towards realistically simulating 3D pedestrian motions. View this paper
  • Issues are regarded as officially published after their release is announced to the table of contents alert mailing list.
  • You may sign up for e-mail alerts to receive table of contents of newly released issues.
  • PDF is the official format for papers published in both, html and pdf forms. To view the papers in pdf format, click on the "PDF Full-text" link, and use the free Adobe Reader to open them.
Order results
Result details
Select all
Export citation of selected articles as:
19 pages, 5755 KiB  
Article
Hyperspectral Image Classification Network Based on 3D Octave Convolution and Multiscale Depthwise Separable Convolution
by Qingqing Hong, Xinyi Zhong, Weitong Chen, Zhenghua Zhang and Bin Li
ISPRS Int. J. Geo-Inf. 2023, 12(12), 505; https://doi.org/10.3390/ijgi12120505 - 17 Dec 2023
Viewed by 1653
Abstract
Hyperspectral images (HSIs) are pivotal in various fields due to their rich spectral–spatial information. While convolutional neural networks (CNNs) have notably enhanced HSI classification, they often generate redundant spatial features. To address this, we introduce a novel HSI classification method, OMDSC, employing 3D [...] Read more.
Hyperspectral images (HSIs) are pivotal in various fields due to their rich spectral–spatial information. While convolutional neural networks (CNNs) have notably enhanced HSI classification, they often generate redundant spatial features. To address this, we introduce a novel HSI classification method, OMDSC, employing 3D Octave convolution combined with multiscale depthwise separable convolutional networks. This method initially utilizes 3D Octave convolution for efficient spectral–spatial feature extraction from HSIs, thereby reducing spatial redundancy. Subsequently, multiscale depthwise separable convolution is used to further improve the extraction of spatial features. Finally, the HSI classification results are output by softmax classifier. This work compares the method with other methods on three publicly available datasets in order to confirm its efficacy. The outcomes show that the method performs better in terms of classification. Full article
Show Figures

Figure 1

23 pages, 13895 KiB  
Article
A Web-Based Geodesign Tool for Evaluating the Integration of Transport Infrastructure, Public Spaces, and Human Activities
by Liu Yang
ISPRS Int. J. Geo-Inf. 2023, 12(12), 504; https://doi.org/10.3390/ijgi12120504 - 17 Dec 2023
Viewed by 1647
Abstract
The need for addressing the adverse impacts of transport infrastructure on public spaces and human activities (TSH) emphasizes the importance of designing integrated TSH system, thereby necessitating tailored planning support systems (PSS). This study begins by assessing the demand for PSS using surveys [...] Read more.
The need for addressing the adverse impacts of transport infrastructure on public spaces and human activities (TSH) emphasizes the importance of designing integrated TSH system, thereby necessitating tailored planning support systems (PSS). This study begins by assessing the demand for PSS using surveys and interviews to uncover the need for robust analysis and evaluation support, particularly through the use of geographical information systems (GIS). On this basis, a prototype GIS platform is proposed for analyzing and evaluating the integration of the TSH system at the block scale. This user-friendly geodesign tool encompasses a customizable evaluation index (includes seven KPAs and KPIs), allowing for combined quantitative and qualitative assessments. Notably, it introduces a buffer effect index to quantify transport–space interaction. The proposed tool serves as a dedicated platform for evaluating TSH systems, offering 2D/3D visualization capabilities and two analysis units and facilitating cross-platform collaboration. Applied to a case study in Nanjing, China, it effectively assessed the interdependence among different TSH system components and block integration around expressways, railways, and main roads. This tool holds promise in offering invaluable insights into urban planning and (re)development, thereby enhancing the integration of transport infrastructure and public spaces. Full article
Show Figures

Figure 1

36 pages, 15617 KiB  
Article
Machine-Learning-Based Forest Classification and Regression (FCR) for Spatial Prediction of Liver Fluke Opisthorchis viverrini (OV) Infection in Small Sub-Watersheds
by Benjamabhorn Pumhirunroj, Patiwat Littidej, Thidarut Boonmars, Kanokwan Bootyothee, Atchara Artchayasawat, Phusit Khamphilung and Donald Slack
ISPRS Int. J. Geo-Inf. 2023, 12(12), 503; https://doi.org/10.3390/ijgi12120503 - 14 Dec 2023
Viewed by 1854
Abstract
Infection of liver flukes (Opisthorchis viverrini) is partly due to their suitability for habitats in sub-basin areas, which causes the intermediate host to remain in the watershed system in all seasons. The spatial monitoring of fluke at the small basin scale [...] Read more.
Infection of liver flukes (Opisthorchis viverrini) is partly due to their suitability for habitats in sub-basin areas, which causes the intermediate host to remain in the watershed system in all seasons. The spatial monitoring of fluke at the small basin scale is important because this can enable analysis at the level of the factors involved that influence infections. A spatial mathematical model was weighted by the nine spatial factors X1 (index of land-use types), X2 (index of soil drainage properties), X3 (distance index from the road network, X4 (distance index from surface water resources), X5 (distance index from the flow accumulation lines), X6 (index of average surface temperature), X7 (average surface moisture index), X8 (average normalized difference vegetation index), and X9 (average soil-adjusted vegetation index) by dividing the analysis into two steps: (1) the sub-basin boundary level was analyzed with an ordinary least square (OLS) model used to select the spatial criteria of liver flukes aimed at analyzing the factors related to human liver fluke infection according to sub-watersheds, and (2) we used the infection risk positional analysis level through machine-learning-based forest classification and regression (FCR) to display the predictive results of infection risk locations along stream lines. The analysis results show four prototype models that import different independent variable factors. The results show that Model 1 and Model 2 gave the most AUC (0.964), and the variables that influenced infection risk the most were the distance to stream lines and the distance to water bodies; the NDMI and NDVI factors rarely affected the accuracy. This FCR machine-learning application approach can be applied to the analysis of infection risk areas at the sub-basin level, but independent variables must be screened with a preliminary mathematical model weighted to the spatial units in order to obtain the most accurate predictions. Full article
Show Figures

Figure 1

22 pages, 8890 KiB  
Article
Construction of a Real-Time Ship Trajectory Prediction Model Based on Ship Automatic Identification System Data
by Daping Xi, Yuhao Feng, Wenping Jiang, Nai Yang, Xini Hu and Chuyuan Wang
ISPRS Int. J. Geo-Inf. 2023, 12(12), 502; https://doi.org/10.3390/ijgi12120502 - 13 Dec 2023
Viewed by 1627
Abstract
The extraction of ship behavior patterns from Automatic Identification System (AIS) data and the subsequent prediction of travel routes play crucial roles in mitigating the risk of ship accidents. This study focuses on the Wuhan section of the dendritic river system in the [...] Read more.
The extraction of ship behavior patterns from Automatic Identification System (AIS) data and the subsequent prediction of travel routes play crucial roles in mitigating the risk of ship accidents. This study focuses on the Wuhan section of the dendritic river system in the middle reaches of the Yangtze River and the partial reticulated river system in the northern part of the Zhejiang Province as its primary investigation areas. Considering the structure and attributes of AIS data, we introduce a novel algorithm known as the Combination of DBSCAN and DTW (CDDTW) to identify regional navigation characteristics of ships. Subsequently, we develop a real-time ship trajectory prediction model (RSTPM) to facilitate real-time ship trajectory predictions. Experimental tests on two distinct types of river sections are conducted to assess the model’s reliability. The results indicate that the RSTPM exhibits superior prediction accuracy when compared to conventional trajectory prediction models, achieving an approximate 20 m prediction accuracy for ship trajectories on inland waterways. This showcases the advancements made by this model. Full article
Show Figures

Figure 1

23 pages, 9627 KiB  
Article
The Spatial Effects of Regional Poverty: Spatial Dependence, Spatial Heterogeneity and Scale Effects
by Mengxiao Liu, Yong Ge, Shan Hu and Haiguang Hao
ISPRS Int. J. Geo-Inf. 2023, 12(12), 501; https://doi.org/10.3390/ijgi12120501 - 13 Dec 2023
Viewed by 1530
Abstract
Recognizing the spatial effects of regional poverty is essential for achieving sustainable poverty alleviation. This study investigates these spatial effects and their determinants across three distinct administrative levels within Hubei Province, China. To analyze the spatial patterns and heterogeneity of multi-scale regional poverty, [...] Read more.
Recognizing the spatial effects of regional poverty is essential for achieving sustainable poverty alleviation. This study investigates these spatial effects and their determinants across three distinct administrative levels within Hubei Province, China. To analyze the spatial patterns and heterogeneity of multi-scale regional poverty, we employed various spatial analysis techniques, including the global and local Moran’s I statistics, the Lineman, Merenda, and Gold (LMG) method, as well as Multiscale Geographically Weighted Regression (MGWR). We found that: (1) Regional poverty exhibits significant spatial dependence across various scales, with a higher level of spatial dependence observed at higher administrative levels. (2) The spatial distribution of poverty is primarily influenced by geographical factors, encompassing first-, second-, and third-nature geographical elements. Notably, first-nature geographical factors make substantial contributions, accounting for 36.99%, 42.23%, and 23.79% at the county, township, and village levels, respectively. (3) The influence of geographical factors varies with scale. Global effects of various factors may transcend scales or remain confined to specific scales, while the local impacts of different factors also exhibit variations across scales. These results underscore the necessity for collaborative efforts among government entities at different levels with the anti-poverty measures tailored to local contexts. Full article
Show Figures

Figure 1

22 pages, 12065 KiB  
Article
Geo-Referencing and Analysis of Entities Extracted from Old Drawings and Photos Using Computer Vision and Deep Learning Algorithms
by Liat David, Motti Zohar and Ilan Shimshoni
ISPRS Int. J. Geo-Inf. 2023, 12(12), 500; https://doi.org/10.3390/ijgi12120500 - 13 Dec 2023
Viewed by 1425
Abstract
This study offers a quantitative solution that automates the creation of a historical timeline starting with old drawings from the beginning of the 18th century and ending with present-day photographs of the Old City of Jerusalem. This is performed using GIScience approaches, computer [...] Read more.
This study offers a quantitative solution that automates the creation of a historical timeline starting with old drawings from the beginning of the 18th century and ending with present-day photographs of the Old City of Jerusalem. This is performed using GIScience approaches, computer vision, and deep learning. The motivation to select the Old City of Jerusalem is the substantial availability of old archival drawings and photographs, owing to the area’s significance throughout the years. This task is challenging, as drawings, old photographs, and new photographs exhibit distinct characteristics. Our method encompasses several key components for the analyses: a 2D location recommendation engine, which detects an approximate location in the image of 3D landmarks; 2D landmarks to 3D conversion; and 2D polygonal areas to 3D GIS polylines conversion. This is applied to the segmentation of built areas. To achieve more accurate results, Meta’s Segment Anything model was utilized, which eliminates the need for extensive data preparation, training, and validation, thus optimizing the process. Using such techniques enabled us to examine the landscape development throughout the last three centuries and gain deeper insights concerning the evolution of prominent landmarks and features such as built area over time. Full article
Show Figures

Figure 1

21 pages, 7098 KiB  
Article
What Drives the Spatial Heterogeneity of Urban Leisure Activity Participation? A Multisource Big Data-Based Metrics in Nanjing, China
by Shaojun Liu, Xiawei Chen, Fengji Zhang, Yiyan Liu and Junlian Ge
ISPRS Int. J. Geo-Inf. 2023, 12(12), 499; https://doi.org/10.3390/ijgi12120499 - 12 Dec 2023
Viewed by 1447
Abstract
With the rapid pace of urbanization, enhancing the quality of life has become an urgent demand for the general public in both developed and developing countries. This study addresses the pressing need to understand the spatial distribution and underlying mechanisms of urban leisure [...] Read more.
With the rapid pace of urbanization, enhancing the quality of life has become an urgent demand for the general public in both developed and developing countries. This study addresses the pressing need to understand the spatial distribution and underlying mechanisms of urban leisure activity participation. To achieve this, we propose a novel methodological framework that integrates diverse big data sources, including mobile phone signaling data, urban geospatial data, and web-crawled data. By applying this framework to the urban area of Nanjing, our study reveals both the temporal and spatial patterns of urban leisure activity participation in the city. Notably, leisure activity participation is significantly higher on weekends, with distinctive daily peaks. Moreover, we identify spatial heterogeneity in leisure activity participation across the study area. Leveraging the OLS regression model, we design and quantify a comprehensive set of 12 internal and external indicators to explore the formation mechanisms of leisure participation for different leisure activity types. Our findings offer valuable guidance for urban planners and policymakers to optimize the allocation of resources, enhance urban street environments, and develop leisure resources in a rational and inclusive manner. Ultimately, this study contributes to the ongoing efforts to improve the quality of urban life and foster vibrant and sustainable cities. Full article
Show Figures

Figure 1

19 pages, 34010 KiB  
Article
Visibility-Based R-Tree Spatial Index for Consistent Visualization in Indoor and Outdoor Scenes
by Chengpeng Li, Xi Kuai, Biao He, Zhigang Zhao, Haojia Lin, Wei Zhu, Yu Liu and Renzhong Guo
ISPRS Int. J. Geo-Inf. 2023, 12(12), 498; https://doi.org/10.3390/ijgi12120498 - 12 Dec 2023
Viewed by 1484
Abstract
(1) Background: The smart city management system, with GIS technology as its core, is based on realistic visualization of multiple types of 3D model data syntheses. However, the efficiency barriers to achieving smooth and continuous visualization from outdoor scenes to small indoor scenes [...] Read more.
(1) Background: The smart city management system, with GIS technology as its core, is based on realistic visualization of multiple types of 3D model data syntheses. However, the efficiency barriers to achieving smooth and continuous visualization from outdoor scenes to small indoor scenes remain a challenge. (2) Methods: This paper uses the visibility prediction method to obtain potential visual sets at three levels—outdoor, indoor and outdoor connection, and indoor—and constructs an R-tree spatial index structure for organizing potential visual sets. By integrating these potential visible sets with spatial indexes, scene visualization can be carried out effectively. (3) Results: A near-reality indoor and outdoor scene was used for experimentation, resulting in stable 10% fluctuation visual frame rates around 90 FPS. (4) Conclusions: Spatial indexing methods that combine potential visible sets can effectively solve the continuity and stability problem of indoor and outdoor scene visualization in smart city management systems. Full article
Show Figures

Figure 1

17 pages, 4062 KiB  
Article
Location Planning of Emergency Medical Facilities Using the p-Dispersed-Median Modeling Approach
by Changwha Oh, Yongwan Chun and Hyun Kim
ISPRS Int. J. Geo-Inf. 2023, 12(12), 497; https://doi.org/10.3390/ijgi12120497 - 12 Dec 2023
Viewed by 1348
Abstract
This research employs a spatial optimization approach customized for addressing equitable emergency medical facility location problems through the p-dispersed-median problem (p-DIME). The p-DIME integrates two conflicting classes of spatial optimization problems, dispersion and median problems, aiming to identify the [...] Read more.
This research employs a spatial optimization approach customized for addressing equitable emergency medical facility location problems through the p-dispersed-median problem (p-DIME). The p-DIME integrates two conflicting classes of spatial optimization problems, dispersion and median problems, aiming to identify the optimal locations for emergency medical facilities to achieve an equitable spatial distribution of emergency medical services (EMS) while effectively serving demand. To demonstrate the utility of the p-DIME model, we selected Gyeongsangbuk-do in South Korea, recognized as one of the most challenging areas for providing EMS to the elderly population (aged 65 and over). This challenge arises from the significant spatial disparity in the distribution of emergency medical facilities. The results of the model assessment gauge the spatial disparity of EMS, provide significantly enhanced solutions for a more equitable EMS distribution in terms of service coverage, and offer policy implications for future EMS location planning. In addition, to address the computational challenges posed by p-DIME’s inherent complexity, involving mixed-integer programming, this study introduces a solution technique through constraint formulations aimed at tightening the lower bounds of the problem’s solution space. The computational results confirm the effectiveness of this approach in ensuring reliable computational performance, with significant reductions in solution times, while still producing optimal solutions. Full article
Show Figures

Figure 1

0 pages, 3162 KiB  
Article
Research on Traffic Accident Risk Prediction Method Based on Spatial and Visual Semantics
by Wenjing Li and Zihao Luo
ISPRS Int. J. Geo-Inf. 2023, 12(12), 496; https://doi.org/10.3390/ijgi12120496 - 11 Dec 2023
Viewed by 1521
Abstract
Predicting traffic accidents involves analyzing historical data, determining the relevant factors affecting the occurrence of traffic accidents, and predicting the likelihood of future traffic accidents. Most of the previous studies used statistical methods or single deep learning network model prediction methods while ignoring [...] Read more.
Predicting traffic accidents involves analyzing historical data, determining the relevant factors affecting the occurrence of traffic accidents, and predicting the likelihood of future traffic accidents. Most of the previous studies used statistical methods or single deep learning network model prediction methods while ignoring the visual effects of the city landscape on the drivers and the zero-inflation problem, resulting in poor prediction performance. Therefore, this paper constructs a city traffic accident risk prediction model that incorporates spatial and visual effects on drivers. The improved STGCN model is used in the model, a CNN and GRU replace the origin space–time convolution layer, two layers of a GCN are added to extract the city landscape similarity of different regions, and a BN layer is added to solve the gradient explosion problem. Finally, the features extracted from the time–space correlation module, the city landscape similarity module and the spatial correlation module are fused. The model is trained with the self-made Chicago dataset and compared with the existing network model. The comparison experiment proves that the prediction effect of the model in both the full time period and the high-frequency time period is better than that of the existing model. The ablation experiment proves that the city landscape similarity module added in this paper performs well in the high-frequency area. Full article
Show Figures

Figure 1

21 pages, 10820 KiB  
Article
An Aggregated Shape Similarity Index: A Case Study of Comparing the Footprints of OpenStreetMap and INSPIRE Buildings
by Renata Ďuračiová
ISPRS Int. J. Geo-Inf. 2023, 12(12), 495; https://doi.org/10.3390/ijgi12120495 - 09 Dec 2023
Viewed by 1503
Abstract
The mutual identification of spatial objects is a fundamental issue when updating geographic data with other data sets. Representations of spatial objects in different sources may not have the same identifiers, which would unambiguously assign them to each other. Intersections of spatial objects [...] Read more.
The mutual identification of spatial objects is a fundamental issue when updating geographic data with other data sets. Representations of spatial objects in different sources may not have the same identifiers, which would unambiguously assign them to each other. Intersections of spatial objects can be used for this purpose, but this does not allow for the detection of possible changes and their quantification. The aim of this paper is to propose a simple, applicable procedure for calculating the shape similarity measure, which should be able to efficiently identify different representations of spatial objects in two data sources, even though they may be changed or generalised. The main result is the aggregated index of shape similarity and instructions for its calculation and implementation. The shape similarity index is based on the calculation of the set similarity, the distance of the boundaries, and the differences in the area, perimeter, and number of the vertices of areal spatial objects. In the case study, the footprints of the building complexes in Dúbravka (part of the city of Bratislava, the capital of Slovakia) are compared using data from OpenStreetMap and INSPIRE (Infrastructure for Spatial Information in Europe) Buildings. A contribution to the quality check of the OpenStreetMap data is then a secondary result. The proposed method can be effectively used in the semi-automatic integration of heterogeneous data sources, updating the data source with other spatial data, or in their quality control. Full article
Show Figures

Figure 1

21 pages, 5886 KiB  
Article
A Motion-Based Conceptual Space Model to Support 3D Evacuation Simulation in Indoor Environments
by Ruihang Xie, Sisi Zlatanova, Jinwoo (Brian) Lee and Mitko Aleksandrov
ISPRS Int. J. Geo-Inf. 2023, 12(12), 494; https://doi.org/10.3390/ijgi12120494 - 08 Dec 2023
Cited by 1 | Viewed by 1547
Abstract
Three-dimensional (3D) indoor models are a crucial component to simulate pedestrian evacuations realistically in indoor environments. However, existing 3D indoor models cannot fully represent realistic indoor environments to enable the simulation of 3D pedestrian motions in evacuations because spaces above/below some physical components [...] Read more.
Three-dimensional (3D) indoor models are a crucial component to simulate pedestrian evacuations realistically in indoor environments. However, existing 3D indoor models cannot fully represent realistic indoor environments to enable the simulation of 3D pedestrian motions in evacuations because spaces above/below some physical components (e.g., desks, chairs) have been largely overlooked. Thus, this paper introduces a conceptual space model to advance a space identification and classification scheme that can fully capture 3D pedestrian motions. This paper first proposes the definition and parameterisation of different 3D pedestrian motions. Then, the definition and specifications of three categories of space components are elaborated on based on the motions. Finally, a voxel-based approach is introduced to identify and classify the space components, which are demonstrated by an illustrative example. This work contributes to advancing 3D indoor modelling to enable a more realistic simulation of 3D pedestrian motions. Full article
Show Figures

Figure 1

23 pages, 14593 KiB  
Article
Risk Assessment of Landslide Collapse Disasters along National Highways Based on Information Quantity and Random Forest Coupling Methods: A Case Study of the G331 National Highway
by Zuoquan Nie, Qiuling Lang, Yichen Zhang, Jiquan Zhang, Yanan Chen and Zengkai Pan
ISPRS Int. J. Geo-Inf. 2023, 12(12), 493; https://doi.org/10.3390/ijgi12120493 - 06 Dec 2023
Cited by 1 | Viewed by 1486
Abstract
Based on the data from two field surveys in 2015 and 2022, this paper calculates the weight of values using the entropy weight method and the variation coefficient method, and evaluates risk using the information quantity method. The information quantities of four levels [...] Read more.
Based on the data from two field surveys in 2015 and 2022, this paper calculates the weight of values using the entropy weight method and the variation coefficient method, and evaluates risk using the information quantity method. The information quantities of four levels of criteria (hazards, exposure, vulnerability, emergency responses, and capability of recovery) were extracted and inputted into a random forest model. After optimizing the hyperparameters of the random forest using GridSearchCV, the risk assessment was performed again. Finally, the accuracy of the two evaluation results was verified using an ROC curve, and the model with the higher AUC value was selected to create a risk map. Compared with previous studies, this paper considers the factors of emergency responses and recovery capability, which makes the risk assessment more comprehensive. Our findings show that the evaluation results based on the coupling model are more accurate than the evaluation results of the information method, as the coupling model had an AUC value of 0.9329. After considering the indices of emergency responses and capability of recovery, the risk level of the highest-risk area in the study area decreased. Full article
(This article belongs to the Topic Geotechnics for Hazard Mitigation)
Show Figures

Figure 1

24 pages, 6275 KiB  
Article
Exploring the Spatial Relationship between Street Crime Events and the Distribution of Urban Greenspace: The Case of Porto, Portugal
by Miguel Saraiva and Bárbara Teixeira
ISPRS Int. J. Geo-Inf. 2023, 12(12), 492; https://doi.org/10.3390/ijgi12120492 - 06 Dec 2023
Viewed by 2098
Abstract
In post-pandemic, climate-changing societies, the presence of urban greenspace assumes paramount functions, at the same time that socio-economic crises and shocks augment vulnerabilities and insecurities. The recent literature on environmental criminology argues that the geography of crime is not random, and that the [...] Read more.
In post-pandemic, climate-changing societies, the presence of urban greenspace assumes paramount functions, at the same time that socio-economic crises and shocks augment vulnerabilities and insecurities. The recent literature on environmental criminology argues that the geography of crime is not random, and that the presence of greenery, due to its impact on well-being and the environment, can have positive associations with feeling safe; although the opposite effect can occur if spaces are not properly designed or maintained. In this paper, the case study of Porto, Portugal, is presented; one of the municipalities with higher crime rates, that also pledged to double the available greenspace in the near future. As a way to support decision-making, the aim of this study was to present an overall exploratory diagnosis of how street crime patterns, of different typologies, spatially co-exist with greenspaces. Using a 10-year street crime dataset at the segment level, descriptive quantitative methods with the support of GIS have been applied to plot crime’s spatial distribution over time, as well as the walking accessibility to greenspaces. The results confirm crime’s geographical non-randomness, with distinct categories occupying specific locations, even though there was a consistently proportional distribution in the different distance bands. On the contrary, the cumulative effect of the proximity to greenspaces was variable. Almost half of the city’s street crimes (46%) were within a 5 min walking distance of greenspaces, but they were much closer to smaller inner-city urban gardens, with higher densities of street crimes (hot spots), than to larger municipal parks, where lower densities (cold spots) were seen. Full article
Show Figures

Figure 1

19 pages, 68820 KiB  
Article
Multiscale Analysis of Spatial Accessibility to Acute Hospitals in Carinthia, Austria
by Changzhen Wang, Michael Leitner and Gernot Paulus
ISPRS Int. J. Geo-Inf. 2023, 12(12), 491; https://doi.org/10.3390/ijgi12120491 - 06 Dec 2023
Cited by 1 | Viewed by 1371
Abstract
Health care accessibility studies are well established in the US but lacking in Austria, even though both experience high costs and have hospital care as the largest contributor to health care spending. This study aims to examine multiscale spatial accessibility to acute hospitals [...] Read more.
Health care accessibility studies are well established in the US but lacking in Austria, even though both experience high costs and have hospital care as the largest contributor to health care spending. This study aims to examine multiscale spatial accessibility to acute hospitals in Carinthia, Austria. Using the most recent data at census block and 250 meter grid levels, we refine proximity and generalized two-step floating catchment area (G2SFCA) methods while accounting for the modifiable areal unit problem (MAUP) and edge effects. For census blocks and 250 meter grids, the mean travel times to the nearest acute hospitals are 16 and 21 min, respectively, covering 58.8% and 76.2% of the population, which, however, increases to 25 and 31 min to the three nearest hospitals with similar populations. People bypassing the nearest hospital to seek hospitals at a longer distance, termed “bypass behavior”, is more influential, as 20% more of the population living in mountainous or rural areas need to travel 30 min longer. The G2SFCA method with a more pronounced distance decay results in a more decentralized polycentric structure of accessibility and identifies poorer access areas. While urban advantage is most evident in Klagenfurt and Villach, not all areas near hospitals enjoy the highest accessibility. A combination of the proximity and G2SFCA methods identifies less accessible areas. The MAUP overestimates accessibility at a coarse level and in less populous areas. Edge effects occur at the border when using proximity only, but they are more sensitive when considering bypass behavior or a weak distance decay effect. This study contributes to our understanding of acute hospitals’ accessibility in Carinthia and highlights the need to improve low-accessible areas in addition to universal health coverage. Cautions need to be exercised when using different geographic units or considering edge effects for health care planning and management. Full article
Show Figures

Figure 1

18 pages, 7077 KiB  
Article
On the Definition of Standard Parallels in Map Projections
by Miljenko Lapaine
ISPRS Int. J. Geo-Inf. 2023, 12(12), 490; https://doi.org/10.3390/ijgi12120490 - 06 Dec 2023
Cited by 1 | Viewed by 1499
Abstract
The article belongs to the field of theoretical research on map projections. It is observed that there is no unique and generally accepted definition of standard parallels in the cartographic literature. For some authors, a standard line is a line along which there [...] Read more.
The article belongs to the field of theoretical research on map projections. It is observed that there is no unique and generally accepted definition of standard parallels in the cartographic literature. For some authors, a standard line is a line along which there is no distortion, and for others, it is a line along which there is no distortion of length. At the same time, it is forgotten that the length distortions at any point generally change and depend on the direction. The main goal of this article is very simple: the sentence “linear deformation is zero in all directions” is expressed using a mathematical formula. Besides that, the paper introduces equidistance in a broader sense. This is a novelty in the theory of map projections. Equidistance is defined at a point, along a line and in an area, especially in the direction of the parallels and especially in the direction of the meridian. This enables an unambiguous definition of standard parallels. Theoretical considerations are illustrated with examples of cylindrical projections. The practical value of the proposed approach is manifested in the possibility of a better understanding of the distribution of distortions in any map projection used. Full article
Show Figures

Figure 1

19 pages, 7724 KiB  
Article
High-Temporal-Resolution Prediction of Malaria Transmission Risk in South Kivu, Democratic Republic of the Congo, Based on Multi-Criteria Evaluation Using Geospatial Data
by Ryunosuke Komura and Masayuki Matsuoka
ISPRS Int. J. Geo-Inf. 2023, 12(12), 489; https://doi.org/10.3390/ijgi12120489 - 06 Dec 2023
Viewed by 1406
Abstract
Malaria is a major public health concern, and accurate mapping of malaria risk is essential to effectively managing the disease. However, current models are unable to predict malaria risk with high temporal and spatial resolution. This study describes a climate-based model that can [...] Read more.
Malaria is a major public health concern, and accurate mapping of malaria risk is essential to effectively managing the disease. However, current models are unable to predict malaria risk with high temporal and spatial resolution. This study describes a climate-based model that can predict malaria risk in South Kivu, Democratic Republic of the Congo, daily at a resolution of 2 km using meteorological (relative humidity, precipitation, wind speed, and temperature) and elevation data. We used the multi-criteria evaluation technique to develop the model. For the weighting of factors, we employed the analytical hierarchy process and linear regression techniques to compare expert knowledge-driven and mathematical methods. Using climate data from the prior 2 weeks, the model successfully mapped regions with high malaria case numbers, enabling accurate prediction of high-risk regions. This research may contribute to the development of a sustainable malaria risk forecasting system, which has been a longstanding challenge. Overall, this study provides insights into model development to predict malaria risk with high temporal and spatial resolution, supporting malaria control and management efforts. Full article
(This article belongs to the Topic Spatial Epidemiology and GeoInformatics)
Show Figures

Figure 1

25 pages, 5028 KiB  
Article
Applying Dynamic Human Activity to Disentangle Property Crime Patterns in London during the Pandemic: An Empirical Analysis Using Geo-Tagged Big Data
by Tongxin Chen, Kate Bowers and Tao Cheng
ISPRS Int. J. Geo-Inf. 2023, 12(12), 488; https://doi.org/10.3390/ijgi12120488 - 06 Dec 2023
Viewed by 1649
Abstract
This study aimed to evaluate the relationships between different groups of explanatory variables (i.e., dynamic human activity variables, static variables of social disorganisation and crime generators, and combinations of both sets of variables) and property crime patterns across neighbourhood areas of London during [...] Read more.
This study aimed to evaluate the relationships between different groups of explanatory variables (i.e., dynamic human activity variables, static variables of social disorganisation and crime generators, and combinations of both sets of variables) and property crime patterns across neighbourhood areas of London during the pandemic (from 2020 to 2021). Using the dynamic human activity variables sensed from mobile phone GPS big data sets, three types of ‘Least Absolute Shrinkage and Selection Operator’ (LASSO) regression models (i.e., static, dynamic, and static and dynamic) differentiated into explanatory variable groups were developed for seven types of property crime. Then, the geographically weighted regression (GWR) model was used to reveal the spatial associations between distinct explanatory variables and the specific type of crime. The findings demonstrated that human activity dynamics impose a substantially stronger influence on specific types of property crimes than other static variables. In terms of crime type, theft obtained particularly high relationships with dynamic human activity compared to other property crimes. Further analysis revealed important nuances in the spatial associations between property crimes and human activity across different contexts during the pandemic. The result provides support for crime risk prediction that considers the impact of dynamic human activity variables and their varying influences in distinct situations. Full article
Show Figures

Figure 1

22 pages, 4022 KiB  
Article
Vertical vs. Horizontal Fractal Dimensions of Roads in Relation to Relief Characteristics
by Klemen Prah and Ashton M. Shortridge
ISPRS Int. J. Geo-Inf. 2023, 12(12), 487; https://doi.org/10.3390/ijgi12120487 - 30 Nov 2023
Cited by 1 | Viewed by 1335
Abstract
This paper investigated the surface length of roads from both horizontal and vertical perspectives using the theory of fractal dimension of surfaces and curves. Three progressive experiments were conducted. The first demonstrated the magnitude of the differences between the planar road length and [...] Read more.
This paper investigated the surface length of roads from both horizontal and vertical perspectives using the theory of fractal dimension of surfaces and curves. Three progressive experiments were conducted. The first demonstrated the magnitude of the differences between the planar road length and the DTM-derived surface road length and assessed its correlation with the DTM-calculated road slope. The second investigated the road distance complexity through the fractal dimension in both planar and vertical dimensions. The third related the vertical with the horizontal fractal dimension of roads across a range of distinct physiographic regions. The study contributed theoretically by linking the planimetric complexity to vertical complexity, with clear applications for advanced transportation studies and network analyses. The core methodology used geographic information systems (GIS) to integrate a high resolution (1 × 1 m) digital terrain model (DTM) with a road network layer. A novel concept, the vertical fractal dimension of roads was introduced. Both the vertical and horizontal fractal dimensions of the roads were calculated using the box-counting methodology. We conducted an investigation into the relationship between the two fractal dimensions using fourteen study areas within four distinct physiographic regions across Slovenia. We found that the average slope of a three-dimensional (3D) road was directly related to the length difference between 3D and two-dimensional (2D) roads. The calculated values for the vertical fractal dimension in the study areas were only slightly above 1, while the maximum horizontal fractal dimension of 1.1837 reflected the more sinuous properties of the road in plan. Variations in the vertical and horizontal fractal dimensions of the roads varied between the different physiographic regions. Full article
Show Figures

Figure 1

21 pages, 12463 KiB  
Article
Measuring the Multiple Functions and Tradeoffs among Streets: A New Framework Using the Deep Learning Method
by Shihang Fu, Ying Fang, Nannan Wang, Zhaomin Tong and Yaolin Liu
ISPRS Int. J. Geo-Inf. 2023, 12(12), 486; https://doi.org/10.3390/ijgi12120486 - 29 Nov 2023
Viewed by 1599
Abstract
With the sustainable and coordinated development of cities, the formulation of urban street policies requires multiangle analysis. In regard to the existing street research, a large number of studies have focused on specific landscapes or accessibility of streets, and there is a lack [...] Read more.
With the sustainable and coordinated development of cities, the formulation of urban street policies requires multiangle analysis. In regard to the existing street research, a large number of studies have focused on specific landscapes or accessibility of streets, and there is a lack of research on the multiple functions of streets. Recent advances in sensor technology and digitization have produced a wealth of data and methods. Thus, we may comprehensively understand streets in a less labor-intensive way, not just single street functions. This paper defines an index system of the multiple functions of urban streets and proposes a framework for multifunctional street measurement. Via the application of deep learning to Baidu Street View (BSV) imagery, we generate three functions, namely, landscape, traffic, and economic functions. The results indicate that street facilities and features are suitably identified. According to the multifunctional perspective, this paper further classifies urban streets into multifunctional categories and provides targeted policy recommendations for urban street planning. There exist correlations among the various street functions, and the correlation between the street landscape and economic functions is highly significant. This framework can be widely applied in other countries and cities to better understand street differences in various cities. Full article
Show Figures

Figure 1

19 pages, 29056 KiB  
Article
A Head/Tail Breaks-Based Approach to Characterizing Space-Time Risks of COVID-19 Epidemic in China’s Cities
by Tingting Wu, Bisong Hu, Jin Luo and Shuhua Qi
ISPRS Int. J. Geo-Inf. 2023, 12(12), 485; https://doi.org/10.3390/ijgi12120485 - 29 Nov 2023
Viewed by 1583
Abstract
The novel coronavirus pneumonia (COVID-19) pandemic has caused enormous impacts around the world. Characterizing the risk dynamics for urgent epidemics such as COVID-19 is of great benefit to epidemic control and emergency management. This article presents a novel approach to characterizing the space-time [...] Read more.
The novel coronavirus pneumonia (COVID-19) pandemic has caused enormous impacts around the world. Characterizing the risk dynamics for urgent epidemics such as COVID-19 is of great benefit to epidemic control and emergency management. This article presents a novel approach to characterizing the space-time risks of the COVID-19 epidemic. We analyzed the heavy-tailed distribution and spatial hierarchy of confirmed COVID-19 cases in 367 cities from 20 January to 12 April 2020, and population density data for 2019, and modelled two parameters, COVID-19 confirmed cases and population density, to measure the risk value of each city and assess the epidemic from the perspective of spatial and temporal changes. The evolution pattern of high-risk areas was assessed from a spatial and temporal perspective. The number of high-risk cities decreased from 57 in week 1 to 6 in week 12. The results show that the risk measurement model based on the head/tail breaks approach can describe the spatial and temporal evolution characteristics of the risk of COVID-19, and can better predict the risk trend of future epidemics in each city and identify the risk of future epidemics even during low incidence periods. Compared with the traditional risk assessment method model, it pays more attention to the differences in the spatial level of each city and provides a new perspective for the assessment of the risk level of epidemic transmission. It has generality and flexibility and provides a certain reference for the prevention of infectious diseases as well as a theoretical basis for government implementation strategies. Full article
(This article belongs to the Collection Spatial Components of COVID-19 Pandemic)
Show Figures

Figure 1

27 pages, 870 KiB  
Article
Internet in the Middle of Nowhere: Performance of Geoportals in Rural Areas According to Core Web Vitals
by Karol Król and Wojciech Sroka
ISPRS Int. J. Geo-Inf. 2023, 12(12), 484; https://doi.org/10.3390/ijgi12120484 - 29 Nov 2023
Viewed by 1470
Abstract
The spatial planning system in Poland is undergoing a fundamental reform. It emphasises the digital representation of spatial data. Low performance of geoportals, no Internet access, or poor connectivity can contribute to the exclusion from the spatial planning process, and consequently to the [...] Read more.
The spatial planning system in Poland is undergoing a fundamental reform. It emphasises the digital representation of spatial data. Low performance of geoportals, no Internet access, or poor connectivity can contribute to the exclusion from the spatial planning process, and consequently to the exclusion from a specific part of public life. Considering these developments, the present study seems relevant by pointing out the issue with geoportal performance and availability of quality Internet in rural areas. The primary contribution of the article is (1) results of performance measurements for selected geoportals; (2) presentation of measuring tools and performance indices combined with methods for ad-hoc performance measuring; and (3) presentation of potential actions to improve geoportal performance on the device with which it is used. The article offers case studies where the performance of selected geoportals was tested in rural mountainous areas with limited Internet access. Five geoportals were tested with PageSpeed Insights (PSI), WebPageTest, GTmetrix, Pingdom, and GiftOfSpeed. Core Web Vitals indices were analysed: Largest Contentful Paint (LCP), First Input Delay (FID), Cumulative Layout Shift (CLS), and First Contentful Paint (FCP). The author verified values of the Speed Index and Fully Loaded Time along with other performance indices, like GTmetrix Structure. The study failed to provide unambiguous evidence that radio link users in rural areas could experience problems with geoportal performance, although the results seem to suggest it indirectly. PSI Lab Data and Field Data tests revealed a relatively low performance of the geoportals. The Performance index remained below 50 in most cases, which is ‘Poor’ according to the PSI scale. The fully loaded time exceeded 10 s for all the geoportals and 20 s in some cases (Lab Data). It means that the perceived performance of the tested geoportals on a radio link in rural areas is most probably even lower. The case studies demonstrated further that the user has limited possibilities to speed up map applications. It is possible to slightly improve the geoportal experience through the optimisation of the device locally, but the responsibility to ensure geoportal performance is mainly the publisher’s. Full article
Show Figures

Figure 1

30 pages, 11203 KiB  
Article
Mixed-Methods Approach to Land Use Renewal Strategies in and around Abandoned Airports: The Case of Beijing Nanyuan Airport
by Haoxian Cai and Wei Duan
ISPRS Int. J. Geo-Inf. 2023, 12(12), 483; https://doi.org/10.3390/ijgi12120483 - 28 Nov 2023
Viewed by 1670
Abstract
Urban airports are typically large infrastructures with significant cultural, economic, and ecological impacts; meanwhile, abandoned airports are common worldwide. However, there is limited knowledge regarding transformation strategies for the renewal of abandoned airports and their surrounding regions in historically and culturally rich areas. [...] Read more.
Urban airports are typically large infrastructures with significant cultural, economic, and ecological impacts; meanwhile, abandoned airports are common worldwide. However, there is limited knowledge regarding transformation strategies for the renewal of abandoned airports and their surrounding regions in historically and culturally rich areas. We use Beijing’s Nanyuan Airport as a case study, combining the historic urban landscape approach, land use and land cover change, and counterfactual simulations of land use patterns to construct a comprehensive analytical framework. Our framework was used to analyze the long-term land use patterns of the study area, determine its value, and improve perception from a macro- and multi-perspective. We discovered that the traditional knowledge and planning systems in the study area have largely disappeared, but Nanyuan Airport’s impact on the surrounding land use patterns is unique and significant. By considering the characteristics and mechanisms of land use in the study area, we aimed to find a balance point between the historical context and future potential. As such, we propose optimized recommendations with the theme of connection and development engines. Our findings supplement the planning knowledge of relevant areas and provide a springboard for interdisciplinary research in landscape planning. Full article
Show Figures

Figure 1

27 pages, 8450 KiB  
Article
Impacts of Urban Morphology on Seasonal Land Surface Temperatures: Comparing Grid- and Block-Based Approaches
by Gyuwon Jeon, Yujin Park and Jean-Michel Guldmann
ISPRS Int. J. Geo-Inf. 2023, 12(12), 482; https://doi.org/10.3390/ijgi12120482 - 28 Nov 2023
Viewed by 1592
Abstract
Climate change is expected to result in increased occurrences of extreme weather events such as heat waves and cold spells. Urban planning responses are crucial for improving the capacity of cities and communities to deal with significant temperature variations across seasons. This study [...] Read more.
Climate change is expected to result in increased occurrences of extreme weather events such as heat waves and cold spells. Urban planning responses are crucial for improving the capacity of cities and communities to deal with significant temperature variations across seasons. This study aims to investigate the relationship between urban temperature fluctuations and urban morphology throughout the four seasons. Through quadrant and statistical analyses, built-environment factors are identified that moderate or exacerbate seasonal land surface temperatures (LSTs). The focus is on Seoul, South Korea, as a case study, and seasonal LST values are calculated at both the grid (100 m × 100 m) and street block levels, incorporating factors such as vegetation density, land use patterns, albedo, two- and three-dimensional building forms, and gravity indices for large forests and water bodies. The quadrant analysis reveals a spatial segregation between areas demonstrating high LST adaptability (cooler summers and warmer winters) and those displaying LST vulnerability (hotter summers and colder winters), with significant differences in vegetation and building forms. Spatial regression analyses demonstrate that higher vegetation density and proximity to water bodies play key roles in moderating LSTs, leading to cooler summers and warmer winters. Building characteristics have a constant impact on LSTs across all seasons: horizontal expansion increases the LST, while vertical expansion reduces the LST. These findings are consistent for both grid- and block-level analyses. This study emphasizes the flexible role of the natural environment in moderating temperatures. Full article
Show Figures

Figure 1

24 pages, 7987 KiB  
Article
Mapping Gross Domestic Product Distribution at 1 km Resolution across Thailand Using the Random Forest Area-to-Area Regression Kriging Model
by Yan Jin, Yong Ge, Haoyu Fan, Zeshuo Li, Yaojie Liu and Yan Jia
ISPRS Int. J. Geo-Inf. 2023, 12(12), 481; https://doi.org/10.3390/ijgi12120481 - 27 Nov 2023
Viewed by 1636
Abstract
Accurate spatial distribution of gridded gross domestic product (GDP) data is crucial for revealing regional disparities within administrative units, thus facilitating a deeper understanding of regional economic dynamics, industrial distribution, and urbanization trends. The existing GDP spatial models often rely on prediction residuals [...] Read more.
Accurate spatial distribution of gridded gross domestic product (GDP) data is crucial for revealing regional disparities within administrative units, thus facilitating a deeper understanding of regional economic dynamics, industrial distribution, and urbanization trends. The existing GDP spatial models often rely on prediction residuals for model evaluation or utilize residual distribution to improve the final accuracy, frequently overlooking the modifiable areal unit problem within residual distribution. This paper introduces a hybrid downscaling model that combines random forest and area-to-area kriging to map gridded GDP. Employing Thailand as a case study, GDP distribution maps were generated at a 1 km spatial resolution for the year 2015 and compared with five alternative downscaling methods and an existing GDP product. The results demonstrate that the proposed approach yields higher accuracy and greater precision in detailing GDP distribution, as evidenced by the smallest mean absolute error and root mean squared error values, which stand at USD 256.458 and 699.348 ten million, respectively. Among the four different sets of auxiliary variables considered, one consistently exhibited a higher prediction accuracy. This particular set of auxiliary variables integrated classification-based variables, illustrating the advantages of incorporating such integrated variables into modeling while accounting for classification characteristics. Full article
Show Figures

Figure 1

21 pages, 3568 KiB  
Article
Research on Approximate Spatial Keyword Group Queries Based on Differential Privacy and Exclusion Preferences in Road Networks
by Liping Zhang, Jing Li and Song Li
ISPRS Int. J. Geo-Inf. 2023, 12(12), 480; https://doi.org/10.3390/ijgi12120480 - 26 Nov 2023
Viewed by 1360
Abstract
A new spatial keyword group query method is proposed in this paper to address the existing issue of user privacy leakage and exclusion of preferences in road networks. The proposed query method is based on the IGgram-tree index and minimum hash set. To [...] Read more.
A new spatial keyword group query method is proposed in this paper to address the existing issue of user privacy leakage and exclusion of preferences in road networks. The proposed query method is based on the IGgram-tree index and minimum hash set. To deal with this problem effectively, this paper proposes a query method based on the IGgram-tree index and minimum hash set. The IGgram-tree index is proposed for the first time to deal with the approximate keyword query problem in the road network. This index significantly improves the efficiency of calculating the road network distance and querying approximate keywords. Considering that spatial keyword group queries are caused by NP-hard problems with high time complexity, this paper proposes a data structure that uses the minimum hash set, which can efficiently search for the result set. To address the problem that the traditional spatial keyword group query does not consider user privacy leakage and the limitations of existing privacy protection techniques, this method proposes a differential privacy-based allocation method to better protect the privacy of data. The theoretical study and experimental analysis show that the proposed method can better handle the approximate spatial keyword group query problem based on its use of differential privacy and exclusion preferences in road networks. Full article
Show Figures

Figure 1

20 pages, 4054 KiB  
Article
Understanding Map Misinterpretation: Factors Influencing Correct Map Reading and Common Errors
by Csaba Szigeti-Pap, Dávid Kis and Gáspár Albert
ISPRS Int. J. Geo-Inf. 2023, 12(12), 479; https://doi.org/10.3390/ijgi12120479 - 26 Nov 2023
Viewed by 1653
Abstract
Misinterpreting maps can have serious consequences, especially in situations requiring quick decisions like using car navigation systems. Studies indicate that a map reader’s experience is crucial for understanding maps, but factors such as age, education, and gender can also influence interpretation. However, understanding [...] Read more.
Misinterpreting maps can have serious consequences, especially in situations requiring quick decisions like using car navigation systems. Studies indicate that a map reader’s experience is crucial for understanding maps, but factors such as age, education, and gender can also influence interpretation. However, understanding only the proportion of correctly interpreted information is not enough. It is essential to investigate the types of mistakes made and their causes. To address this, we conducted a study available in six languages with 511 participants who completed an online questionnaire testing their map reading skills. The questions focused on scale usage, mental rotation, and recognizing map categories (relief, line and point symbols, and geographic names). Gender had significant relation with one skill, qualification with two and age with three. Experience was associated to the highest number of skills, a total of four, confirming previous findings. When making mistakes, participants tended to overestimate distances and struggled with conceptual similarities in symbol recognition. Experienced readers often misplaced reference locations of geographic names. The results of the research could be used in the design of large-scale maps (e.g., car navigation), as they allow to reduce typical map reading errors by careful selection of symbol types and placements. Full article
Show Figures

Figure 1

14 pages, 3856 KiB  
Article
Spatial Accessibility of Public Electric Vehicle Charging Services in China
by Yu Chen, Yuehong Chen and Yuqi Lu
ISPRS Int. J. Geo-Inf. 2023, 12(12), 478; https://doi.org/10.3390/ijgi12120478 - 25 Nov 2023
Viewed by 1789
Abstract
Decarbonizing the transport sector using electric vehicles (EVs) is a vital pathway for China to achieve the carbon peak and carbon neutrality goals. Despite the unprecedented growth of EV diffusion in China, little information is available for the spatial accessibility of public electric [...] Read more.
Decarbonizing the transport sector using electric vehicles (EVs) is a vital pathway for China to achieve the carbon peak and carbon neutrality goals. Despite the unprecedented growth of EV diffusion in China, little information is available for the spatial accessibility of public electric vehicle charging services (EVCSs). This study developed an applicable accessibility measurement framework to examine the city-level accessibility of EVCSs in China using the Gaussian two-step floating catchment area (G2SFCA) method. G2SFCA takes the EV charging stations with charging piles as supply and the EV ownership data as demand. The results indicate that (1) the eastern region of China has the highest density of EV charging stations (69.1%), followed by the central region, while the western region has the lowest density; (2) the spatial accessibility of EVCSs has a different pattern, where the central region has the highest accessibility, followed by the eastern and western regions; (3) the spatial mismatch between EVCSs and EV diffusion in the eastern region is larger than that of the other two regions, which may be attributed to the suboptimal layout of EV charging stations and the inconsistent pace between EV penetration and EV charging station construction; and (4) there is a significant spatial inequity in the accessibility of EVCSs across both all three regions and the entirety of China, with the western region exhibiting the highest inequity, followed by the central and eastern regions. Based on these findings, policy implications are drawn for different regions in China, which may aid policymakers in crafting strategic policies and subsidy programs to foster the advancement of EVCSs. Full article
Show Figures

Figure 1

14 pages, 4193 KiB  
Article
Analysis of Spatial and Temporal Distribution Patterns of Traditional Opera Culture along the Beijing–Hangzhou Grand Canal
by Jiayi Yang, Di Hu, Zihan Chen, Yicheng Xu, Zewei Zou and Ying Zhu
ISPRS Int. J. Geo-Inf. 2023, 12(12), 477; https://doi.org/10.3390/ijgi12120477 - 25 Nov 2023
Cited by 1 | Viewed by 1327
Abstract
As an exquisite asset of Chinese traditional culture, traditional opera occupies a place of high esteem within the world’s cultural and artistic treasury. The impact of emerging cultures has threatened the future of traditional opera culture, necessitating a thorough examination of the historical [...] Read more.
As an exquisite asset of Chinese traditional culture, traditional opera occupies a place of high esteem within the world’s cultural and artistic treasury. The impact of emerging cultures has threatened the future of traditional opera culture, necessitating a thorough examination of the historical context of the Grand Canal and traditional opera. There is insufficient research on the spatial evolution of the traditional opera culture along the Grand Canal; thus, this study takes ancient opera stages, a representative cultural relic of traditional opera, as an entry point and employs methods such as kernel density analysis and standard deviation ellipse analysis to analyze the spatial and temporal distribution patterns of the traditional opera culture along the Grand Canal. The results showed that: (i) Nationwide, opera stages in the areas along the Grand Canal exhibit a significant clustering characteristic. (ii) The changes in the number and locations of opera stages in the areas along the Grand Canal are closely related to the rise and fall of the Canal. The opera stages emerged along the Canal, gradually prospered with the development of the Canal, and finally clustered in a band-like cluster along the Grand Canal. (iii) From the Ming Dynasty to the founding of the People’s Republic of China, the opera stages in the areas along the Grand Canal spread in the “southeast–northwest” direction, which was consistent with the main direction of the Grand Canal, indicating its driving influence. (iv) On the centennial scale, from the 14th century to the 20th century, the evolution characteristics of the distribution centroid of opera stages in the areas along the Grand Canal were closely related to the key time nodes of Grand Canal construction and basin expansion. This study reveals the relationship between the Grand Canal and the spatial pattern evolution of traditional opera culture, aiming to promote the construction of the Grand Canal cultural belt. Full article
Show Figures

Figure 1

19 pages, 4063 KiB  
Article
Effects of Spatial Reference Frames, Map Dimensionality, and Navigation Modes on Spatial Orientation Efficiency
by Hongyun Guo, Nai Yang, Zhong Wang and Hao Fang
ISPRS Int. J. Geo-Inf. 2023, 12(12), 476; https://doi.org/10.3390/ijgi12120476 - 23 Nov 2023
Viewed by 1334
Abstract
How can the interactive mode of a map be optimized to facilitate efficient positioning and improve cognitive efficiency? This paper addresses this crucial aspect of map design. It explores the impact of spatial reference frames, map dimensionality, and navigation modes on spatial orientation [...] Read more.
How can the interactive mode of a map be optimized to facilitate efficient positioning and improve cognitive efficiency? This paper addresses this crucial aspect of map design. It explores the impact of spatial reference frames, map dimensionality, and navigation modes on spatial orientation efficiency, as well as their interactions, through empirical eye-movement experiments. The results demonstrate the following: (1) When using a 2D fixed map in an allocentric reference frame, participants exhibit a high correct rate, a low cognitive load, and a short reaction time. In contrast, when operating within an egocentric reference frame using a 2D rotating map, participants demonstrate a higher correct rate, a reduced cognitive load, and a quicker reaction time. (2) The simplicity of 2D maps, despite their reduced authenticity compared to 3D maps, diminishes users’ cognitive load and enhances positioning efficiency. (3) The fixed map aligns more closely with the cognitive habits of participants in the allocentric reference frame, while the rotating map corresponds better to the cognitive habits of participants in the egocentric reference frame, thereby improving their cognitive efficiency. This study offers insights that can inform the optimization design of spatial orientation efficiency. Full article
Show Figures

Figure 1

Previous Issue
Next Issue
Back to TopTop