Article

Exploring the Spatial Relationship between Street Crime Events and the Distribution of Urban Greenspace: The Case of Porto, Portugal

by
Miguel Saraiva
1,* and
Bárbara Teixeira
2
1
CEGOT—Centre of Studies in Geography and Spatial Planning, Faculty of Arts and Humanities of the University of Porto, 4150-564 Porto, Portugal
2
Faculty of Arts and Humanities of the University of Porto, 4150-564 Porto, Portugal
*
Author to whom correspondence should be addressed.
ISPRS Int. J. Geo-Inf. 2023, 12(12), 492; https://doi.org/10.3390/ijgi12120492
Submission received: 18 September 2023 / Revised: 1 December 2023 / Accepted: 2 December 2023 / Published: 6 December 2023

Abstract

:
In post-pandemic, climate-changing societies, the presence of urban greenspace assumes paramount functions, at the same time that socio-economic crises and shocks augment vulnerabilities and insecurities. The recent literature on environmental criminology argues that the geography of crime is not random, and that the presence of greenery, due to its impact on well-being and the environment, can have positive associations with feeling safe; although the opposite effect can occur if spaces are not properly designed or maintained. In this paper, the case study of Porto, Portugal, is presented; one of the municipalities with higher crime rates, that also pledged to double the available greenspace in the near future. As a way to support decision-making, the aim of this study was to present an overall exploratory diagnosis of how street crime patterns, of different typologies, spatially co-exist with greenspaces. Using a 10-year street crime dataset at the segment level, descriptive quantitative methods with the support of GIS have been applied to plot crime’s spatial distribution over time, as well as the walking accessibility to greenspaces. The results confirm crime’s geographical non-randomness, with distinct categories occupying specific locations, even though there was a consistently proportional distribution in the different distance bands. On the contrary, the cumulative effect of the proximity to greenspaces was variable. Almost half of the city’s street crimes (46%) were within a 5 min walking distance of greenspaces, but they were much closer to smaller inner-city urban gardens, with higher densities of street crimes (hot spots), than to larger municipal parks, where lower densities (cold spots) were seen.

1. Introduction

As Bottoms and Wiles [1] wrote, environmental criminology would be of little interest if the geographical distribution of offences was random. In the Handbook of Criminological Theory, Sidebottom and Wortley [2] describe environmental criminology as an overarching framework that comprises several approaches linked by a common interest: the relationship between crime and urban space [1]. “Place Matters” in the studies of urban safety [3], and geography makes “an important and lasting imprint on dealing with crime” [4] (p. 161), because human activity is shaped spatially, and therefore is influenced by place-based factors. Within the urban realm, places are not homogenous. They possess different characteristics (relating to morphology, design, and others) and different socio-economic attributes, due to the distribution of population and activities. Consequently, because environmental criminology recognizes that criminal behaviour is significantly influenced by the nature of, precisely, the environment it occurs in, then, as urban conditions vary, so will criminal patterns vary [5].
Since the 1970s, various theories have been put forth deepening the collective understanding of the relationship between crime and place. Early in the decade, C. Ray Jeffery [6] authored the book “Crime Prevention Through Environmental Design”, where the term ‘environmental criminology’ was used for the first time, quickly followed by Oscar Newman’s “Defensible Space” [7]. The acronym CPTED would become popular to the current day [8,9], defining a set of strategies of crime and insecurity reduction based on the reconfiguration and management of the built environment. If the physical characteristics of a given place make offenses harder to perpetrate, riskier, and less rewarding, then they have less likelihood of being committed.
A few years later, Routine Activity Theory [10] defined a famous triangle, explaining that for crime to occur, there needs to exist a convergence of a motivated offender, a suitable target, and the absence of a guardian. This convergence occurs in time, but also, importantly, in a given space, due to people’s daily movements and routines. Rational Choice Theory [11] explores more concretely the decisions to act made by motivated offenders. They do so by evaluating risk and possible returns, so, if a location has a higher “cost of crime”, for example, by the presence of guardians, then it will more likely have lower crime occurrences. Both theories have inspired Situational Crime Prevention, by which, like CPTED but with a broader scope, opportunities for crime are reduced by acting on settings through space management and design/environmental changes to increase risk and effort, and minimize provocations, excuses, and rewards [12,13,14]. Consequently, such patterns should be analysed at macro-scales and focus on specific problems and types of crime. The Bratingham’s Crime Pattern Theory [15] combines the previous knowledge, adding a crucial spatial component, by establishing that the generation of opportunities and crime location does not occur by chance. The everyday geography of movements, and the attraction of particular places, such as work and leisure sites, creates activity spaces. When the spaces of potential victims and offenders overlap, and if these spaces have the right conditions, then the probability of crime increases.
The formulation of a Criminology of Place [16] resulted from the previous theories, whilst also recognizing the increasing role of geography in crime studies, which significantly augmented from the 1970s [17] to the 21st century, as Geographical Information Systems (GIS) allowed greater potential in terms of data georeferencing, modelling, and analysis [18,19,20]. Weisburd et al. [21] cemented the conceptualization of crime patterns as being heavily concentrated in hot spots, stable over time, and displaying large variability at the micro-scale, which led to the formulation of the Law of Crime Concentration [22]. Therefore, authors have been urging for a smarter aggregation of spatial data [23], by using the potentialities of GIS-led analysis to improve place-based approaches. However, this is not yet entirely widespread, due to a lack of know-how and also because there is often difficulty in collecting micro-scale crime data for research [20].
Within this context, the relationship between crime patterns and the location of greenspaces has received increased attention in the literature. Nature-based solutions, of which greenspaces are a crucial part, are deemed to be extremely relevant assets to augment the resilience and sustainability of post-modern cities [24,25]. The relevance of the presence of greenspaces, and of access to them, has been proven regarding their environmental benefits, such as flood control, biodiversity, air quality, and cooling effects [26]. Greenspaces have also been deemed to decrease vulnerability to disasters [27]; decrease energy consumption, improve urban water management, and promote a greener economy [28]. At the same time, they are deemed to have significant impacts on human health [29] by improving quality of life and life satisfaction [30], not only due to their aesthetic meaning, but because they stimulate outdoor recreation, socialization, and physical activity [31].
As public spaces of mostly daily use, urban greenspace is a key component of the social organization of the territory, forming places for community interaction that instil a sense of belonging [32]. Consequently, they have the potential to stimulate collective efficacy, i.e., promote social cohesion and informal social control that normalizes healthy behaviour, thus influencing crime patterns at the micro-geographical level [33,34]. Indeed, as the importance of green and blue spaces in post-carbon societies is increasingly being recognized in urban agendas worldwide, the recent literature on environmental criminology has delved into this intrinsic connection to crime patterns. On the one hand, studies follow the above line of thought, seeing in greenspaces locations that, due to increased social activities and the presence of nature, help reduce the risk of criminal opportunities. On the other hand, due to the way they are designed, and because at certain times they may have less movement or no movement at all (such as during night-time), greenspaces can also generate fear of crime and even be dangerous.
The city of Porto, in Portugal, aspires, by the Municipality’s own admission (https://www.cm-porto.pt/, accessed on 4 September 2023), to be a “green city”. It was one of the signatory cities of the EU’s The Green City Accord, being even cited as a best practice example when the accord was presented in October 2020. One of the pledges was that Porto would double the roughly 455 hectares of green and biodiverse space currently available to its residents. At the same time, Porto is one of the municipalities in Portugal with higher crime rates [20,35]. Most notable are several types of crimes against people, including against physical integrity and violence, and crimes against property, such as pickpocketing or car thefts. The peak of street crimes occurs in the summer months, particularly between May and September [36]. This coincides with—and may also partly be caused by—it being an increasingly touristic city since becoming the European Capital of Culture in 2001 and engaging in a process of urban regeneration and revitalization, leading to several international accolades (most recently, for example, Best City Destination in Europe 2022, by the 29th World Travel Awards). Concomitantly, after being considered a shrinking city due to a negative demographic trend over the last half-century, especially in the city centre, Porto finally started to regain residents in 2017 [37]. The combined effect of urban and demographic decline with touristic growth has had direct and indirect impacts on the most recent greenspace planning, for example, by using attractive landscapes to draw visitors away from the city centre [38].
These combined reasons constitute the rationale for the exploratory research here presented, namely (i) the proven relevance that greenspaces assume in post-modern cities in general, to increase quality-of-life and well-being; (ii) the fact that, in particular, greenspace planning is part of the urban and tourism short-term strategy of Porto, one of the municipalities with higher crime rates in the country; (iii) the connections the literature has established between proximity to greenspaces and senses of (in)security; (iv) the fact that only very recently has spatial research on micro-scale crime patterns been conducted for Porto [20,36]; and finally, (v) as far as the authors are aware, no study of Porto has spatially correlated street crime patterns over time with distance to greenspaces.
Therefore, the main objective of this study was to produce an original exploratory geographical diagnosis for the city of Porto of the distribution of street crime patterns in relation to land use, namely, the presence of greenspace. Using crime data for a ten-year period, at the street segment level, and quantitative methods with the support of spatial and network analysis made by Geographical Information Systems, this study aimed to present an overview of these distributions and uncover initial connections between fluctuations of crime rates and proximity to greenery. Globally, this is relevant to further test, in another context, the postulate put forth in the literature, whilst also providing a spatially explicit methodology, something that is still not common in the literature or in local authorities’ diagnoses. Precisely, locally, this spatial knowledge of previously unmapped variables can be an instrument to support decision-making for public space and land use planning. This paper is organized as follows: Section 2 reviews the current literature on the relationship between crime patterns and green spaces. Section 3 describes the methodology and presents the case-study city of Porto. Section 4 shows the results, while Section 5 debates them. The Section 6 presents the conclusions of the research.

2. Crime Patterns and Greenspaces

Are greenspaces associated to the reduction of crime?, asked recently Venter et al. [39] in a paper considering ten-year crime data in South Africa. The answer by the authors was that total greenspace displayed an association with less violent and property crimes. This same inverse relationship—more greenspaces, less crime—has been presented in the literature worldwide for the last two decades [29,32,40,41,42,43,44,45]. It has been established across a range of crime categories, such as theft or assault, and for different kinds of greenery, such as urban parks or street tree cover.
Indeed, in a systematic review recently performed by Shepley et al. [46] of American papers published after 2000, the authors found that the literature established that the presence of parks and other greenspaces reduces urban crime, particularly of a violent nature. Half of the studies analysed on violent crimes, and two-thirds of the studies on gun violence, identified a negative relationship between these and the presence of greenery. Analysing 301 cities in the United States, Ogletree et al. [44] reached similar conclusions. After accounting for potential covariates of crime, such as socio-economic or environmental variables, census block groups with more greenspace displayed a lower risk of both property and violent crimes, and this inverse relationship was present in practically all cities studied.
Previously, Kuo and Sullivan [43] had concluded that residential areas in Chicago with high levels of vegetation had 52% fewer total crimes than locations with low levels. In Baltimore, Troy et al. [45] noted that increases of 10% in the tree canopy caused a 12% reduction in crime per square kilometre. In New Haven, Gilstad-Hayden et al. [41] arrived at concurring numbers; the same 10% increase resulted in a 15% reduction in violent crimes and a 14% reduction in crimes against property. Importantly, Troy et al. [45] argued that this relationship varied between public and private tree cover; the magnitude of the relationship was 40% greater for public than private lands. But even outside the US, similar trends can be observed. For example, in Indonesia, Sukartini et al. [32] recently analysed the country’s three largest metropolitan areas and concluded that a new greenspace could cause a general crime reduction of 13% and a reduction of robberies of 16%. The results are reversed for urban wards that witness diminishing green space area, with crime increasing up to 11%.
The creation of new urban greenspaces, through the cleaning and greening of vacant lots, also displayed negative associations with property and violent crimes [29], as well as reduced narcotics possession arrests, gun violence [47,48], and aggressive behaviour [40,49]. Both Escobedo et al. [50] in Colombia, and Sanciangco et al. [51] in the US, encountered negative associations between greenspaces and the homicide rate, whilst Kondo, Han, et al. [52] found that residents living near greened lots felt safer compared to residents living near lots left vacant.
These conclusions are in line with several postulates. Crime Prevention Through Environmental Design (CPTED) [6,8] stipulates, as previously stated, that if the characteristics of a given place, in terms of design/morphology, use and management, make crime more difficult, risky, and less rewarding, then it will be less likely committed. Stemming from this, the Broken Windows theory [53] suggests that lack of maintenance and abandonment of urban spaces leads to the perception that they are unguarded and anti-social behaviour is permitted. And in the particular case of greenspaces, the Attention Restoration Theory [54] can also be cited, whereby the ability to concentrate may be restored by exposure to natural environments. This means that the presence of nature can lead to increased self-control, and therefore to the inhibition or suppression of undesirable thoughts, feelings, and behaviours that can constitute criminal behaviour [39].
Consequently, the presence of greenspaces may prevent criminal occurrences by a set of overlapping motives. The more trees are in a given neighbourhood, and the closer they are to residential buildings, the more time people spend outdoors [55]. Indeed, if greenspaces are well-designed and appealing, they attract movement and outdoor recreational activities, encouraging positive interactions and sociability [44,45,46], as well as healthy habits, both mental and physical, of individuals and communities [56,57]. Well-maintained greenery, trimmed bushes, proper lighting, and adequate park furniture [58] not only signal that the space is cared for—and incite users and residents to continue to do so [43]—but they increase the presence of “eyes on the street” and sightlines, one of Jane Jacobs’ [59] postulates that inspired the CPTED principle of natural surveillance.
There is, however, the opposite consequence, if these elements are not in place and because greenspaces can have distinct morphological characteristics [42]. Gilstad-Hayden et al. [41] recalled that the traditional perspective of security organizations has always been that dense vegetation encourages criminal activity by obstructing surveillance and providing concealment. In that sense, studies have noticed that the above-discussed inverse relationship between crime and green areas may not occur when vegetation is dense and low, because it creates concealment areas [44]; when visibility is limited, for example, when trees obstruct views from windows [45]; when parks are ill-maintained and designed, for example, without proper lighting or facilities [42]; or when the area increases [32]. Kim and Hipp [60] found higher crime levels in street segments around parks, and Kimpton et al. [42] and Taylor et al. [61] observed that the sociodemographic context of the surrounding neighbourhoods could influence crime patterns in green areas. Because they may be larger public areas attracting a vast amount of people, informal social control and natural surveillance do not occur homogenously throughout the space [39]. Furthermore, in locations where vegetation tends to be more unmanaged, for example, in the interface of residential and industrial areas, the concealment value of the vegetation can outweigh its deterrent effect [45]. Such areas can be used for illicit activities like trafficking of substances or stolen items, rape, target selection, or the disposal of unwanted goods [40].
Even though the traditional view that vegetation is associated with fear of crime has been progressively counteracted [43], such conditions can still hinder the legitimate use of space [30,44]. In fact, the satisfaction and the added value to well-being one gets from a greenspace directly decreases with fear of crime [30]. At the same time that people prefer places with greater sightlines, they also favour places of refuge—Appleton’s [62] Prospect-Refuge Theory—even though this may cause additional insecurity perceptions. Areas with a higher potential for refuge, fewer sightlines and providing fewer opportunities for escape generally create higher fear of crime, even if real crime rates may not be similar [30]. Therefore, urban green structures should be designed to increase the perception of safety [40] and reduce crime opportunities [63].
Overall, studies on the relationship between crime and greenspaces have used less spatially supported analyses at the micro-level and more statistical correlations and regression models at the census block level [41,44,45]. The scale of analysis is an issue [44], and in many countries, for example Portugal, crime data availability at the micro-level is scarce [20]. The definition of urban greenspaces—which may range from street trees to large metropolitan parks—as well as the existence of distinct types of crime and the fact that crime patterns may also be related to socio-economic factors, can cause the measurement of a direct relationship between crime and greenspaces to be elusive [44]. Finally, the authors urge for more work involving qualitative data, such as surveys and interviews [46].

3. Methodology

3.1. Study Area Overview

Porto is the centre of the second largest metropolitan region in Portugal, after Lisbon, and the third most populous city in the country, with 231,800 inhabitants in the most recent population census [64]. This represents a loss of over 5 thousand inhabitants from the last population census (2011), even though surrounding municipalities such as Valongo (+1%) and Vila Nova de Gaia (+0.6%) have shown increases. Half of Porto’s population is active (25 to 64 years of age; 52%), but over one-fourth (26%) is over 65 years old, an increase from 23% in 2011. Despite the population loss and ageing, Porto has continuously grown in terms of business and tourism, as well as in the real estate and short-term residencies’ market. House prices and rent values per square meter have steadily increased, and so has foreign direct investment in real estate activities and construction [65]. Figure 1 displays Porto’s location within Portugal, as well as showing the city’s main structure, to help the international reader follow the subsequent analysis. Both crime and green space-related information for the entire study area is presented at the beginning of Section 4.

3.2. Data Preparation

To compare street crime patterns with the urban greenspace distribution in Porto, two major datasets were used. The first concerns recorded crimes. Official information for the research period between 2009 and 2018, previously mostly unavailable for research, was supplied in Excel sheets by the Public Safety Police (PSP). Each individual reported crime was classified in terms of location (street name and parish), date/hour, and type, amounting to a total of almost 150 thousand entries. Although there are many crimes that go unreported, it is expected that this database constitutes a very good representation. The database required normalization, performed by the research team, especially in terms of standardizing the street names. Then, the individual entries were digitized as points, considering the centroid coordinates of the corresponding street segment, using the software ArcGIS and the official street information supplied by the Porto Municipality. In many analyses presented, the information was considered by street segment rather than point.
If the full crime database has been described and analysed elsewhere [20,36], here, in order to make a comparison with the spatial presence of greenspaces, only the so-called “street crimes” are considered. These include all crimes occurring in the street or other public areas to which all citizens have free access. In Portugal, Neves [63] points out that street crimes represent more than half of all reported crimes, and that they have a high social and media impact, due to the insecure feelings that they cause. The author presents a classification of street crimes [63] (p. 102) based on 13 subcategories of the Portuguese legislation. Therefore, from the 167 sub-typologies of crime present in the Porto database treated by the research team, the following thirteen were selected for the present work: (1) robbery/pickpocketing; (2) theft of motor vehicles; (3) theft in motor vehicles; (4) wallet theft; (5) theft in a supermarket; (6) theft in the street; (7) bank robbery or of another financial establishment; (8) treasury or post office robbery; (9) service station robbery; (10) robbery in public transports; (11) damage to cultural property; (12) fire or arson in buildings, constructions, or means of transport; and (13) other damage.
The second dataset relates to the location of greenspaces in the city of Porto. The first collection of the polygon areas defining each greenspace was made using the database of the Open Street Maps, but the research team subsequently validated this information, manually drawing in ArcGIS corrections to the boundaries or adding the remaining greenspaces of the city not contained in the OSM. The official database of greenspaces of Porto Municipality was used for cross-reference. The selection method for this research consisted of considering all gardens, parks, so-called granges, and other spaces in the city with extensive green elements that were of public use, regardless if they had, or not, opening hours. For example, the famous 18-hectare park of Serralves, which houses Porto’s Contemporary Art Museum, was not considered, because it opens to the public free of charge only once a month. Other elements of the green structure of the city—such as grassed corridors or trees along streets—were not considered, because they do not constitute spaces for leisure or where users stay for longer periods. Therefore, a total of 50 public greenspaces were mapped (presented in Figure 2). In the analysis, these spaces were divided into “Gardens” and “Parks” based on variables such as dimension, amount, and type of vegetation, but also historical fragmentation. Gardens are generally smaller than parks, and the type of vegetation is also distinguishable. There are, however, cases where spaces considered as parks are smaller than gardens. One of these examples is the case of Passeio das Virtudes, considered a park although the area is relatively small, because it has a historical and planning continuity with the adjacent park with the same name.

3.3. Analysis Methods

A total of 54,176 street crimes were selected in the database (37% of all crimes) and have been analysed at the street segment level. Lower-scale information has not been used due to data protection issues. Even so, previously, authors have established good performances on street-based modes, as opposed, for example, to grid-based [66,67,68]. The interpolation method used to estimate crime density was Kernel Density Estimation (KDE), often used in crime representation and research because of the visible readability of the results and also because individual data are not displayed [69,70]. Following previous research in the city of Porto [20,36], the cell size used was 50 m. Like in other international studies [71], emerging hot-spot analysis in ArcGIS was also applied to analyse changes in patterns. This tool identifies trends in the clustering of densities of values for a defined space-time, in this case, the density of street crimes over the ten-year period, considering cubes of 1 year. For each of these bins, the Getis-Ord Gi statistic was used to identify trends in the clustering of values.
The spatial comparison of the density of different types of crime was made considering a fishnet of the same 50 m cell size for the entire city area. A total of 15,902 cells of 50 × 50 m covers the study area. To understand the spatial co-existence and correlations, a non-parametric statistical method—the Spearman correlation—was applied.
Distance to the greenspaces of the two types (gardens and parks) was performed with the aid of the Network Analyst tool present in ArcGIS. The street segments, supplied by the Municipality, were modelled considering average pedestrian walking speeds of 5 km/h, and considering barriers to pedestrian circulation such as highways. Origins were considered to be the entrances to the parks or gardens, recognized by their gates or entryways, or, in the case of open greenspaces (such as squares), as the adjacent network nodes. Following Stoia et al. [72], service areas of 5, 10, and 15 min on foot were created, covering over 95% of the city’s area.
The distance results made it possible to calculate both the resident population, as well as the number of crimes of the different types, within each distance band from the greenspaces. However, because population data are only available at the statistical sub-section level (more or less a city block; the smallest statistical unit for which census data is available in Portugal), and because crime data are only available at the street segment level, an areal-weighting method was used to estimate the values inside each distance band. This means that the number of inhabitants within each sub-section, and the number of crimes within each segment, were considered to have a homogeneous distribution, and so calculations were based on proportions. In order to keep the raster format, only when comparing the presence of crime hot spots with average distances to greenspaces was Euclidean rather than network distance used. The relationships between population, accessibility, and greenspace area in the different distance bands were observed, using the 50 spaces as a unit of analysis, through Pearson correlations.

4. Results

4.1. Distribution and Accessibility of Greenspaces

According to the official website of Porto’s municipality, Porto has 455 hectares of public access greenspaces, including over 65,000 public trees, amounting to around 22 m2 per inhabitant. Short-term planning strategies of the municipality reveal that 160 additional hectares of green areas will be developed throughout the city, either by the expansion of existing parks or the creation of new ones. This stems not only from its Municipal Strategy of Climate Change Adaptation, dated 2016, but also from the above cited association with EU’s The Green City Accord. The city aims to create green corridors and proximity gardens, allowing for greater access without the use of motorized transports, be it in residential or working areas, as well as to improve the city’s environmental adaptation and response capacity to climate change.
For this research, as mentioned above, 50 public greenspaces were considered, as presented in Figure 2 and Table 1. These range from the largest green lungs of the city, such as the City Park to the west, the Oriental Park to the east, Porto’s Botanical Gardens and the Crystal Palace Gardens, to large greened squares such as the Boavista Roundabout and the Marquês Square.
These 50 free-access public green spaces occupy an entire area of around 187 hectares (40% of the city’s official green area), ranging from 0.09 hectares (Gardens of Gondarém Beach) to 68 hectares (the main City Park) (see Table 1).
As previously stated, greenspaces were divided into two typologies, gardens and parks. The gardens, practically forming a ring around the city centre and then concentrated on the seaside front in the western part of the city, are in the majority (n = 38), although only covering less than one-third of the greenspace. They have an average area of 1.41 hectares and constitute proximity leisure spaces. The parks are fewer (n = 12) but considerably larger (the average is 11.13 ha), covering over 71% of the city’s green area considered, and are located primarily on the outer rim of the city.
These greenspaces are, actually, near the majority of Porto’s population. Indeed, 92% of inhabitants of the city (213,877) can reach the closest greenspace in 15 min walking or less (see Figure 3 and Table 2), with 36% (84,117 inhabitants) reaching it in under 5 min walking, and another 35% in between 5 and 10 min. As was to be expected, walking accessibility is better for gardens (in more central areas) than it is for parks (in more peripheral areas). For gardens, 60% of the population can reach them in under 10 min walking, whilst for parks, this number is just 29%. As well, 37% of the population (over 86 thousand inhabitants) need over 15 min walking to reach a park, which may mean that they require other modes of transport to be able to access them. Only 19% of the city’s population can reach both a garden and a park in under 10 min walking, with almost half requiring more than 15 min walking.

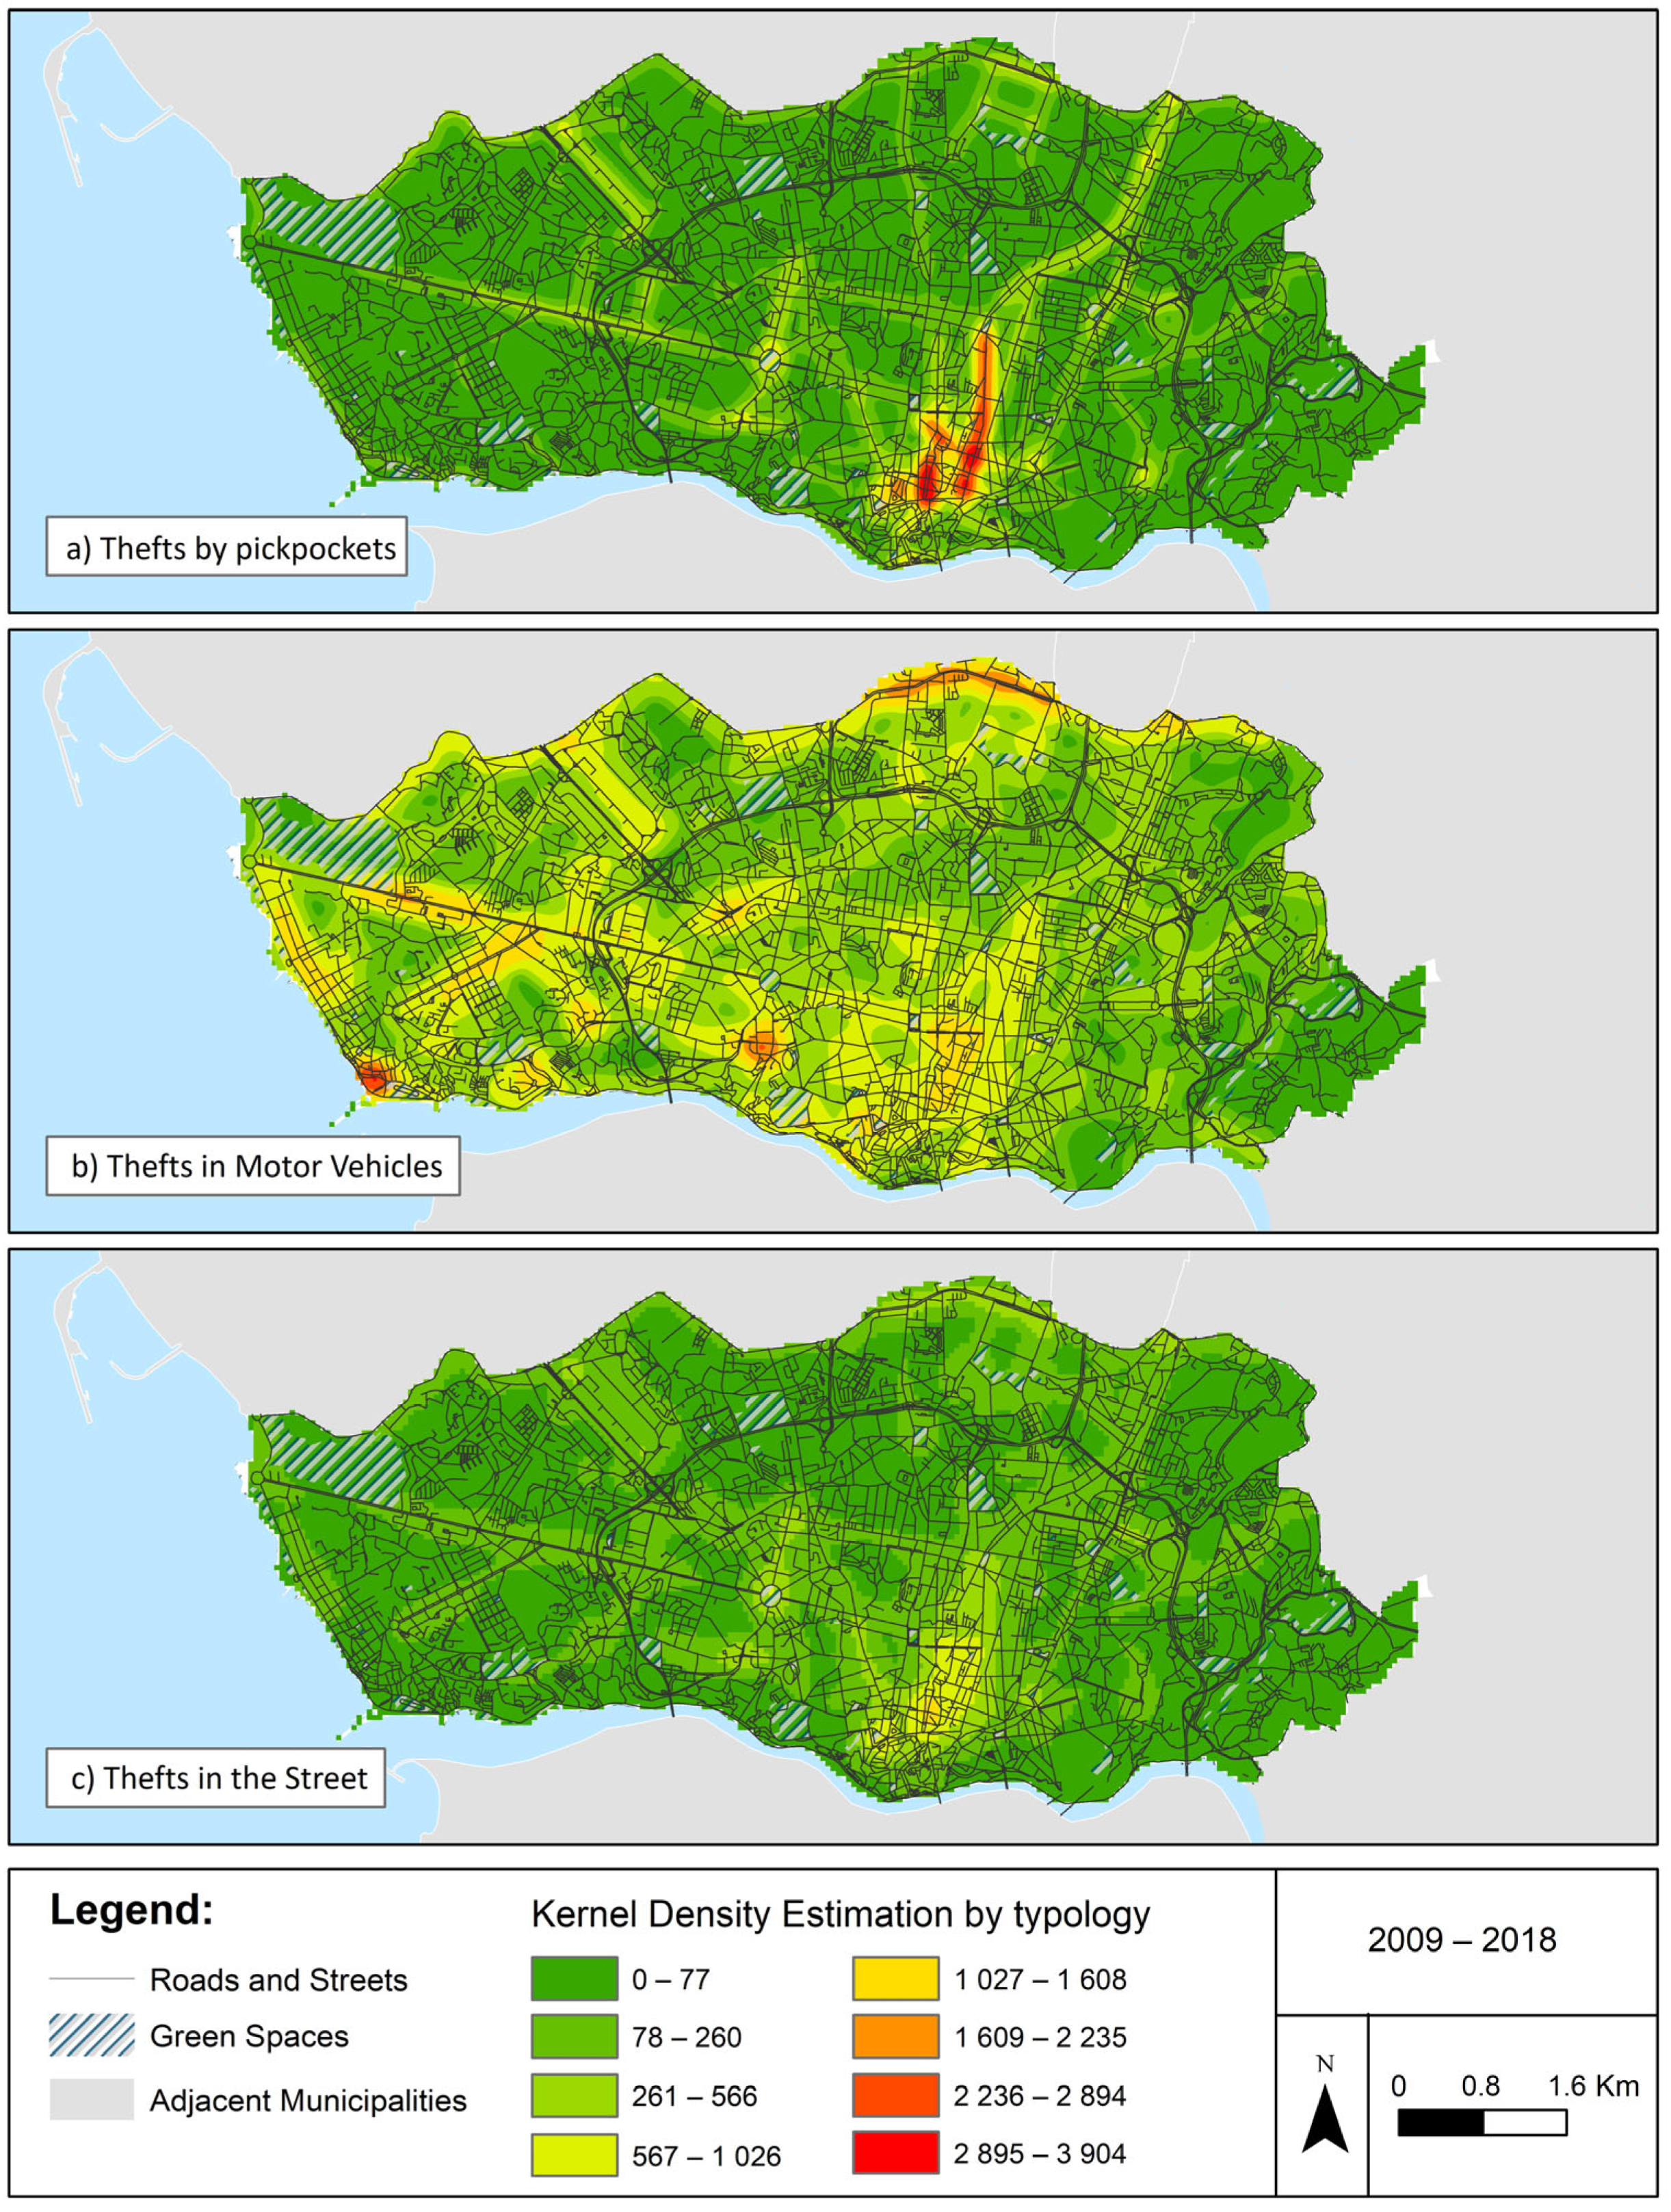
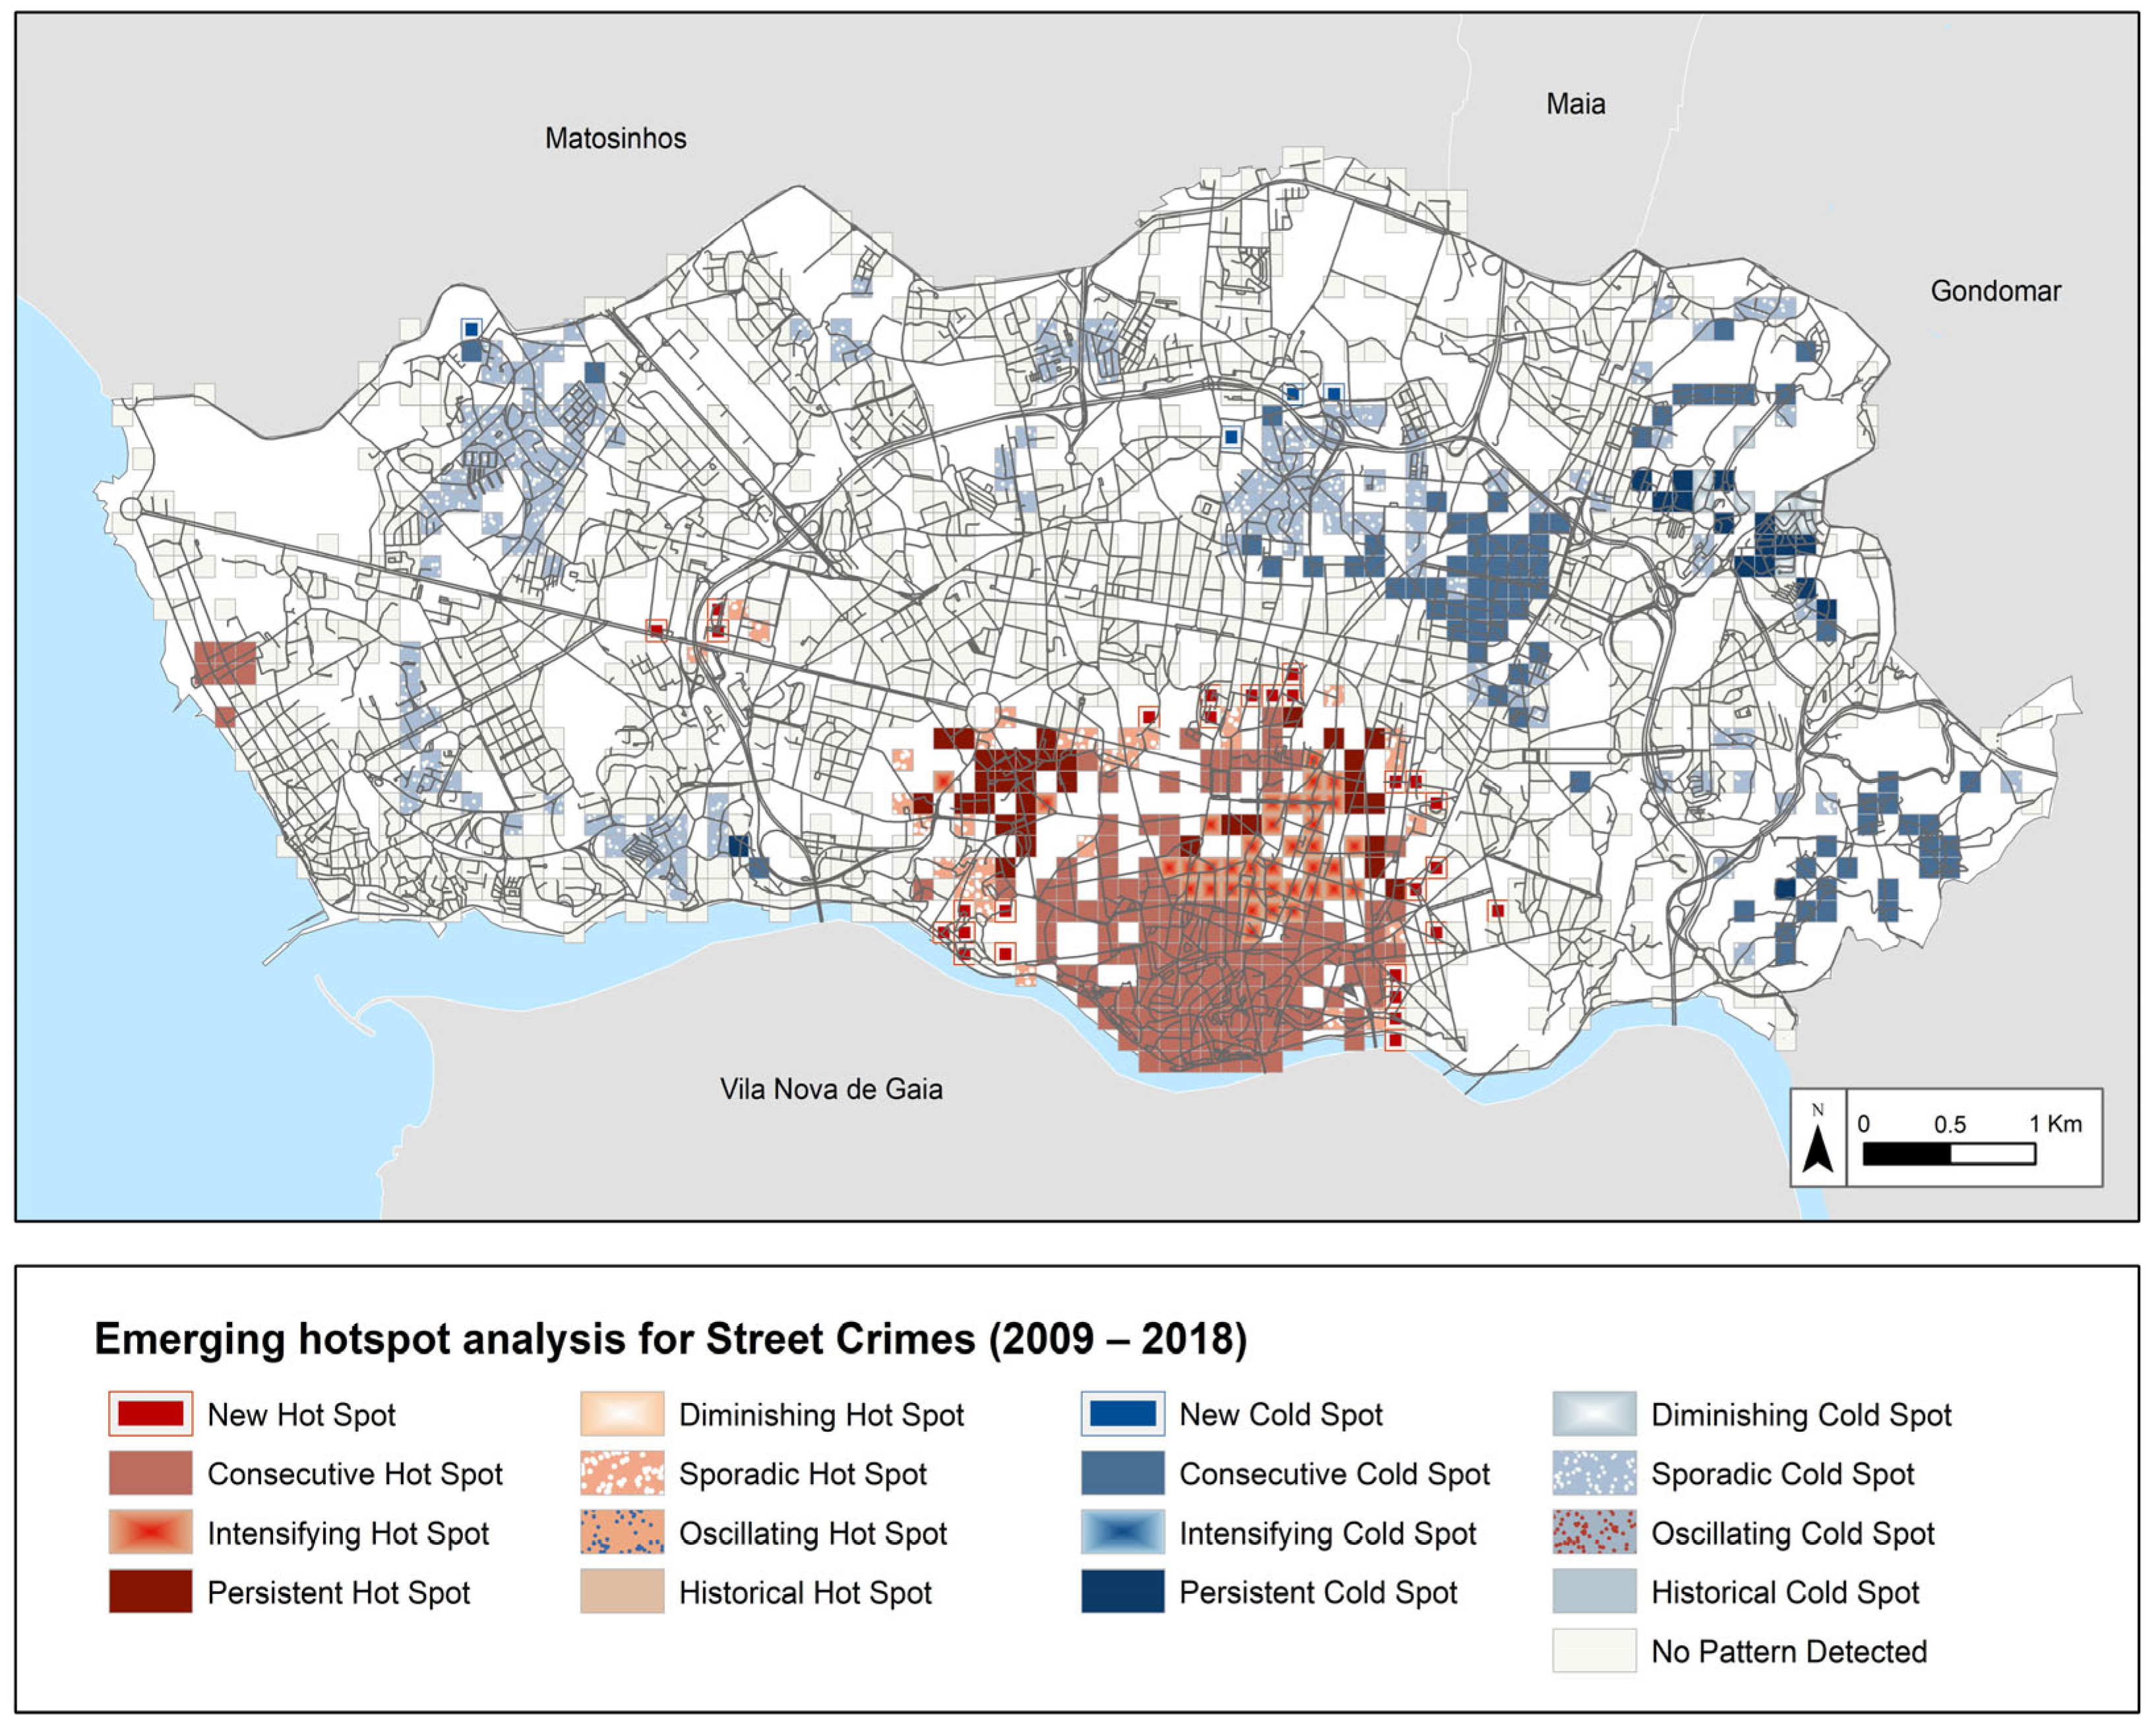
4.2. Street Crime Patterns

According to the data analysed, the street crimes in the city have increased (+35%) in the ten-year period, whilst the total number of reported crimes in the city has slightly decreased in the same timespan (−7%). This means that the percentage of street crimes among the total number of crimes reported has increased from 28% in 2009 to 41% in 2018.
The spatial distribution of these crimes can be observed in Figure 4. The most prominent concentration occurs in the downtown area (area 8, Figure 1), particularly around the Town Hall main square (Aliados Avenue) and the main pedestrian shopping street of the city (Santa Catarina Street). However, with few exceptions, in this location, street crimes only account for half or less of the total crimes therein.
The locations where street crimes have a higher weight in relation to the total number of crimes appear to the west of the city centre, resulting in secondary concentrations. These include the areas around Boavista and Marechal Gomes da Costa Avenues (area 4, Figure 1), Campo Alegre street (area 5, Figure 1), as well as the seaside promenades (areas 1, 2, and 10, Figure 1). The place where the Atlantic Ocean meets River Douro is another high-density location. Elsewhere, in the north part of the city, is also visible a concentration of street crimes near the main hospital and one of the major university poles (area 6, Figure 1).
As expected, spatial patterns are distinct when considering the different types of crime. Figure 5 shows three examples of the thirteen crime categories under study. Pickpocketing is extremely concentrated in the downtown area, as are other street thefts like wallet thefts and supermarket thefts and, to a lesser extent, thefts in the street (also displayed); whilst thefts in motorized vehicles are more prominent in various points in the western, more affluent side of the city. Thefts of vehicles are, on the contrary, more common to the east, and robberies in service stations are mostly seen in the outer rim.
Considering yearly data (Figure 6), it is evidently clear that the historical centre (areas 8, 9, and 10, Figure 1) is the location where street crimes mostly concentrate over time. Near the City Hall, there is a concentration of Intensifying Hot Spots, i.e., of locations considered statistically significant hot spots for 90% of the time-step intervals, and where the intensity of clustering of high counts in each time step is increasing overall. To the south, there is a large section of Consecutive Hot Spots, i.e., locations with a single uninterrupted run of at least two statistically significant hot spot bins in the final time-step intervals. This pattern is also seen in the extreme west of the city (area 1, Figure 1), on the seaside promenade. To the west of the city centre, in Boavista (area 4, Figure 1), Persistent Hot Spots are noticeable. These relate to locations that have been statistically significant hot spots for 90% of the time-step intervals with no discernible trend in the intensity of clustering over time. Around the city centre, and at the western edge of area 4, as identified in Figure 1, New Hot Spots are detected. These are locations that are statistically significant hot spots for the final time step, but had never been statistically significant hot spots before. Finally, consecutive and persistent cold spots are mostly found in the east of the city.

4.3. Spatial Co-Existence of Street Crimes

Considering the 50 m × 50 m division of the study area, 15,902 overall cells were used in the calculations. Initially, Spearman correlation (considering non-linearity and non-normality) was considered to estimate the correlations between the total and the thirteen different types of crime amongst themselves (Table 3). Almost all relationships are statistically significant, but it should be noted that the N is very high. However, there are high (above 0.7) Spearman’s rho (ρ), particularly between the total of street crimes and the thefts in motor vehicles (0.911), wallet thefts (0.846), thefts in the street (0.842), and robbery/pickpocketing (0.811). It also occurs in these categories between themselves, particularly between robbery/pickpocketing and thefts in the street (0.879). The association with the concentrations in the downtown area seems evident, as some of the examples in Figure 5 show. Other associations are seen, for example, between robbery/pickpocketing and thefts in a supermarket (0.633) and between bank/treasury and post office robberies (0.521), services that may tend to be located in similar areas of the city, and between robbery in public transports with pickpocketing and thefts in the street.
On the contrary, non-significant relationships are seen between treasury or post office robberies and wallet thefts, bank and service station robberies, and bank robberies with damage to cultural property, seeming to indicate their occurrences in distinct areas of the city. Precisely, damage to cultural property has a negative relationship with post office or service station robberies, as does service station robberies with the thefts in motor vehicles.

4.4. Street Crimes in Relation to Distance to Greenspaces

As previously displayed in Table 2, almost half of the total street crimes (45.7%) are actually within a 5 min walking distance of a Porto greenspace. Crimes diminish with the 5 min distance bands, with 28.4% up to 10 min, and 9.5% up to 15 min, meaning that 83.7% are within 15 min. On the contrary, the population is about the same in the first two intervals (36%), diminishing to 21% in the 10–15 min interval. This means that the ratio of street crimes per inhabitant diminishes from 0.29 in the first 5 min to 0.1 in the 10–15 min interval. The ratio significantly augments to 0.49 in over 15 min from any greenspace, because the population is less (8%), but still making up 16% of the total crimes.
There are, however, evident differences when considering not only the subdivision of greenspaces between gardens and parks, but also the distinct categories of street crime. Only 8.7% of street crimes are within a 5 min walking distance of a park, whereas the same number for gardens is 41.2%. And, whilst, as for the total greenspace, the amount of street crimes diminishes with the distance to gardens until 15 min walking, for parks, it actually increases from 8.7% to 26.6% in the 10–15 min interval. However, there are much fewer inhabitants living right next to parks (only 8%) than to gardens (30%). The percentage of inhabitants increases with the distance to parks, leading to a consistent ratio of around 0.25 crimes per inhabitant in the various distance bands, while it decreases with the distance to gardens. Indeed, as Table 3 shows, distances to parks and gardens have a small correlation between themselves, showing that they exist in distinct areas of the city, and that may justify their different associations with the occurrence of different types of crimes. Gardens exist in and around the city’s core, and then along the shore, whilst parks exist mainly along or outside the city’s ring road. The physical characteristics that differentiate greenspaces could also justify these differences, whether by the average size, density, and maintenance of vegetation, for example, as well as the frequency of visits, the local socio-economic context, and surveillance. Consequently, the total street crime density displays a negative association (−0.258) with the distance to gardens, meaning that the further from the Garden, the lower may be the crime density.
Figure 7 and Figure 8 present how the total amount of registered crimes are distributed by categories and by walking distance, considering the respective subdivisions. As Figure 7 shows, street crimes diminish as the distance increases to gardens: 26.5% are within 5–10 min, and 11% are within 10–15 min. This inverse relationship to gardens occurs for practically all crime types, with higher negative correlation values (Table 3) for damage to cultural property, thefts in supermarkets, and thefts in motor vehicles. Indeed, an astounding 79.1% (Figure 7) of damages to cultural property occur within 5 min walking from a garden (against just 6.3% from a park). Over half of wallet thefts and over 40% of robbery/pickpocketing, thefts in motor vehicles, thefts in a supermarket, and thefts in the street also occur within 5 min walking from a garden. Such concentrations of street crimes occur in different parts of the city. Thefts in supermarkets, wallet thefts, and pickpocketing occur mostly around the gardens of the downtown area; thefts in motor vehicles have a peak around Jardim do Passeio Alegre, in the promenade where the ocean meets the river; and damage to cultural property peaks around the Crystal Palace Gardens (5, Figure 2). On the contrary, service station robberies (23%) and treasury or post office robberies (14%) occur less in close proximity to gardens. Almost 50% of service station robberies, almost 30% of treasury or post office robberies, and over 35% of bank robberies are over 15 min walking from a garden.
On the contrary, for parks, a positive coefficient is observed in practically all categories (Table 3). This can mean, overall, that the shorter the distance to parks, the lower the crime density. There is no category that has over 10% of crimes within a 5 min walking distance from a park (Figure 7). The correlation values are higher for supermarket thefts, bank robberies, pickpocketing, service station robberies, robberies in public transports, and other damage; and indeed, these are the categories in which a very large percentage of crimes occur in over a 15 min walking distance from a park. Namely, almost 70% of service station robberies, almost 65% of bank robberies, and between 40 and 45% of robberies in public transports, other damage, robbery/pickpocketing, and thefts in motor vehicles. It is also noteworthy that almost 65% of damage to cultural property and 55% of treasury or post office robberies occur between 10 and 15 min walking distance from an urban park. These concentrations are mostly associated with the Campo Alegre neighbourhood (area 5, Figure 1), the downtown area (areas 8–10), near FC Porto’s stadium (area 12), and the industrial area (area 3).
In Figure 8, it is possible to understand the distribution of crime categories by each of the service area intervals around greenspaces. Actually, overall, there is a tendency to follow the city’s distribution pattern. In each of the time intervals to a greenspace (0–5, 5–10, 10–15, and over 15 min), there is a relatively even distribution, with thefts in motor vehicles always representing over half of registered street crimes (50–55%), thefts in the street around 10%, robbery/pickpocketing around 5%, other damage between 4 and 6%, thefts in a supermarket around 2%, robberies in public transports and fire and arson around 0.5%, and bank robberies, treasury or post office robberies, service station robberies, and damage to cultural property with the residual weight, always below 0.2%. Noticeable differences only occur in the two remaining categories, theft of motor vehicles (representing 11.4% of total street crimes) and wallet theft (14.3%). There is a trade-off between these two typologies, with wallet theft having higher percentages in under 10 min of walking proximity to a greenspace (15–17% against 10–12%), but theft of motor vehicles having a higher weight in the interval 10–15 min (19% against 5%).
When looking at the differences between parks and gardens, similar conclusions are drawn, with only a few differences. Theft in motor vehicles has a higher weight (58%) in 0–5 min walking distance from a park, and a higher weight (59%) in 5–10 min walking distance from a garden. The trade-off between wallet theft and theft of motor vehicles occurs because the first are clearly closer to gardens (18% in the 0–5 interval) than the second (18% in the 10–15 interval). Wallet theft also accounts for 22% of crimes in the 5–10 min interval from a park.
Considering the association of the emerging hot spot patterns (Figure 6) with the average distance to greenspaces, gardens seem to be undeniably closer to hot spots than parks, displaying on average values under 300 m. Parks are on average 1 kilometre further from intensifying or persistent hot spots. On the contrary, cold spots are generally closer to parks, although the differences are not so great. In particular, consecutive and new hot spots are located on average under 600 m from parks.
Finally, considering each greenspace as a unit of analysis (n = 50), an association was computed between the various variables used in the study: area and type of greenspace, population and street crimes in the different distance bands. Table 4 summarizes the most significant statistical results. Area of greenspace is not seen as statistically significant in relation to street crimes in the various bands, even though the sign of the coefficient is negative except for crimes over 15 min walking. Both for the total amount of greenspace and gardens, street crimes in the 10–15 min range are positively correlated with the population between 5 and 15 min, but negatively correlated with the population over 15 min. That association is not seen for the larger parks.

5. Discussion

The geography of crime is not random. Environmental criminology research has sufficiently proved it, and this research confirms it for the particular case of the city of Porto, in Portugal. Therefore, as LeBeau and Leitner [4] had written, Geography is shown as a discipline able to make important and long-lasting contributions to crime prevention.
This role has become even more prevalent in the last two decades, when the spatial analysis and modelling capacity of Geographical Information Systems allowed for a clearer understanding of spatial patterns and spatial determinants. For that, two things are crucial. The first is that there is sufficient confidence between institutions to share data and know-how. The 10-year dataset of street crime data, at the segment level, was supplied through a protocol with the Porto Municipal Police and extensively treated and curated by the project team, in order to produce the original cartography presented and to support the analysis of patterns. The spatial understanding provided by geo-information and spatial analysis can be the common ground, or at least an important first step, for discussing how these two spheres (security organizations and academia) and various disciplines (such as police, planning, geography, and sociology) can work together in determining the way the territory is planned, designed, and ultimately secured. Further discussions on the patterns of crime, or its association with other variables related to land use, function, and socio-economic and morphological patterns, cannot be made if this crucial first step, access to crime data and the capacity to spatially map and interpret it, cannot be made.
In this paper, that initial step is made and presented, supporting future studies by establishing the locations of street crime, crime hot spots, and variations over time; the results confirming the postulates of the Law of Crime Concentration [22]. The historical city centre is the most concentrated hot spot over time, and there are geographical variations in crime density between locations, but also between distinct types of crime. Then, an exploratory analysis was made in order to understand how different categories of street crime are spatially distributed in the city, using as a point of departure the distance to existing greenspaces, divided into two categories. This is considered a pertinent research question because the city of Porto aims to add to its recent popularity as a touristic and liveable destination for foreigners, the epithet of a “green city”. For that, the municipality has pledged to double the amount of green and biodiverse space in the upcoming years, and this can be one contributing solution to tackle various issues. Previously, Lewis et al. [38] suggested that, for Porto, attractive landscapes could draw visitors away from the city centre, thus reducing its pressure. Furthermore, international research has extensively pointed to the positive impacts of greenspaces on human health, quality of life, and sociability [29,30,31], as well as on crime patterns at micro-scales [33,34]. Many authors agree that there is an inverse relationship between greenspaces and crime [29,32,40,41,42,43,44,45], even though the sign of this correlation can be variable with the intrinsic characteristics of each space and type of crime. Recent studies have used, for example, the NDVI (Normalized Difference Vegetation Index), based on satellite imagery, as a proxy for greenspaces, and in this case, inverse connections have been established with overall crime [73], more violent and property crimes [44], and non-violent crimes [74], but such conceptualization is still simplified as to what properly constitutes a greenspace that can be experienced [44].
In this research, a choice was made not to look at the entire spectrum of green infrastructure but to start exploring the relationship of crimes to the larger greenspaces of free access in the city. In this initial spatial analysis, the tendency towards an inverse relationship is maintained, even though it is not clearly straightforward, precisely because it depends on the type of crime and on the type of greenspace. This study has divided street crimes into thirteen typologies, according to Neves [63], and greenspaces into two types, the gardens, often smaller and around denser areas or closer to the city centre, and the parks, generally of larger size and in peripheral areas of the city. Their distinct geographical distributions cause different relationships to crime patterns, themselves different according to typologies, as the literature has established [5], supporting the notion, to some extent, that urban conditions influence how criminality is spread throughout the city.
Almost half of the city’s street crimes (46%) are within a 5 min walking distance from a greenspace. However, there is a clear distinction between the gardens (41% of crimes within the same distance band) and the parks (only 9%). Thus, overall, considering also the association with the emerging hot spot analysis, it can be said that a higher crime density and crime hot spots appear closer to urban gardens, diminishing with distance; and a lower crime density and crime cold spots appear closer to parks, increasing with distance. Actually, no crime category has over 10% of its occurrences within a 5 min walking distance from a park, with the greatest percentages occurring in the over 10 or 15-min distance band.
Roughly, it could then be stated that the larger the green area, the lesser the surrounding crime rates, but this generalisation must be approached cautiously, precisely because of their distinct locations in the city and because the influence was considered as a group, not individually. For example, cultural property damage is greatly associated with gardens, with over 80% of this type of crime occurring within the 5 min walking distance band. But this typology has the highest peak around a particular garden (Crystal Palace Garden), a location where other activities and services exist, such as the art galleries and the independent shopping district, whilst the Crystal Palace itself includes an arena for concerts and events.
This crime typology, damage to cultural property, is also negatively correlated, for example, with post office or service station robberies, suggesting that they occur in distinct areas of the city. Gardens, closer to the city centre and to the population (60% within 10 min walking), have a specific association not only to the greater overall hot spots of criminality—that occurs precisely in the city centre—but also to crime types particular to that location, as theft in a supermarket. In turn, these are located further away from the parks, which tend to occupy larger areas in the outer rim of the city. Crimes like wallet theft, pickpocketing, and theft in motor vehicles highly correlate, but they also concentrate in the centre, and others like bank, post office, and service station robberies happen elsewhere.
Location and the physical characteristics of greenspaces (such as size) and population density (particularly in the 10 min range) may indeed contribute to these distinctions, but this research also uncovered another pattern that both follows the literature (crime patterns stable over time) and contradicts it (criminality distributed differently throughout the city). Regardless of the distance band to greenspaces, and often their size, the proportion of crime categories, between themselves, has stayed consistently even, with theft in motor vehicles (50–55%); theft in the street (10%), theft of motor vehicles, and wallet theft amounting to almost 80% of street crimes in all distance bands, and the last two trading off, as wallet theft has a closer affinity to greenspaces (particularly gardens).
It is recognized that this study is limited by the small number of variables used at this early stage, and the fact that greenspaces are only included as locations for distance analysis and not by their intrinsic characteristics, save area and overall type. The crime databases the research team had access to and treated spatially only included street segment information, so crimes occurring inside greenspaces were actually registered on the adjacent streets. Furthermore, at this stage, control variables have not been considered to account for the potential co-variates that certainly influence the density of criminal occurrences, be they socio-economic, morphological, or environmental. As Weisburd et al. [21] affirmed, spatial units are also relevant social systems, and their variability needs to be tackled at a micro-scale, as socio-urban contexts influence patterns observed in surrounding green areas [42,61], as do physical features and environmental quality [46]. And greenspaces themselves have different characteristics, so generalizations cannot be directly made [44], as confirmed by this initial analysis. Variables like income, education, housing, and diversity have been analysed by several authors [44,73,74,75] in relation to greenery, using, for example, OLS. This is the future step of this research, working in partnership with the Porto police.
The purpose of this first step was precisely that, to present an initial exploratory data analysis aimed at understanding overall patterns and guiding future, more focused, research. It should be noted that the spatial explicitness of this research is still not often seen in the literature, particularly in certain contexts (Portugal included), where a culture of crime mapping by local authorities is still wanting. These results show—to our knowledge—a never before published understanding of crime patterns in the city of Porto, pointing to their spatial and proportional stability, and to spatial distinctions of crime categories in relation to greenspaces that can advise future research and planning.
Even so, it must be noted that correlation does not mean causation (especially in the case of a large N, as in Table 3), and that additional variables should be included to understand if these initial findings are a consequence of greenspace itself or other phenomena. For example, larger greenspaces exist in the outer rim of the city, in areas often with a lower population density, sometimes more isolated, and containing other types of land use. By pinpointing these locations and defining external and internal effects, specific areas can be analysed, and effective measures of environmental criminology can be proposed. Yet another concern is related to whether improving one space does not simply lead to crime and incivilities’ displacement to another. This has been a concern since the initial formulation of environmental criminology theories in the 1970s and 1980s [8]. However, authors like Heal and Laycock [76] were already discussing that this relocation would inevitably bring about a reduction and allow for the confinement of occurrences in specific areas that could then also be managed accordingly. The concept of geographical juxtaposition [77] also has important implications for potential displacement, but this displacement can be “benign”. If environmental criminology principles are properly diffused, then the benefits appear to outweigh displacement effects [8]. Particularly for greenspaces, the recent study of Gong et al. [78] suggests that there was not an increase in crime in areas adjacent to greening interventions. On the contrary, greenspaces seem to have all around positive effects on the liveability of urban spaces.

6. Conclusions

The research carried out displays the importance of intelligence-led policing models, in which higher education institutions and public safety authorities collaborate and share know-how. In a country like Portugal, as in many smaller countries, crime mapping using digital technologies is still not widespread, and access to crime data (especially georeferenced data) is limited. More protocols and more research are needed and required. It is expected that such spatial knowledge will revert back to the proper planning and safety authorities to support decision-making for not only making urban spaces safer, but also for understanding the relationships between morphology/land use, behavioural and crime patterns. However, it should be acknowledged that these relationships are complex and depend on an array of domains and variables at various levels (from the macro to the micro), and therefore, must be tackled by multiple areas of expertise simultaneously. The challenge lies not only in properly collecting, curating, and mapping crime, morphological, and socio-economic data; it also lies in efficiently using (digital) tools to continue to monitor urban spaces and keep dialoguing with and informing the public authorities.
Thus, these results show the potential of Geographical Information Systems to understand patterns and support decision-making and how the Geography of Crime/Criminology of Places is a key discipline to create important territorial knowledge to inform lower-level analysis and place-based interventions, dealing with specific problems and types of crime. The literature suggests that greenery can be a relatively inexpensive solution to tackle feelings of (in)security, and also that more studies that contribute to understanding the causality between crime and greenery through data-gathering and analysis methods are required. So, as Porto’s municipality aims to expand existing parks and create new proximity gardens to allow greater access without motorized transport, understanding how the spatial relationship between crime and greenspaces currently stands is an important first step to properly plan and implement these spaces. This is paramount to empower decision-makers to achieve sustainable solutions for the future of urban spaces.

Author Contributions

Conceptualization, methodology, validation, formal analysis, investigation, data curation, writing—original draft preparation, writing—review and editing: Miguel Saraiva and Bárbara Teixeira; Supervision, project administration, and funding acquisition: Miguel Saraiva. All authors have read and agreed to the published version of the manuscript.

Funding

The crime data used in this research are derived from project CANVAS—Towards Safer and Attractive Cities: Crime and Violence Prevention through Smart Planning and Artistic Resistance, supported by the European Regional Development Funds, through the COMPETE 2020—Operational Programme ‘Competitiveness and Internationalization’, under Grant POCI–01-0145-FEDER-030748. This research also received partial support from the Centre of Studies in Geography and Spatial Planning (CEGOT), funded nationally through the Foundation for Science and Technology (FCT) under the reference UIDB/04084/2020, and the short-term programme Verão com Ciência.

Data Availability Statement

The crime data used in this research was supplied by the Public Safety Police and is confidential. Additional data was taken from open sources or collected by the research team as duly noted throughout the paper.

Acknowledgments

Besides our University, Research Centre and funding institutions, we would also like to acknowledge the master student Gonçalo Calheno, who collected and drew in ArcGIS the first version of the greenspaces used in this research.

Conflicts of Interest

The authors declare no conflict of interest.

References

  1. Bottoms, A.E.; Wiles, P. Environmental criminology. In Crime, Inequality and the State; Vogel, M., Ed.; Routledge: London, UK, 2007. [Google Scholar]
  2. Sidebottom, A.; Wortley, R. Environmental Criminology. In The Handbook of Criminological Theory; Piquero, A., Ed.; John Wiley & Sons: Chichester, UK, 2016; pp. 156–181. [Google Scholar]
  3. Weisburd, D.; Eck, J.; Braga, A.; Telep, C.W.; Cave, B. Place Matters: Criminology for the Twenty-First Century; Cambridge University Press: New York, NY, USA, 2016. [Google Scholar]
  4. LeBeau, J.L.; Leitner, M. Introduction: Progress in Research on the Geography of Crime. Prof. Geogr. 2011, 63, 161–173. [Google Scholar] [CrossRef]
  5. Wortley, R.; Townsley, M. Environmental Criminology and Crime Analysis; Routledge: New York, NY, USA, 2016. [Google Scholar]
  6. Jeffery, C.R. Crime Prevention through Environmental Design; Sage Publications: Beverly Hills, CA, USA, 1971. [Google Scholar]
  7. Newman, O. Defensible Space: Crime Prevention through Urban Design; Macmillan: New York, NY, USA, 1972. [Google Scholar]
  8. Cozens, P.M.; Love, T. A Review and Current Status of Crime Prevention through Environmental Design (CPTED). J. Plan. Lit. 2015, 30, 393–412. [Google Scholar] [CrossRef]
  9. Mihinjac, M.; Saville, G. Third-Generation Crime Prevention Through Environmental Design (CPTED). Soc. Sci. 2019, 8, 182. [Google Scholar] [CrossRef]
  10. Cohen, L.E.; Felson, M. Social Change and Crime Rate Trends: A Routine Activity Approach. Am. Sociol. Rev. 1979, 44, 588–608. [Google Scholar] [CrossRef]
  11. Clarke, R.V.; Cornish, D.B. Modeling Offenders’ Decisions: A Framework for Research and Policy. Crime Justice 1985, 6, 147–185. [Google Scholar] [CrossRef]
  12. Clarke, R.V. Situational crime prevention: Theory and practice. Brit. J. Criminol. 1980, 20, 136. [Google Scholar] [CrossRef]
  13. Clarke, R.V. Situational Crime Prevention: Successful Case Studies; Harrow & Heston: New York, NY, USA, 1992. [Google Scholar]
  14. Cornish, D.B.; Clarke, R.V. Opportunities, precipitators and criminal decisions: A reply to Wortley’s critique of situational crime prevention. Crime Prev. Stud. 2003, 16, 41–96. [Google Scholar]
  15. Brantingham, P.J.; Brantingham, P.L. Environmental Criminology; Sage Publications: Beverly Hills, CA, USA, 1981. [Google Scholar]
  16. Sherman, L.W.; Gartin, P.R.; Buerger, M.E. Hot spots of predatory crime: Routine activities and the criminology of place. Criminology 1989, 27, 27–56. [Google Scholar] [CrossRef]
  17. Harries, K. Rejoinder To Richard Peet: “The Geography Of Crime: A Political Critique”. Prof. Geogr. 1975, 27, 280–282. [Google Scholar] [CrossRef]
  18. Chainey, S.; Ratcliffe, J. GIS and Crime Mapping; John Wiley & Sons: Hoboken, NJ, USA, 2013. [Google Scholar]
  19. Leitner, M. Crime Modeling and Mapping Using Geospatial Technologies; Springer Science & Business Media: New York, NY, USA, 2013. [Google Scholar]
  20. Saraiva, M.; Sá Marques, T.; Ribeiro, D.; Amante, A. Multidimensionality in Geospatial Urban Crime Prevention Modelling and Decision Support: The Case of Porto, Portugal. In Urban Crime Prevention: Multi-Disciplinary Approaches; Saraiva, M., Ed.; Springer International Publishing: Cham, Switzerland, 2022; pp. 191–216. [Google Scholar]
  21. Weisburd, D.; Groff, E.R.; Yang, S.-M. The Criminology of Place: Street Segments and Our Understanding of the Crime Problem; Oxford University Press: Oxford, UK, 2012. [Google Scholar]
  22. Weisburd, D. The law of crime concentration and the criminology of place. Criminology 2015, 53, 133–157. [Google Scholar] [CrossRef]
  23. Hunt, P.; Kilmer, B.; Rubin, J. Development of a European Crime Report: Improving Safety and Justice with Existing Crime and Criminal Justice Data; RAND Europe: Cambridge, UK, 2011. [Google Scholar]
  24. Chiesura, A. The role of urban parks for the sustainable city. Landsc. Urban Plan. 2004, 68, 129–138. [Google Scholar] [CrossRef]
  25. Mendonça, R.; Roebeling, P.; Fidélis, T.; Saraiva, M. Policy Instruments to Encourage the Adoption of Nature-Based Solutions in Urban Landscapes. Resources 2021, 10, 81. [Google Scholar] [CrossRef]
  26. Aram, F.; Higueras García, E.; Solgi, E.; Mansournia, S. Urban green space cooling effect in cities. Heliyon 2019, 5, e01339. [Google Scholar] [CrossRef]
  27. Jeong, D.; Kim, M.; Song, K.; Lee, J. Planning a Green Infrastructure Network to Integrate Potential Evacuation Routes and the Urban Green Space in a Coastal City: The Case Study of Haeundae District, Busan, South Korea. Sci. Total Environ. 2021, 761, 143179. [Google Scholar] [CrossRef]
  28. Mukherjee, M.; Takara, K. Urban green space as a countermeasure to increasing urban risk and the UGS-3CC resilience framework. Int. J. Disaster Risk Reduct. 2018, 28, 854–861. [Google Scholar] [CrossRef]
  29. Kondo, M.C.; Fluehr, J.M.; McKeon, T.; Branas, C.C. Urban Green Space and Its Impact on Human Health. Int. J. Environ. Res. Public Health 2018, 15, 445. [Google Scholar] [CrossRef]
  30. Fleming, C.M.; Manning, M.; Ambrey, C.L. Crime, greenspace and life satisfaction: An evaluation of the New Zealand experience. Landsc. Urban Plan. 2016, 149, 1–10. [Google Scholar] [CrossRef]
  31. Pietilä, M.; Neuvonen, M.; Borodulin, K.; Korpela, K.; Sievänen, T.; Tyrväinen, L. Relationships between exposure to urban green spaces, physical activity and self-rated health. J. Outdoor Recreat. Tour. 2015, 10, 44–54. [Google Scholar] [CrossRef]
  32. Sukartini, N.M.; Auwalin, I.; Rumayya, R. The impact of urban green spaces on the probability of urban crime in Indonesia. Dev. Stud. Res. 2021, 8, 161–169. [Google Scholar] [CrossRef]
  33. Gearhart, M.C. Social cohesion, mutual efficacy and informal social control: Collective efficacy and community-based crime prevention. Int. J. Law Crime Justice 2022, 71, 100548. [Google Scholar] [CrossRef]
  34. Weisburd, D.; Davis, M.; Gill, C. Increasing Collective Efficacy and Social Capital at Crime Hot Spots: New Crime Control Tools for Police. Polic. J. Policy Pract. 2015, 9, 265–274. [Google Scholar] [CrossRef]
  35. Saraiva, M.; Amante, A.; Marques, T.S.; Ferreira, M.; Maia, C. Perfis territoriais de criminalidade em Portugal (2009–2019). Finisterra 2021, 56, 49–73. [Google Scholar] [CrossRef]
  36. Saraiva, M.; Matijošaitienė, I.; Mishra, S.; Amante, A. Crime Prediction and Monitoring in Porto, Portugal, Using Machine Learning, Spatial and Text Analytics. ISPRS Int. J. Geo-Inf. 2022, 11, 400. [Google Scholar] [CrossRef]
  37. Sousa, S.; Barcón, A.R. Narrative around tourism gentrification and urban shrinkage: A qualitative approach to the case of Porto. Finisterra 2021, 56, 115–136. [Google Scholar]
  38. Lewis, O.; Sousa, S.; Pinho, P. Multifunctional Green Infrastructure in Shrinking Cities: How Does Urban Shrinkage Affect Green Space Planning? Urban Plan. 2022, 7, 186–201. [Google Scholar] [CrossRef]
  39. Venter, Z.S.; Shackleton, C.; Faull, A.; Lancaster, L.; Breetzke, G.; Edelstein, I. Is green space associated with reduced crime? A national-scale study from the Global South. Sci. Total Environ. 2022, 825, 154005. [Google Scholar] [CrossRef]
  40. Garvin, E.C.; Cannuscio, C.C.; Branas, C.C. Greening vacant lots to reduce violent crime: A randomised controlled trial. Inj. Prev. 2013, 19, 198. [Google Scholar] [CrossRef]
  41. Gilstad-Hayden, K.; Wallace, L.R.; Carroll-Scott, A.; Meyer, S.R.; Barbo, S.; Murphy-Dunning, C.; Ickovics, J.R. Research note: Greater tree canopy cover is associated with lower rates of both violent and property crime in New Haven, CT. Landsc. Urban Plan. 2015, 143, 248–253. [Google Scholar] [CrossRef]
  42. Kimpton, A.; Corcoran, J.; Wickes, R. Greenspace and Crime: An Analysis of Greenspace Types, Neighboring Composition, and the Temporal Dimensions of Crime. J. Res. Crime Delinq. 2016, 54, 303–337. [Google Scholar] [CrossRef]
  43. Kuo, F.E.; Sullivan, W.C. Environment and Crime in the Inner City: Does Vegetation Reduce Crime? Environ. Behav. 2001, 33, 343–367. [Google Scholar] [CrossRef]
  44. Ogletree, S.S.; Larson, L.R.; Powell, R.B.; White, D.L.; Brownlee, M.T.J. Urban greenspace linked to lower crime risk across 301 major U.S. cities. Cities 2022, 131, 103949. [Google Scholar] [CrossRef]
  45. Troy, A.; Morgan Grove, J.; O’Neil-Dunne, J. The relationship between tree canopy and crime rates across an urban–rural gradient in the greater Baltimore region. Landsc. Urban Plan. 2012, 106, 262–270. [Google Scholar] [CrossRef]
  46. Shepley, M.; Sachs, N.; Sadatsafavi, H.; Fournier, C.; Peditto, K. The Impact of Green Space on Violent Crime in Urban Environments: An Evidence Synthesis. Int. J. Environ. Res. Public Health 2019, 16, 5119. [Google Scholar] [CrossRef] [PubMed]
  47. Branas, C.C.; Cheney, R.A.; MacDonald, J.M.; Tam, V.W.; Jackson, T.D.; Ten Have, T.R. A Difference-in-Differences Analysis of Health, Safety, and Greening Vacant Urban Space. Am. J. Epidemiol. 2011, 174, 1296–1306. [Google Scholar] [CrossRef] [PubMed]
  48. Kondo, M.C.; South, E.C.; Branas, C.C.; Richmond, T.S.; Wiebe, D.J. The Association Between Urban Tree Cover and Gun Assault: A Case-Control and Case-Crossover Study. Am. J. Epidemiol. 2017, 186, 289–296. [Google Scholar] [CrossRef]
  49. Younan, D.; Tuvblad, C.; Li, L.; Wu, J.; Lurmann, F.; Franklin, M.; Berhane, K.; McConnell, R.; Wu, A.H.; Baker, L.A.; et al. Environmental Determinants of Aggression in Adolescents: Role of Urban Neighborhood Greenspace. J. Am. Acad. Child Adolesc. Psychiatry 2016, 55, 591–601. [Google Scholar] [CrossRef] [PubMed]
  50. Escobedo, F.J.; Clerici, N.; Staudhammer, C.L.; Feged-Rivadeneira, A.; Bohorquez, J.C.; Tovar, G. Trees and Crime in Bogota, Colombia: Is the link an ecosystem disservice or service? Land Use Policy 2018, 78, 583–592. [Google Scholar] [CrossRef]
  51. Sanciangco, J.C.; Breetzke, G.D.; Lin, Z.; Wang, Y.; Clevenger, K.A.; Pearson, A.L. The Relationship Between City “Greenness” and Homicide in the US: Evidence Over a 30-Year Period. Environ. Behav. 2021, 54, 538–571. [Google Scholar] [CrossRef]
  52. Kondo, M.C.; Han, S.; Donovan, G.H.; MacDonald, J.M. The association between urban trees and crime: Evidence from the spread of the emerald ash borer in Cincinnati. Landsc. Urban Plan. 2017, 157, 193–199. [Google Scholar] [CrossRef]
  53. Wilson, J.Q.; Kelling, G.L. Broken windows. Atl. Mon. 1982, 249, 29–38. [Google Scholar]
  54. Ohly, H.; White, M.P.; Wheeler, B.W.; Bethel, A.; Ukoumunne, O.C.; Nikolaou, V.; Garside, R. Attention Restoration Theory: A systematic review of the attention restoration potential of exposure to natural environments. J. Toxicol. Environ. Health Part B 2016, 19, 305–343. [Google Scholar] [CrossRef] [PubMed]
  55. Coley, R.L.; Sullivan, W.C.; Kuo, F.E. Where Does Community Grow?: The Social Context Created by Nature in Urban Public Housing. Environ. Behav. 1997, 29, 468–494. [Google Scholar] [CrossRef]
  56. FBell, S.L.; Phoenix, C.; Lovell, R.; Wheeler, B.W. Green space, health and wellbeing: Making space for individual agency. Health Place 2014, 30, 287–292. [Google Scholar] [CrossRef]
  57. Lai, H.; Flies, E.J.; Weinstein, P.; Woodward, A. The impact of green space and biodiversity on health. Front. Ecol. Environ. 2019, 17, 383–390. [Google Scholar] [CrossRef]
  58. Iqbal, A.; Ceccato, V. Is CPTED Useful to Guide the Inventory of Safety in Parks? A Study Case in Stockholm, Sweden. Int. Crim. Justice Rev. 2016, 26, 150–168. [Google Scholar] [CrossRef]
  59. Jacobs, J. The Death and Life of Great American Cities; Vintage: New York, NY, USA, 1961. [Google Scholar]
  60. Kim, Y.-A.; Hipp, J.R. Physical Boundaries and City Boundaries: Consequences for Crime Patterns on Street Segments? Crime Delinq. 2017, 64, 227–254. [Google Scholar] [CrossRef]
  61. Taylor, R.B.; Haberman, C.P.; Groff, E.R. Urban park crime: Neighborhood context and park features. J. Crim. Justice 2019, 64, 101622. [Google Scholar] [CrossRef]
  62. Appleton, J. The Experience of Landscape; John Wiley & Sons: London, UK, 1975. [Google Scholar]
  63. Neves, A.V. O Crime e o Contexto: Dois Estudos de Caso em Lisboa; (Doutoramento em Sociologia); ISCTE: Lisboa, Portugal, 2020. [Google Scholar]
  64. INE. Statistics Portugal. Population Census. 2021. Available online: www.ine.pt/ (accessed on 4 September 2023).
  65. Marques, T.S.; Saraiva, M.; Matos, F.L.d.; Maia, C.; Ribeiro, D.; Ferreira, M.; Van Heerden, S. Property Investment and Housing Affordability in Lisbon and Porto (Vol. EUR 30993 EN/JRC127286); Publications Office of the European Union: Luxembourg, 2022. [Google Scholar]
  66. Rosser, G.; Davies, T.; Bowers, K.J.; Johnson, S.D.; Cheng, T. Predictive crime mapping: Arbitrary grids or street networks? J. Quant. Criminol. 2017, 33, 569–594. [Google Scholar] [CrossRef]
  67. Weisburd, D.; White, C.; Wire, S.; Wilson, D.B. Enhancing Informal Social Controls to Reduce Crime: Evidence from a Study of Crime Hot Spots. Prev. Sci. 2021, 22, 509–522. [Google Scholar] [CrossRef] [PubMed]
  68. Weisburd, D.; White, C.; Wooditch, A. Does Collective Efficacy Matter at the Micro Geographic Level?: Findings from a Study Of Street Segments. Br. J. Criminol. 2020, 60, 873–891. [Google Scholar] [CrossRef]
  69. Chainey, S.; Tompson, L.; Uhlig, S. The utility of hotspot mapping for predicting spatial patterns of crime. Secur. J. 2008, 21, 4–28. [Google Scholar] [CrossRef]
  70. Kalinic, M.; Krisp, J.M. Kernel Density Estimation (KDE) vs. Hot-Spot Analysis–Detecting Criminal Hot Spots in the City of San Francisco. In Proceedings of the 21 Conference on Geo-Information Science, Lund, Sweden, 12–15 June 2018. [Google Scholar]
  71. Bunting, R.J.; Chang, O.Y.; Cowen, C.; Hankins, R.; Langston, S.; Warner, A.; Yang, X.; Louderback, E.R.; Roy, S.S. Spatial Patterns of Larceny and Aggravated Assault in Miami–Dade County, 2007–2015. Prof. Geogr. 2018, 70, 34–46. [Google Scholar] [CrossRef]
  72. Stoia, N.L.; Niţă, M.R.; Popa, A.M.; Iojă, I.C. The green walk—An analysis for evaluating the accessibility of urban green spaces. Urban For. Urban Green. 2022, 75, 127685. [Google Scholar] [CrossRef]
  73. Kim, Y.J. Correlation between urban green areas and outdoor crime rates-a case study of Austin, Texas. J. Korean Inst. Landsc. Archit. 2019, 47, 49–56. [Google Scholar]
  74. Bhatia, S.; Jason, L. Greenness and Crime in the City: An Investigation Using Remote Sensing and Spatial Panel Models. Appl. Spat. Anal. 2023, 16, 229–257. [Google Scholar] [CrossRef]
  75. Wolfe, M.K.; Mennis, J. Does vegetation encourage or suppress urban crime? Evidence from Philadelphia, PA. Landsc. Urban Plan. 2012, 108, 112–122. [Google Scholar] [CrossRef]
  76. Heal, K.; Laycock, G. (Eds.) Situational Crime Prevention: From Theory into Practise; HMSO: London, UK, 1986. [Google Scholar]
  77. Cozens, P.; Love, T.; Davern, B. Geographical Juxtaposition: A New Direction in CPTED. Soc. Sci. 2019, 8, 252. [Google Scholar] [CrossRef]
  78. Gong, C.H.; Bushman, G.; Hohl, B.C.; Kondo, M.C.; Carter, P.M.; Cunningham, R.M.; Rupp, L.A.; Grodzinski, A.; Branas, C.C.; Vagi, K.J.; et al. Community engagement, greening, and violent crime: A test of the greening hypothesis and Busy Streets. Am. J. Community Psychol. 2023, 71, 198–210. [Google Scholar] [CrossRef]
Figure 1. Porto Municipality, Portugal.
Ijgi 12 00492 g001
Figure 2. The city of Porto and the locations of the analysed green spaces, by typology.
Ijgi 12 00492 g002
Figure 3. Walking distance (5, 10, 15 min) to the closest greenspaces of Porto.
Ijgi 12 00492 g003
Figure 4. Kernel Density Estimation, considering a 50 m cell size and crime at street segment, for all reported street crimes between 2009 and 2018 in Porto (source: own; based on untreated raw data from the Public Safety Police).
Ijgi 12 00492 g004
Figure 5. Kernel Density Estimation, with 50 m cell size and crime at the street segment level, for three of the thirteen categories analysed: (a) pickpocketing, (b) thefts in motorized vehicles, and (c) thefts in the street, between 2009 and 2018 in Porto (source: own; based on untreated raw data from the Public Safety Police).
Ijgi 12 00492 g005
Figure 6. Emerging hot spot analysis for reported street crimes between 2009 and 2018 with a 1-year time step (source: own; based on untreated raw data from the Public Safety Police).
Ijgi 12 00492 g006
Figure 7. Distribution (in percentages) of the total amount of each typology of registered crime, by walking distance to overall greenspaces, gardens, and parks.
Ijgi 12 00492 g007
Figure 8. Distribution (in percentages) of how total street crimes, by walking distance, are divided into crime typologies, for overall greenspaces, gardens, and parks.
Ijgi 12 00492 g008
Table 1. Descriptive statistics of the greenspaces of Porto considered in this research.
Green SpacesCountTotal Area (ha)Average Area (ha)Standard
Deviation
Minimum Area (ha)Maximum Area (ha)Average
Perimeter (km)
Total50187.13.749.830.0967.970.84
Gardens3853.571.411.690.098.90.54
Parks12133.511.1317.940.2067.91.73
Table 2. Area, population, and street crimes within walking distance from the closest greenspace in different time intervals.
0–5 min5–10 min10–15 min>15 min
Total Area Covered8.99 km2 (21.7%)14.13 km2 (34.1%)13.75 km2 (33.2%)4.55 km2 (11%)
Population within walking distance from the closestGreenspace84,117 (36%)80,096 (35%)49,664 (21%)17,923 (8%)
Garden69,382 (30%)70,134 (30%)55,100 (24%)37,184 (16%)
Park18,549 (8%)49,050 (21%)78,070 (34%)86,131 (37%)
Street crimes within walking distance from the closestGreenspace24,771 (45.7%)15,392 (28.4%)5172 (9.5%)8841 (16.3%)
Garden22,309 (41.2%)14,382 (26.6%)5,960 (11.0%)11,525 (21.3%)
Park4725 (8.7%)12,270 (22.6%)14,422 (26.6%)22,758 (42.0%)
Table 3. Spearman correlation between the distance to greenspaces and 14 types of crime (total + 13 categories) considered, based on a 50 m cell grid.
Distance to Green SpacesDistance to ParksDistance to GardensTotal Street CrimesRobbery/PickpocketingTheft in Motor VehicleTheft of Motor VehiclesWallet TheftTheft in a SupermarketTheft in the StreetBank RobberyTreasury or Post Office RobberyService Station RobberyRobbery in Public TransportsDamage to Cultural PropertyFire or ArsonOther Damage
Distance to Green Spaces10.608 **0.649 **−0.000780.095 **−0.047 **0.196**0.00650.093 **0.048 **.110 **0.050 **0.310 **0.254 **−0.340 **−0.0020.239 **
Distance to Parks 10.071 **0.275 **0.350 **0.250 **0.266 **0.265 **0.354 **0.279 **0.328 **0.087 **0.261 **0.352 **−0.0910.144 **0.397 **
Distance to Gardens 1−0.258 **−0.187 **−0.265 **−0.147 **−0.22 **−0.302 **−0.154 **−0.153 **−0.035**0.115 **0.084 **−0.564 **−0.265 **−0.083 **
Total Street Crimes 10.811 **0.911 **0.569 **0.846 **0.496 **0.842 **0.426 **0.084 **0.052 **0.378 **0.232 **0.260 **0.602 **
Robbery/pickpocketing 10.695 **0.650 **0.755 **0.633 **0.879 **0.428 **0.088 **0.218 **0.550 **0.204 **0.322 **0.763 **
Theft in motor vehicle 10.444 **0.651 **0.351 **0.707 **0.520 **0.146 **−0.039 **0.259 **0.186 **0.166 **0.445 **
Theft of motor vehicles 10.458 **0.580 **0.496 **0.286 **0.114 **0.346 **0.346 **0.240 **0.399 **0.643 **
Wallet theft 10.530 **0.807 **0.286 **0.004860.073 **0.427 **0.223 **0.309 **0.628 **
Theft in a supermarket 10.536 **0.261 **0.047 **0.357 **0.446 **0.260 **0.452 **0.670 **
Theft in the street 10.369 **0.071 **0.088 **0.516 **0.169 **0.295 **0.696 **
Bank robbery 10.521 **−0.00420.239 **−0.01420.232 **0.332 **
Treasury or post office robbery 10.067 **0.183 **−0.223 **0.149 **0.085 **
Service station robbery 10.197 **−0.091 **0.071 **0.341 **
Robbery in public transports 10.018 *0.240 **0.677 **
Damage to cultural property 10.354 **0.166 **
Fire or arson 10.383 **
Other damage 1
**. Correlation is significant at 0.01 (2 tailed)/*. Correlation is significant at 0.05 (2 tailed).
Table 4. Pearson correlations between area, population, and street crimes, considering walking distances to greenspaces.
AreaStreet Crimes
>5 min
Street Crimes
5–10 min
Street Crimes
10–15 min
Street Crimes
>15 min
Area1.000−0.183−0.186−0.1900.197
Population
>5 min
−0.215 0.1480.1470.248−0.209
Population
5–10 min
−0.137 0.2160.2220.352 *−0.302 *
Population
10–15 min
−0.045 0.1630.1330.290 *−0.228
Population
>15 min
0.100 −0.188−0.173−0.323 *0.264
*. Correlation is significant at 0.05 (2 tailed).
Disclaimer/Publisher’s Note: The statements, opinions and data contained in all publications are solely those of the individual author(s) and contributor(s) and not of MDPI and/or the editor(s). MDPI and/or the editor(s) disclaim responsibility for any injury to people or property resulting from any ideas, methods, instructions or products referred to in the content.

