Article

A Web-Based Geodesign Tool for Evaluating the Integration of Transport Infrastructure, Public Spaces, and Human Activities

1
School of Architecture, Southeast University, Nanjing 210096, China
2
Research Center of Urban Design, Southeast University, Nanjing 210096, China
ISPRS Int. J. Geo-Inf. 2023, 12(12), 504; https://doi.org/10.3390/ijgi12120504
Submission received: 3 September 2023 / Revised: 10 December 2023 / Accepted: 15 December 2023 / Published: 17 December 2023

Abstract

:
The need for addressing the adverse impacts of transport infrastructure on public spaces and human activities (TSH) emphasizes the importance of designing integrated TSH system, thereby necessitating tailored planning support systems (PSS). This study begins by assessing the demand for PSS using surveys and interviews to uncover the need for robust analysis and evaluation support, particularly through the use of geographical information systems (GIS). On this basis, a prototype GIS platform is proposed for analyzing and evaluating the integration of the TSH system at the block scale. This user-friendly geodesign tool encompasses a customizable evaluation index (includes seven KPAs and KPIs), allowing for combined quantitative and qualitative assessments. Notably, it introduces a buffer effect index to quantify transport–space interaction. The proposed tool serves as a dedicated platform for evaluating TSH systems, offering 2D/3D visualization capabilities and two analysis units and facilitating cross-platform collaboration. Applied to a case study in Nanjing, China, it effectively assessed the interdependence among different TSH system components and block integration around expressways, railways, and main roads. This tool holds promise in offering invaluable insights into urban planning and (re)development, thereby enhancing the integration of transport infrastructure and public spaces.

1. Introduction

1.1. Background

In the process of urbanization, many cities have constructed large-scale rapid transport infrastructures to enhance motorization levels. However, this focus on motor traffic has brought forth notable negative impacts on urban spaces [1,2]. The construction of infrastructure geared toward motor vehicles occupies substantial land without adequate consideration of its adverse effects on urban spaces, inhabitants, and the environment. Consequently, this has resulted in the creation of underutilized and disconnected spaces [3], alongside transport infrastructure. These low-quality spaces contribute to physical, visual, and psychological separations when pedestrians travel around the city, leading to the “buffer effect” (or “barrier effect” or “community severance”) issue at the block scale [3,4]. Furthermore, abandoned spaces near transport infrastructure, such as disused parking areas, can evoke public anxieties [5]. The efficient use of existing urban areas adjacent to transport infrastructure for public space purposes has become a pressing concern in architecture and urban planning disciplines.
In response to these challenges, urban researchers have introduced concepts like infrastructural urbanism and architectural infrastructure [2]. Considerable attention has been paid to the integrated design of transport infrastructure and public spaces, with a strong emphasis on supporting human activities and creating improved environments rather than merely enhancing mobility [6]. Achieving this integrated design requires adopting a systems approach, which views a city as a complex sociotechnical system comprising numerous interrelated subsystems [7]. When new transport infrastructure is introduced into existing urban systems, it becomes an integral component of a broader system of systems, marked by open interdependencies with human-built and natural environments. Therefore, Whyte [8] argued that planning for system integration should commence early in project development, aiming to “form a coherent whole from component subsystems (including humans) to create a mission capability that satisfies the needs of various stakeholders” [9].
Building upon this foundation, this study regards transport infrastructure, public spaces, and human activities (TSH) as interconnected components within a system, with the natural environment as the external environment. To achieve TSH system integration, we must understand and coordinate interactions between subsystem components, subsystems themselves, and the broader environment [10]. In terms of system integration research, scholars consider performance evaluation a vital method for assessing integration effects, gauging success/degree through key performance areas (KPAs) or key performance indicators (KPIs) [10]. In the field of urban planning, performance evaluation holds similar significance [11]. Therefore, to achieve integrated TSH design, urban planners and designers must systematically and comprehensively evaluate the TSH system performance before implementing urban plans [12,13].
Planning support systems (PSS), such as land use–transport interaction models (LUTI) [14], agent-based simulations [15], and Space Syntax [16], have been employed to support assessments of TSH system integration (for a comprehensive review, see [13]). While LUTI models suit city-scale analysis, they are inadequate for exploring severance issues at the street-block scale. Agent-based modeling excels at predicting human activities in transport and public space systems but lacks the features to perform a morphological analysis of the TSH system. Space Syntax, a professional technique for morphology analysis, predominantly focuses on street network configuration. To assess severance from roads, the Severance Tool was developed [17]. Nevertheless, it lacks the ability to obtain spatial and geographic information.
Increasingly advanced geographical information system (GIS) technology aids PSS in providing spatial data and geographical analysis tools to evaluate the impacts of potential urban development scenarios [18]. Termed geodesign, this multidisciplinary approach adapts GIS tools to various contexts [19]. These tools serve as valuable resources for information collection, storage, and retrieval, as well as straightforward information visualization and analysis. Pelzer et al. [18] argued that, while transport analysts rely on transport models to evaluate challenges and propose solutions, urban designers primarily use traditional tools like paper, pens, and visualization software. Geodesign has the potential to bridge these two realms by offering a common professional language and enabling the iterative fusion of sketching and quantitative analysis. For instance, Ye et al. [20] integrated a quantitative morphological analysis tool into GIS for urban design. Yang et al. [21] introduced an integrated parametric modeling, GIS, multidisciplinary design optimization, and performance simulation tool for design, evaluation, and optimization processes. However, challenges persist in applying geodesign to urban design, including in user acceptance of new technologies and inadequacies in incorporating unquantifiable aspects, such as severance in GIS-based tools [18,22].
Despite the growing research interest in the spatial integration of TSH systems, there remains a need for GIS-based PSS to evaluate the performance of the system integration. In this regard, this paper aimed to develop a prototype geodesign tool for the analysis and evaluation of the fundamental, representative components of the TSH system at the block scale. Such a tool could provide benefits for the following stakeholders:
  • Urban designers and planners via quantitative analyses of the relationships among different components within the TSH system and quantitative evaluations of the system integration’s effectiveness to assist them in bringing together the various elements into one integrated system and choosing suitable planning scenarios;
  • Decision makers and policy makers via a decision-making support tool that provides visualized and quanti-qualitative research support to set goals for projects, as well as enabling effective management action;
  • Computer scientists via insight into users’ (designers and planners) expectations and the design of a geodesign tool, allowing the development of user-centered PSS.

1.2. Planning Support Systems (PSS)

PSS can be broadly characterized as computerized tools that aid planners in efficiently managing their daily professional responsibilities. Specifically, PSS are spatial data-driven instruments created to measure, map, or assess the impacts associated with potential urban development scenarios, as articulated by Vonk et al. [22] and Geertman and Stillwell [23].
In the late 1980s, Harris and Batty [24] first recognized PSS, which emerged from the convergence of efforts in GIS, large-scale urban modeling (e.g., cellular automata), and decision-making support systems. Subsequently, during the 1990s, the development of numerous PSS occurred, featuring user-friendly interfaces that facilitated direct interaction for planners. For example, What if? [25] was developed for simulating land use changes and CommunityViz [26] fostered community participation. However, as highlighted by Geertman and Stillwell [23], the early practical applications of PSS were primarily experimental, with a predominant focus on land use and/or urban transport planning.
During the 2000s, the emergence of the Internet and web-based technologies marked a significant transformation for PSS. Online platforms, like Online What if? [27], facilitated collaborative planning efforts, granting stakeholders access to contribute to planning data and models. In recent years, PSS have witnessed a notable shift toward open-source platforms and embraced advancements in technologies, such as in big data analytics and deep learning, empowering planners to process extensive data and extract insights for more informed decision making [28]. This evolution rendered PSS more flexible, allowing planners to seamlessly integrate diverse data sources and models for a comprehensive view of planning scenarios.
Despite the increasing development of PSS (an inventory of PSS software can be found in [29]), their adoption by planners remains low. To improve the usability of PSS, Russo et al. [30] underscored that GIS commonly offer an extensive array of geoprocessing and spatial analysis functionalities, along with the customization potential of cartographic elements. Their evaluation study of PSS substantiated that a majority of planners possess familiarity with GIS, leading to an expectation of GIS functionality within PSS, i.e., geodesign tools. Furthermore, web-based PSS stand out for their accessibility, requiring no software installation.

1.3. Relevant Geodesign Tools for Transport and Public Space Systems

In the field of transport and public space planning, existing geodesign tools can be broadly categorized as either desktop- or web-based. Desktop-based platforms, such as AutoCAD Map3D, CityCAD, and ArcGIS CityEngine, while useful, often lack features, like network collaboration, reusability, and flexibility. Web-based evaluation platforms address these issues by integrating Internet technology with GIS. In the realm of transport and urban space planning, specialized evaluation platforms like TfL WebCAT (https://tfl.gov.uk/info-for/urban-planning-and-construction/planning-with-webcat/webcat accessed on 14 December 2023) and Singapore URASPACE (https://www.ura.gov.sg/maps/ accessed on 14 December 2023) have emerged as valuable tools. These platforms, which are compared in Table 1, provide data evaluation functions based on location information, offering advantages such as ease of learning and strong network collaboration.
TfL WebCAT, for instance, is a web-based accessibility assessment toolkit tailored to inform London’s professional planning community. It employs two key measures: public transport access level (PTAL), which assesses the connectivity of transport networks and ranks locations based on their proximity to frequent public transport services, and time mapping, which evaluates the transport network connectivity by measuring the distance one can travel within a given journey time.
On the other hand, URA SPACE represents a centralized and comprehensive map portal developed by Singapore’s Urban Redevelopment Authority (URA). It offers various map services (e.g., open space visualization) and data from partner organizations, providing developers access to real-time information via web services and APIs. However, it is important to note that the evaluation calculation algorithm and output data within URA SPACE lack customization options.

1.4. Research Objectives and Contribution

Despite the existence of established web-based geodesign tools, there is a clear need for the development of an evaluation platform that incorporates specific transport and public space systems. Such a platform should promote effective collaboration while offering flexibility, allowing users to define desired output results. For urban planners, an ideal software solution would combine individual computing needs with user-friendliness. To address these gaps, this research proposed a prototype geodesign tool developed for analyzing and evaluating the integration of the TSH system at the block scale.
Initially, surveys and interviews were conducted to understand urban planners and designers’ demand for computer-aided tools. Building on these insights, an evaluation index and a geodesign tool was developed. This index encompasses seven representative KPAs and seven KPIs, which are designed to quantitatively evaluate various subsystems of the TSH system. Notably, it includes a “buffer effect index” (BEI) to capture the interplay between transport and public space subsystems. Users can enhance the index by adding new KPIs and KPAs that align with project goals.
The proposed tool serves as a dedicated platform for evaluating TSH systems, offering multiple advantages: customizable computation, expandable measurement modules, cross-platform flexibility, advanced visualization (including 2D and 3D model displays and result exports), and enhanced collaboration. The tool facilitates the acquisition and rendering of 2D GIS data and 3D models, enabling users to define their desired study area, configure custom evaluation indices, compute integration scores, and export data visuals.
In practice, this tool was applied to a case study in Nanjing, China, to comprehend the interdependence between TSH subsystems, as well as to assess integration degree of the status quo system, leading to informed urban design recommendations.
This paper is structure like follows: Section 2 details the outcomes of a survey on PSS. Section 3 presents a comprehensive framework for the TSH-system GIS platform, outlining the index development, calculation methods, and usage procedures. Then, a case study of Nanjing was presented in Section 4. Section 5 discusses planning recommendations stemming from the case study and explores how this platform can support decision-making. Conclusions were provided in Section 6.

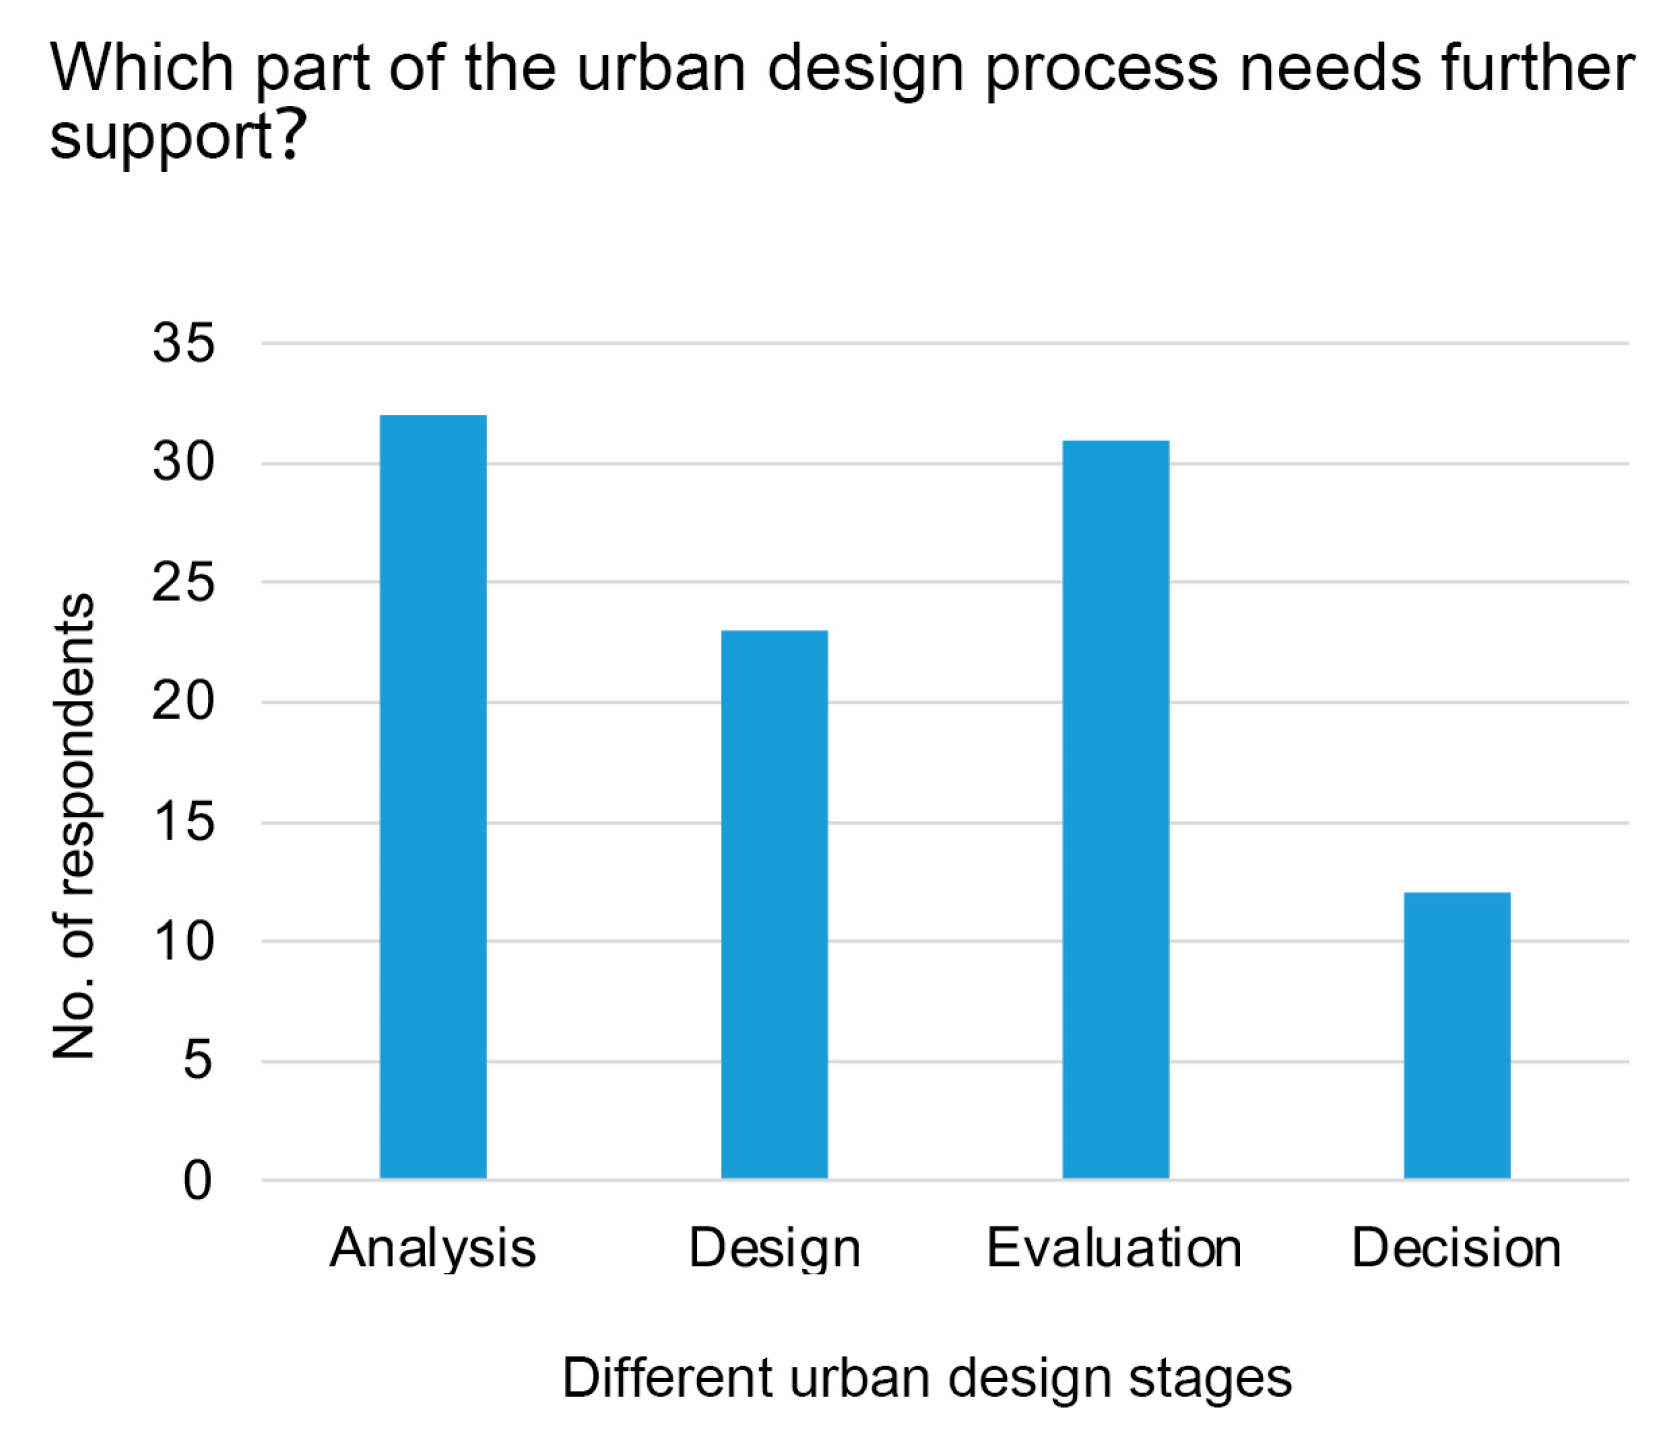
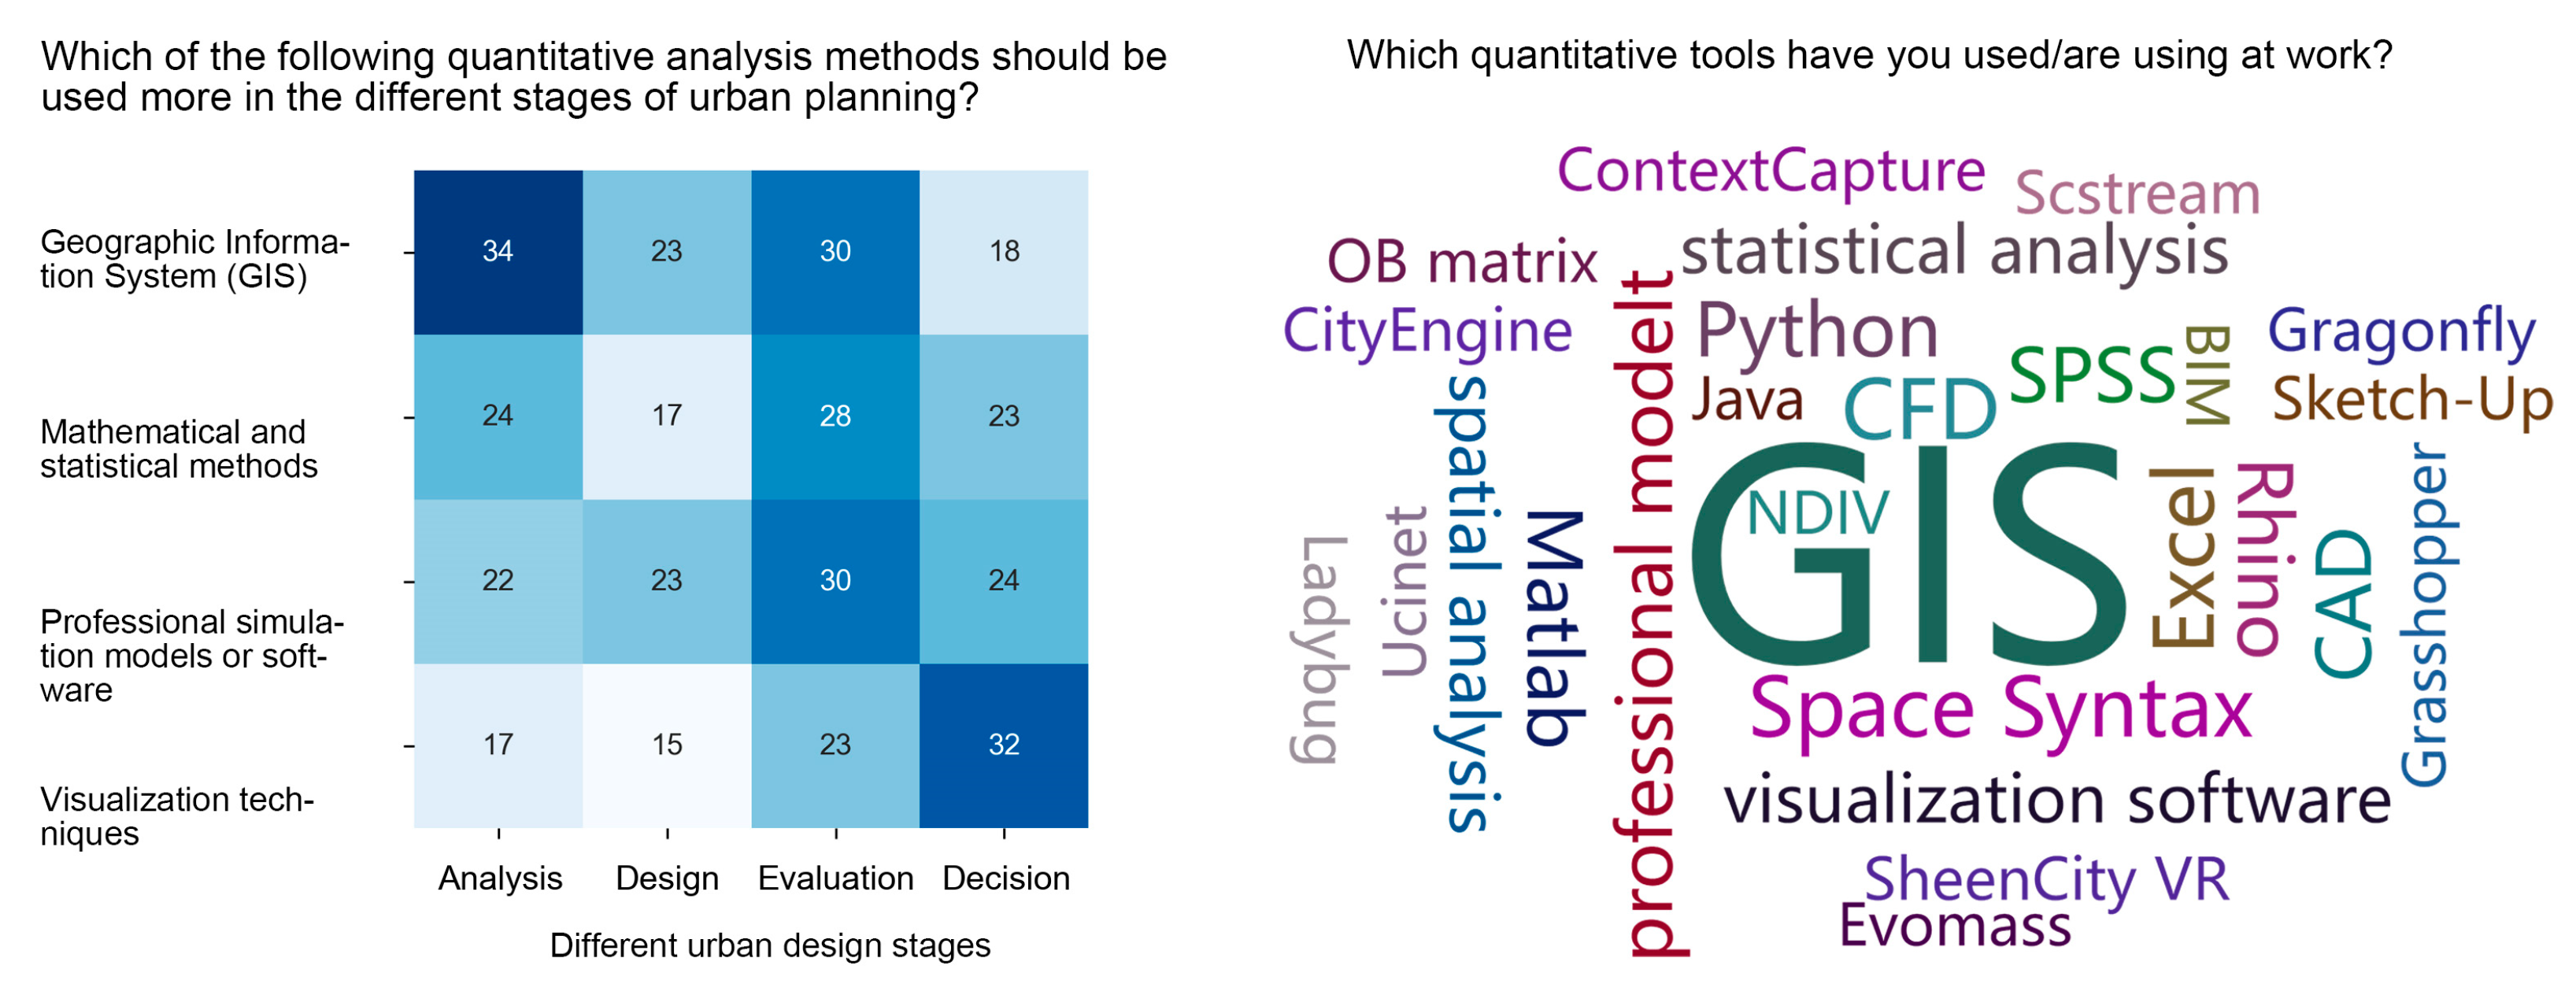
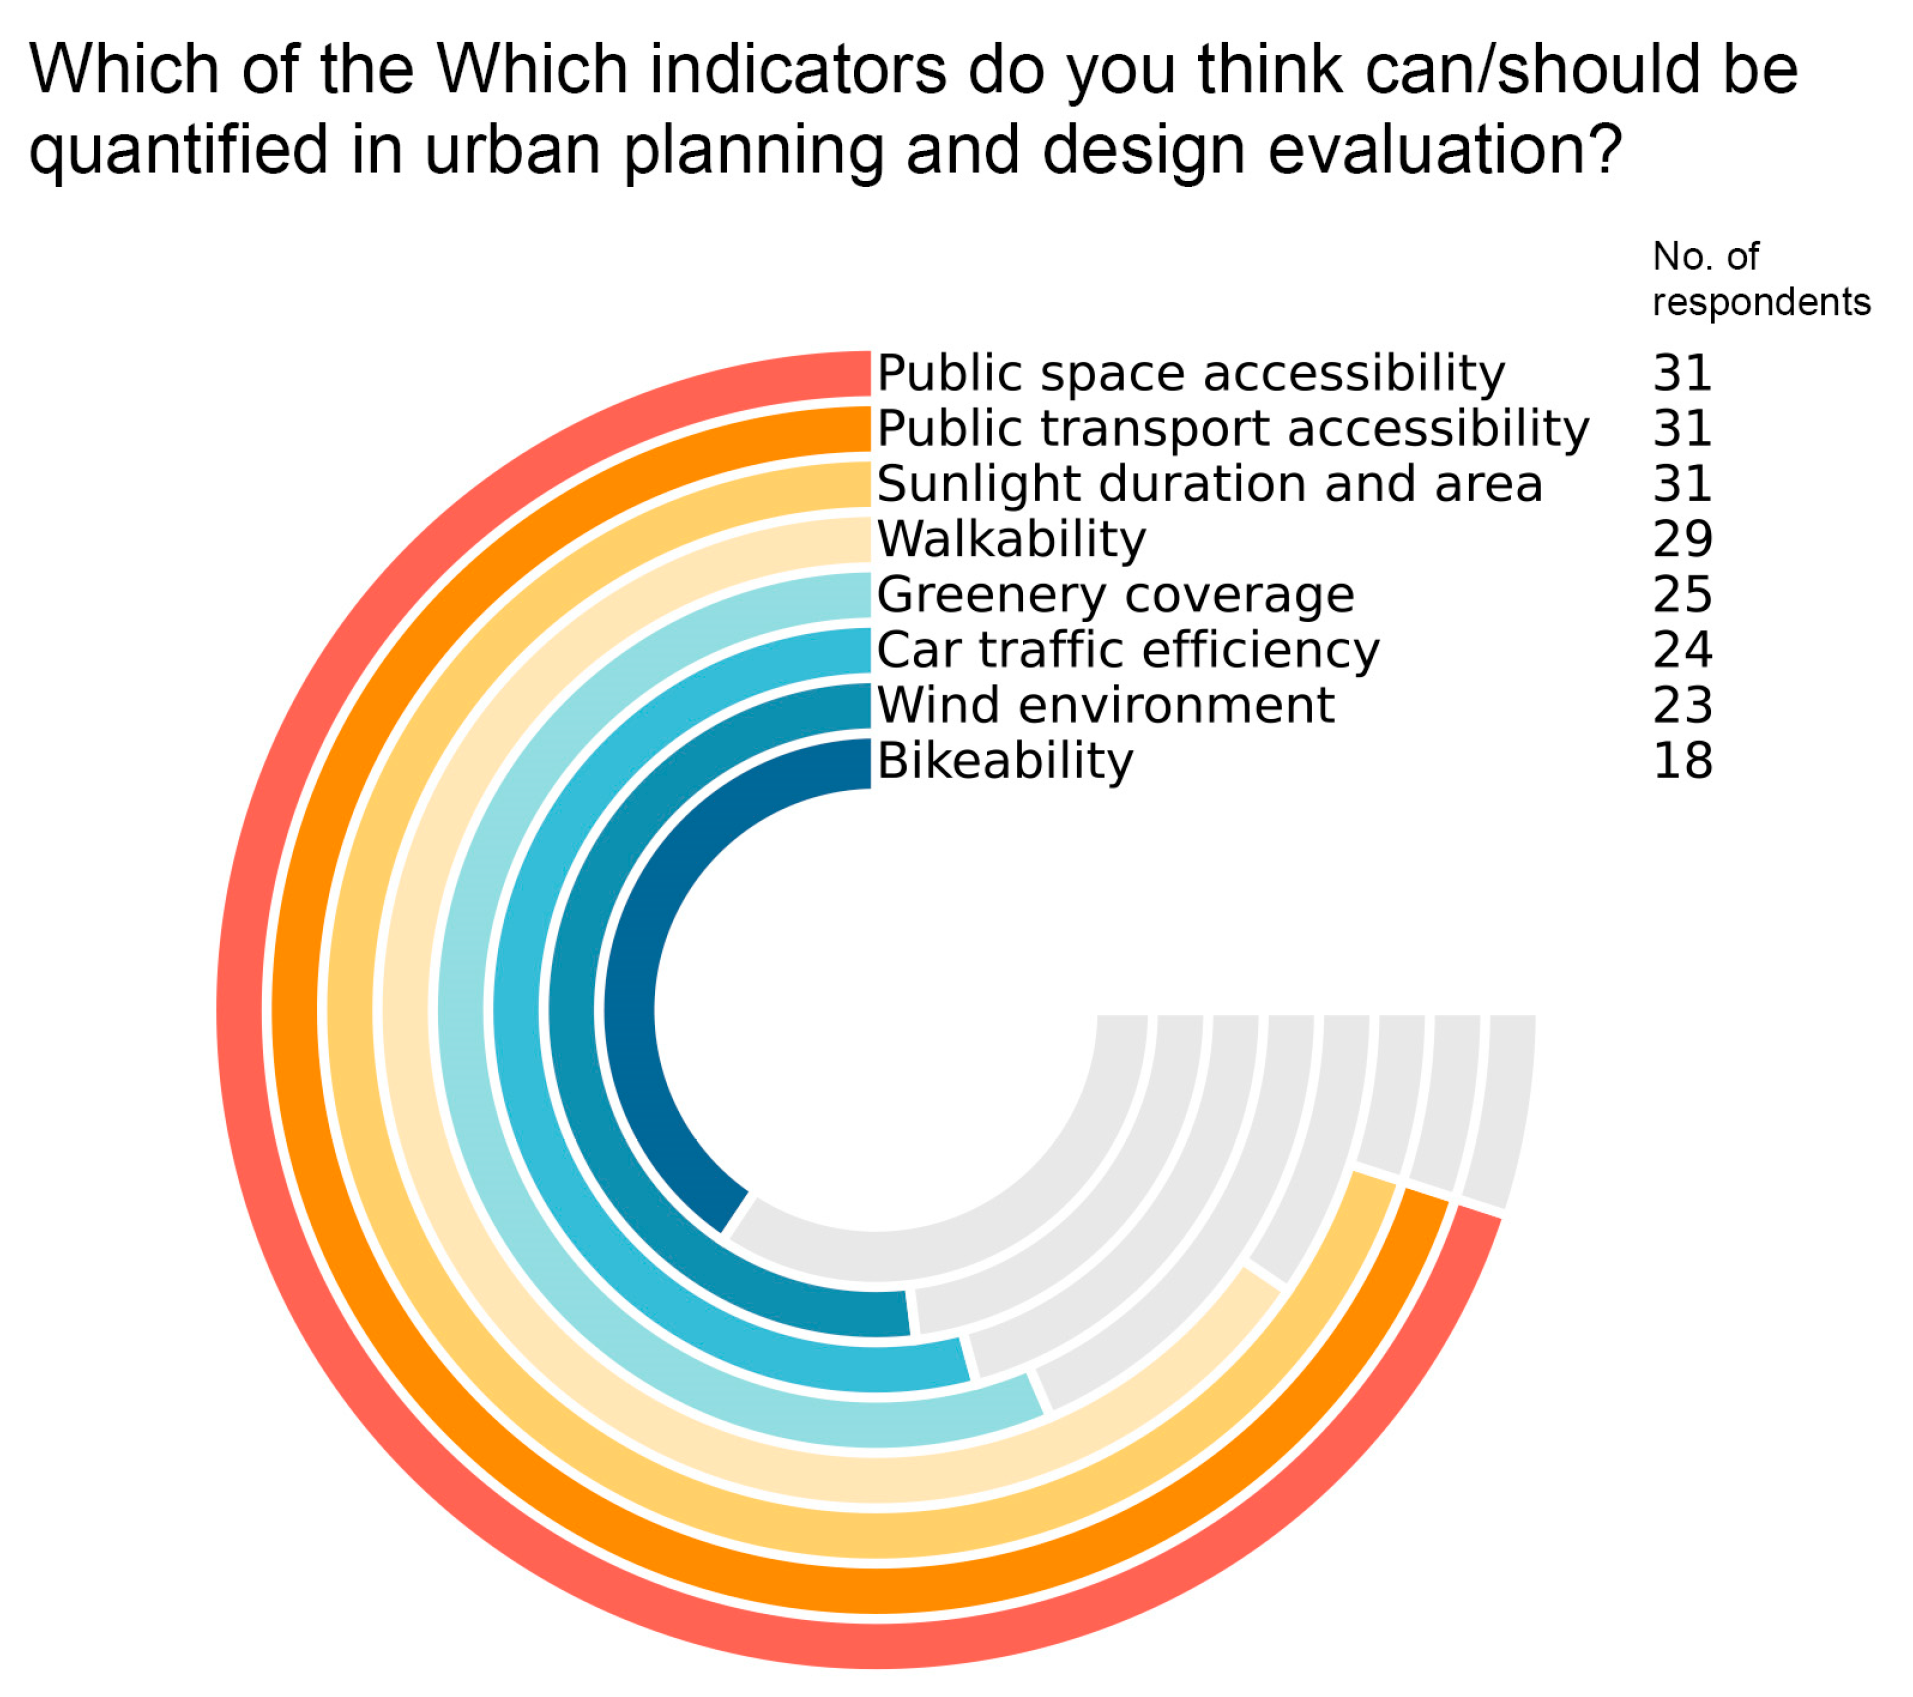
2. A Survey and Interviews on PSS

Surveys and interviews are common methods to evaluate the needs and usability of PSS [29]. In June 2022, a survey and semi-structured interviews were conducted. A template of the survey is provided in the Supplementary Data. Thirty-eight Chinese urban design practitioners participated. They were chosen from urban planning and architectural design institutes in eight provincial capital cities and municipalities: Beijing, Shanghai, Nanjing, Harbin, Hohhot, Hangzhou, Kunming, and Taipei. This sample aimed to encompass a diverse range of socioeconomic contexts. The participants, aged between 20 and 50 (28 males and 10 females), all possessed more than three years of experience in urban design, with varying levels of expertise in quantitative tools, primarily ranging from 5 to 10 years of experience.
Semi-structured interviews were chosen because of their open-ended nature, enabling the interviewees to freely articulate their opinions on a given topic. Additionally, this format allows for the collection of data that can be compared among respondents [31]. The interviews were conducted either face to face or via the Internet, lasting from 10 to 20 min each. The interview questions focused on the interviewee’s knowledge of and experience with computer-aided quantitative tools. Furthermore, they were asked about the optimization requirements of existing tools and potential features of new tools that could be beneficial for them. Thematic analysis was employed to identify recurring themes, patterns, and insights emerging from the interviewees’ responses.
The research findings revealed that 95% of respondents believed there is a pressing need for advanced computer-aided quantitative tools to support various aspects of urban planning and design, particularly in the processes of analysis, design, evaluation, and decision making [32]. As shown in Figure 1, the processes of analysis and evaluation were identified as requiring the most attention. Currently, GIS is the most commonly used tool and is primarily employed to analyze existing conditions (see Figure 2). Other widely used tools include computational fluid dynamics (CFD), Space Syntax, and Microsoft Excel. In addition, they highlighted that these tools should possess the capability to assess public transport accessibility, walkability, and public space availability, as well as environmental indicators, like sunlight duration, greenery coverage, and wind efficiency (refer to Figure 3).
As for the limitations of existing tools, the respondents emphasized their deficiencies in supporting urban design and planning, primarily due to their complexity and inconvenience of use (as illustrated in Table 2). Commonly cited issues include insufficient data, functional limitations, and performance deficiencies. To better serve urban design needs, participants suggested that tools should be user friendly, combine quantitative and qualitative analyses, and offer an improved visualization of evaluation results. Additionally, they highlighted the importance of tool extensibility, accommodating different analysis units, and assessing sustainable transport, including public transport and active travel such as walking and cycling.

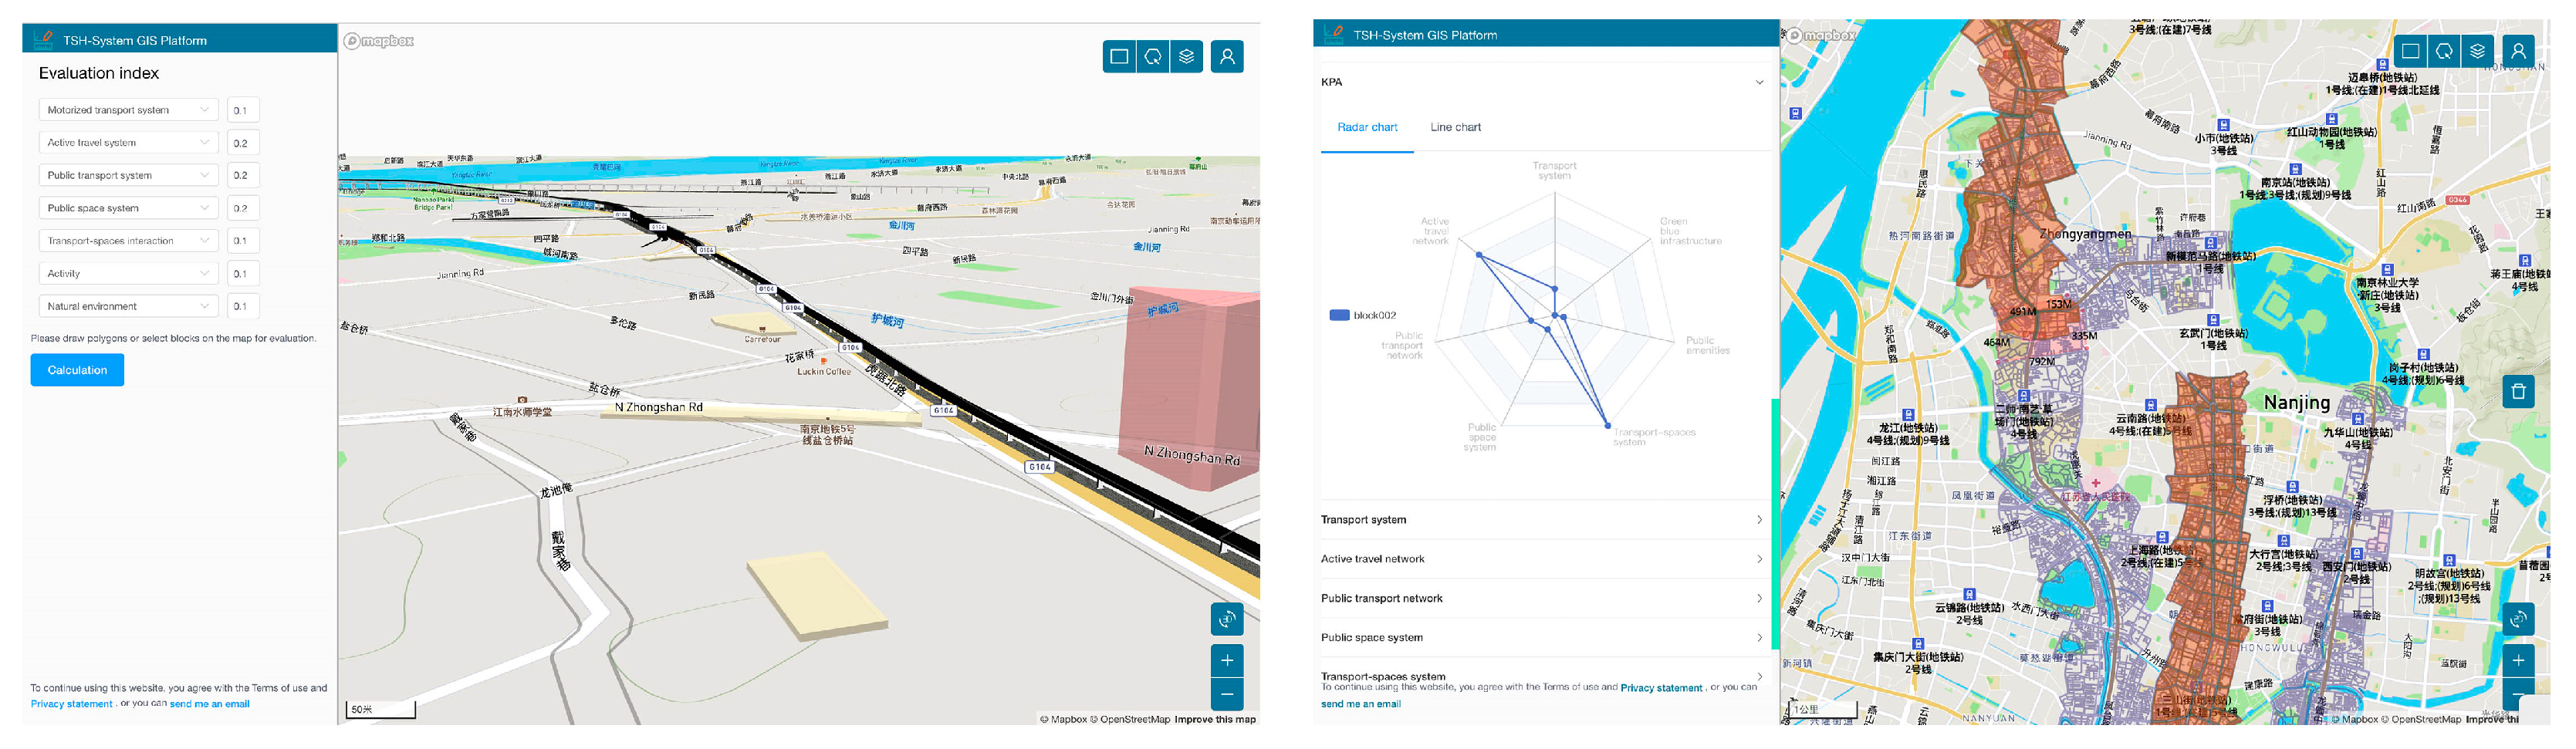
3. TSH-System GIS Platform
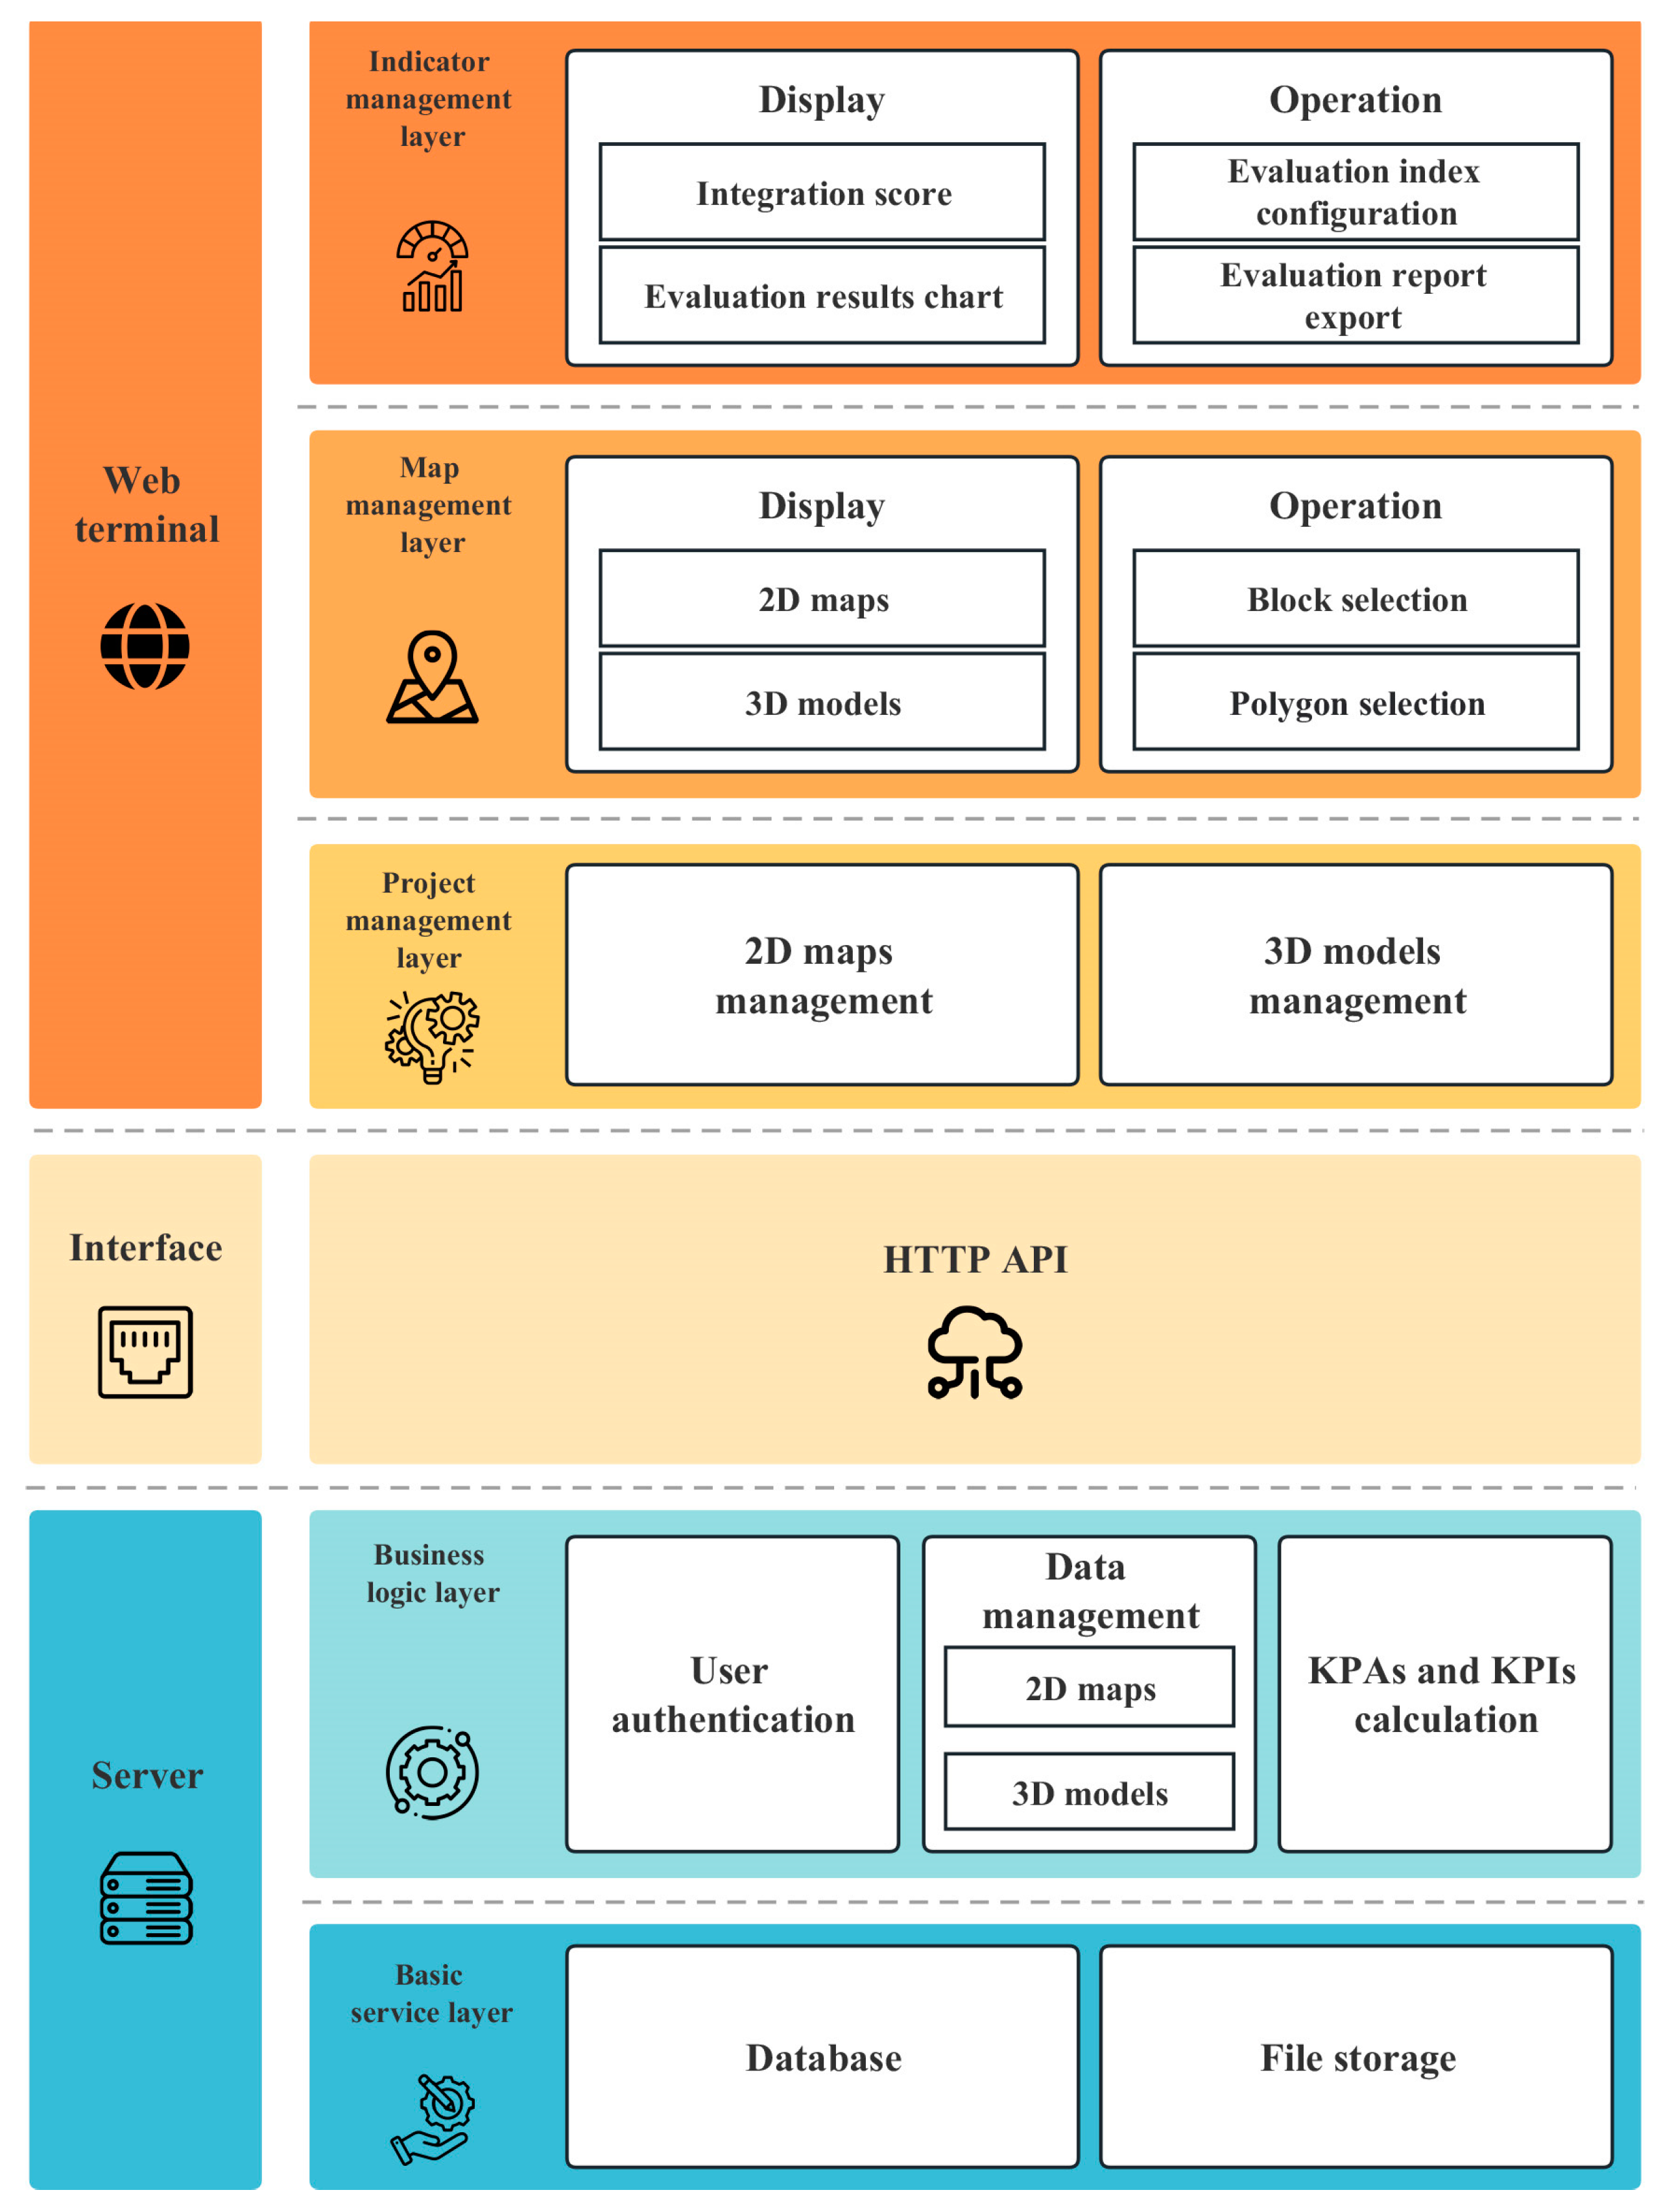
3.1. Framework

In response to the insight gathered from surveys and interviews, a user-friendly GIS tool was developed for analyzing and evaluating a TSH system, referred to as the TSH-System GIS platform (http://www.tshgis.com/ accessed on 14 December 2023). To register to the website, researchers and planners can contact the author to secure their access by providing a designated username and password. This registration process is essential due to the safety considerations of the web platform, ensuring a secure and controlled environment for users.
The web-based platform enables data collection and editing, cross-platform compatibility, and multidisciplinary collaboration. The tool facilitates the integrated management, display, and analysis of 2D and 3D data.
By structuring the evaluation index system as a user-defined, expandable module, it provides flexibility by allowing users to add or remove KPAs and corresponding KPIs to align with project objectives. Additionally, this platform offers two analysis units—street blocks and customized polygon areas—providing users the flexibility to select the most suitable unit based on a project’s requirements. Following the customization of the settings, the tool generates integration scoring results for the selected analysis units, which are used to assess the spatial quality and redevelopment potential of the current TSH system and to evaluate design schemes. This tool promotes a qualitative assessment by converting quantitative results into an integration score ranging from 0 to 1. The tool’s architecture is depicted in Figure 4, and its operation process is elucidated in Figure 5.
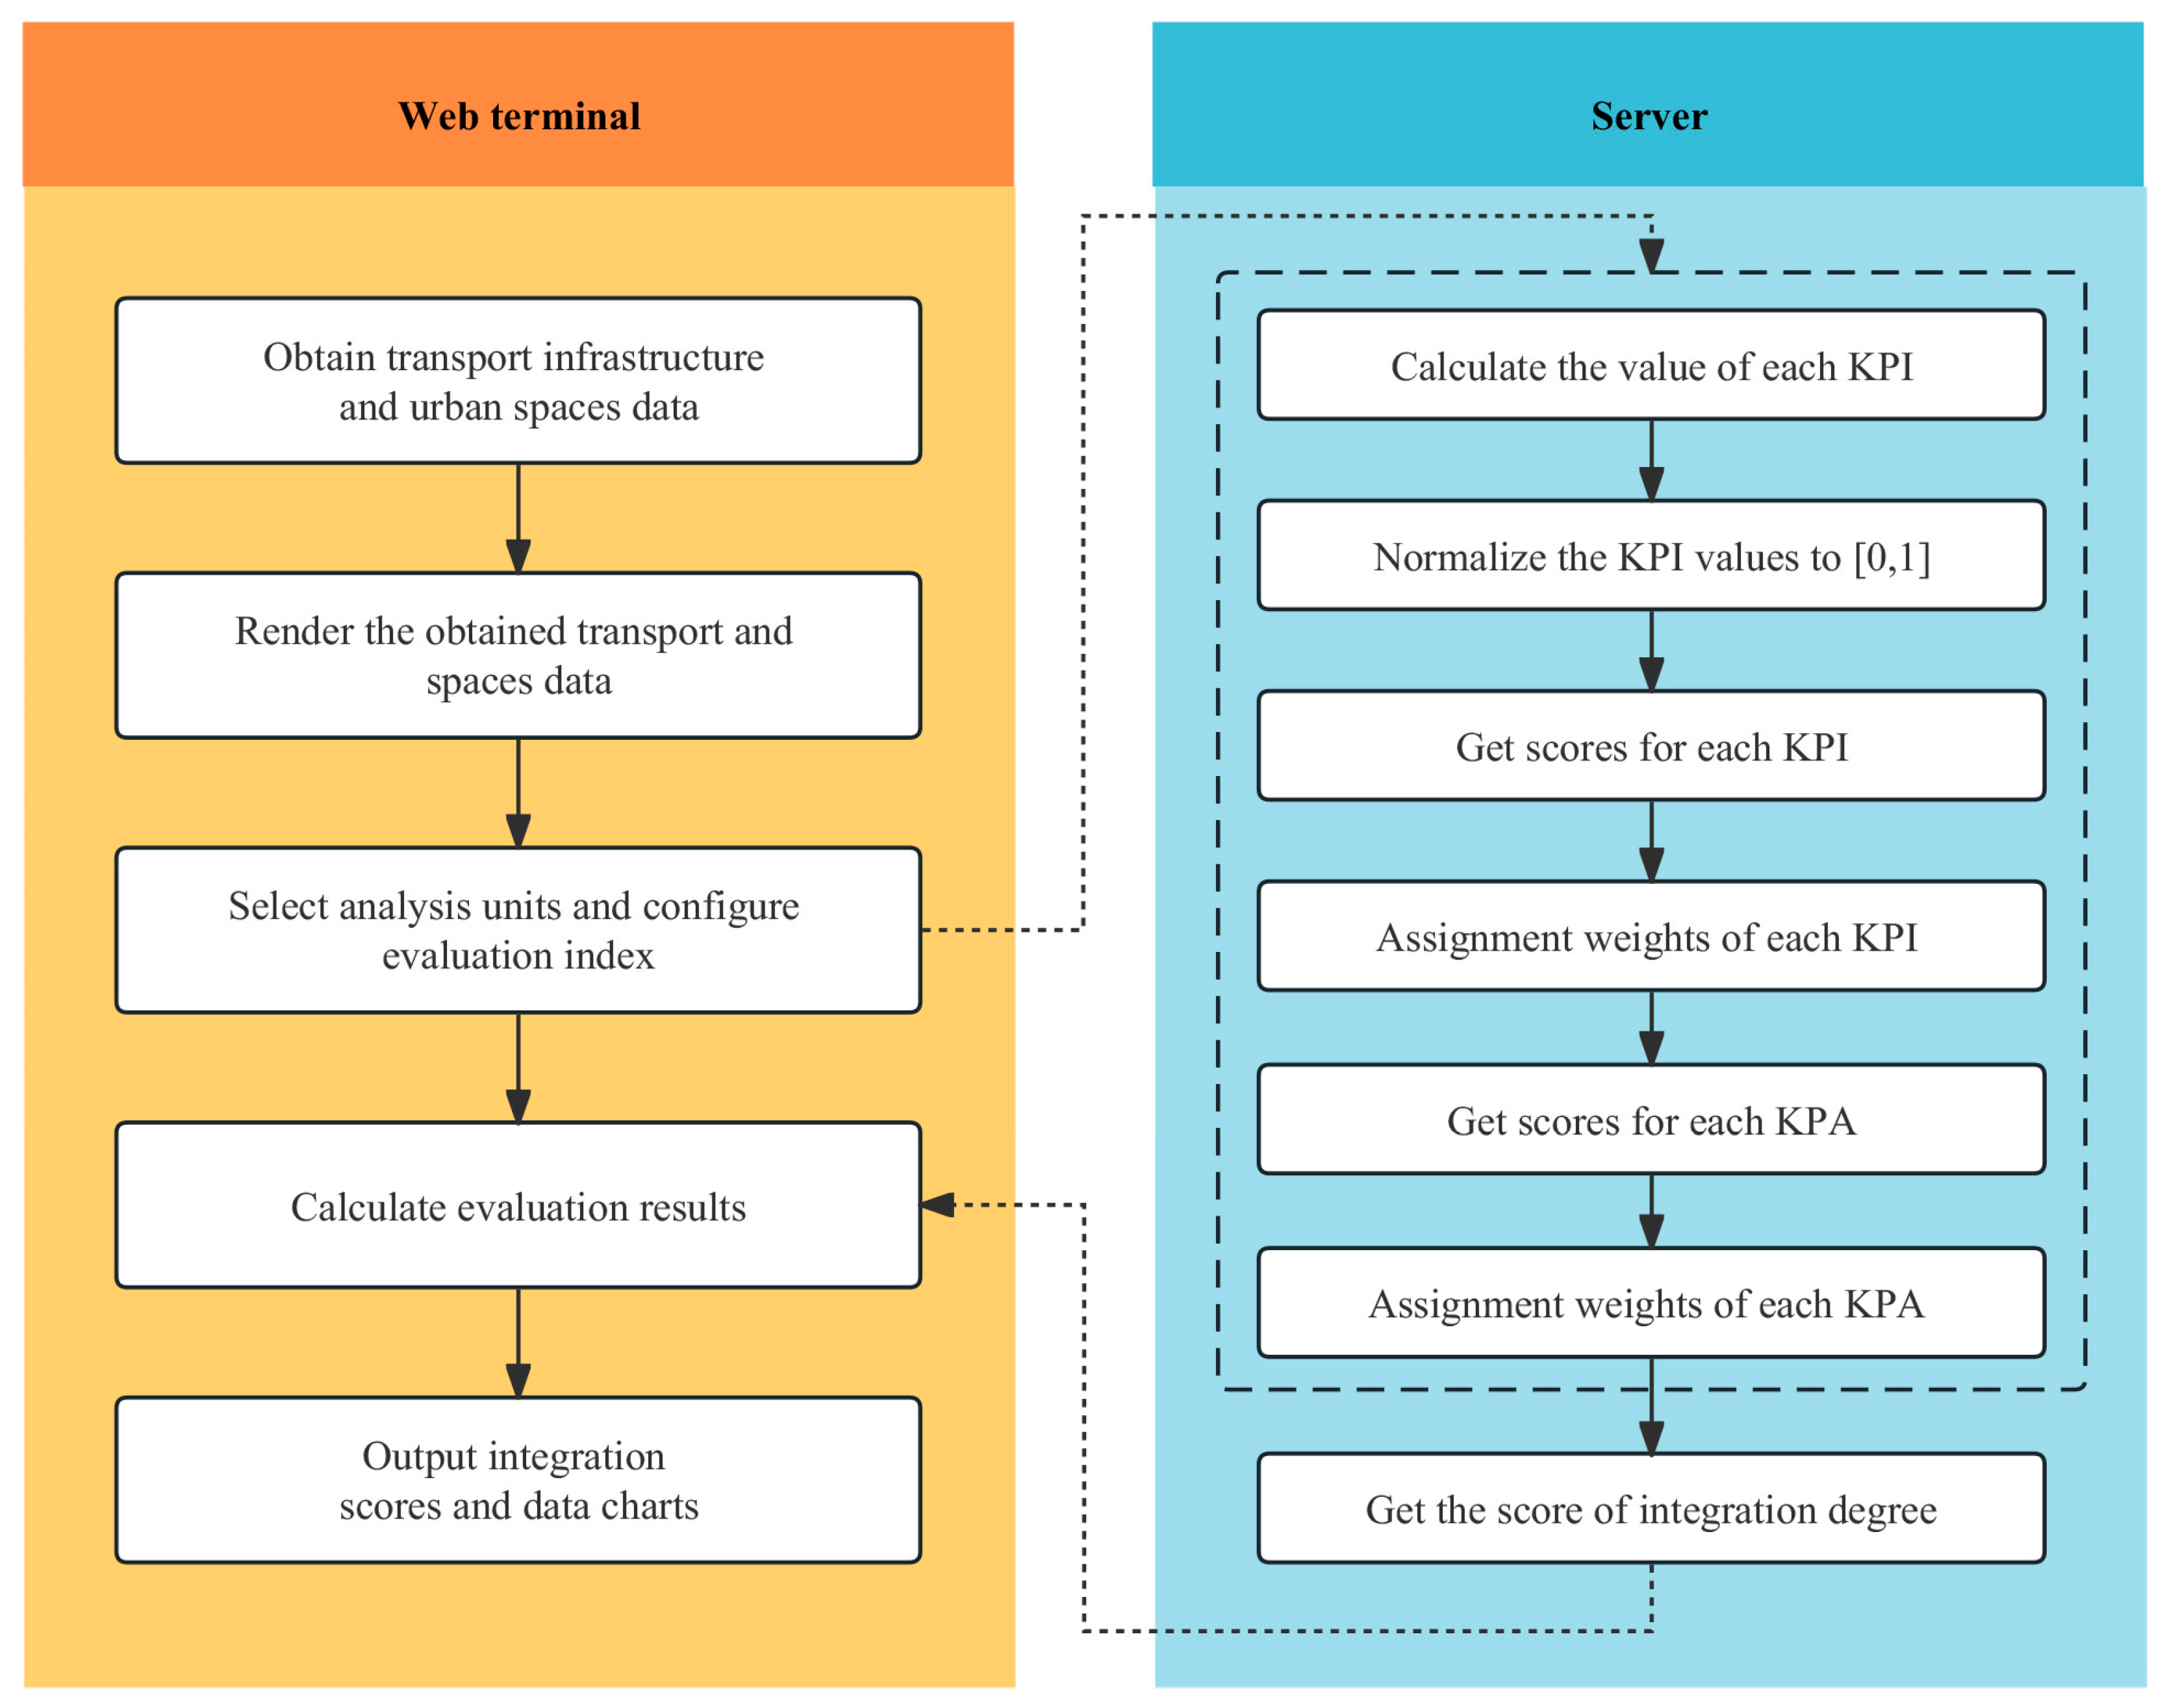
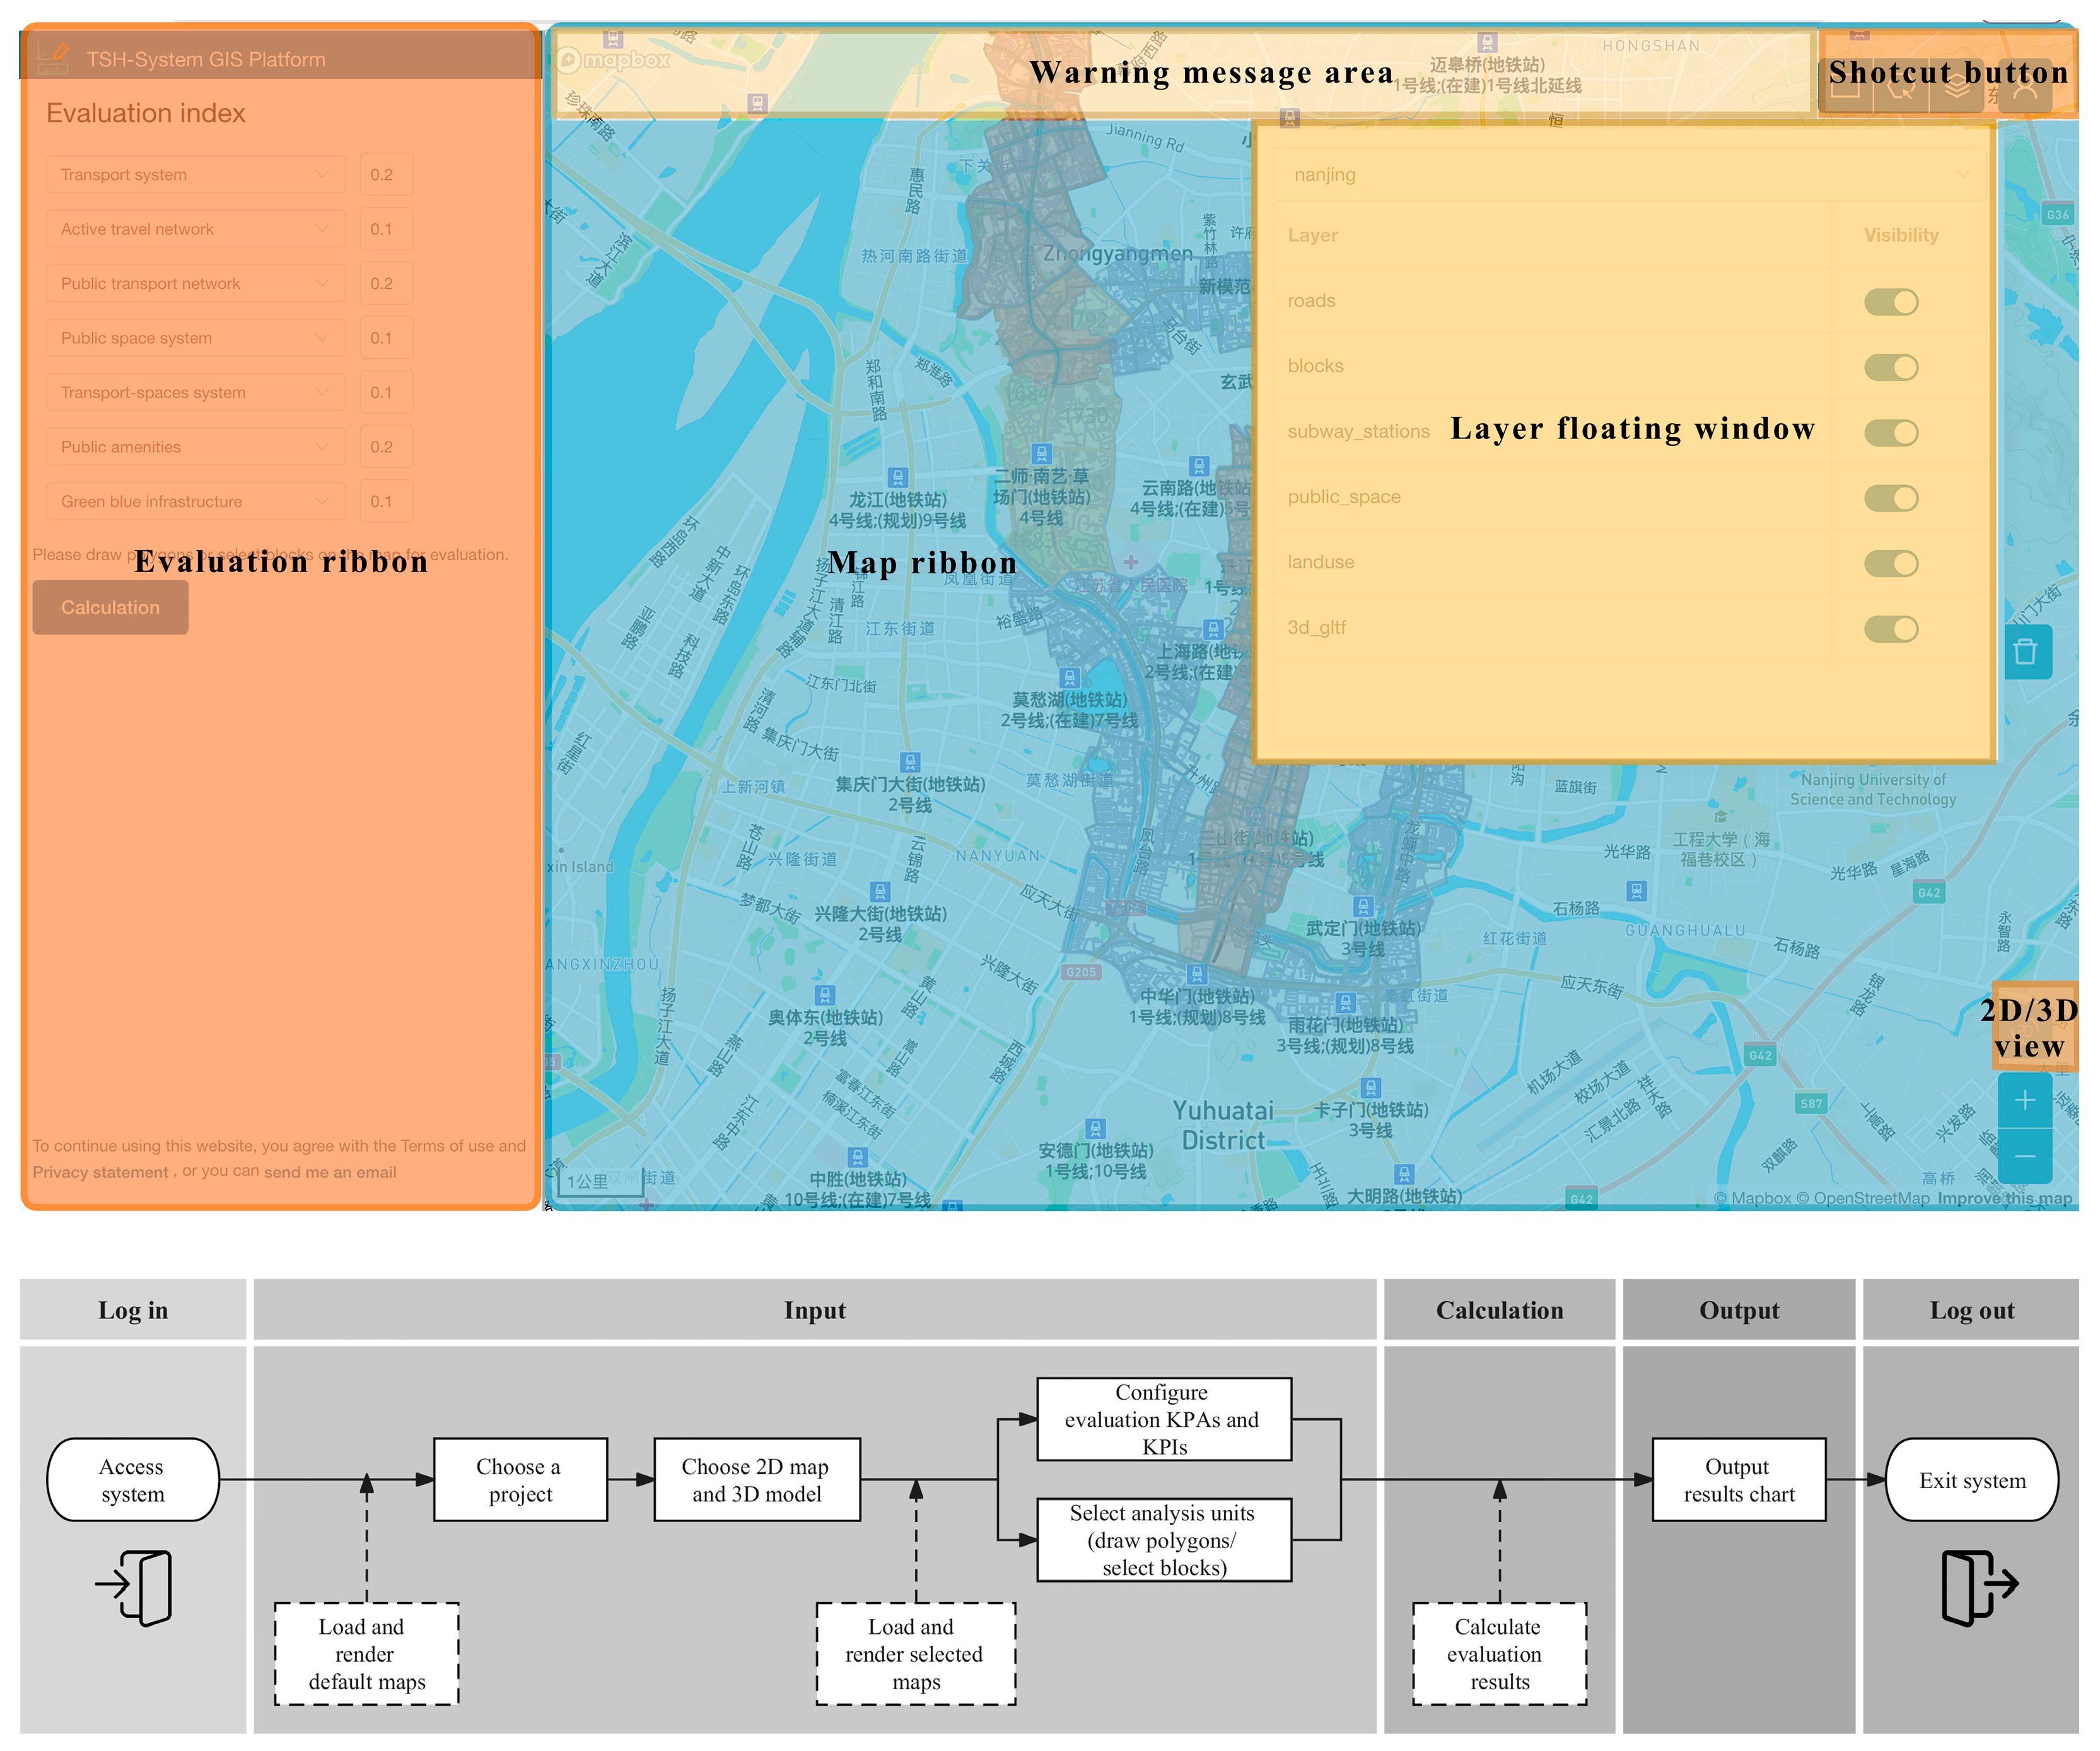
  • Web terminal: The web terminal comprises three essential layers, namely, the project management layer at the bottom, the map management layer in the middle, and the indicator management layer at the top. The project layer is dedicated to managing research or urban planning projects, while the map layer displays 2D maps/3D models included in a project facilitating the selection of research units. The indicator layer empowers users to configure the evaluation index and export evaluation reports. The web-side was written in JavaScript based on the VUE framework (https://vuejs.org/ accessed on 14 December 2023). The rendering of 2D maps and 3D models are performed using Mapbox (https://www.mapbox.com/ accessed on 14 December 2023).
  • Server: The server is bifurcated into a service layer and a business logic layer. The basic service layer is responsible for providing a database (using MySQL) and file storage capabilities (stored in a cloud file server). The business logic layer is entrusted with tasks such as user authentication, the processing of 2D GIS data and 3D model data, and index calculation. The 2D data processes were written in Python based on the open-source Flask framework (https://flask.palletsprojects.com/en/3.0.x/ accessed on 14 December 2023). Geographical analyses were conducted using Python’s GeoPandas library (https://geopandas.org/ accessed on 14 December 2023). The 3D data parsing uses Three.js (https://threejs.org/ accessed on 14 December 2023).
  • Interface: The interface unit acts as the link between the web terminal and the server terminal. It seamlessly facilitates the input and output of the data.

3.2. Evaluation Index Setup

In previous research, Yang et al. [33] constructed an indicator set for designing sustainable and integrated transport infrastructure and urban spaces by employing a multicriteria analysis (MCA) method. The MCA is an objective and systematic method for considering multiple criteria while constructing an evaluation system. The goals–achievement matrix technique was employed for the MCA [34], following a three-step framework:
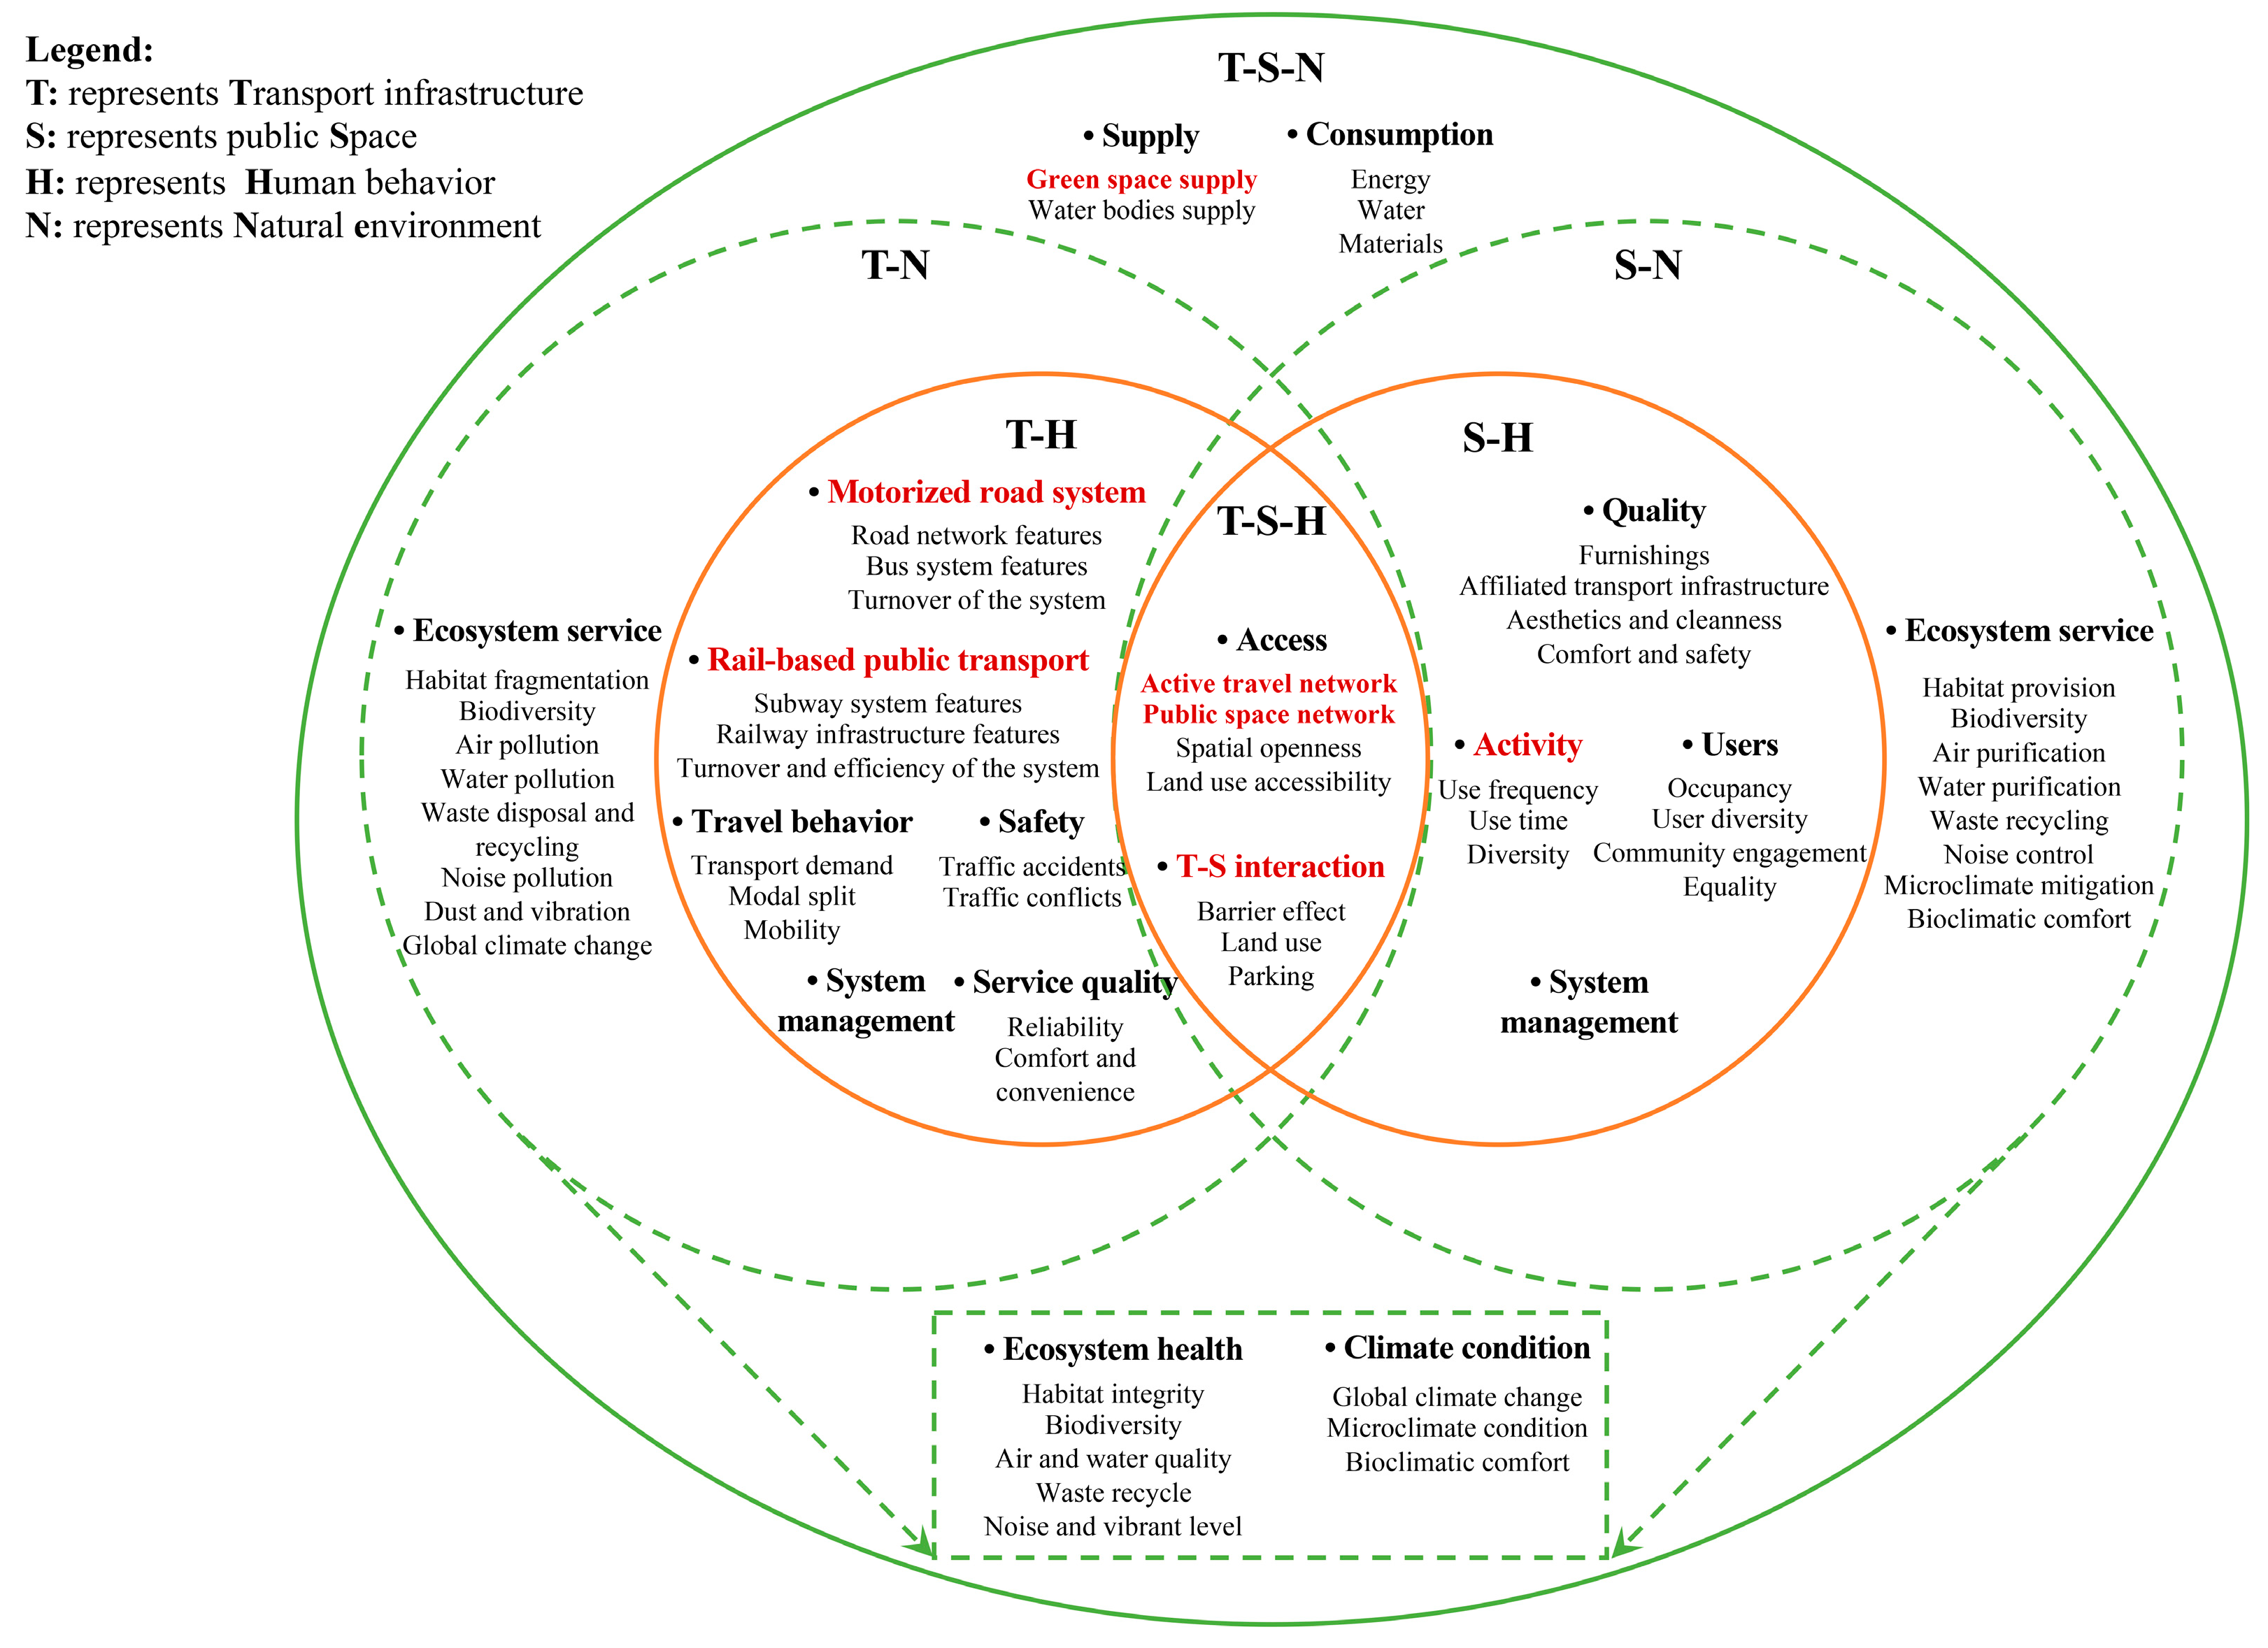
  • Construction of a goal system: Based on complex systems theory, an integrated TSH system should achieve both sector internal integration (i.e., transport and spaces systems) and external integration with other sectors, such as ecological systems. Therefore, a three-level goal system was developed: Level 1 achieves integration within the transport system and the spaces system, Level 2 accomplishes mutual reciprocity between the two systems, and Level 3 reaches reciprocity between the transport–spaces system and the external environment.
  • Identification of KPAs and KPIs: On the basis of the goal system, a systematic literature review was performed by searching the databases of Web of Science and Scopus. To extract the KPAs (i.e., themes) from the identified publications, the CiteSpace technique was employed, and content analysis was conducted. The KPIs were then chosen for each KPA through a thorough examination of the selected literature. Furthermore, a comprehensive review of the references cited in the selected literature and those in which they were mentioned was performed.
  • Development of an indicator set: Finally, an indicator set was developed through a process of longlisting, shortlisting, and consultation with ten experts in transport and urban planning. Figure 6 presents the final indicator set.
On the basis of this indicator set (the bold red items in Figure 6) and the indicators mentioned by the survey and interview participants, this research selected seven KPAs to cover aspects of the transport system (motorized traffic, active travel, and public transport), public space system, human activity, transport–space systems’ interaction, and the natural environment.
In this first version of the tool, each KPA is calculated by using one representative KPI, which was selected based on the literature and the reason for choosing each KPI is as follows. A list of the KPAs and KPIs is presented in Table 3.
KPA1—Motorized transport system: Previous studies [35,36] have frequently employed road density metrics to examine the quality of motorized transport networks. A higher density indicates smaller block sizes and increased accessibility, contributing to enhanced urban livability. Therefore, KPI1 road density was chosen to measure motorized transport system.
KPA2—Active travel system: New urbanists advocated for street networks with higher connectivity over those with numerous cul-de-sacs and long blocks [37]. The latter tend to increase distances between destinations, potentially discouraging walking and cycling. Consequently, network connectivity is a pivotal indicator for measuring the quality of an active travel network and street vitality [37,38,39,40]; thus, it is defined as KPI2.
KPA3—Public transport system: Among other public transport modes, subway systems have garnered increasing attention [41,42] due to their capacity to accommodate larger passenger volumes compared to buses and their pronounced mutual impact on the spatial configuration of urban spaces, surpassing that of railways. The accessibility of subway stations is a critical indicator for understanding the characteristics of a public transport network [41,43,44]; therefore, it was chosen as KPI3.
KPA4—Public space system: For public space system planning, accessibility is a fundamental objective, describing the convenience and potential for people to reach specific public spaces [45,46]. Bertolini et al. [47] defined accessibility as the number and types of places people can reach within a certain time and/or cost of transport. This project assesses public space accessibility, KPI4, within a 5 min walk, which is a generally accepted and desirable distance for pedestrians.
KPA5—Activity: Point-of-interest (POI) data are widely used to represent the richness of public amenities and activities in a particular area [35,48,49]. These data include geospatial information about various destinations related to residents’ activities, such as parks, schools, hospitals, libraries, restaurants, and recreational facilities. Therefore, this research chose POI accessibility within a 5 min walking distance as KPI5.
KPA6—Transport–space interaction: Urban researchers [5] and various governments, including the United Kingdom [50], the United States of America [51], and Denmark [52], have outlined methods for evaluating community severance in transport appraisal manuals. Among others, Denmark proposed detailed methods that consider traffic variables, the number of crossing facilities, and crossing needs [4,52]. On this basis, this research introduces a buffer effect index (BEI) to capture transport–space interactions, as outlined in Section 3.4.
KPA7—Natural environment: Green space is an integral component of the natural environment [53]. Evaluating the green space supply involves complex considerations, including trees, grasslands, hedges, and flower ponds. De La Barrera et al. [54] proposed assessing green spaces based on quantity, size, quality, and spatial distribution. One of the fundamental indicators of quantity and size assessments is the per capita green area [55,56], which was chosen as KPI7 in this paper.

3.3. Data Preparation

Given that street blocks are the prevailing units of analysis in urban design practices [57], this study primarily centers on street blocks as the spatial units for analysis, although it also provides analysis for user-defined polygons. Street blocks were initially defined as groups of plots bounded by streets [58]. However, with the expansion of cities, natural elements and linear transport infrastructures, such as railways, became enveloped within metropolitan areas. Building upon this and referring to Liu and Long [59], this study defines blocks as areas enclosed by road buffers (e.g., motorways, main roads, and secondary roads) and natural or infrastructural boundaries, such as water bodies, highways, and railways. The code developed for generating street blocks is available online (https://github.com/no0o0oname/urban_blocks_generation accessed on 14 December 2023).
The data sources chosen for evaluating the different KPIs are listed in Table 4. Because of the fact that data availability might differ depending on the regions and countries in which urban planners work [30], this study selects datasets that encompass data from various cities worldwide.
To facilitate the calculation of the KPIs, all 2D data underwent preprocessing in advance. They were initially converted to GeoJSON files and uniformly stored in a cloud file server. There is also a MySQL database that records the meta information of all GeoJSON files.
In the road network data, there is a MAINKEY feature, which provides information about the type and hierarchy of roads. Using this feature, the motorized road and nonmotorized road networks were generated separately. For example, MAINKEY = 20002 is an expressway, which belongs to the motorized road network, while MAINKEY = 20013 is a sidewalk, belonging to the non-motorized road network. The road data were then preprocessed in Python to capture the endpoints and intersections of the road segments, which were stored in nodes.geojson.
Land use data from “Annual Maps of Global Artificial Impervious Areas 2018” and OpenStreetMap (https://www.openstreetmap.org/ accessed on 14 December 2023) were processed to generate land uses, public spaces (include parks and squares), and green spaces (include parks, green buffers, and forests). Here, the TYPE feature in land use data was used to differentiate twelve types of land use: 101—residential; 201—business office; 202—commercial service; 301—industrial; 401—road; 402—transport stations; 403—airport facilities; 501—administrative; 502—educational; 503—medical; 504—sport and cultural; and 505—park and greenspace. Such data were then checked and supplemented by an on-site survey.
As for the 3D model, data were saved in .gltf files and parsed using Three.js. The parameters, like longitude, latitude, zoom ratio, altitude, and rotation angle, were set to display the model in the memory precisely. Afterward, the model generated with Three.js was inserted as a layer in Mapbox to complete the display.

3.4. Calculation Method

To calculate KPI1 (road density), a multistep process was adopted to consider the roads around each street block [61]. Initially, the city was divided into a 100 m × 100 m grid network. Next, using the motorized road network data, the road length within each grid cell was determined. Afterward, the grid network was overlayed on the block network, and the total road length for each block was aggregated. Finally, road density was computed by dividing the road length by the area of each block.
To calculate KPI2 (active travel connectivity), measurements such as block length, block size, and connected intersection ratio (CNR) are commonly used [62]. CNR, in particular, can intuitively reflect the proportion of dead-ends in a road network, and it was used in this study to quantitatively evaluate the connectivity of walking and cycling road networks. The value of the CNR was measured by calculating the number of intersection nodes (Nintersection) and the number of endpoints (Ndeadend) on walking and cycling streets using the file nodes.geojson (see Equation (1)). The CNR ranges from 0 to 1, with higher values indicating better road network connectivity and fewer dead-ends.
C N R = N i n t e r s e c t i o n N i n t e r s e c t i o n + N d e a d e n d
As for KPI3 (accessibility of subway stations), the analysis of pedestrian catchment area has widely been used as a measurement method [63,64]. To calculate the catchment area, researchers [64] have applied a buffer method, implemented using GIS, by creating a distance buffer around the transit stops. This study adopted such a buffer method by calculating the percentage of the block area within the catchment areas of subway stations. The catchment area was defined as within 800 m of subway stations, based on guidelines from the Chinese Urban Comprehensive Transportation System Planning Standard and the rule of thumb that the catchment area of a rail station is approximately half a mile.
Similar to the calculation of KPI3, KPI4 (public space coverage within a 5 min walk) was calculated as the size of the block within 300 m of public spaces divided by the total area of the block. KPI5 (POI accessibility within a 5 min walk) was determined by summing the number of POIs that can be reached from that block within 300 m [48,49].
As for KPI6, BEI was designed to assess community severance. It was calculated by considering the Barrier to pedestrians and the block’s need for Crossing (see Equation (2)) [4]. A higher BEI indicates a lower degree of the barrier effect, signifying fewer negative impacts from transport infrastructure. Barrier was determined using Equation (3), and Crossing was measured according to the type of land use in a block (see Table 5).
B E I = ( B a r r i e r × C r o s s i n g )
B a r r i e r = 0.1 T × 0.63 + 1.87 H × 1 0.05 K × L
where T represents traffic (vehicles/day), H indicates the proportion of heavy vehicles, K is the number of crossing facilities, and L represents the length (km) of road segments. Here, the default value of T was determined by the design capacity of roads at different levels, referring to the Technical Standard of Urban Road Engineering [65] and Technical Standard of Highway Engineering [66].
KPI7 (public green space area per capita) was calculated as the total area of public green space in the block divided by the total population in the same block [56]. Public green space includes parks, green buffers, and forests.
The values of the KPIs were normalized using the min–max transformation technique, which scales the original data linearly to a range of 0 to 1 based on their minimum and maximum values. Each KPI’s value was then assigned to its corresponding KPA (since the prototype tool calculate one KPI for each KPA). The KPAs were then calculated by multiplying the normalized KPI values by the respective weights of each KPA. The overall Score for an analyzed area is obtained by summing all the weighted KPAs, with higher scores indicating greater integration (see Equation (4)).
S c o r e = i = 1 7 ( K P A i × W i )
where i indicates the KPA indices and W i denotes the weight of K P A i .

3.5. Use Process and Visualization

As shown in Figure 7, users should first register and log in to utilize the tool. Once logged in, they can load a project and select GIS layers and 3D models for visualization. The tool offers 2D and 3D modes for data visualization using the Shortcut button. Users can then configure an indicator system by selecting KPIs for each KPA and assigning weights in the Evaluation ribbon.
Subsequently, users can choose an area for analysis by drawing a polygonal shape or selecting street blocks on the screen. The system then calculates KPIs and KPAs and returns an overall score for the selected area. This score is displayed in the Evaluation ribbon and is visually represented as a radar chart, illustrating the score for each KPA. Users also have the option to download a report for the selected area.

4. Case Study

To demonstrate how the GIS platform can be used to provide decision-making support to key stakeholders, this section shows a detailed case study that applies this tool to three urban areas within Nanjing, China. The data input and an evaluation index are described with a general description of the results generated.

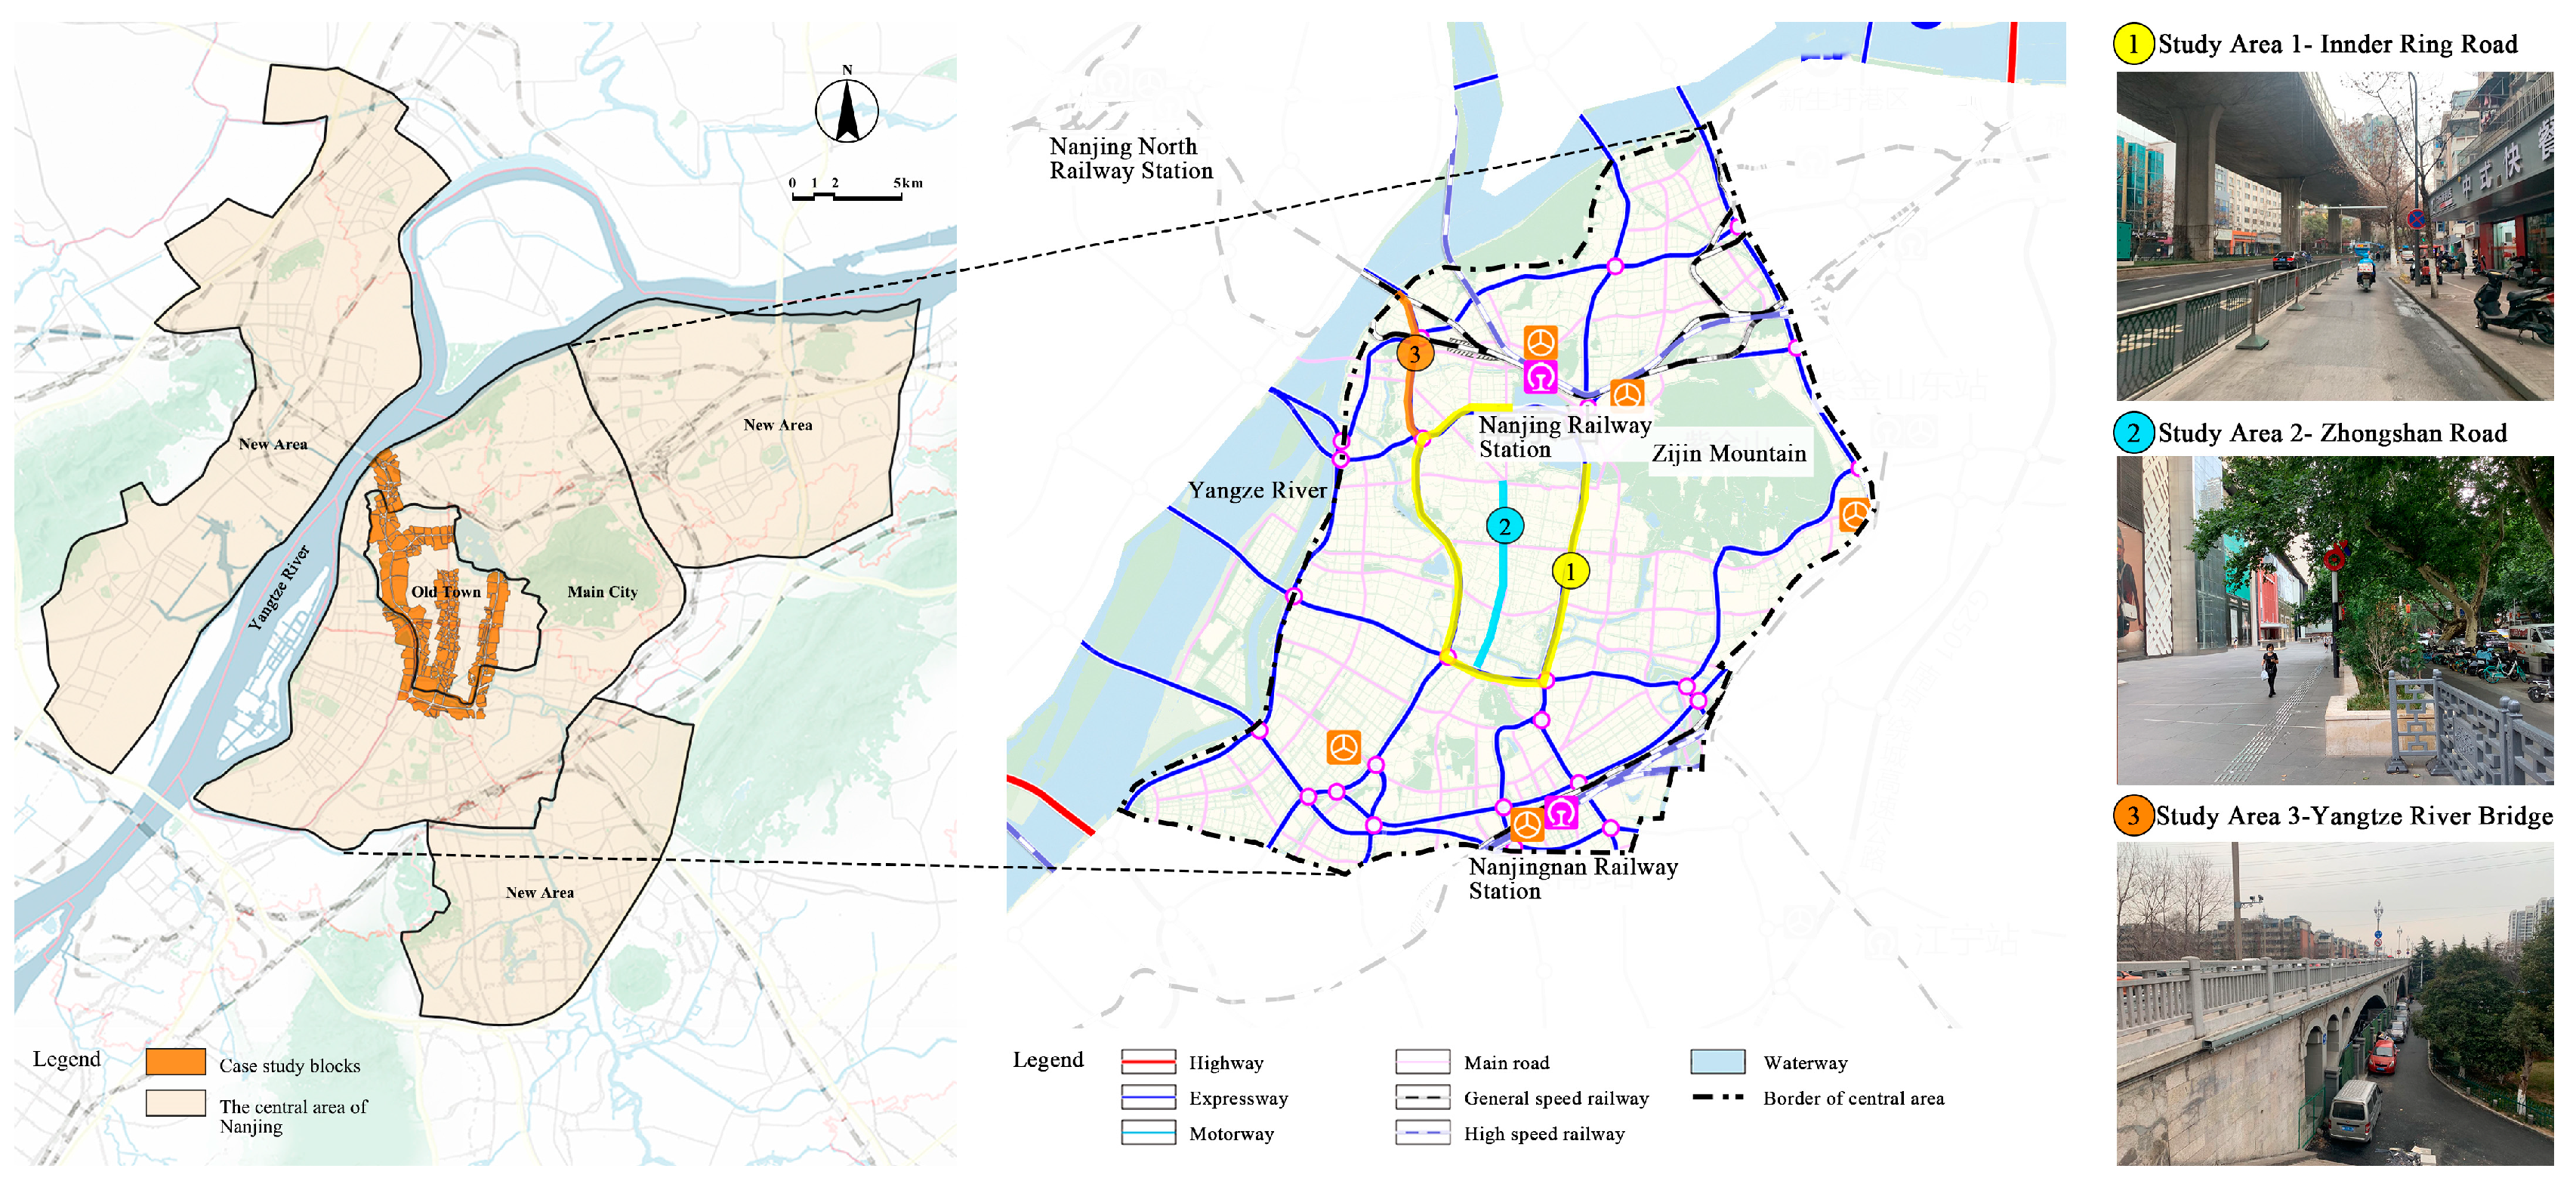
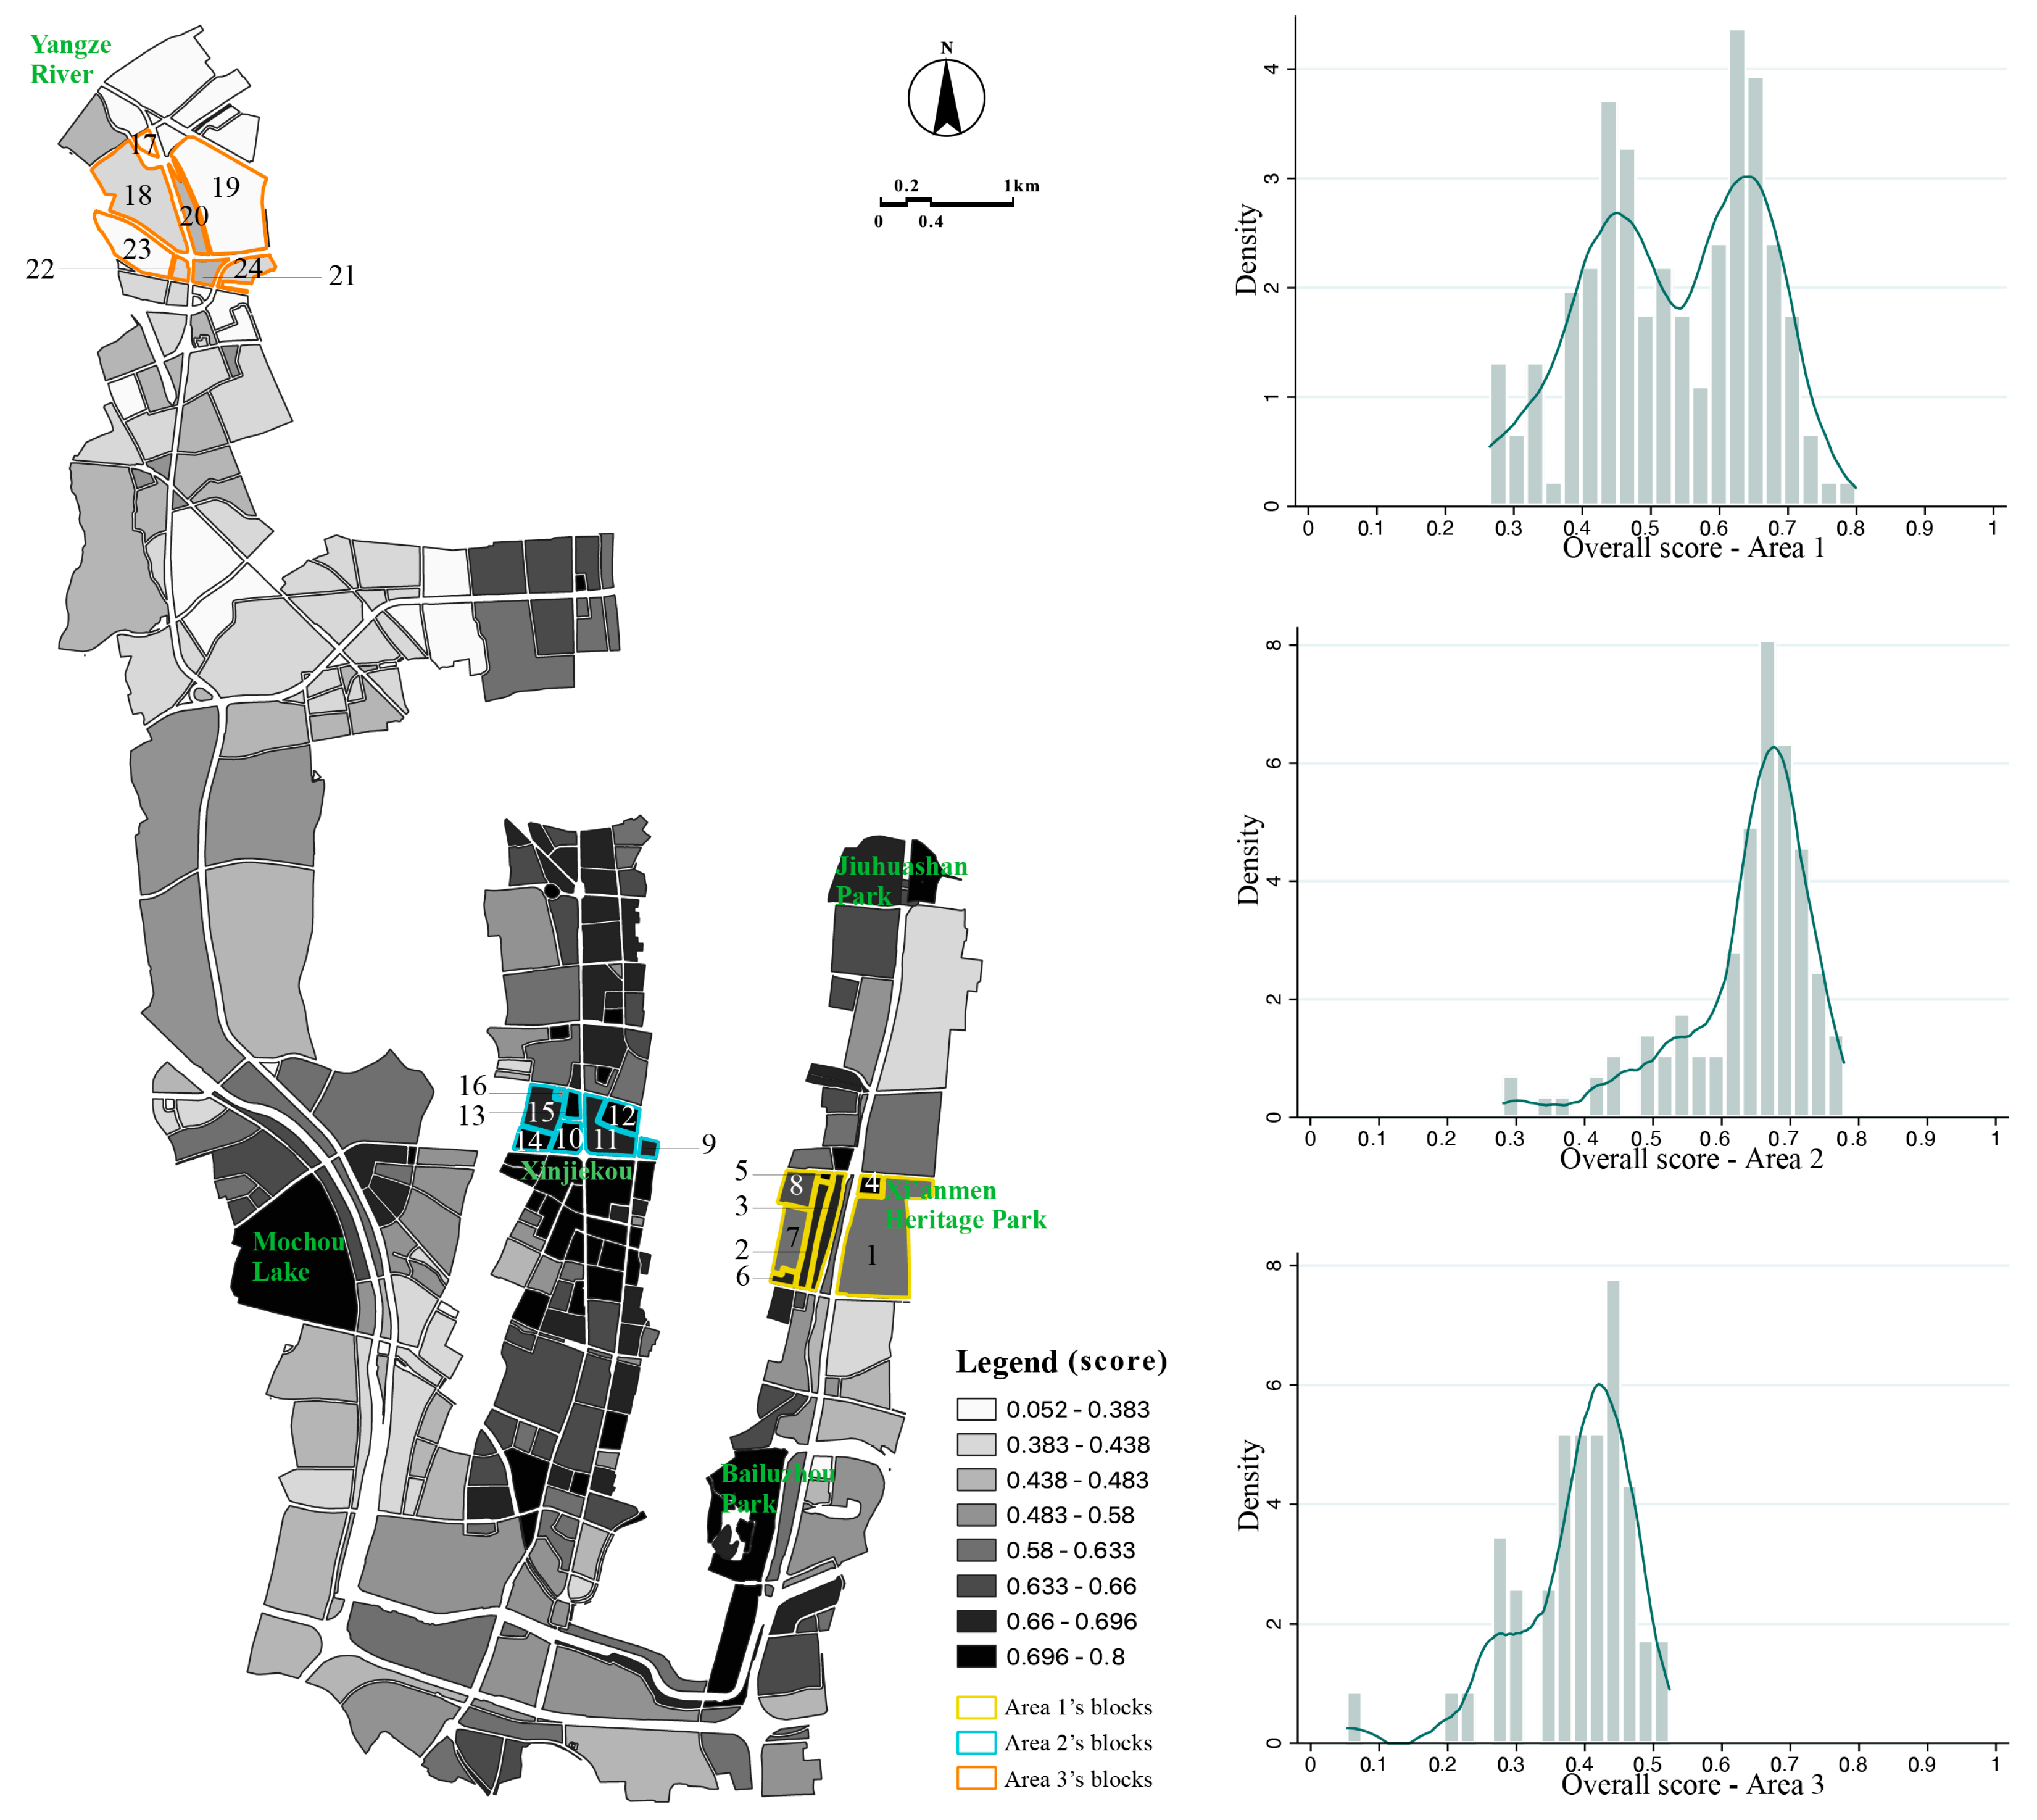
4.1. Site Description

Nanjing is the capital city of Jiangsu province in China and is situated within the Yangtze River Delta city cluster. The city covers an administrative area of 6600 square kilometers and has a recorded population of over 9 million as of 2020 [67]. Nanjing is renowned for its historical and cultural significance, having served as the capital of various Chinese dynasties. According to the Nanjing 2018–2035 Master Plan, the central area of Nanjing comprises three urban regions: the Old Town, Main City, and New Area. The Old Town is enclosed by a 14th century city wall, with the Xinjiekou commercial area at its center; the Main City expanded outward from the Old Town, while the New Area developed mainly after 2000.
In this research, three study areas within the Old Town and Main City were selected to analyze the correlation between urban spaces and the transport infrastructure. These areas are characterized by distinct types of infrastructure: an expressway, a main road, and a railway. Here, tensions between extensive transport infrastructure development and public spaces are severe, often resulting in a barrier effect (see Figure 8).
Area 1 surrounds the Nanjing Inner Ring Road, an expressway featuring full interchanges. This road includes elevated, ground-level, and tunnel sections, dividing the urban fabric into separate spaces. Area 2 surrounds Zhongshan Road, which is a main road that is 2 km in length and 40 m wide, located in the city center. The southern section is part of the Xinjiekou business district and represents a significant part of Nanjing Zhongshan Avenue, one of China’s first modern main roads. Area 3 encompasses the Nanjing Yangtze River Bridge, a double-decked road–rail truss bridge spanning the Yangtze River. It was the first major bridge designed and constructed using Chinese expertise. The elevated section of the bridge extending into the city center often experiences traffic congestion and community disruption; thus, it was chosen as the third study area.

4.2. Data Input and Integration Evaluation

For performing analysis, geographic and sociodemographic data were collected according to Table 4. By conducting an on-site investigation, GIS data were checked and 3D models were developed in SketchUp. Blocks located within a walking distance of 300 to 500 m from the selected transport infrastructure were analyzed, yielding a total of 334 blocks.
To calculate the integration score, the following weights was assigned to the KPIs: road density, 0.1 (KPI1); active travel network connectivity, 0.2 (KPI2); subway accessibility, 0.2 (KPI3); public space 5 min accessibility, 0.2 (KPI4); POI 5 min accessibility, 0.1 (KPI5); barrier effect index, 0.1 (KPI6); and per capita public green area, 0.1 (KPI7). The assigned weights aimed to emphasize sustainable transport modes and public spaces in urban design, as recommended by the interviewees. Figure 9 provides an example of the evaluation index and results, along with 2D and 3D visualizations of the data.

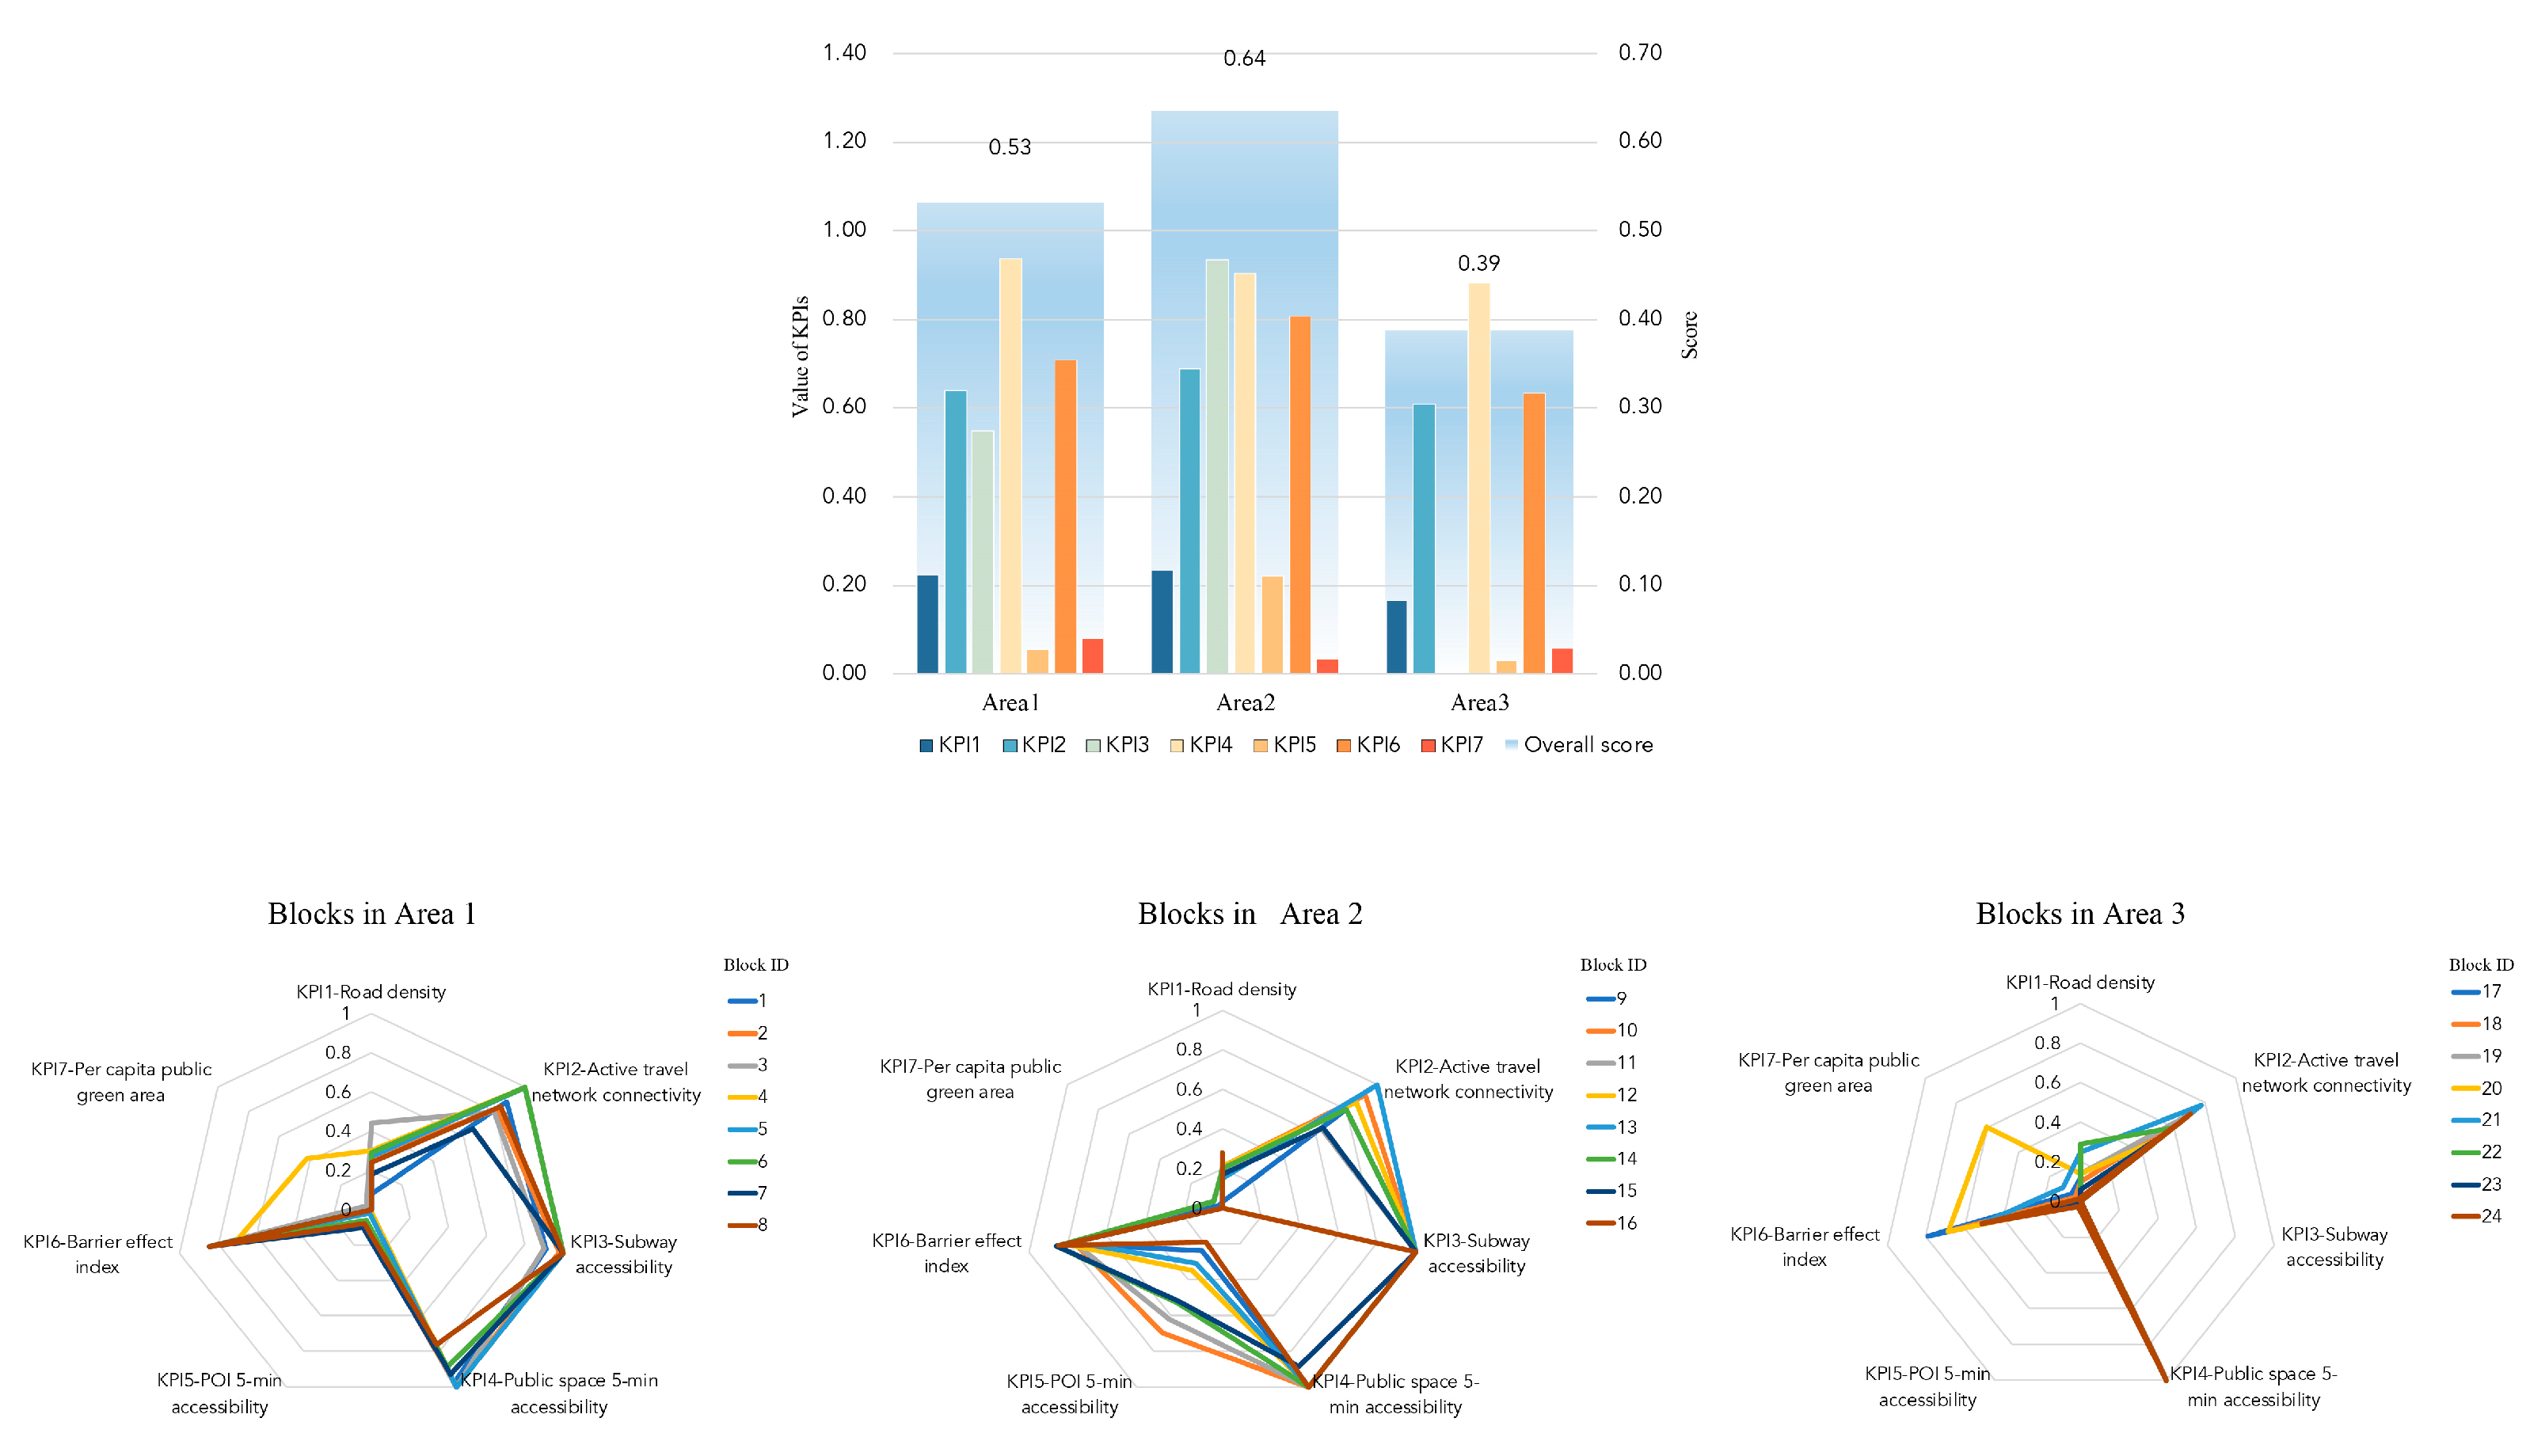
4.2.1. Overall Scores of the Three Areas

The overall scores of the blocks in Area 1 exhibit a bimodal distribution, with concentrations at 0.45 and 0.65, and an average score of 0.53 (see Figure 10). The blocks with high environmental quality and pedestrian friendliness, such as Jiuhuashan Park, Xi’anmen Heritage Park, Bailuzhou Park, and Mochou Lake, have a high integration degree and are less negatively impacted by the surrounding expressway. Conversely, other blocks near the expressway experience lower integration due to the presence of the linear infrastructure.
In Areas 2 and 3, block scores follow unimodal distributions, with concentrations around 0.64 and 0.39, respectively. The highest scores in Area 2 are found in the Xinjiekou commercial center, where the underground pedestrian network is well developed. However, the per capita green space is notably lacking and requires improvement. The blocks in Area 3 generally exhibit lower integration degrees, primarily due to the presence of the road–railway viaduct and other motorized roads. Notably, this area contains substantial green spaces for environmental protection along the Yangtze River.

4.2.2. The KPIs in Each Area

Figure 11 (top) provides insight into the overall integration score of the blocks in each area and the values of each KPI. In Area 1, KPI 4 and KPI 7 are high, indicating the presence of ample public space and per capita green areas. In Area 2, KPI 2, KPI 3, KPI 5, and KPI 6 are higher than in Area 1, suggesting that Area 2 is more pedestrian friendly, accessible to public transport, rich in activities, and exhibits lower community severance. In Area 3, the blocks score low in most KPIs compared to the other two areas, except for KPI 7. This is mainly due to the area’s significant green spaces for ecological conservation along the Yangtze River and a large amount of its underdeveloped land with low population density.
Next, this study provides examples of blocks from each area (24 in total) to further investigate specific issues (see Figure 10 and Figure 11). For instance, in Area 1, Block 4 is Xi’anmen Heritage Park, which scores relatively high in most KPIs except for POI accessibility. To improve its integration, more activities should be provided. In Area 2, blocks close to the center of Xinjiekou, such as Blocks 10 and 11 (where Jinling Hotel and Deji Shopping Mall are located), have the highest number of POIs and score high in most KPIs. However, the per capita green space is notably lacking and needs improvement.
Blocks in Area 3 are significantly affected by the road–railway viaduct and other motorized roads. For example, Block 24 is a residential area surrounded by a railway and an expressway. Although public space is available within the community, the barrier effect caused by the linear infrastructures is high. Additionally, issues such as the lack of activities and public green areas, along with the limited access to subway stations, need to be addressed. It is worth noting that, although the active travel network connectivity scored high, the quality of the walking and cycling environment was low and needs improvement. The high connectivity observed is primarily attributed to the numerous pathways in run-down slums identified during an onsite survey.

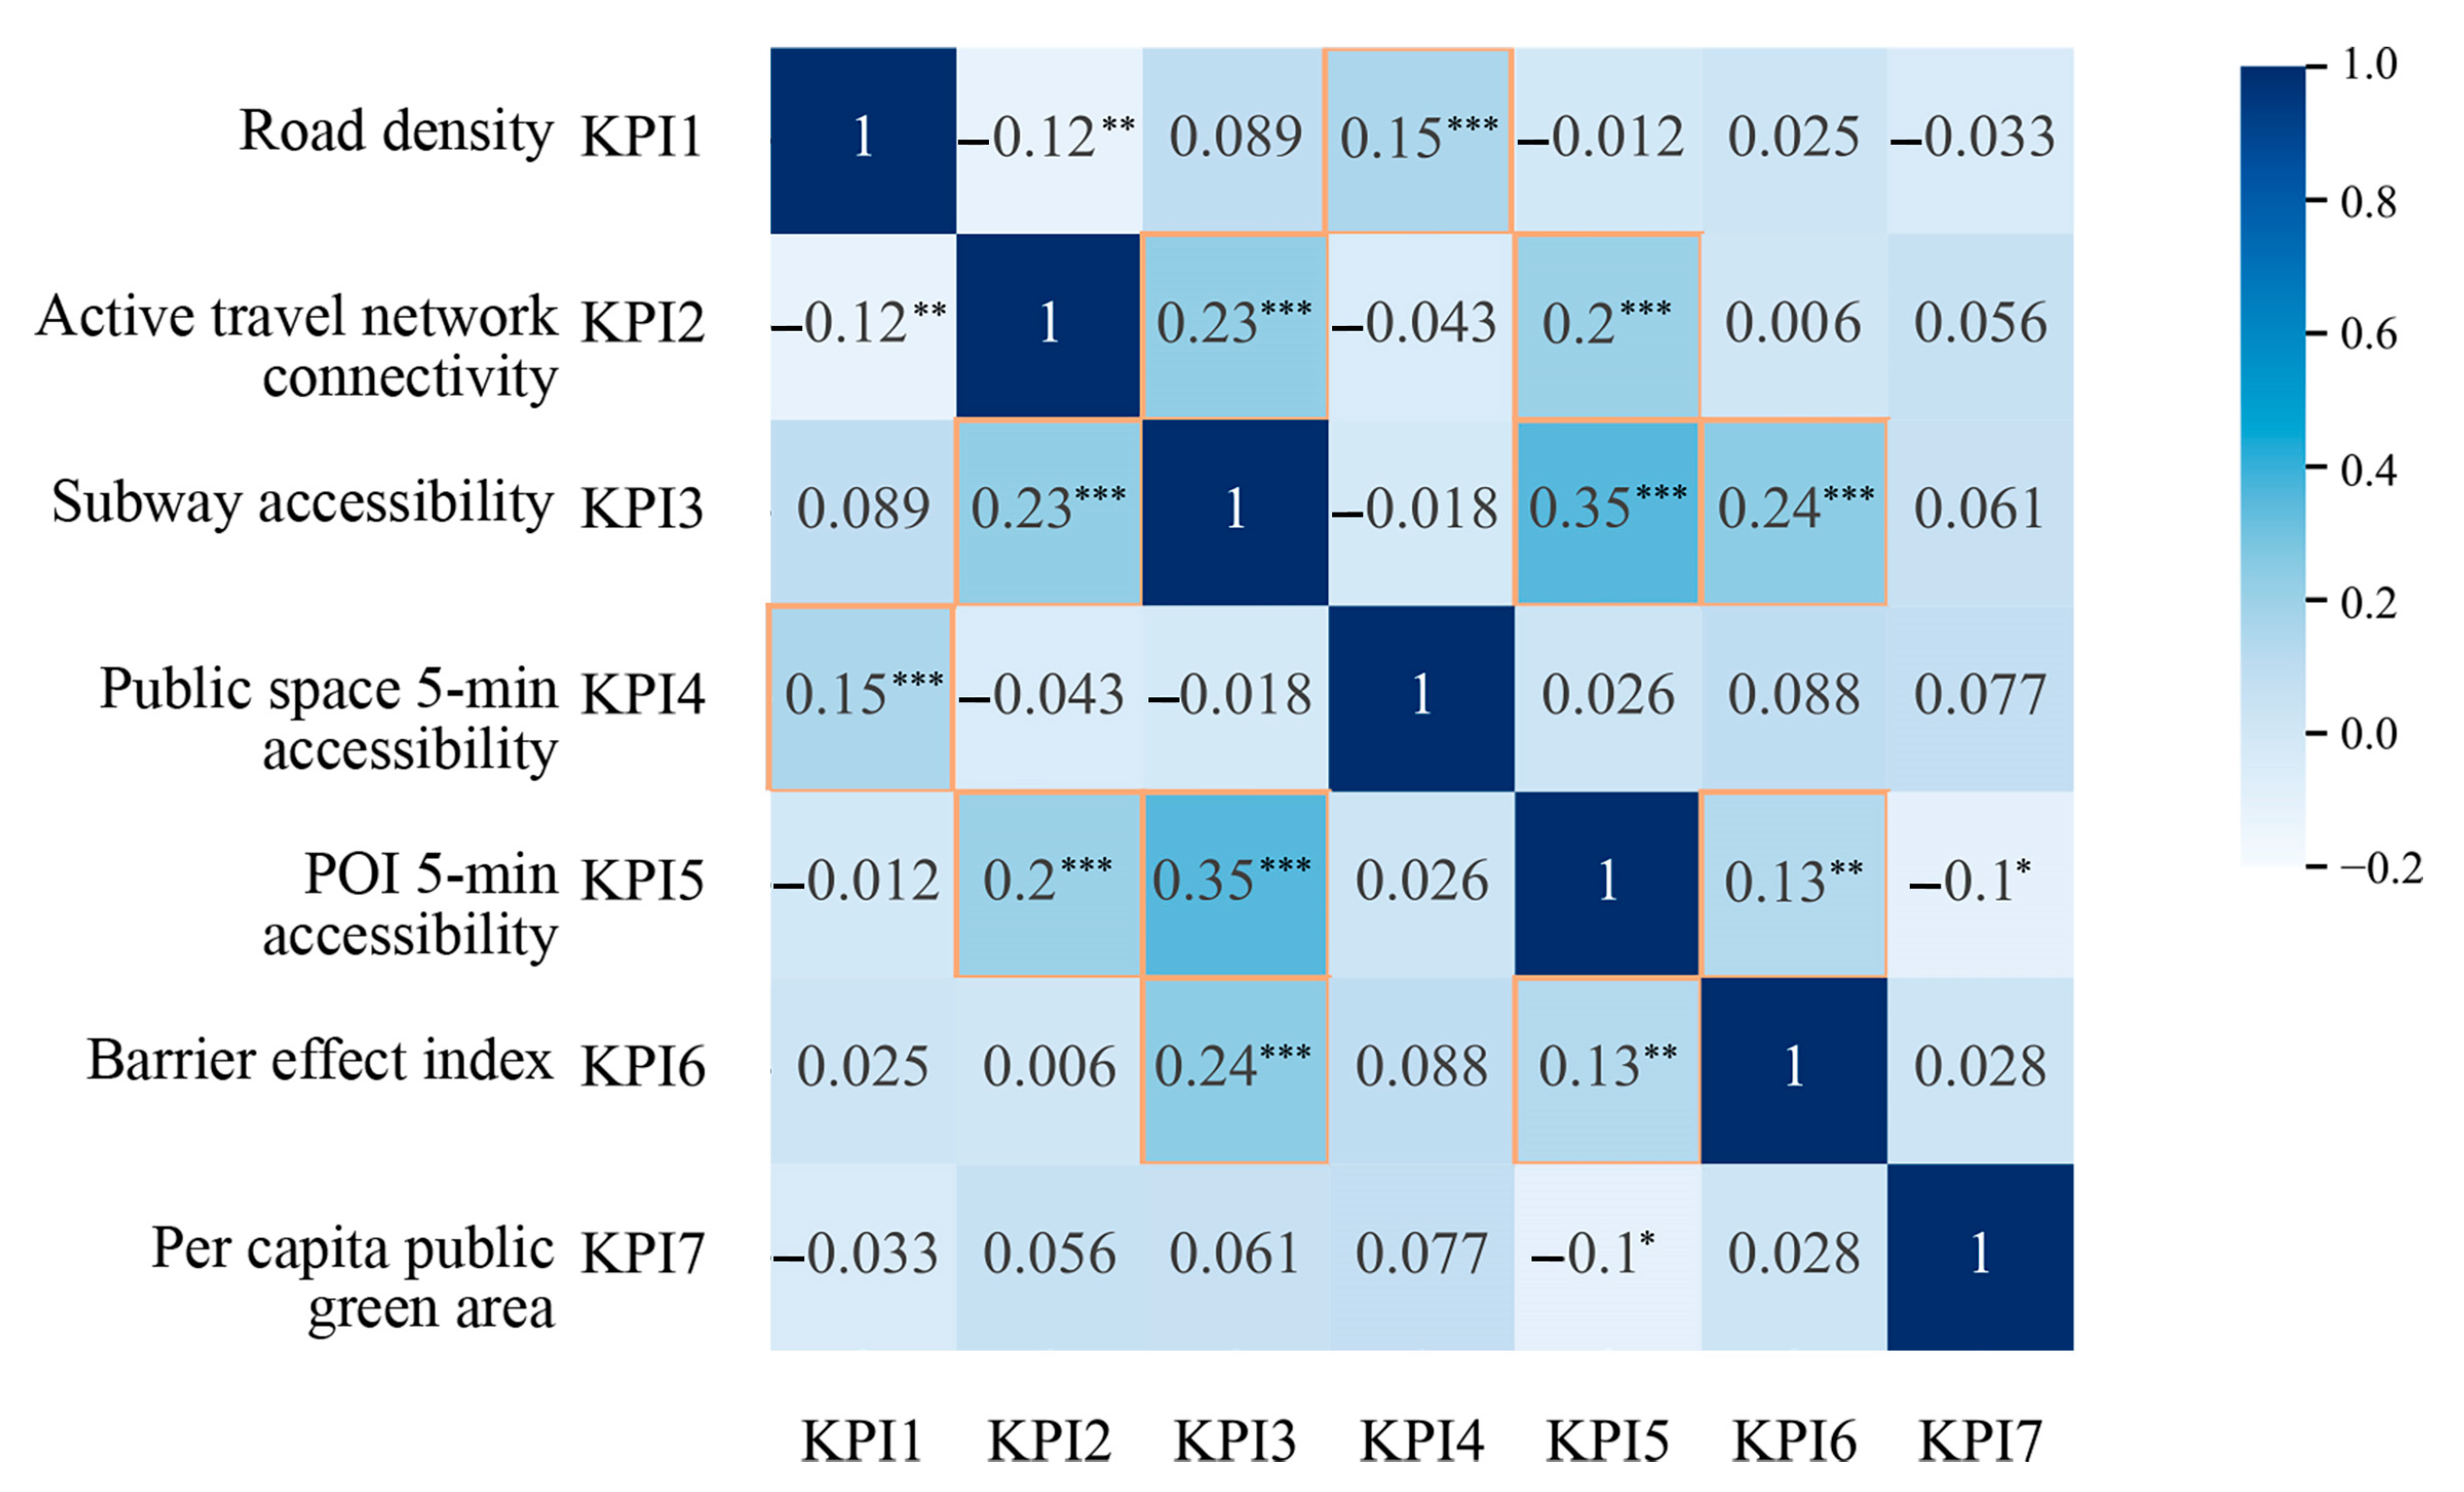
4.2.3. Correspondence between KPIs

Furthermore, to assist urban designers in coordinating the interactions among the TSH systems’ elements, correlations among the different KPIs were analyzed. As depicted in Figure 12, road density is significantly correlated with public space accessibility and also has relevance to active travel accessibility. Active travel accessibility shows a significant correlation with subway and POI accessibility, indicating that areas accessible to subway stations tend to have well-connected walking and cycling infrastructure and a high density of activities. This phenomenon may be attributed to transit-oriented development (TOD) strategies implemented in the city’s center. TOD initiatives emphasize the promotion of shorter distances to transit stations, the creation of connected road networks, and the concentration of activities to encourage the use of sustainable transport modes [68]. Subway accessibility is significantly correlated with POI accessibility and the BEI. On the one hand, locations accessible to subway stations attract a large number of people, leading to the emergence of commercial and cultural activities. Moreover, these locations are often equipped with multiple crossing facilities, which mitigates the barrier effect. On the other hand, established commercial and cultural centers require public transport infrastructure, thus leading to the construction of subway stations. Furthermore, POI accessibility also has a positive correlation with BEI, indicating that blocks less impacted by linear infrastructure are attractive for public services and activities.

5. Discussion

This paper introduces a prototype web-based geodesign tool tailored for urban designers to analyze and evaluate TSH system integration at the block scale. The TSH system GIS platform comprises a web terminal, a server, and an interface, which support the visualization, calculation, and output of the integration degree for a selected area of analysis.
To support different processes of urban planning and design, the platform can be introduced in the analysis stage to assist in understanding the interdependence of the system’s different components, as well as to quantitatively assess the integration of the status quo TSH system. The identified correlation among components and integration degree allow designers to select appropriate planning strategies in the design stage. Afterwards, the input GIS data can be changed according to alternative planning scenarios and be uploaded to the platform for evaluation purposes. The integration score can be used to support the decision-making process in selecting a plan or in redesign.

5.1. Urban Planning Insights from the Case Study

The tool was applied to a case study in Nanjing, China, to assess the integration degree of blocks adjacent to an expressway (Area 1), a main road (Area 2), and an elevated railway (Area 3). To prioritize the role of sustainable transport and public space in urban design, higher weights were assigned to these KPAs during the index configuration. On the basis of the evaluation’s results, this paper presents the following planning recommendations:
  • Blocks close to elevated railways (Area 3): These areas require urgent regeneration because of their negative impact on transport infrastructure. Regeneration efforts should focus on enhancing sustainable transport accessibility and providing additional public spaces, activities, green spaces, and crossing facilities.
  • Blocks surrounded by expressways (Area 1): Blocks that serve as destinations for public green spaces should be supplemented with various activities. For other blocks, urgent improvements to the accessibility of sustainable transport modes, activity provision, and crossing facilities are needed.
  • Blocks adjacent to main roads (Area 2): These areas should prioritize the creation of more public spaces and green areas.
The results shown in Figure 12 reveal that several components of the TSH system are positively correlated. To create an integrated TSH system, the design of these elements should be prioritized and carried out simultaneously. For example, an increase in the road density could be prioritized because of its positive impact on public space accessibility. Similarly, improving active travel accessibility benefits both subway and POI accessibility; thus, it should be emphasized. To mitigate the barrier effect, an increase in subway and POI accessibility may be beneficial.

5.2. Customizable and Expandable Evaluation Index for TSH System

In its initial version, the TSH system GIS tool includes seven KPAs and their corresponding KPIs. These KPAs covered different aspects of the TSH system, including motorized transport, active travel, public transport, public spaces, activities, transport–space interaction, and the natural environment.
Among others, the quantification of the interaction between transport infrastructure and public spaces has been challenging. Prior studies, such as those using LUTI models, struggled to capture the barrier effect exerted by transport infrastructure on block scale spaces and their pedestrians. Additionally, existing block-scale decision-making support tools, such as the Severance Tool in Microsoft Excel, lack spatial/geographic information and visualization capabilities. To address these gaps, this paper introduces a BEI into the TSH system GIS tool. The BEI considers barriers to pedestrians and the crossing requirements, enhancing the tool’s capability to quantify the interaction between transport and space.
The proposed GIS tool allows users to customize evaluations by assigning weights to each KPI and KPA. Calculations for each KPI were implemented as separate modules in the server, and such a modular architecture allows users and developers to extend the tool to align with specific projects.

5.3. Combined Quantitative–Qualitative Analysis and Visualization

To complement the quantitative assessments with qualitative insights, the results of each KPI/KPA were standardized to a range of [0,1]. These standardized values were then multiplied by their respective weights to produce an overall score for each block. This integration score offers designers an intuitive understanding, enabling the quick identification of less integrated street blocks for regeneration. Users can further compare different blocks by visualizing KPA values in star charts.
Furthermore, the GIS tool supports both 2D and 3D views. The 2D view displays block, road, land use, public space, and subway station data, aiding users in selecting the analysis area. The 3D view allows for the visualization of 3D models, such as viaducts, providing insight into the multidimensional spatial relationship between transport infrastructure and surrounding urban spaces. This enhanced understanding assists urban designers in making informed decisions.

5.4. Cross-Platform Collaboration

To overcome the limitations of desktop-based tools, like AutoCAD Map3D, CityCAD, and ArcGIS CityEngine, the proposed GIS tool offers a web terminal. This feature enables users to share and manipulate geographical data online. Collaborators on a project can easily upload their data to the dedicated website for other team members to access and utilize for various forms of analysis and evaluation. However, because of data security considerations, uploaded data are stored in distinct projects within MySQL, ensuring that users only have access to their respective projects. Moreover, this web-based GIS tool ensures cross-platform compatibility, making it accessible from different computer platforms, including Windows, macOS, and various web browsers. Such flexibility promotes broader collaboration among stakeholders, regardless of their preferred operating systems or devices. Furthermore, the tool’s online capabilities extend beyond convenience. It enhances data management by maintaining a centralized repository of project-related information.

5.5. Future Research Directions

This first version of the GIS tool encompasses seven KPAs to cover different aspects of the TSH system, with one representative KPI assessed for each KPA. Future work can expand the tool by adding more KPIs to evaluate the TSH system from various perspectives. For example, to assess the performance of the public transport system, metrics like bus stop density could be incorporated, while calculating water bodies supply could assist in evaluating the condition of the natural environment. To refine the analysis, subsequent surveys could seek input from urban design experts to determine the weighting for each KPA and KPI.
Furthermore, other datasets can be introduced. Currently, the default value for traffic was determined in the calculation of KPI6 by using the design capacity of roads. In subsequent research, real-world traffic flow data or traffic volume simulated by transport models can be inputted to replace these defaults. Population data and public space data can be substituted or updated with local information. In the prototype platform, 3D model data are used mainly for visualization purposes. In the next step, 3D data analysis can be expanded.
The TSH system GIS platform has been provided to specific planning and design institutes in Nanjing for analysis and has been utilized in case studies in Nanjing (as presented in this paper). Besides, in a real-world planning project of integrated urban design of Ningde city in Fujian province, China, the tool was used for analyses. For future work, it is essential to gather insight from user feedback and assess the platform’s usability, following a methodology similar to the one employed in [30,69]. Moreover, the current method for evaluating different design alternatives is uploading new shapefiles, although an upgrade to enhance the usability, particularly in evaluating new designs, is anticipated.

6. Conclusions

The negative impact of transport infrastructure on urban spaces necessitates urgent attention in the fields of architecture and urban planning. Therefore, the integrated design of transport infrastructure, public spaces, and human activities (TSH) emerges as a vital imperative. Within this context, there exists a clear need for enhanced integration assessment tools tailored to the TSH system. Current tools lack critical features, including block-scale barrier effect analysis, spatial assessment, and geographic information mapping, and the requisite customization and collaborative capabilities for effective geodesign.
To gain a profound understanding of the demand for PSS, a survey complemented by semi-structured interviews was conducted. This investigation unearthed a pronounced need for robust support in the analysis and evaluation phases of urban design. The respondents identified GIS as the preferred analytical technique and articulated a desire for user-friendly tools capable of delivering visualized outcomes, expandable evaluation modules, and adaptable analysis units. Specific areas of focus encompassed metrics related to walkability, the accessibility of public transport, proximity to public spaces, and environmental quality.
Building upon these needs, a prototype GIS tool was developed to analyze and assess the TSH system. This tool incorporates a customizable and extendable evaluation index (seven KPAs and seven KPIs). It also facilitates a combined quantitative and qualitative assessment by translating numerical results into a standardized score ranging from 0 to 1. Significantly, the tool introduces a buffer effect index, which is a metric designed to quantify the interaction dynamics between transport and public space systems. The tool further extends its utility by offering both 2D and 3D visualization interfaces, accommodating two distinct analysis units, and facilitating cross-platform collaboration.
The application of this GIS tool to a case study in Nanjing provided valuable insight into the integration degree of blocks surrounding expressways, railways, and main roads. The outcomes from this study revealed the distinct regeneration requirements for various transport infrastructure spaces, culminating in a set of pragmatic planning recommendations. Furthermore, the platform facilitated the exploration of correlations among various KPIs, providing valuable insights for the selection of appropriate planning strategies. Looking ahead, this prototype tool serves as a critical reference point for urban planning and (re)development, as it endeavors to reconcile transport infrastructure, public spaces, and human activities.

7. Patents

Yang L. 2023. A method and system for evaluating the integration of urban transportation infrastructure and urban space. Type of Patent: Patent for Invention. Patent Number: CN116433436A.

Supplementary Materials

The following supporting information can be downloaded at: https://www.mdpi.com/article/10.3390/ijgi12120504/s1.

Funding

This research was funded by the Natural Science Foundation of Jiangsu Province, grant number BK20210260, the National Natural Science Foundation China, grant number 52108046, and the China Postdoctoral Science Foundation, grant number 2023M740601.

Data Availability Statement

The code developed for generating street blocks is available at https://github.com/no0o0oname/urban_blocks_generation accessed on 10 December 2023. Other data developed by the author are currently unavailable.

Acknowledgments

The author thanks Sunjie Zhou (Nio Inc.), Lei Wang, Xiaohua Cui for giving technical supports in software development. Liu also thank Mingbo Wu (Chinese Academy of Sciences), Yishan Chen (China IPPR International Engineering Co., Ltd), Chenyang Wu (Northwestern Polytechnical University), Haoran Liu, Yinan Chen, Ruiji Zhu, Chuyi Guo, and Chen Xu for helping with collecting and preprocessing the input data. Thanks to Arnab Majumdar (Imperial College London) for reviewing a draft of the survey, and Wenzhen Zhai and Xingrun Gong for formatting.

Conflicts of Interest

The author declares no conflict of interest.

References

  1. Doron, G.M. The Dead Zone and the Architecture of Transgression. City 2000, 4, 247–263. [Google Scholar] [CrossRef]
  2. Yang, L.; Majumdar, A.; van Dam, K.H.; Zhang, L. Theories and practices for reconciling transport, public space, and people—A review. Proc. Inst. Civ. Eng. Munic. Eng. 2022, 175, 187–203. [Google Scholar] [CrossRef]
  3. Trancik, R. Finding Lost Space: Theories of Urban Design; John Wiley & Sons: Hoboken, NJ, USA, 1991. [Google Scholar]
  4. Anciaes, P.; Jones, P.; Mindell, J. Quantifying Community Severance–A Literature Review; University College London: London, UK, 2014. [Google Scholar]
  5. Anciaes, P.; Jones, P. A comprehensive approach for the appraisal of the barrier effect of roads on pedestrians. Transp. Res. Part A Policy Pr. 2020, 134, 227–250. [Google Scholar] [CrossRef]
  6. Kim, S.; LaGrange, R.L.; Willis, C.L. Place and crime: Integrating sociology of place and environmental criminology. Urban Aff. Rev. 2013, 49, 141–155. [Google Scholar] [CrossRef]
  7. Forrester, J.W. Urban Dynamics; MIT Press: Cambridge, MA, USA, 1969. [Google Scholar]
  8. Whyte, J. The future of systems integration within civil infrastructure: A review and directions for research. INCOSE Int. Symp. 2016, 26, 1541–1555. [Google Scholar] [CrossRef]
  9. Madni, A.M.; Sievers, M. Systems Integration: Key Perspectives, Experiences, and Challenges. Syst. Eng. 2014, 17, 37–51. [Google Scholar] [CrossRef]
  10. Saidi, S.; Kattan, L.; Jayasinghe, P.; Hettiaratchi, P.; Taron, J. Integrated infrastructure systems—A review. Sustain. Cities Soc. 2018, 36, 1–11. [Google Scholar] [CrossRef]
  11. Li, J.; Li, G.A.; Li, J.; Liu, A. Integrating conformance and performance for the evaluation of urban planning implementation from a goal-oriented perspective. Environ. Plan. B Urban Anal. City Sci. 2022, 49, 737–753. [Google Scholar] [CrossRef]
  12. Cervero, R.; Guerra, E.; Al, S. Beyond Mobility: Planning Cities for People and Places; Island Press: Washington, DC, USA, 2017. [Google Scholar]
  13. Yang, L.; van Dam, K.H.; Majumdar, A.; Anvari, B.; Ochieng, W.Y.; Zhang, L. Integrated design of transport infrastructure and public spaces considering human behavior: A review of state-of-the-art methods and tools. Front. Arch. Res. 2019, 8, 429–453. [Google Scholar] [CrossRef]
  14. Acheampong, R.A.; Silva, E. Land use–transport interaction modeling: A review of the literature and future research directions. J. Transp. Land Use 2015, 8, 11–38. [Google Scholar] [CrossRef]
  15. Yang, L.; Zhang, L.; Stettler, M.E.; Sukitpaneenit, M.; Xiao, D.; van Dam, K.H. Supporting an integrated transportation infrastructure and public space design: A coupled simulation method for evaluating traffic pollution and microclimate. Sustain. Cities Soc. 2020, 52, 101796. [Google Scholar] [CrossRef]
  16. Traunmüller, I.C.; Keller, I.I.; Şenol, F. Application of space syntax in neighbourhood park research: An investigation of multiple socio-spatial attributes of park use. Local Environ. 2023, 28, 529–546. [Google Scholar] [CrossRef]
  17. Anciaes, P. Tool to Value Reductions in Community Severance Caused by Roads. [Software]. 2020. Available online: https://discovery.ucl.ac.uk/id/eprint/10144318 (accessed on 14 December 2023).
  18. Pelzer, P.; te Brömmelstroet, M.; Geertman, S. Geodesign in practice: What about the urban designers. In Geodesign by Integrating Design and Geospatial Sciences; Springer: Berlin/Heidelberg, Germany, 2014; pp. 331–344. [Google Scholar]
  19. Batty, M. Defining geodesign (=GIS + design?). Environ. Plan. B Plan. Des. 2013, 40, 1–2. [Google Scholar] [CrossRef]
  20. Ye, Y.; Yeh, A.; Zhuang, Y.; van Nes, A.; Liu, J. “Form Syntax” as a contribution to geodesign: A morphological tool for urbanity-making in urban design. Urban Des. Int. 2017, 22, 73–90. [Google Scholar] [CrossRef]
  21. Yang, P.P.-J.; Chi, C.S.-F.; Wu, Y.; Quan, S.J. A Geodesign Method of Human-Energy-Water Interactive Systems for Urban Infrastructure Design: 10KM2 Near-Zero District Project in Shanghai. Engineering 2018, 4, 182–189. [Google Scholar] [CrossRef]
  22. Vonk, G.; Geertman, S.; Schot, P. A SWOT analysis of planning support systems. Environ. Plan. A Econ. Space 2007, 39, 1699–1714. [Google Scholar] [CrossRef]
  23. Geertman, S.; Stillwell, J. Planning support science: Developments and challenges. Environ. Plan. B Urban Anal. City Sci. 2020, 47, 1326–1342. [Google Scholar] [CrossRef]
  24. Harris, B.; Batty, M. Locational Models, Geographic Information and Planning Support Systems. J. Plan. Educ. Res. 1993, 12, 184–198. [Google Scholar] [CrossRef]
  25. E Klosterman, R. The What if? collaborative planning support system. Environ. Plan. B Plan. Des. 1999, 26, 393–408. [Google Scholar] [CrossRef]
  26. Kwartler, M.; Bernard, R.N. CommunityViz: An integrated planning support system. Planning Support Systems: Integrating Geographic Information Systems, Models and Visualization Tools; Esri Press: Redlands, CA, USA, 2001; pp. 285–308. [Google Scholar]
  27. Pettit, C.J.; Klosterman, R.E.; Delaney, P.; Whitehead, A.L.; Kujala, H.; Bromage, A.; Nino-Ruiz, M. The Online What if? Planning Support System: A Land Suitability Application in Western Australia. Appl. Spat. Anal. Policy 2015, 8, 93–112. [Google Scholar] [CrossRef]
  28. Fang, Z.; Jin, Y.; Yang, T. Incorporating Planning Intelligence into Deep Learning: A Planning Support Tool for Street Network Design. J. Urban Technol. 2022, 29, 99–114. [Google Scholar] [CrossRef]
  29. Hooper, P.; Boulange, C.; Arciniegas, G.; Foster, S.; Bolleter, J.; Pettit, C. Exploring the potential for planning support systems to bridge the research-translation gap between public health and urban planning. Int. J. Heath. Geogr. 2021, 20, 1–17. [Google Scholar] [CrossRef]
  30. Russo, P.; Lanzilotti, R.; Costabile, M.F.; Pettit, C.J. Towards satisfying practitioners in using Planning Support Systems. Comput. Environ. Urban Syst. 2018, 67, 9–20. [Google Scholar] [CrossRef]
  31. Savin-Baden, M.; Major, C.H. Qualitative Research; Architectural Press: Oxford, UK, 2003. [Google Scholar]
  32. Moughtin, C. Urban Design: Street and Square; Taylor & Francis Ltd.: London, UK, 2007. [Google Scholar]
  33. Yang, L.; van Dam, K.H.; Zhang, L. Developing Goals and Indicators for the Design of Sustainable and Integrated Transport Infrastructure and Urban Spaces. Sustainability 2020, 12, 9677. [Google Scholar] [CrossRef]
  34. Hill, M. A Goals-Achievement Matrix for Evaluating Alternative Plans. J. Am. Inst. Planners 1968, 34, 19–29. [Google Scholar] [CrossRef]
  35. Chen, W.; Wu, A.N.; Biljecki, F. Classification of urban morphology with deep learning: Application on urban vitality. Comput. Environ. Urban Syst. 2021, 90, 101706. [Google Scholar] [CrossRef]
  36. Cui, Y.; Yu, Y.; Cai, Z.; Wang, D. Optimizing Road Network Density Considering Automobile Traffic Efficiency: Theoretical Approach. J. Urban Plan. Dev. 2022, 148, 4021062. [Google Scholar] [CrossRef]
  37. Gómez-Varo, I.; Delclòs-Alió, X.; Miralles-Guasch, C. Jane Jacobs reloaded: A contemporary operationalization of urban vitality in a district in Barcelona. Cities 2022, 123, 103565. [Google Scholar] [CrossRef]
  38. Boulange, C.; Gunn, L.; Giles-Corti, B.; Mavoa, S.; Pettit, C.; Badland, H. Examining associations between urban design attributes and transport mode choice for walking, cycling, public transport and private motor vehicle trips. J. Transp. Health 2017, 6, 155–166. [Google Scholar] [CrossRef]
  39. Koohsari, M.J.; Karakiewicz, J.A.; Kaczynski, A.T. Public open space and walking: The role of proximity, perceptual qualities of the surrounding built environment, and street configuration. Environ. Behav. 2013, 45, 706–736. [Google Scholar] [CrossRef]
  40. Sun, G.; Webster, C.; Zhang, X. Connecting the city: A three-dimensional pedestrian network of Hong Kong. Environ. Plan. B Urban Anal. City Sci. 2021, 48, 60–75. [Google Scholar] [CrossRef]
  41. Yang, J.; Cao, J.; Zhou, Y. Elaborating non-linear associations and synergies of subway access and land uses with urban vitality in Shenzhen. Transp. Res. Part A Policy Pr. 2021, 144, 74–88. [Google Scholar] [CrossRef]
  42. Yu, L.; Cui, M. How subway network affects transit accessibility and equity: A case study of Xi’an metropolitan area. J. Transp. Geogr. 2023, 108, 103556. [Google Scholar] [CrossRef]
  43. Fang, C.; He, S.; Wang, L. Spatial Characterization of Urban Vitality and the Association with Various Street Network Metrics from the Multi-Scalar Perspective. Front. Public Health 2021, 9, 677910. [Google Scholar] [CrossRef]
  44. Cipriani, E.; Mannini, L.; Montemarani, B.; Nigro, M.; Petrelli, M. Congestion pricing policies: Design and assessment for the city of Rome, Italy. Transp. Policy 2019, 80, 127–135. [Google Scholar] [CrossRef]
  45. Li, Y.; Xie, Y.; Sun, S.; Hu, L. Evaluation of Park Accessibility Based on Improved Gaussian Two-Step Floating Catchment Area Method: A Case Study of Xi’an City. Buildings 2022, 12, 871. [Google Scholar] [CrossRef]
  46. Lotfi, S.; Koohsari, M.J. Measuring objective accessibility to neighborhood facilities in the city (A case study: Zone 6 in Tehran, Iran). Cities 2009, 26, 133–140. [Google Scholar] [CrossRef]
  47. Bertolini, L.; le Clercq, F.; Kapoen, L. Sustainable accessibility: A conceptual framework to integrate transport and land use plan-making. Two test-applications in the Netherlands and a reflection on the way forward. Transp. Policy 2005, 12, 207–220. [Google Scholar] [CrossRef]
  48. Yue, W.; Chen, Y.; Thy, P.T.M.; Fan, P.; Liu, Y.; Zhang, W. Identifying urban vitality in metropolitan areas of developing countries from a comparative perspective: Ho Chi Minh City versus Shanghai. Sustain. Cities Soc. 2021, 65, 102609. [Google Scholar] [CrossRef]
  49. Liu, D.; Kwan, M.-P.; Wang, J. Developing the 15-Minute City: A comprehensive assessment of the status in Hong Kong. Travel Behav. Soc. 2024, 34, 100666. [Google Scholar] [CrossRef]
  50. UK DfT (UK Department for Transport). Social Impact Appraisal, WebTAG Unit A4.1. 2017. Available online: https://www.gov.uk/government/publications/webtag-tag-unit-a4-1-social-impact-appraisal-december-2017 (accessed on 14 December 2023).
  51. Victoria Transport Policy Institute. Transportation Cost and Benefit Analysis II—Barrier Effect Victoria Transport Policy Institute. 2022. Available online: https://www.vtpi.org/tca/tca0513.pdf (accessed on 14 December 2023).
  52. Meltofte, K.; Nørby, L. Vejen Som Barriere for Fodgængere [The Road as a Barrier for Pedestrians]. Trafikdage på Aalborg Universitet 2013 [Proceedings from the Annual Transport Conference at Aalborg University]. 2013. (In Danish). Available online: http://www.trafikdage.dk/td/papers/papers13/KatrineRabjergMeltofte.pdf (accessed on 14 December 2023).
  53. Kabisch, N.; Haase, D. Green spaces of European cities revisited for 1990–2006. Landsc. Urban Plan. 2013, 110, 113–122. [Google Scholar] [CrossRef]
  54. de la Barrera, F.; Reyes-Paecke, S.; Banzhaf, E. Indicators for green spaces in contrasting urban settings. Ecol. Indic. 2016, 62, 212–219. [Google Scholar] [CrossRef]
  55. Lahoti, S.; Lahoti, A.; Saito, O. Benchmark assessment of recreational public Urban Green space provisions: A case of typical urbanizing Indian City, Nagpur. Urban For. Urban Green. 2019, 44, 126424. [Google Scholar] [CrossRef]
  56. Kumar, S.; Rajak, F. Assessment of Urban Green Open Spaces of Micro-and Meso-Level Zones, Based on the Growth Pattern: Case of Patna City. Sustainability 2023, 15, 1609. [Google Scholar] [CrossRef]
  57. Li, Q.; Cui, C.; Liu, F.; Wu, Q.; Run, Y.; Han, Z. Multidimensional Urban Vitality on Streets: Spatial Patterns and Influence Factor Identification Using Multisource Urban Data. ISPRS Int. J. Geo-Inform. 2021, 11, 2. [Google Scholar] [CrossRef]
  58. Conzen, M.R.G. Alnwick, Northumberland: A study in town-plan analysis. Trans. Pap. Inst. Br. Geogr. 1960, 27, iii-122. [Google Scholar] [CrossRef]
  59. Liu, X.; Long, Y. Automated identification and characterization of parcels with OpenStreetMap and points of interest. Environ. Plan. B Plan. Des. 2016, 43, 341–360. [Google Scholar] [CrossRef]
  60. Gong, P.; Li, X.; Wang, J.; Bai, Y.; Chen, B.; Hu, T.; Liu, X.; Xu, B.; Yang, J.; Zhang, W.; et al. Annual maps of global artificial impervious area (GAIA) between 1985 and 2018. Remote Sens. Environ. 2020, 236, 111510. [Google Scholar] [CrossRef]
  61. Yang, L.; Wu, M.; Chen, Y.; Wu, C. Examining the impact of the urban transportation system on tangible and intangible vitality at the city-block scale in Nanjing, China. Environ. Plan. B Urban Anal. City Sci. 2023; accepted. [Google Scholar]
  62. Dill, J. Measuring network connectivity for bicycling and walking. In Proceedings of the 83rd Annual Meeting of the Transportation Research Board, Washington, DC, USA, 11–15 January 2004. [Google Scholar]
  63. Andersen, J.L.E.; Landex, A. Catchment areas for public transport. WIT Trans. Built Environ. 2008, 101, 175–184. [Google Scholar]
  64. O’ Neill, W.A.; Ramsey, R.D.; Chou, J. Analysis of transit service areas using geographic information systems. Transp. Res. Rec. 1992, 364, 131. [Google Scholar]
  65. CJJ37-90; Industrial Standards of the People’s Republic of China, Technical Standard of Urban Road Engineering. Ministry of Housing and Urban-Rural Development of the People’s Republic of China: Beijing, China, 2009.
  66. JTG B01-2014; Industrial Standards of the People’s Republic of China, Technical Standard of Highway Engineering. Ministry of Transport of the People’s Republic of China: Beijing, China, 2014.
  67. Nanjing Bureau of Statistics. Bulletin of the Seventh National Census of Nanjing City; Nanjing Bureau of Statistics: Nanjing, China, 2021. [Google Scholar]
  68. Ewing, R.; Cervero, R. Travel and the Built Environment. J. Am. Plan. Assoc. 2010, 76, 265–294. [Google Scholar] [CrossRef]
  69. Pelzer, P.; Geertman, S.; van der Heijden, R. A comparison of the perceived added value of PSS applications in group settings. Comput. Environ. Urban Syst. 2016, 56, 25–35. [Google Scholar] [CrossRef]
Figure 1. Tool demands of different urban planning stages.
Ijgi 12 00504 g001
Figure 2. (left) Needs of quantitative methods in different urban design stages; (right) The most used tools (word size reflects the number of respondents who mentioned it).
Ijgi 12 00504 g002
Figure 3. The indicators that should be quantified in an urban plan evaluation.
Ijgi 12 00504 g003
Figure 4. The architecture of the tool.
Ijgi 12 00504 g004
Figure 5. The operation process of the tool.
Ijgi 12 00504 g005
Figure 6. The indicator set for evaluating the TSH system, adapted from Yang et al. [33]. Note: Bold red items are KPAs selected for this study.
Ijgi 12 00504 g006
Figure 7. The interface and use process of the Web-based GIS tool.
Ijgi 12 00504 g007
Figure 8. Location of the case study blocks in Nanjing, China (coordinate system: WGS 84/UTM zone 50N).
Ijgi 12 00504 g008
Figure 9. An example of the evaluation index/3D model (left) and evaluation result/2D data (right).
Ijgi 12 00504 g009
Figure 10. Integration scores of all blocks in the three study areas and position of 24 selected blocks (coordinate system: WGS 84/UTM zone 50N).
Ijgi 12 00504 g010
Figure 11. Score and KPI values of each area (top) and the 24 selected blocks (bottom).
Ijgi 12 00504 g011
Figure 12. The correlation among the KPIs. Note: Significance level: *** p < 0.01, ** p < 0.05, and * p < 0.1. The orange border highlights strong positive correlations among KPIs.
Ijgi 12 00504 g012
Table 1. Comparison of the different evaluation tools.
AutoCAD Map 3D 2019CityCADV3.0ArcGIS CityEngine 2022.0TfL WebCAT/URA SPACE
DescriptionProfessional map calculation softwareProfessional city planning software3D modeling softwarePublic data evaluation tool based on location
User sidePCPCPCWeb
Input data opennessOpenOpenOpenClosed
Input data editingSupport editingEditing not supportedSupport editingEditing not supported
AlgorithmUser definedModularized-Fixed
OutputUser definedUser defined-Fixed
UserMap and geography professionalsPackaged products for designers and plannersDesigner and plannerUrban designers, planners, the public
User expertise/Learning costHighMediumHighLow
Computing personalization/Functional extensibilityStrongMediumStrongModest
Network cooperation/ReusabilityMediumMediumMediumStrong
Table 2. Deficiencies of existing quantitative urban design tools.
High-Level DeficienciesLow-Level DeficienciesNo. of Interviewees
Performance deficiency of toolsSoftware localization, unstable operation, and excessive packaging1
Use difficulty of toolsComplicated to use and high entry barrier8
Insufficient training and promotion3
DataPoor data analysis functions
(e.g., low resolution)
3
Data acquisition difficulty2
Functional deficiency of toolsInteraction among different tools3
Lack of assessment of physical environment, pedestrian, and PT accessibility1
Insufficient support for urban design and planningNeeds combination of quantitative results and qualitative analyses5
Visualization of quantitative evaluation results4
Needs parametric design3
Lack of experience sharing1
Table 3. Evaluation indicator system.
Key Performance Area (KPA)Key Performance Indicator (KPI)
KPA1Motorized transport systemKPI1Road density
KPA2Active travel systemKPI2Active travel network connectivity
KPA3Public transport systemKPI3Subway accessibility
KPA4Public space systemKPI4Public space 5 min accessibility
KPA5ActivityKPI5POI 5 min accessibility
KPA6Transport–space interactionKPI6Barrier effect index
KPA7Natural environmentKPI7Per capita public green area
Table 4. Dataset required for the TSH-System Platform.
DataFile FormatData Source
2D dataRoad network.shpline-type vector dataGaode map in 2019 (https://amap.com accessed on 14 December 2023)
Subway station.shppoint-type vector data
Land use.shppolygon-type vector data“Annual Maps of Global Artificial Impervious Areas 2018” [60] and OpenStreetMap (https://www.openstreetmap.org accessed on 14 December 2023)
Population.tiffraster dataWorldPop (https://www.worldpop.org/ accessed on 14 December 2023)
Point of interest (POI).csvGaode map in 2019 including 657 small classes of POIs
3D dataRailway and highway model.gltfPrepared in SketchUp V.8
Table 5. Crossing need value assignment according to land uses around roads.
Land Use (Codes are Used in [60])Crossing Need Value
101—Residential, 201—Business office, 202—Commercial service, 402—Transportation stations, and 502—Educational, 503—Medical4
504—Sport and cultural, 505—Park and greenspace3
501—Administrative2
301—Industrial, 401—Road, and 403—Airport facilities1
Disclaimer/Publisher’s Note: The statements, opinions and data contained in all publications are solely those of the individual author(s) and contributor(s) and not of MDPI and/or the editor(s). MDPI and/or the editor(s) disclaim responsibility for any injury to people or property resulting from any ideas, methods, instructions or products referred to in the content.

