Next Issue
Volume 11, February
Previous Issue
Volume 10, December


Climate, Volume 11, Issue 1 (January 2023) – 25 articles

Cover Story (view full-size image): 
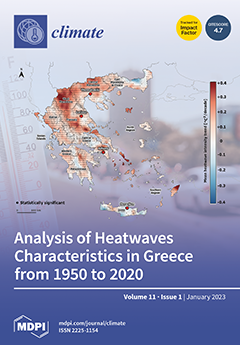
The spatiotemporal variability of seven indices for heatwaves was investigated by using an enhanced-resolution reanalysis model data set (ERA5-Land). Heatwaves were defined as periods where two selected thresholds were exceeded for at least three consecutive days. Trend analysis revealed that heatwaves in Greece have become more frequent, longer, and more intense since 1950. The number of heatwaves that occurred per summer has increased by ~80% since 1990. Changes in the lengthening of the season of hot weather have also been identified with a prominent increase in heatwaves during June within the last two decades. Finally, the spatial extent of the areas in Greece that experience heat waves has also increased. Namely, the area of Greece that experiences at least one heatwave per summer has almost doubled since 1990. View this paper
  • Issues are regarded as officially published after their release is announced to the table of contents alert mailing list.
  • You may sign up for e-mail alerts to receive table of contents of newly released issues.
  • PDF is the official format for papers published in both, html and pdf forms. To view the papers in pdf format, click on the "PDF Full-text" link, and use the free Adobe Reader to open them.
Order results
Result details
Section
Select all
Export citation of selected articles as:
18 pages, 865 KiB  
Article
Towards a Safe Hydrogen Economy: An Absolute Climate Sustainability Assessment of Hydrogen Production
by Kevin Dillman and Jukka Heinonen
Climate 2023, 11(1), 25; https://doi.org/10.3390/cli11010025 - 15 Jan 2023
Cited by 9 | Viewed by 3359
Abstract
Policymakers and global energy models are increasingly looking towards hydrogen as an enabling energy carrier to decarbonize hard-to-abate sectors (projecting growth in hydrogen consumption in the magnitude of hundreds of megatons). Combining scenarios from global energy models and life cycle impacts of different [...] Read more.
Policymakers and global energy models are increasingly looking towards hydrogen as an enabling energy carrier to decarbonize hard-to-abate sectors (projecting growth in hydrogen consumption in the magnitude of hundreds of megatons). Combining scenarios from global energy models and life cycle impacts of different hydrogen production technologies, the results of this work show that the life cycle emissions from proposed configurations of the hydrogen economy would lead to climate overshoot of at least 5.4–8.1× of the defined “safe” space for greenhouse gas emissions by 2050 and the cumulative consumption of 8–12% of the remaining carbon budget. This work suggests a need for a science-based definition of “clean” hydrogen, agnostic of technology and compatible with a “safe” development of the hydrogen economy. Such a definition would deem blue hydrogen environmentally unviable by 2025–2035. The prolific use of green hydrogen is also problematic however, due to the requirement of a significant amount of renewable energy, and the associated embedded energy, land, and material impacts. These results suggest that demand-side solutions should be further considered, as the large-scale transition to hydrogen, which represents a “clean” energy shift, may still not be sufficient to lead humanity into a “safe” space. Full article
(This article belongs to the Section Climate and Environment)
Show Figures

Figure 1

11 pages, 3285 KiB  
Article
Forecasting Impacts on Vulnerable Shorelines: Vulnerability Assessment along the Coastal Zone of Messolonghi Area—Western Greece
by Eleni Filippaki, Evangelos Tsakalos, Maria Kazantzaki and Yannis Bassiakos
Climate 2023, 11(1), 24; https://doi.org/10.3390/cli11010024 - 14 Jan 2023
Cited by 2 | Viewed by 1953
Abstract
The coastal areas of the Mediterranean have been extensively affected by the transgressive event that followed the Last Glacial Maximum, with many studies conducted regarding the stratigraphic configuration of coastal sediments around the Mediterranean. The coastal zone of the Messolonghi area, western Greece, [...] Read more.
The coastal areas of the Mediterranean have been extensively affected by the transgressive event that followed the Last Glacial Maximum, with many studies conducted regarding the stratigraphic configuration of coastal sediments around the Mediterranean. The coastal zone of the Messolonghi area, western Greece, consists of low-relief beaches, containing low cliffs and eroded dunes, a fact that, in combination with the rising sea levels and tectonic subsidence of the area, has led to substantial coastal erosion. Coastal vulnerability assessment is a useful means of identifying areas of coastline that are vulnerable to impacts of climate change and coastal processes, highlighting potential problem areas. Commonly, coastal vulnerability assessment takes the form of an “index” that quantifies the relative vulnerability along a coastline. Here, the Coastal Vulnerability Index (CVI) methodology by Thieler and Hammar-Klose was employed, by considering geological features, coastal slope, relative sea-level change, shoreline erosion/accretion rates, and mean significant wave height as well as mean tide range, to assess the present-day vulnerability of the coastal zone of the Messolonghi area. In light of this, an impact assessment is performed under three different sea-level-rise scenarios. This study contributes toward coastal zone management practices in low-lying coastal areas that have little data information, assisting decision-makers in adopting best adaptation options to overcome the impact of sea-level rise on vulnerable areas, similar to the coastal zone of Messolonghi. Full article
(This article belongs to the Section Climate Change and Urban Ecosystems)
Show Figures

Figure 1

5 pages, 258 KiB  
Editorial
Acknowledgment to the Reviewers of Climate in 2022
by Climate Editorial Office
Climate 2023, 11(1), 23; https://doi.org/10.3390/cli11010023 - 12 Jan 2023
Viewed by 1142
Abstract
High-quality academic publishing is built on rigorous peer review [...] Full article
17 pages, 8579 KiB  
Review
Conservation and Management of Protected Areas in China and India: A Literature Review (1990–2021)
by Wen Gao, Jiefan Huang, Quan Qiu, Anil Shrestha, Changyan Yuan, Subhash Anand, Guibin Wang and Guangyu Wang
Climate 2023, 11(1), 22; https://doi.org/10.3390/cli11010022 - 12 Jan 2023
Cited by 1 | Viewed by 2862
Abstract
Protected areas (PAs) are key to biodiversity conservation. As two highly populous and biodiverse countries, China and India are facing similar socioenvironmental pressures in the management of PAs. A comparative analysis of studies of PA policies in these two countries provides an objective [...] Read more.
Protected areas (PAs) are key to biodiversity conservation. As two highly populous and biodiverse countries, China and India are facing similar socioenvironmental pressures in the management of PAs. A comparative analysis of studies of PA policies in these two countries provides an objective assessment of policy concerns. This study involved a bibliometric analysis of studies of PA policies in China and India. Relevant publications were retrieved from the Web of Science and Scopus. The analysis was carried out using the Bibliometrix R Package, CiteSpace, and VOSviewer. The results indicate that PA policies studies in China are growing at an exponential rate, while Indian studies were cited significantly more often. “Environmental protection” was the main focus of the Chinese studies, with top keywords including “forest ecosystem” and “strategic approach”. In India, research was mainly focused on “wildlife management”, and the top keywords were “climate change” and “ecosystem service”. Studies from both countries were concerned with natural resource conservation and endangered species. Studies in India began relatively earlier and were more developed. India focused on people-related themes, while China emphasized strategic approaches. China is improving its system of PA and should learn from India to consider the relationship between environmental protection and people. Full article
(This article belongs to the Special Issue Climate Change and Deforestation and Forest Degradation)
Show Figures

Figure 1

12 pages, 4204 KiB  
Article
Spatiotemporal Kriging for Days without Rainfall in a Region of Northeastern Brazil
by Elias Silva de Medeiros, Renato Ribeiro de Lima and Carlos Antonio Costa dos Santos
Climate 2023, 11(1), 21; https://doi.org/10.3390/cli11010021 - 09 Jan 2023
Cited by 1 | Viewed by 1824
Abstract
Climate change has had several negative effects, including more severe storms, warmer oceans, high temperatures and, in particular, increased drought, directly affecting the water availability in a region. The Northeast Region of Brazil (NEB) is known to have scarce rainfall, especially in the [...] Read more.
Climate change has had several negative effects, including more severe storms, warmer oceans, high temperatures and, in particular, increased drought, directly affecting the water availability in a region. The Northeast Region of Brazil (NEB) is known to have scarce rainfall, especially in the northeastern semiarid region. Droughts and high temperatures in the NEB negatively affect water resources in the region, resulting in a gradual decrease in the storage volume in the reservoirs and contributing to unprecedented water scarcity. The objective of this research was to investigate the spatiotemporal behavior of the number of days without rain (DWR) in a region of northeastern Brazil, making use of the spatiotemporal geostatistical methodology. Cross-validation resulted in an R2 of 71%, indicating a good performance of spatiotemporal kriging for predicting DWRs. The results indicate a spatial dependence for a radius of up to 39 km and that the DWR observations in a certain location influence its estimates in the next 2.8 years. The projection maps from 2021 to 2030 identified a growing trend in the DWRs. With the results presented in our study, it is expected that they can be used by government agencies for the adoption of public policies aiming to minimize the possible damage caused by long periods of drought. Full article
(This article belongs to the Special Issue Climate Change Impacts at Various Geographical Scales)
Show Figures

Figure 1

20 pages, 9871 KiB  
Article
Flash Flood Reconstruction and Analysis—A Case Study Using Social Data
by Lenise Farias Martins, Ticiana Marinho de Carvalho Studart, João Dehon Pontes Filho, Victor Costa Porto, Francisco de Assis de Souza Filho and Francisco Railson da Silva Costa
Climate 2023, 11(1), 20; https://doi.org/10.3390/cli11010020 - 07 Jan 2023
Cited by 1 | Viewed by 3047
Abstract
This work proposes a methodology for post-flood analysis in ungauged basins with low data availability located in semi-arid regions. The methodology combines social perception with recorded data. Social perception can be a useful tool to enhance the modeling process in cases where official [...] Read more.
This work proposes a methodology for post-flood analysis in ungauged basins with low data availability located in semi-arid regions. The methodology combines social perception with recorded data. Social perception can be a useful tool to enhance the modeling process in cases where official records are nonexistent or unsatisfactory. For this aim, we structured a four-step methodology. First, we create a repository with the information that reconstructs the analyzed event. Photos and news of the flood event are collected from social media platforms. The next step is to consult official government agencies to obtain documented information about the disaster. Then, semi-structured interviews are carried out with residents to obtain the extension and depth of the flooded spot. This social information creates an overview of the flood event that can be used to evaluate the hydraulic/hydrological modeling of the flood event and the quality of the recorded data. We analyzed a flood event in a city in semi-arid Brazil. The event caused several damages such as the breaking of dams and about 40% of the population was somehow impacted although the official rain data pointed to non-extreme precipitation. Full article
(This article belongs to the Special Issue Heavy Precipitation Events, Causes and Affections)
Show Figures

Figure 1

19 pages, 6833 KiB  
Article
The Arctic Winter Seasons 2016 and 2017: Climatological Context and Analysis
by Monica Ionita
Climate 2023, 11(1), 19; https://doi.org/10.3390/cli11010019 - 06 Jan 2023
Cited by 2 | Viewed by 1442
Abstract
In this study, we show that the extreme Arctic winter 2015/16 can be partially explained by the superposition of different atmospheric teleconnection patterns, such as the Arctic Oscillation, the Pacific-North American teleconnection, and El Niño—Southern Oscillation, whereas winter 2016/17 had different trigger mechanisms. [...] Read more.
In this study, we show that the extreme Arctic winter 2015/16 can be partially explained by the superposition of different atmospheric teleconnection patterns, such as the Arctic Oscillation, the Pacific-North American teleconnection, and El Niño—Southern Oscillation, whereas winter 2016/17 had different trigger mechanisms. While the temperature anomalies for winter 2015/16 were mainly driven by the large-scale atmospheric circulation, the temperature anomalies throughout winter 2016/17 may possibly reflect a response to the extremely wet and warm autumn of 2016. The atmospheric circulation anomalies in winter 2016/17 were not as “spectacular” as the ones in the previous winter, but autumn 2016 was one of the most exceptional autumns in the observational record so far and it features some remarkable records: the lowest temperature gradient between the Arctic and the mid-latitudes over the last 70 years, the lowest autumn sea ice extent over the last 40 years, and the warmest and wettest autumn over the last 37 years over most of the Arctic basin. Moreover, we demonstrate that although the background conditions were similar for winters 2015/2016 and 2016/2017 (e.g., reduced sea ice cover, a reduced temperature gradient between the Arctic and the mid-latitudes, and a very warm Barents Sea and Kara Sea in the previous autumn), the response of the atmospheric circulation and the regions affected by extremes (e.g., cold spells and snow cover) were rather different during these two winters. Full article
(This article belongs to the Section Climate Dynamics and Modelling)
Show Figures

Figure 1

30 pages, 13168 KiB  
Article
Climate Change Impacts on the Hydrology of the Brahmaputra River Basin
by Wahid Palash, Sagar Ratna Bajracharya, Arun Bhakta Shrestha, Shahriar Wahid, Md. Shahadat Hossain, Tarun Kanti Mogumder and Liton Chandra Mazumder
Climate 2023, 11(1), 18; https://doi.org/10.3390/cli11010018 - 05 Jan 2023
Cited by 5 | Viewed by 4821
Abstract
Climate change (CC) is impacting the hydrology in the basins of the Himalayan region. Thus, this could have significant implications for people who rely on basin water for their lives and livelihoods. However, there are very few studies on the Himalayan river basins. [...] Read more.
Climate change (CC) is impacting the hydrology in the basins of the Himalayan region. Thus, this could have significant implications for people who rely on basin water for their lives and livelihoods. However, there are very few studies on the Himalayan river basins. This study aims to fill this gap by presenting a water balance for the Brahmaputra River Basin using the Soil and Water Assessment Tool (SWAT). Results show that snowmelt contributed about 6% of the total annual flow of the whole Brahmaputra, 21% of the upper Brahmaputra, and 5% of the middle Brahmaputra. The basin-wide average annual water yield (AWY) is projected to increase by 8%, with the maximum percentage increase in the pre-monsoon season. The annual snowmelt is projected to decrease by 17%, with a marked decrease during the monsoon but an increase in other seasons and the greatest percentage reduction in the upper Brahmaputra (22%). The contribution of snowmelt to AWY is projected to decrease while rain runoff will increase across the entire Brahmaputra and also in the upper and middle Brahmaputra. The impact assessment suggests that the upper Brahmaputra will be most affected by CC, followed by the middle Brahmaputra. The results can be used to support future water management planning in the basin taking into account the potential impact of CC. Full article
(This article belongs to the Special Issue Climate Change and Responses for Water and Environmental Security)
Show Figures

Figure 1

13 pages, 2314 KiB  
Systematic Review
Thirty-Five Years of Aerosol–PBAP in situ Research in Brazil: The Need to Think outside the Amazonian Box
by Maurício C. Mantoani, Jorge A. Martins, Leila Droprinchinski Martins, Federico Carotenuto, Tina Šantl-Temkiv, Cindy E. Morris, Fábio Rodrigues and Fábio L. T. Gonçalves
Climate 2023, 11(1), 17; https://doi.org/10.3390/cli11010017 - 05 Jan 2023
Cited by 3 | Viewed by 1895
Abstract
Aerosols and primary biological aerosol particles (PBAPs) play an important role in regulating the global climate, but information summarizing the available knowledge is limited. Here, we present a systematic review of in situ studies performed in the last 35 years on aerosols–PBAPs in [...] Read more.
Aerosols and primary biological aerosol particles (PBAPs) play an important role in regulating the global climate, but information summarizing the available knowledge is limited. Here, we present a systematic review of in situ studies performed in the last 35 years on aerosols–PBAPs in Brazil, with 212 studies encompassing 474 cases. The Amazon rainforest was the most studied biome, represented by 72% of cases, followed by the Atlantic Forest with 18%. Studies focusing the Amazon mostly investigated climate-related issues and aerosol physics, with less than 5% examining the biological identity of aerosols, whereas outside the Amazon, this number reached 16%. Whilst more than half of the cases within Amazon (55%) were held at seven sampling sites only, conclusions were mainly extrapolated to the entire biome. Contrarily, research beyond the Amazon has mostly addressed the temporal and biological characterisation of PBAPs, and not only is it scattered, but also scarce. Regarding sampling efforts, most cases (72%) had fewer than 100 days of sampling, and 60% of them spanned less than half a year of study. We argue that scientists should produce more detailed/complete assessments of aerosols–PBAPs in Brazil as a whole, particularly considering their biological identity, given their importance to global climate regulation. Full article
Show Figures

Figure 1

14 pages, 4461 KiB  
Article
The Variability of Hailfall in Catalonia and Its Climatic Implications
by Tomeu Rigo and Carme Farnell
Climate 2023, 11(1), 16; https://doi.org/10.3390/cli11010016 - 04 Jan 2023
Cited by 1 | Viewed by 1531
Abstract
In recent years, some works have forecasted the future scenario of severe weather phenomena, which include large hail. In the present manuscript, the authors focus on a region, Catalonia (NE of the Iberian Peninsula), influenced by complex topography, the Mediterranean Sea, and different [...] Read more.
In recent years, some works have forecasted the future scenario of severe weather phenomena, which include large hail. In the present manuscript, the authors focus on a region, Catalonia (NE of the Iberian Peninsula), influenced by complex topography, the Mediterranean Sea, and different air masses. These components are a complicated formula in determining the behavior of the hailfall in the Catalan territory. The events of recent years have shown that expectations and the historical context are not always the best indicators for the future, implying the necessity of the further study of hail events. Using radar fields combined with ground registers and a topographic model permits the characterization of the events in the territory. There is high seasonal and annual variability, with reduced hit areas and small vertical developments in non-summer cases. All these factors are not well solved by the spatial resolution of the current climatic models. Full article
Show Figures

Figure 1

17 pages, 2823 KiB  
Article
Assessment of the Spatial Variation in the Occurrence and Intensity of Major Hurricanes in the Western Hemisphere
by Luis-Carlos Martinez, David Romero and Eric J. Alfaro
Climate 2023, 11(1), 15; https://doi.org/10.3390/cli11010015 - 04 Jan 2023
Cited by 4 | Viewed by 2385
Abstract
Major hurricanes are a critical hazard for North and Central America. The present study investigated the trends of occurrence, affectation, and intensity of major hurricanes in the North Atlantic and Northeast Pacific Oceans using GIS applications to the IBTrACS database. The study period [...] Read more.
Major hurricanes are a critical hazard for North and Central America. The present study investigated the trends of occurrence, affectation, and intensity of major hurricanes in the North Atlantic and Northeast Pacific Oceans using GIS applications to the IBTrACS database. The study period ranged from 1970 to 2021. Tropical cyclones were sampled using a grid composed of 3.5° hexagonal cells; in addition, trends were obtained to assess the effect of long-term variability from natural phenomena and climate change. Critical factors influencing these trends at the oceanic scale and for each hexagon were determined using multivariate and multiscale analysis by the application of stepwise analysis and the related ANOVA. The integrated variables related to atmospheric and oceanographic oscillations and patterns, i.e., spatial variables resampled with the same analysis unit and climate indices. Our results indicated marked spatial areas with significant trends in occurrence and intensity. Additionally, there was evidence of linear changes in the number of major hurricanes and an increase in the maximum annual speed of +1.61 m s−1 in the North Atlantic basin and +1.75 m·s−1 in the Northeast Pacific, reported for a 10-year period. In terms of occurrence, there were increases of 19% and 5%, respectively, which may be related to ocean warming and natural variability associated with oceanic and atmospheric circulation. Full article
(This article belongs to the Special Issue New Perspectives in Climate Modelling and Forecasting)
Show Figures

Figure 1

18 pages, 2249 KiB  
Article
The Role of Instability Indices in Forecasting Thunderstorm and Non-Thunderstorm Days across Six Cities in India
by Kopal Arora, Kamaljit Ray, Suresh Ram and Rajeev Mehajan
Climate 2023, 11(1), 14; https://doi.org/10.3390/cli11010014 - 04 Jan 2023
Cited by 3 | Viewed by 2197
Abstract
Thunderstorms are one of the most damaging natural hazards demanding in-depth understanding and prediction. These convective systems form in an unstable environment which is quantitatively expressed in terms of instability indices. These indices are studied over six locations across the Indian landmass in [...] Read more.
Thunderstorms are one of the most damaging natural hazards demanding in-depth understanding and prediction. These convective systems form in an unstable environment which is quantitatively expressed in terms of instability indices. These indices are studied over six locations across the Indian landmass in an attempt to predict thunderstorm activity on any given day. A combination of multiple regression, logistic regression, and range analysis provides new insight into the prediction of these storms. A supervised machine learning-based logistic regression model is developed in this study for thunderstorm prediction over Patna and can be further extended for operational forecasting of Thunderstorms over the region. Critical thresholds for the instability indices are determined over the considered locations providing valuable insight into the domain of Thunderstorm prediction Full article
(This article belongs to the Special Issue Feature Papers for Section "Climate Dynamics and Modelling")
Show Figures

Figure 1

17 pages, 6369 KiB  
Article
Assessing the Effects of Drought on Rice Yields in the Mekong Delta
by Kim Lavane, Pankaj Kumar, Gowhar Meraj, Tran Gia Han, Luong Hong Boi Ngan, Bui Thi Bich Lien, Tran Van Ty, Nguyen Truong Thanh, Nigel K. Downes, Nguyen Dinh Giang Nam, Huynh Vuong Thu Minh, Suraj Kumar Singh and Shruti Kanga
Climate 2023, 11(1), 13; https://doi.org/10.3390/cli11010013 - 03 Jan 2023
Cited by 10 | Viewed by 2748
Abstract
In contrast to other natural disasters, droughts may develop gradually and last for extended periods of time. The World Meteorological Organization advises using the Standardized Precipitation Index (SPI) for the early identification of drought and understanding of its characteristics over various geographical areas. [...] Read more.
In contrast to other natural disasters, droughts may develop gradually and last for extended periods of time. The World Meteorological Organization advises using the Standardized Precipitation Index (SPI) for the early identification of drought and understanding of its characteristics over various geographical areas. In this study, we use long-term rainfall data from 14 rain gauge stations in the Vietnamese Mekong Delta (1979–2020) to examine correlations with changes in rice yields. Results indicate that in the winter–spring rice cropping season in both 2016 and 2017, yields declined, corresponding with high humidity levels. Excessive rainfall during these years may have contributed to waterlogging, which in turn adversely affected yields. The results highlight that not only drought, but also humidity has the potential to adversely affect rice yield. Full article
Show Figures

Figure 1

22 pages, 5806 KiB  
Article
Atmospheric and Oceanic Patterns Associated with Extreme Drought Events over the Paraná Hydrographic Region, Brazil
by Aline Araújo de Freitas, Michelle Simões Reboita, Vanessa Silveira Barreto Carvalho, Anita Drumond, Simone Erotildes Teleginski Ferraz, Benedito Cláudio da Silva and Rosmeri Porfírio da Rocha
Climate 2023, 11(1), 12; https://doi.org/10.3390/cli11010012 - 02 Jan 2023
Cited by 7 | Viewed by 2492
Abstract
The Paraná Hydrographic Region (PHR) is one of the main hydrographic basins in Brazil, standing out for its energy generation and consumption, among other ecosystem services. Thus, it is important to identify hydrological drought events and the driest periods inside of these droughts [...] Read more.
The Paraná Hydrographic Region (PHR) is one of the main hydrographic basins in Brazil, standing out for its energy generation and consumption, among other ecosystem services. Thus, it is important to identify hydrological drought events and the driest periods inside of these droughts to understand the anomalous atmospheric circulation patterns associated with them (a multiscale study). This study used the standardized precipitation index (SPI) for the 12-month scale to identify hydrological drought episodes in the PHR from 1979 to 2021. For these episodes, the severity, duration, intensity, and peak were obtained, and the SPI-6 was applied to the longest and most severe drought to identify periods with dry conditions during the wet season. Anomalous atmospheric and oceanic patterns associated with such episodes were also analyzed. The results reveal that the longest and most severe hydrological drought on the PHR started in 2016. The end of this episode was not identified by the end of the analyzed period. The SPI-6 revealed three rainy seasons during this drought event marked by anomalous dry conditions: 2016/2017, 2019/2020, and 2020/2021. In general, the circulation patterns identified differ in each period, for example, in 2016/2017, an El Niño event was dominant, in 2019/2020, the tropical Pacific Ocean showed neutral conditions, and in 2020/2021, a La Niña episode was registered. Despite that, in the three periods, the anomalous atmospheric patterns contributed to the weakening of the low-level jet east of the Andes and, consequently, to the decreasing of the moisture transport to the PHR, then leading to dry conditions over the basin. Full article
(This article belongs to the Special Issue Heavy Precipitation Events, Causes and Affections)
Show Figures

Figure 1

22 pages, 2636 KiB  
Article
Climate Change Impacts and Adaptation in a Hill Farming System of the Himalayan Region: Climatic Trends, Farmers’ Perceptions and Practices
by Khem Raj Dahal, Piyush Dahal, Raj Kumar Adhikari, Veera Naukkarinen, Dinesh Panday, Niranjan Bista, Juha Helenius and Buddhi Marambe
Climate 2023, 11(1), 11; https://doi.org/10.3390/cli11010011 - 30 Dec 2022
Cited by 4 | Viewed by 5612
Abstract
Farming communities in the hills and mountains of the Himalayan region are some of the most vulnerable to the changing climate, owing to their specific biophysical and socioeconomic conditions. Understanding the observed parameters of the changing climate and the farmers’ perceptions of it, [...] Read more.
Farming communities in the hills and mountains of the Himalayan region are some of the most vulnerable to the changing climate, owing to their specific biophysical and socioeconomic conditions. Understanding the observed parameters of the changing climate and the farmers’ perceptions of it, together with their coping approaches, is an important asset to making farming communities resilient. Therefore, this study aimed to explore the observed change in climatic variables; understand farmers’ perceptions of the changing climate; and document their adaptation approaches in farming systems in the mid-hills of the central Himalayas. Data on the observed change in climatic variables were obtained from the nearby meteorological stations and gridded regional products, and farmers’ perceptions and their adaptation practices were collected from household surveys and from the interviews of key informants. The analysis of temperature data revealed that there has been a clear warming trend. Winter temperatures are increasing faster than summer and annual temperatures, indicating a narrowing temperature range. Results on precipitation did not show a clear trend but exhibited large inter-annual variability. The standardized precipitation index (SPI) showed an increased frequency of droughts in recent years. Farmers’ perceptions of the changing climate are coherent with the observed changes in climatic parameters. These changes may have a substantial impact on agriculture and the livelihood of the people in the study area. The farmers are adapting to climate change by altering their farming systems and practices. Location-specific adaptation approaches used by farmers are valuable assets for community resilience. Full article
(This article belongs to the Collection Adaptation and Mitigation Practices and Frameworks)
Show Figures

Figure 1

13 pages, 2884 KiB  
Article
Growth Response of Red Oaks to Climatic Conditions in the Lower Mississippi Alluvial Valley: Implications for Bottomland Hardwood Restoration with a Changing Climate
by Junyeong Choi, Nana Tian, Jianbang Gan, Matthew Pelkki and Ouname Mhotsha
Climate 2023, 11(1), 10; https://doi.org/10.3390/cli11010010 - 30 Dec 2022
Cited by 1 | Viewed by 1693
Abstract
Bottomland hardwood forests (BHFs) offer a wide range of ecosystem services that are of high environmental and socioeconomic value. Yet, nearly 70% of BHFs in the southern United States have been lost during the past 100 years primarily due to land use change [...] Read more.
Bottomland hardwood forests (BHFs) offer a wide range of ecosystem services that are of high environmental and socioeconomic value. Yet, nearly 70% of BHFs in the southern United States have been lost during the past 100 years primarily due to land use change including agricultural expansion, calling for restoration efforts. We estimated the statistical relationship of the annual radial growth rate of three red oak species with climatic conditions and tree age using the tree ring data collected from a BHF plantation in the Arkansas Delta region. These species were Cherry bark oak (Quercus pagoda), Shumard oak (Quercus shumardii), and Nuttall oak (Quercus texana). The destructive sampling method was employed to obtain tree growth data and the cross-dating method was used for tree age determination. A log-linear regression model was estimated to uncover the statistical relationship between annual tree ring growth rate and climatic conditions. We identified the most critical time windows of climate variables that affect the growth of these trees. We found that the average temperature in October of the previous year and the minimum temperature between December of the previous year and January of the current year were positively associated with the radial growth rate in the current year although the maximum temperature from January to August and total precipitation from April to July of the current year were negatively correlated with the growth rate. Compared to Cherry bark and Shumard oaks, Nuttall oak was less sensitive to a rise in the minimum temperature between December and January. The projected climate change is likely to create slightly more favorable overall climatic conditions for these oak species in the region. Our findings suggest that these three red oak species are well suited for the study region for restoring BHFs, especially with a changing climate. Full article
(This article belongs to the Special Issue Climate Change and Deforestation and Forest Degradation)
Show Figures

Figure 1

9 pages, 3507 KiB  
Article
Identifying Common Trees and Herbaceous Plants to Mitigate Particulate Matter Pollution in a Semi-Arid Mining Region of South Africa
by Sutapa Adhikari, Madeleen Struwig and Stefan John Siebert
Climate 2023, 11(1), 9; https://doi.org/10.3390/cli11010009 - 28 Dec 2022
Cited by 3 | Viewed by 1938
Abstract
Plants provide long-term and sustainable solutions to mitigate particulate matter (PM) pollution in urban environments. We evaluated total, fine, coarse and large particle trapping abilities of an equal number of common trees (Carica papaya, Citrus limon, Moringa oleifera, Ozoroa [...] Read more.
Plants provide long-term and sustainable solutions to mitigate particulate matter (PM) pollution in urban environments. We evaluated total, fine, coarse and large particle trapping abilities of an equal number of common trees (Carica papaya, Citrus limon, Moringa oleifera, Ozoroa paniculosa, Peltophorum africanum, Psidium guajava) and herbaceous species (Argemone ochroleuca, Catharanthus roseus, Gomphocarpus fruticosus, Ipomoea batatas, Senna italica, Tribulus terrestris) to identify dust accumulators for Sekhukhuneland, a mining–smelting region of South Africa where desertification is becoming problematic. Scanning electron microscopy techniques were used to count and measure particles and relate leaf surface micromorphology to dust accumulation. Three tree and three herbaceous species showed superior dust collection capacity (G. fruticosus > P. guajava > I. batatasO. paniculosa > C. roseus > M. oleifera). Variations in accumulation of PM sizes were noted among these six species and between adaxial and abaxial leaf surfaces. Compared with large PM, all plants accumulated more fine and coarse fractions which are respirable and thus hazardous to human health. Leaf surface roughness, epicuticular wax and epidermal glands improved dust accumulation. The six preferred plants may serve as forerunner species to abate PM pollution in Sekhukhuneland and other arid regions facing similar climate change and pollution challenges. Full article
(This article belongs to the Special Issue Climate Change and Outdoor-Indoor Air Pollution in Urban Environments)
Show Figures

Figure 1

15 pages, 6176 KiB  
Article
Evaluation of WRF Microphysics Schemes Performance Forced by Reanalysis and Satellite-Based Precipitation Datasets for Early Warning System of Extreme Storms in Hyper Arid Environment
by Mohamed Mekawy, Mohamed Saber, Sayed A. Mekhaimar, Ashraf Saber Zakey, Sayed M. Robaa and Magdy Abdel Wahab
Climate 2023, 11(1), 8; https://doi.org/10.3390/cli11010008 - 27 Dec 2022
Cited by 5 | Viewed by 2148
Abstract
In this paper, we will investigate the influence of the microphysics schemes on the rainfall pattern of the extreme storm that impacted Egypt on 12 March 2020. The aim is to improve rainfall forecasting using the numerical Weather Research and Forecasting (WRF) model [...] Read more.
In this paper, we will investigate the influence of the microphysics schemes on the rainfall pattern of the extreme storm that impacted Egypt on 12 March 2020. The aim is to improve rainfall forecasting using the numerical Weather Research and Forecasting (WRF) model for an effective Early Warning System (EWS). The performance of six microphysics schemes were evaluated using the Model Object-based Evaluation analysis tool (MODE) forced by three selected satellite-based datasets (CMORPH, PERSIANN, PERSIANN-CCS, etc.) and one reanalysis dataset (ERA5). Six numerical simulations were performed using the WRF model, considering the following microphysics schemes: Lin, WSM6, Goddard, Thompson, Morrison, and NSSL2C. The models were evaluated using both conventional statistical indices and MODE, which is much more suitable in such studies. The results showed that the Lin scheme outperformed the other schemes such as WSM6, Goddard, Thompson, Morrison, and NSSL2C, in rainfall forecasting. The Thompson scheme was found to be the least reliable scheme. An extension for this study is recommended in other regions where the observational rain gauges data are available. Full article
(This article belongs to the Section Weather, Events and Impacts)
Show Figures

Figure 1

16 pages, 1140 KiB  
Article
Impact of Climate Information Services on Crop Yield in Ebonyi State, Nigeria
by Chinenye Judith Onyeneke, Gibson Nwabueze Umeh and Robert Ugochukwu Onyeneke
Climate 2023, 11(1), 7; https://doi.org/10.3390/cli11010007 - 26 Dec 2022
Cited by 5 | Viewed by 2391
Abstract
This paper assessed crop farmers’ access and utilization of climate information services (CIS) and impact of CIS use on crop yields in Ebonyi State, Nigeria. The multi-stage sampling procedure was used to select 405 farmers from the State, and data were collected through [...] Read more.
This paper assessed crop farmers’ access and utilization of climate information services (CIS) and impact of CIS use on crop yields in Ebonyi State, Nigeria. The multi-stage sampling procedure was used to select 405 farmers from the State, and data were collected through a survey of the farmers using a questionnaire. We employed descriptive statistics, endogenous treatment effect, and Heckman probit selection model to analyze the data collected. The result indicates that a majority (89%) of the farmers accessed climate information and that the common sources of climate information include agricultural extension officers, fellow farmers, and radio. This study shows that 88% of the farmers used climate information services in making farming decisions. Farmers’ age, household size, marital status, farming experience, income extension contact, ownership of television, ownership of radio, ownership of mobile phone, proximity to the market, workshop/training participation, climate events experienced, and knowledge of appropriate application of fertilizer significantly influenced both access and utilization of CIS. The use of CIS in planning for farming activities significantly increased rice, maize, and cassava yields. The study demonstrates the important contribution of climate information services in crop production. We therefore recommend that access and use of climate information services in agricultural communities should be increased. Full article
Show Figures

Figure 1

12 pages, 2232 KiB  
Article
Extreme Coastal Water Levels Evolution at Dakar (Senegal, West Africa)
by Cheikh Omar Tidjani Cissé, Rafael Almar, Jean Paul Marcel Youm, Serge Jolicoeur, Adelaide Taveneau, Boubou Aldiouma Sy, Issa Sakho, Bamol Ali Sow and Habib Dieng
Climate 2023, 11(1), 6; https://doi.org/10.3390/cli11010006 - 26 Dec 2022
Cited by 3 | Viewed by 2730
Abstract
Increasingly, it is reported that the coastline of the Dakar region is affected by coastal flooding due to extreme water levels during wave events. Here, we quantify the extreme coastal water levels as well as the different factors contributing to coastal flooding during [...] Read more.
Increasingly, it is reported that the coastline of the Dakar region is affected by coastal flooding due to extreme water levels during wave events. Here, we quantify the extreme coastal water levels as well as the different factors contributing to coastal flooding during the period 1994–2015. Severe water levels reach values of 1.78 m and increase by 8.4 mm/year. The time spent above this threshold has already increased by 1.7 over the study period and will increase by 2100 to 8 times with 0.4 m mean sea level rise and up to 20 times with 0.8 m in the IPCC low and high greenhouse gas emission scenarios, respectively. Tide is the main contributor to the extremes when combined with large wave runup, due to wave breaking which contributes to 38% of the increase in extreme events while sea level rises to 44%. Our results show that because of its prominent location, Dakar region is affected by waves coming from the Northern and Southern Hemispheres with contrasted evolutions: wave runup events increase faster (7 mm/year) during austral winter due to a maximum of the South Atlantic storm activity, and have a decreasing trend (−3 mm/year) during boreal winter (December, January, February) driven by the evolution of corresponding climate modes. Full article
(This article belongs to the Special Issue Severe Weather Disasters)
Show Figures

Figure 1

23 pages, 13854 KiB  
Article
Spatio-Temporal Analysis of Heatwaves Characteristics in Greece from 1950 to 2020
by Elissavet Galanaki, Chris Giannaros, Vassiliki Kotroni, Kostas Lagouvardos and Georgios Papavasileiou
Climate 2023, 11(1), 5; https://doi.org/10.3390/cli11010005 - 25 Dec 2022
Cited by 8 | Viewed by 4584
Abstract
Heatwave events are of major concern in the global context, since they can significantly impact ecosystems, economies and societies. For this reason, more detailed analyses of the characteristics and trends of heatwaves represent a priority that cannot be neglected. In this study, the [...] Read more.
Heatwave events are of major concern in the global context, since they can significantly impact ecosystems, economies and societies. For this reason, more detailed analyses of the characteristics and trends of heatwaves represent a priority that cannot be neglected. In this study, the interannual and decadal variability of seven indices of heatwaves were investigated during the warmest period of the year (June–August) by using an enhanced resolution reanalysis model (ERA5-Land) over a 71-year period (1950–2020) for the area of Greece. Heatwaves were defined as periods where two thresholds, based on a modified version of the Excess Heat Factor index (EHF) and the 95th percentile of the maximum daily temperature, were exceeded for at least three consecutive days. Greece experiences almost yearly 0.7 heatwaves on average during the whole period of study, while this value has increased by ~80% since 1990. Trend analysis revealed that heatwaves have become more frequent, longer, and more intense since 1950. The percentage of the land area that experiences at least one heatwave per year was almost doubled in the examined period. An increasing trend in the number of heatwaves that occurred in June was identified. Full article
Show Figures

Figure 1

22 pages, 8245 KiB  
Article
Climate Patterns Affecting Cold Season Air Pollution of Ulaanbaatar City, Mongolia
by Erdenesukh Sumiya, Sandelger Dorligjav, Myagmartseren Purevtseren, Gantulga Gombodorj, Munkhbat Byamba-Ochir, Oyunchimeg Dugerjav, Munkhnaran Sugar, Bolormaa Batsuuri and Bazarkhand Tsegmid
Climate 2023, 11(1), 4; https://doi.org/10.3390/cli11010004 - 24 Dec 2022
Cited by 2 | Viewed by 4256
Abstract
Many studies have been conducted on air pollution in Ulaanbaatar city. However, most have focused on the sources of pollutants and their characteristics and distribution. Although the location of the city subjects it to unavoidable natural conditions where air pollution accumulates during the [...] Read more.
Many studies have been conducted on air pollution in Ulaanbaatar city. However, most have focused on the sources of pollutants and their characteristics and distribution. Although the location of the city subjects it to unavoidable natural conditions where air pollution accumulates during the cold season, nature-based solutions have not yet been considered in the projects implemented to mitigate air pollution levels. Therefore, this study aims to determine the combined influence of geography and atmospheric factors on cold season air pollution. The spatiotemporal variations in the variables were investigated using meteorological observation data from 1991 to 2020 in the different land-use areas. Then, atmospheric stagnation conditions and air pollution potential parameters were estimated from daily radiosonde data. Subsequently, the temporal variations in air pollutants were studied and correlated with estimates of the above parameters. In the Ulaanbaatar depression, the stable cold air lake (colder than −13.5 °C), windless (34–66% of all observations), and poor turbulent mixing conditions were formed under the near-surface temperature inversion layer in the cold season. Moreover, due to the mountain topography, the winds toward the city center from all sides cause polluted air to accumulate in the city center for long periods. Air pollution potential was categorized as very high and high (<4000 m2·s−1), in the city in winter, indicating the worst air quality. Thus, further urban planning policy should consider these nature factors. Full article
Show Figures

Figure 1

17 pages, 5536 KiB  
Article
A Novel Bias Correction Method for Extreme Events
by Laura Trentini, Sara Dal Gesso, Marco Venturini, Federica Guerrini, Sandro Calmanti and Marcello Petitta
Climate 2023, 11(1), 3; https://doi.org/10.3390/cli11010003 - 23 Dec 2022
Cited by 3 | Viewed by 2886
Abstract
When one is using climate simulation outputs, one critical issue to consider is the systematic bias affecting the modelled data. The bias correction of modelled data is often used when one is using impact models to assess the effect of climate events on [...] Read more.
When one is using climate simulation outputs, one critical issue to consider is the systematic bias affecting the modelled data. The bias correction of modelled data is often used when one is using impact models to assess the effect of climate events on human activities. However, the efficacy of most of the currently available methods is reduced in the case of extreme events because of the limited number of data for these low probability and high impact events. In this study, a novel bias correction methodology is proposed, which corrects the bias of extreme events. To do so, we extended one of the most popular bias correction techniques, i.e., quantile mapping (QM), by improving the description of extremes through a generalised extreme value distribution (GEV) fitting. The technique was applied to the daily mean temperature and total precipitation data from three seasonal forecasting systems: SEAS5, System7 and GCFS2.1. The bias correction efficiency was tested over the Southern African Development Community (SADC) region, which includes 15 Southern African countries. The performance was verified by comparing each of the three models with a reference dataset, the ECMWF reanalysis ERA5. The results reveal that this novel technique significantly reduces the systematic biases in the forecasting models, yielding further improvements over the classic QM. For both the mean temperature and total precipitation, the bias correction produces a decrease in the Root Mean Squared Error (RMSE) and in the bias between the simulated and the reference data. After bias correcting the data, the ensemble forecasts members that correctly predict the temperature extreme increases. On the other hand, the number of members identifying precipitation extremes decreases after the bias correction. Full article
(This article belongs to the Special Issue Seasonal Forecasting Climate Services for the Energy Industry)
Show Figures

Figure 1

19 pages, 5241 KiB  
Article
A Southeastern United States Warm Season Precipitation Climatology Using Unsupervised Learning
by Andrew Mercer and Jamie Dyer
Climate 2023, 11(1), 2; https://doi.org/10.3390/cli11010002 - 23 Dec 2022
Cited by 1 | Viewed by 1536
Abstract
Agriculture in the southeastern United States (SEUS) is heavily reliant upon water resources provided by precipitation during the warm season (June–August). The convective and stochastic nature of SEUS warm season precipitation introduces challenges in terms of water availability in the region by creating [...] Read more.
Agriculture in the southeastern United States (SEUS) is heavily reliant upon water resources provided by precipitation during the warm season (June–August). The convective and stochastic nature of SEUS warm season precipitation introduces challenges in terms of water availability in the region by creating localized maxima and minima. Clearly, a detailed and updated warm season precipitation climatology for the SEUS is important for end users reliant on these water resources. As such, a nonlinear unsupervised learning method (kernel principal component analysis blended with cluster analysis) was used to develop a NARR-derived SEUS warm season precipitation climatology. Three clusters resulted from the analysis, all of which strongly resembled the mean spatially (r > 0.9) but had widely variable precipitation magnitude, as one cluster denoted a mean pattern, one a dry pattern, and one a wet pattern. The clusters were related back to major SEUS warm season precipitation moderators (tropical cyclone landfall and the El Niño–southern oscillation (ENSO)) and revealed a clearer ENSO relationship when discriminating among the cluster patterns. Ultimately, these updated SEUS precipitation patterns can help end users identify areas of notable sensitivity to different climate phenomena, helping to optimize the economic use of these critical water resources. Full article
(This article belongs to the Section Climate and Environment)
Show Figures

Figure 1

22 pages, 7640 KiB  
Article
Wetland Water Level Prediction Using Artificial Neural Networks—A Case Study in the Colombo Flood Detention Area, Sri Lanka
by Tharaka Jayathilake, Ranjan Sarukkalige, Yukinobu Hoshino and Upaka Rathnayake
Climate 2023, 11(1), 1; https://doi.org/10.3390/cli11010001 - 21 Dec 2022
Cited by 4 | Viewed by 2088
Abstract
Historically, wetlands have not been given much attention in terms of their value due to the general public being unaware. Nevertheless, wetlands are still threatened by many anthropogenic activities, in addition to ongoing climate change. With these recent developments, water level prediction of [...] Read more.
Historically, wetlands have not been given much attention in terms of their value due to the general public being unaware. Nevertheless, wetlands are still threatened by many anthropogenic activities, in addition to ongoing climate change. With these recent developments, water level prediction of wetlands has become an important task in order to identify potential environmental damage and for the sustainable management of wetlands. Therefore, this study identified a reliable neural network model by which to predict wetland water levels over the Colombo flood detention area, Sri Lanka. This is the first study conducted using machine learning techniques in wetland water level predictions in Sri Lanka. The model was developed with independent meteorological variables, including rainfall, evaporation, temperature, relative humidity, and wind speed. The water levels measurements of previous years were used as dependent variables, and the analysis was based on a seasonal timescale. Two neural network training algorithms, the Levenberg Marquardt algorithm (LM) and the Scaled Conjugate algorithm (SG), were used to model the nonlinear relationship, while the Mean Squared Error (MSE) and Coefficient of Correlation (CC) were used as the performance indices by which to understand the robustness of the model. In addition, uncertainty analysis was carried out using d-factor simulations. The performance indicators showed that the LM algorithm produced better results by which to model the wetland water level ahead of the SC algorithm, with a mean squared error of 0.0002 and a coefficient of correlation of 0.99. In addition, the computational efficiencies were excellent in the LM algorithm compared to the SC algorithm in terms of the prediction of water levels. LM showcased 3–5 epochs, whereas SC showcased 34–50 epochs of computational efficiencies for all four seasonal predictions. However, the d-factor showcased that the results were not within the cluster of uncertainty. Therefore, the overall results suggest that the Artificial Neural Network can be successfully used to predict the wetland water levels, which is immensely important in the management and conservation of the wetlands. Full article
Show Figures

Figure 1

Previous Issue
Next Issue
Back to TopTop