Article

Climate Change Impacts and Adaptation in a Hill Farming System of the Himalayan Region: Climatic Trends, Farmers’ Perceptions and Practices

1
Department of Agronomy, Institute of Agriculture and Animal Science, Tribhuvan University, Kathmandu 44600, Nepal
2
The Small Earth Nepal, Kathmandu 20533, Nepal
3
Value Chain Development of Fruit and Vegetables Project, UNDP, Pulchowk, Lalitpur 44700, Nepal
4
Ruralia Institute, University of Helsinki, 00014 Helsinki, Finland
5
Rodale Institute, Kutztown, PA 19530, USA
6
Faculty of Agriculture, University of Peradeniya, Kandy 20400, Sri Lanka
*
Author to whom correspondence should be addressed.
Climate 2023, 11(1), 11; https://doi.org/10.3390/cli11010011
Submission received: 7 December 2022 / Revised: 25 December 2022 / Accepted: 26 December 2022 / Published: 30 December 2022
(This article belongs to the Collection Adaptation and Mitigation Practices and Frameworks)

Abstract

:
Farming communities in the hills and mountains of the Himalayan region are some of the most vulnerable to the changing climate, owing to their specific biophysical and socioeconomic conditions. Understanding the observed parameters of the changing climate and the farmers’ perceptions of it, together with their coping approaches, is an important asset to making farming communities resilient. Therefore, this study aimed to explore the observed change in climatic variables; understand farmers’ perceptions of the changing climate; and document their adaptation approaches in farming systems in the mid-hills of the central Himalayas. Data on the observed change in climatic variables were obtained from the nearby meteorological stations and gridded regional products, and farmers’ perceptions and their adaptation practices were collected from household surveys and from the interviews of key informants. The analysis of temperature data revealed that there has been a clear warming trend. Winter temperatures are increasing faster than summer and annual temperatures, indicating a narrowing temperature range. Results on precipitation did not show a clear trend but exhibited large inter-annual variability. The standardized precipitation index (SPI) showed an increased frequency of droughts in recent years. Farmers’ perceptions of the changing climate are coherent with the observed changes in climatic parameters. These changes may have a substantial impact on agriculture and the livelihood of the people in the study area. The farmers are adapting to climate change by altering their farming systems and practices. Location-specific adaptation approaches used by farmers are valuable assets for community resilience.

1. Introduction

Climate change is already affecting many aspects of human life and society, as well as the natural environment globally. While it affects all regions of the world, the Himalayan region has been identified as one of the most vulnerable regions due to the high sensitivity of the ecosystems and the low adaptive capacity of the local people [1,2,3]. Vulnerability in these areas is also exacerbated by their remoteness and marginalization [4]. The most widely reported impacts of climate change on the Himalayan regions include decreased agricultural production, reduced water availability [5,6,7,8,9], and an increase in weather/climate-induced disasters [10,11,12,13] with many other cascading effects of these changes [3,14,15]. Studies suggest that further increases in greenhouse gas concentrations will result in a substantial additional warming of the atmosphere and thereby accelerate climate change in the future [16].
Among the various sectors of human endeavor, agriculture is one of the most adversely affected sectors due to climate change in this region [17,18,19]. Climate change is expected to decrease agricultural production, which has a negative impact on food security [20]. Increasing temperature and changing precipitation patterns may change the growing season, crop duration, and soil moisture regime, inducing drought in the crop plants, thereby negatively affecting crop yield [21,22,23]. More frequent and heavy precipitation increases the risk of crop damage from flooding, soil erosion, and landslides. In recent years, such impacts are being observed [24] frequently and may become more prominent over the next couple of decades [25,26]. People of the Himalayan region are largely (about 70%) dependent on weather-based agriculture for livelihood making this region and people vulnerable [27].
Climate model studies at a global or regional scale exhibit a bigger picture of climate change but they are not very good at providing information about changes and their impacts at the local level [20,28,29]. Although climate change is a universal phenomenon, its indicators and impacts are local, and so are the adaptation choices, strategies, and practices [20,30,31]. Therefore, there has been increasing emphasis on the bottom-up approaches that climate change studies should be conducted at the local level where adaptations take place [32,33,34]. In recent years, there is an increasing realization that local people are valuable sources of such information [14,35,36]. Indigenous people are not only keenly observing the changing climate, but also actively reacting and trying to adapt to it [37,38].
Compared to other regions of the world, the Himalayas are less explored and examined in scientific literature that deals with climate change and its impacts on agriculture at the local level [20,39,40]. This lack of widely available scientific data related to climate change impacts at local levels, especially about agriculture in the Himalayas, has rendered governments’ efforts to make communities more climate-resilient a difficult challenge. Therefore, it is important to explore both observed changes in climatic parameters at a local level and the farmers’ perceptions about the changes, and their preferences for coping strategies towards adaptation to it. On the other hand, farmers also need to understand the actual changes and trends in climatic conditions, the associated risks, and how to cope with potential impacts [41]. The specific drive of this study, therefore, was to assess the trends of climate change and perceptions of local people to climate change issues and adaptation measures in practice among the farmers in the mid-hills of the Nepalese Himalayas.
We aimed to answer the following questions: (1) Are there significant changes in the climate in the mountainous area of central Himalayas, and if yes, what are the implications for agriculture? (2) How do farmers perceive climate change? (3) To what extent are the changes in farmers’ agricultural practices toward climate adaptation? Hence, this study expects to enhance our knowledge on the impacts of climate change on agriculture in mountain communities and help develop, design, and implement effective adaptation strategies to reduce vulnerability and strengthen resilience.
Therefore, this study provides insight into how individuals view the issue and how their beliefs influence their behavior and actions on climate change. This type of research is particularly valuable for developing targeted strategies of communicating the risks of climate change and motivating people to act. Additionally, it helps to identify the areas of disagreement and misunderstanding, which can inform policy decisions. Another important aspect of this study is examining how people’s perceptions of climate change vary across different demographics, such as age, gender, education level, and economic status. This can help policymakers and communicators tailor their messages to better resonate with different groups and promote more effective climate action.

2. Material and Methods

2.1. Study Area

The study area is in the central part of the Nepalese Himalayas (Figure 1), which lie in the mid-hill region, encompassing many villages settled in small, scattered clusters with diverse topography. All the villages are settled in the sloping lands. The basic feature of these villages is the high dependence on agriculture, which is of mixed type with crops, livestock, and forestry amalgamated. The climate of the study site is characterized by a hot and humid summer monsoon season with dry and cold winter, although various microclimates can be found within a short distance due to the drastically altering elevations.
Most of the farmers have both upland (around the settlements) and lowlands (at the basement of mountain slopes). There are two main crop-growing seasons: the summer season (June to September) and the winter season (October to May). In the lowlands, they cultivate rice in summer and potato, wheat, and vegetables in winter. The common cropping patterns with three or more crops in a parcel are maize (Zea mays L.), rice (Oryza sativa L.), vegetables; or rice, rice, fallow. The typical upland crops are maize and potato (Solanum tuberosum L.) in summer and mustard (Brassica sp. L.) and wheat/barley (Triticum aestivum L./Hordeum vulgare L.) in winter.
There is no reliable source of water for uplands except rainfall of which about 80% falls from June to September and the available water for farming depends on the onset, cessation, and amount of the monsoon rainfall. Irrigation facilities are available for lowlands, at least for the rice growing season from small streams flowing through the basement of settlements. As an attempt to sustain farming, commercial cultivation of tomato, cucumber, cabbage, and cauliflower is on the rise in the background of growing urbanization and good market in the vicinity. Most of the households have a few cows, goat and a few have buffalo and poultry, which are kept mostly for their domestic use, milk, meat, and manure. At the same time, small-scale poultry, vegetable farming, and dairy business are coming up commercially.

2.2. Climate Data

To analyze the climatic features and trends, daily precipitation data were obtained from the Department of Hydrology and Meteorology (DHM), Government of Nepal. There was no meteorological station inside the study area, and therefore, we used the data from the nearest station in Dhulikhel (6 km apart). The length of records for precipitation was 68 years (1948 to 2015). The missing precipitation data were then filled by using the gridded precipitation data produced by Asian Precipitation Highly Resolved Observational Data Integration Towards Evaluation (APHRODITE) [42]. For the temperature record, the station data contain a lot of missing values, and the quality of data was poor, therefore we used APHRODITE temperature data for the analysis [43]. We included temperature data from 1981 to 2015 in the current study.

2.3. Household Survey and Key Informant Interview

Assessment of farmers’ perception of climate change, its impact on the farming system, and adaptation practices were carried out through a household questionnaire survey. We performed a cross-sectional survey in May 2017 using a multistage random sampling technique. In the first stage, Kavre district was purposively selected to represent the mid-hill farming system of Nepal. In the second stage, Patlekhet Village Development Council was selected randomly. Out of 9 wards of the village council, three wards and four small villages from each ward were randomly selected for the detailed household survey. Those twelve villages vary in altitude, ranging from 900 mm to 1800 m, as well as various other aspects and the slope. Among the total 510 households listed in the study area as the study population, a total of 153 households (30% of the population) were randomly selected as the study sample and surveyed using a semi-structured questionnaire with mostly open-ended questions to get the required information, at household levels. Researchers (and/or hired survey enumerators having at least a graduate degree and experience in similar surveys) visited each household to collect the information. The questionnaire included information on a wide range of variables, such as demography, cropping patterns, farming systems, farmers’ perception of climate change, and practices adopted by them to cope with the impacts. The perception of climate change was based on the experience of changing temperatures, rainfall, and seasonality. We also collected the farmers’ perceptions of the impacts of climate change on agriculture and their responses toward adaptation measures by using open-ended questions.

2.4. Data Analysis

We analyzed the annual and seasonal trends of temperature and precipitation. Mann–Kendall test (MK test) was applied to assess trends of the time series data [43,44]. The Sen’s Slope Estimator [45] was used to determine the magnitude of the trend. The Standardized Precipitation Index (SPI) designed by McKee et al. [46] was used to quantify drought. To compute the SPI, [46] the suggested series of steps were followed with the equation of probability density to satisfy the gamma (Γ) distribution below:
f   x = 1 β x Γ α x α 1 e x / β ,                 x > 0
where χ is the precipitation data series of the considered time scale, α (alpha) and β (beta) indicate the shape and scale parameters, which are estimated through the maximum likelihood method. Integrating the probability density function with respect to χ and inserting the estimated value of α and β, the gamma cumulative distribution function (cdf) is computed at each value of x and then the cdf is transformed into a standard normal distribution to compute SPI.
The SPI values can be interpreted as the number of standard deviations by which the observed anomaly deviates from the long-term mean. The SPI was calculated on the long-term precipitation record for a station and a long-term period (1948 to 2015). We calculated SPI on 3-, 4-, and 12-month time scales, which correspond to the past 3, 4, 12 months of observed precipitation totals, respectively.
Following the research framework presented in Figure 2, the variables explaining the socio-economic characteristics of the respondents and the perception of climate change and adaptation practices were analyzed and presented in form of frequency and the mean. The level of association between the socio-demographic variables of the respondent farmers with the level of awareness of climate change impacts and the use of adaptation measures were presented in cross-tabulation and measured using the chi-square tests statistics. The Logit regression model was used to estimate the influence of different predictor variables on the farmers’ decision to the adoption of climate change adaptation measures. IBM® SPSS® Statistics, version 20 was used for socio-economic data analysis.

2.4.1. Specification of the Model

The decision to adopt any adaptation technology can be considered as a discrete binary dependent variable indicating either yes or no for the decision. The logit or probit models are the most commonly used for examining the factors affecting adoption decisions when it is a binary variable [47,48,49,50,51,52,53]. Though the choice between the logit and probit models largely depends on the convenience of the researchers, the logit model is often commonly used [47,54,55,56,57,58,59] due to its easiness and simple interpretation.
Following Gujarati [50] and Maddala [60], this study constructs the following form of the limited dependent variable regression model fits for this research, which was also adopted in similar research in the past [61,62].
y i * = β 0 + f = 1 k β j χ i j + u i
where (yi*) is the observed “latent” variable while X ‘s are the explanatory variables that affect the decision to adopt the adaptation measures or not, and ui is the error term. The latent variable can only be observed as a dichotomous variable as (yi) is defined by:
y i = 1       i f   y * > 0   0         o t h e r w i s e  
where (yi) is a variable measuring the adoption of adaptation measures or not. If the cumulative distribution of ui is logistic, we have what is known as the logit model as follows:
l o g P i 1 P i = β 0 + f = 1 k β j χ i j + u i
where Pi is the probability of adoption. The left-hand side of this equation is called the log-odds ratio; thus, the log-odds ratio is a linear function of the explanatory variables.

2.4.2. Description of Independent Predictor Variables in the Model

Farmer’s decision is influenced by a number of independent variables (Table 1). The Gender of the farmer would have a positive or negative influence on the decision. Although the male is said to have more freedom and influence in household decision-making, including the adoption of new practices, women are said to have more networks in social groups and thereby may have a role in the decision process. The level of farmers’ education as an ordinal variable measured in a group of schooling years is expected to have a positive influence on farmers’ decision to adopt the technology or practice. Other studies have revealed a positive effect [63,64].
Farmers’ access to operational landholding, a continuous variable expressed in the number of units (ha), is another major determinant in the decision process. There are two thoughts to explain both positive or negative influences on decision-making. If the land holding is limited, farmers would be more concerned towards ensured production, and productivity from limited land by adopting technology or adaptation measures while surplus land may have a negative influence on adoption decision [36].
The Age of the responding farmer is a continuous variable in this model and is expressed in the number of years. Age would have positive or negative effects on a decision, however, it is expected that younger individuals are more likely to adopt technology or innovation adaptations. A similar study in Pakistan revealed the negative influence of age on adoption decisions [64,65]. On the other hand, young farmers may have higher education and more access to different sources of information, so more likely to adopt the technologies. The distance between the farm and the nearest market center is a continuous variable, which is expected to have a negative influence on the adoption decision. Farmers near towns or market centers are expected to adopt new technology to capture the market opportunity better than the farmers residing far from markets.
Similarly, if the farmer holds a higher number of livestock, he is expected to adopt the adaptation measures that complement the crop-livestock linkage in the Nepalese integrated farming system. Apart from the age of farmers, their length of engagement and experience in farming is another expectedly positive influence on the decision variable. The farms in higher altitudes might have limited access to production inputs and services, hence more likely to have a negative role in the adoption decision. The purpose of farming, expressed as a binary variable, either for market purpose or for subsistence, has a positive influence on adaptation measure adoption decisions.

3. Results

3.1. Climatic Characteristics and Trend Analysis

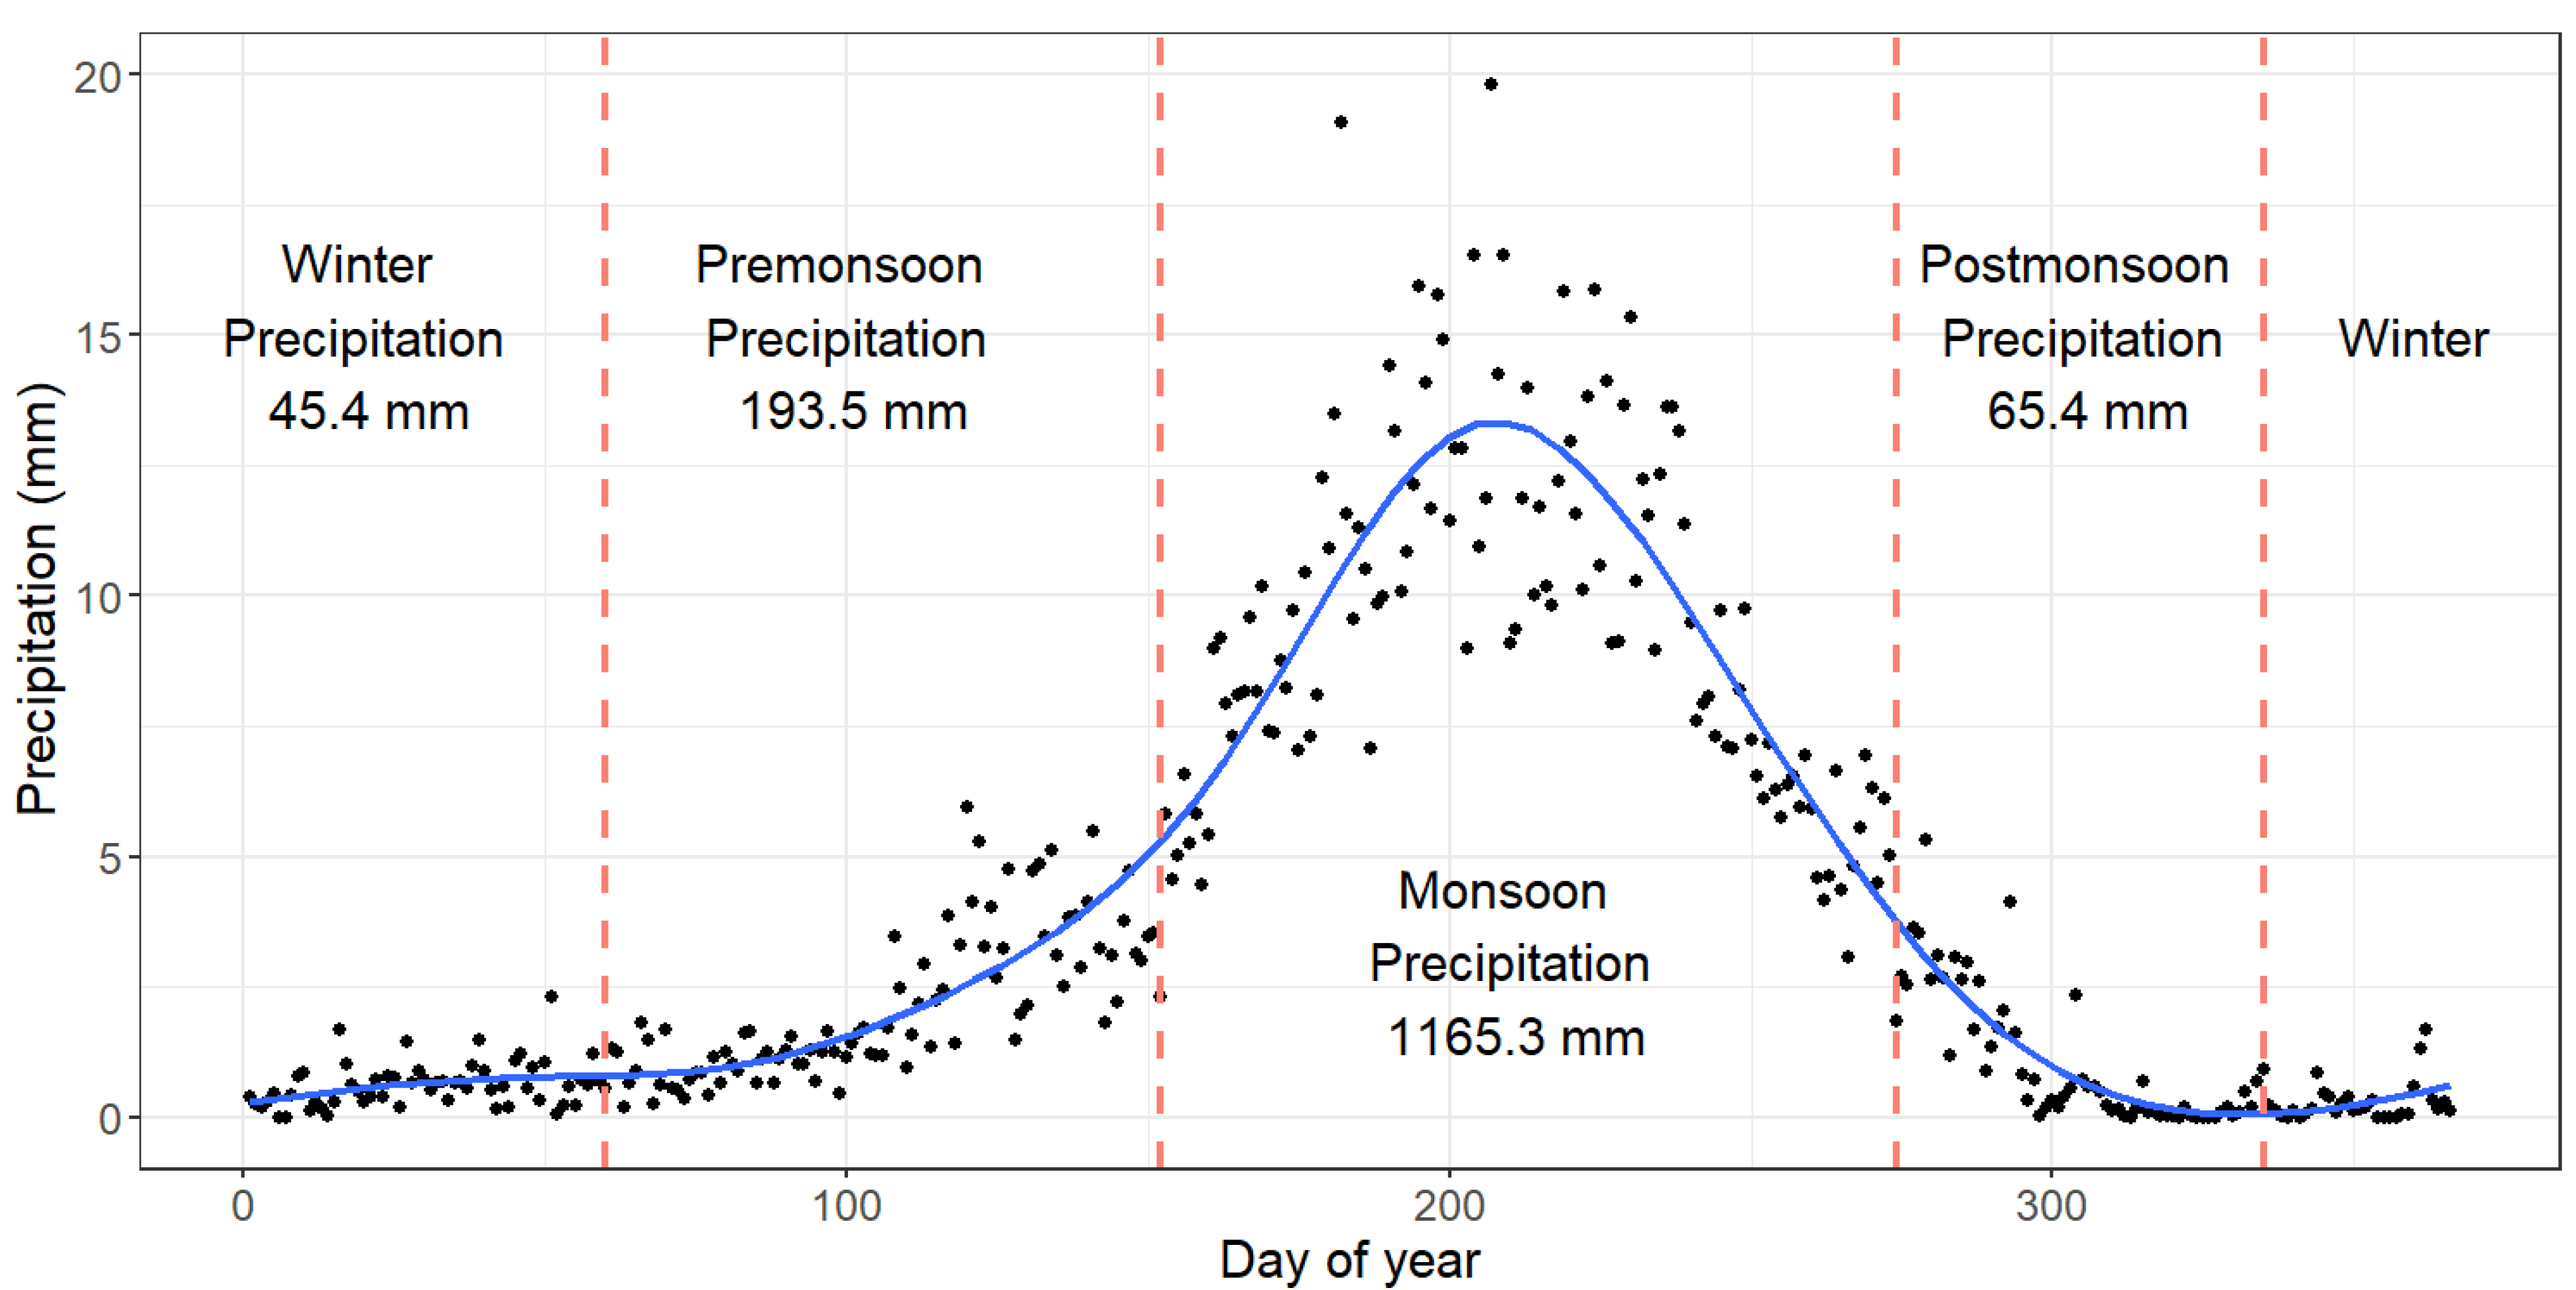
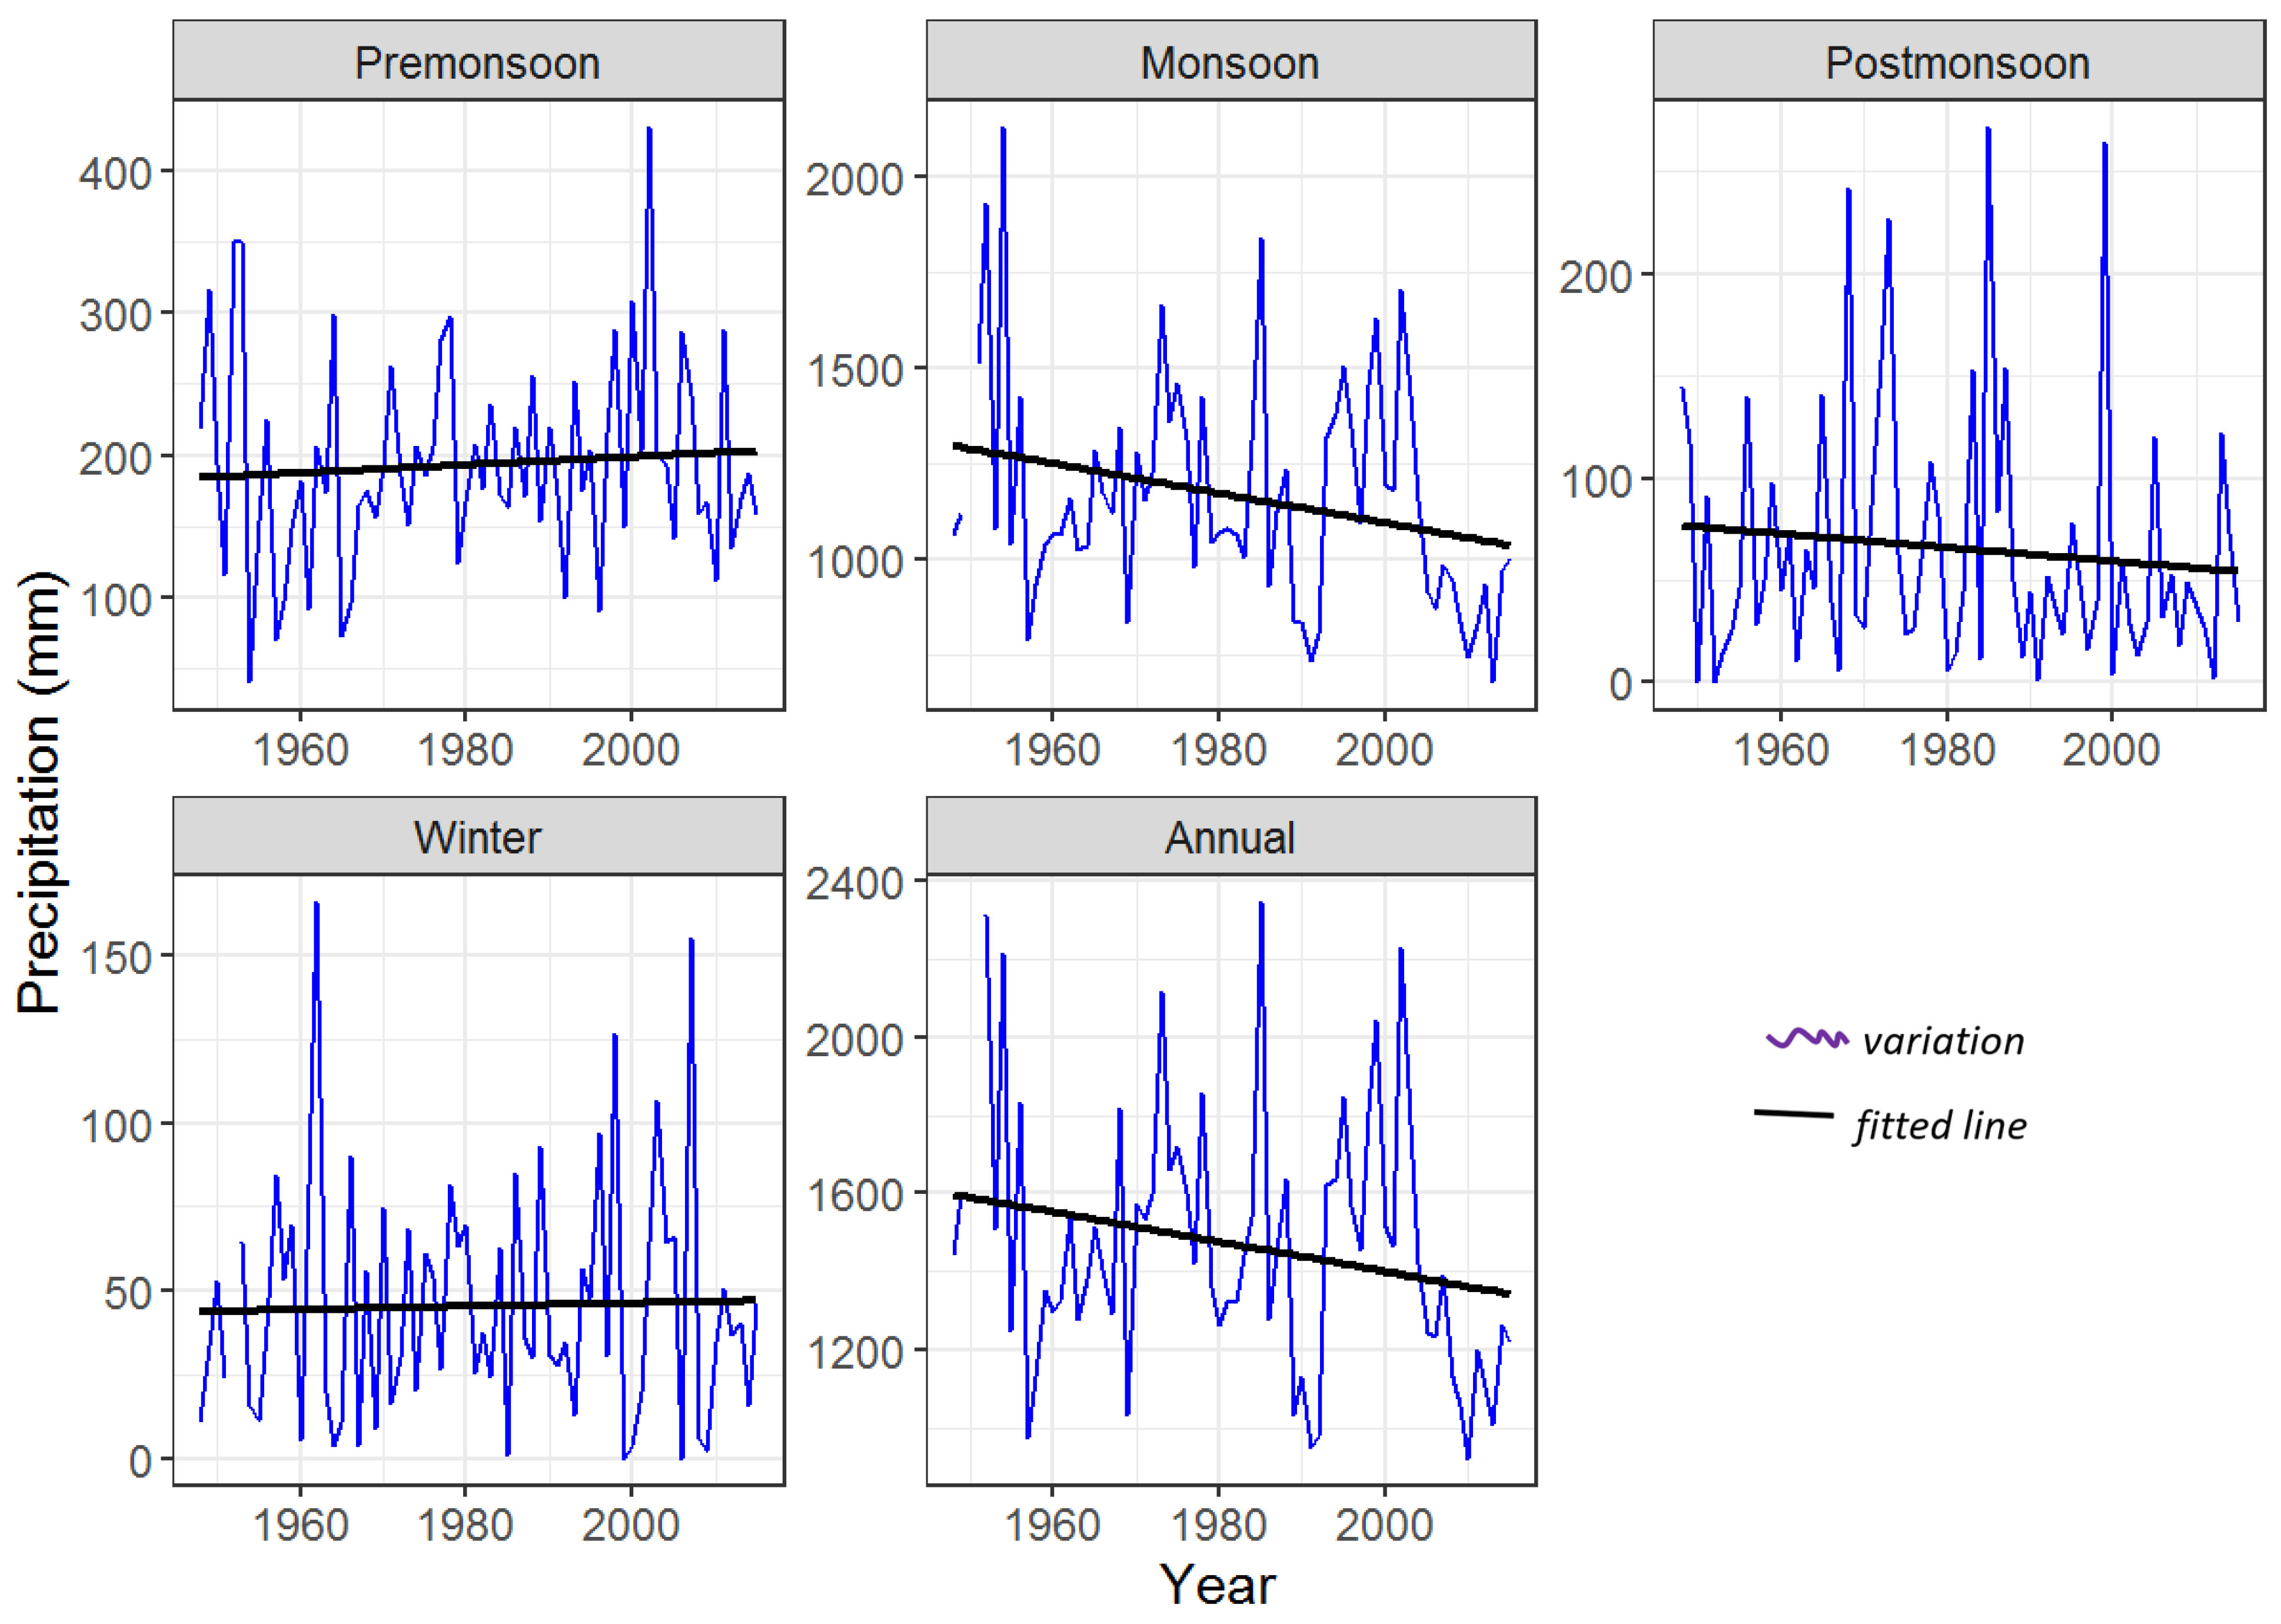
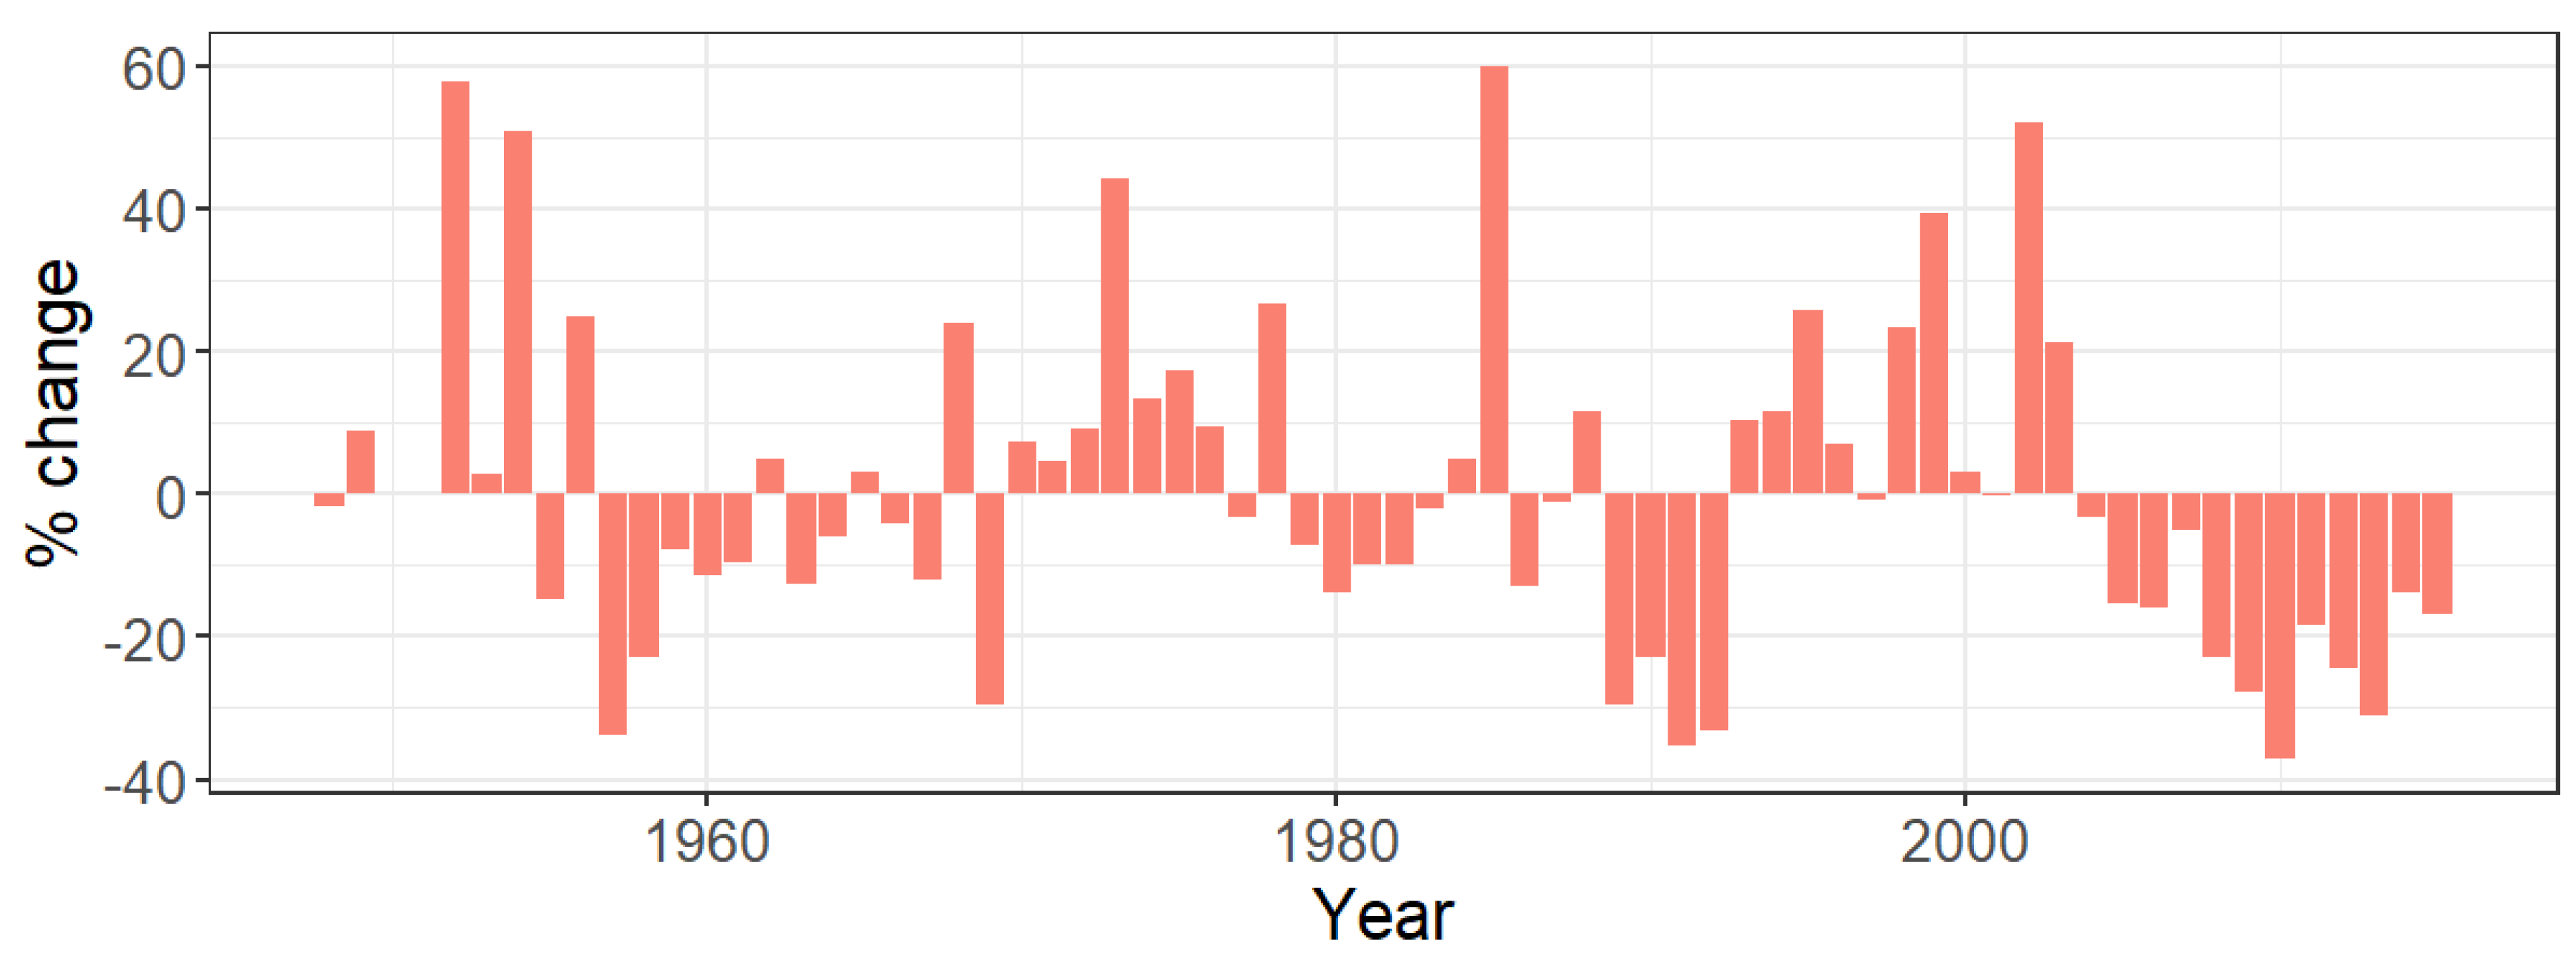
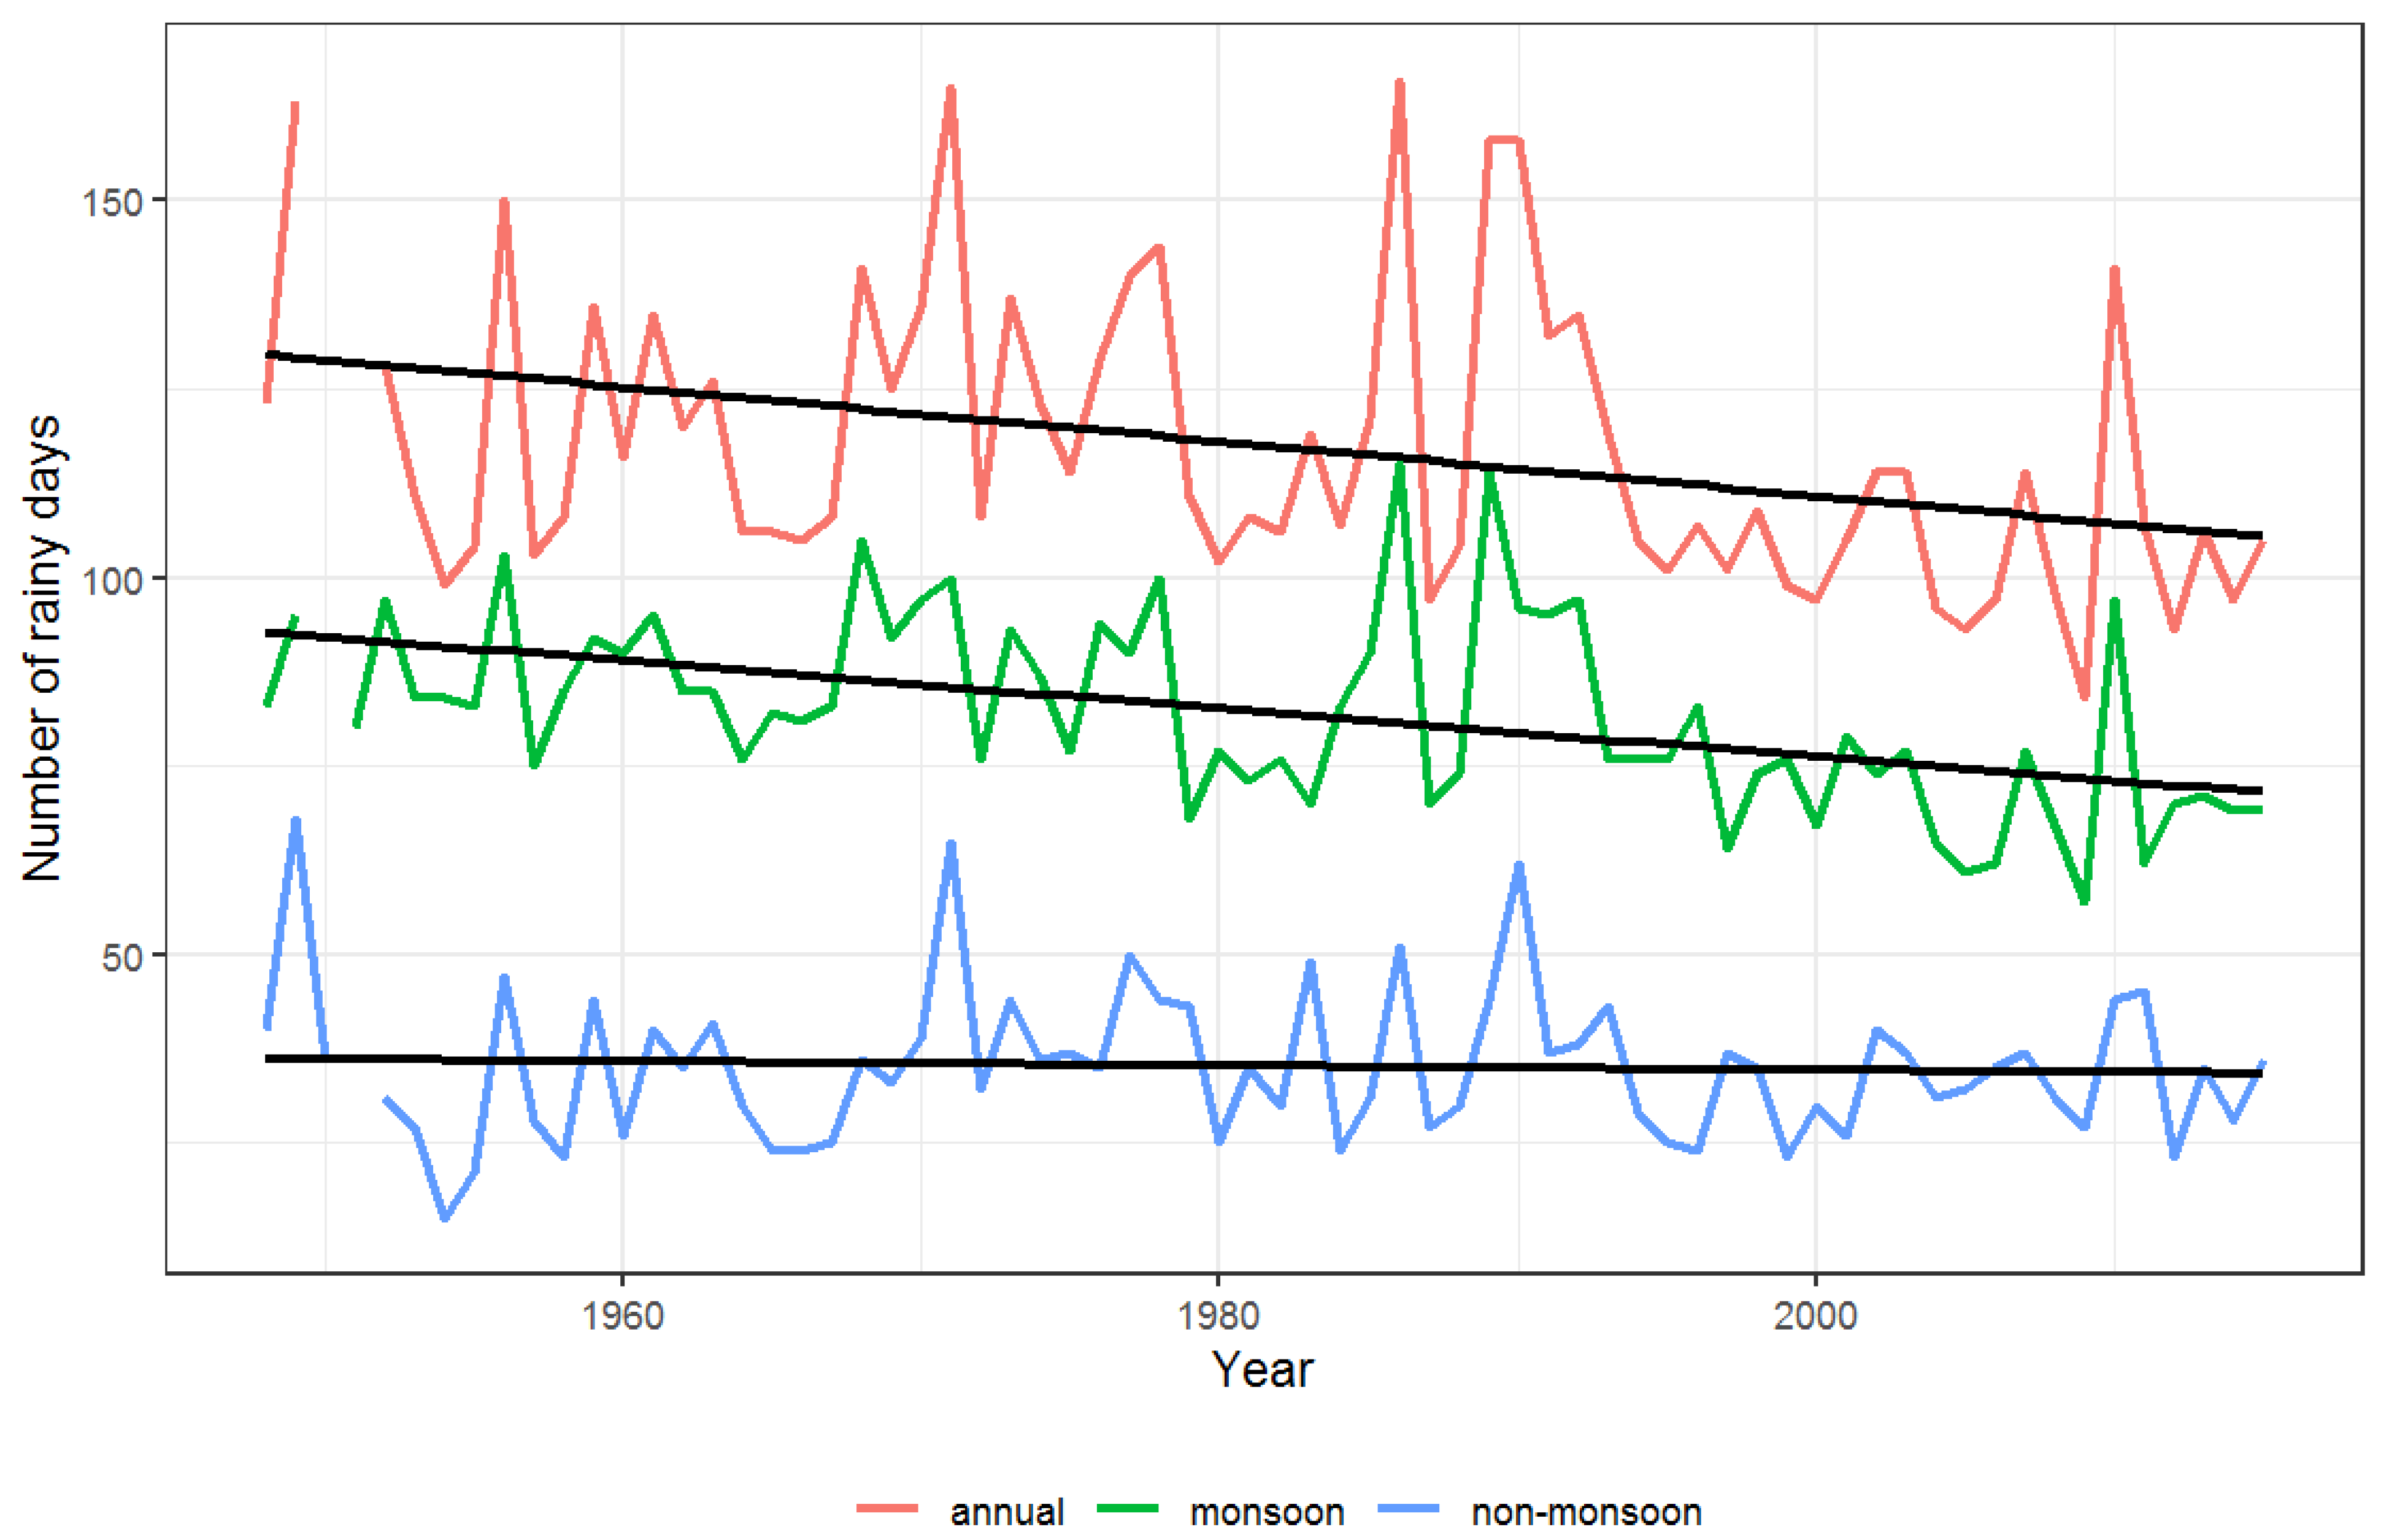
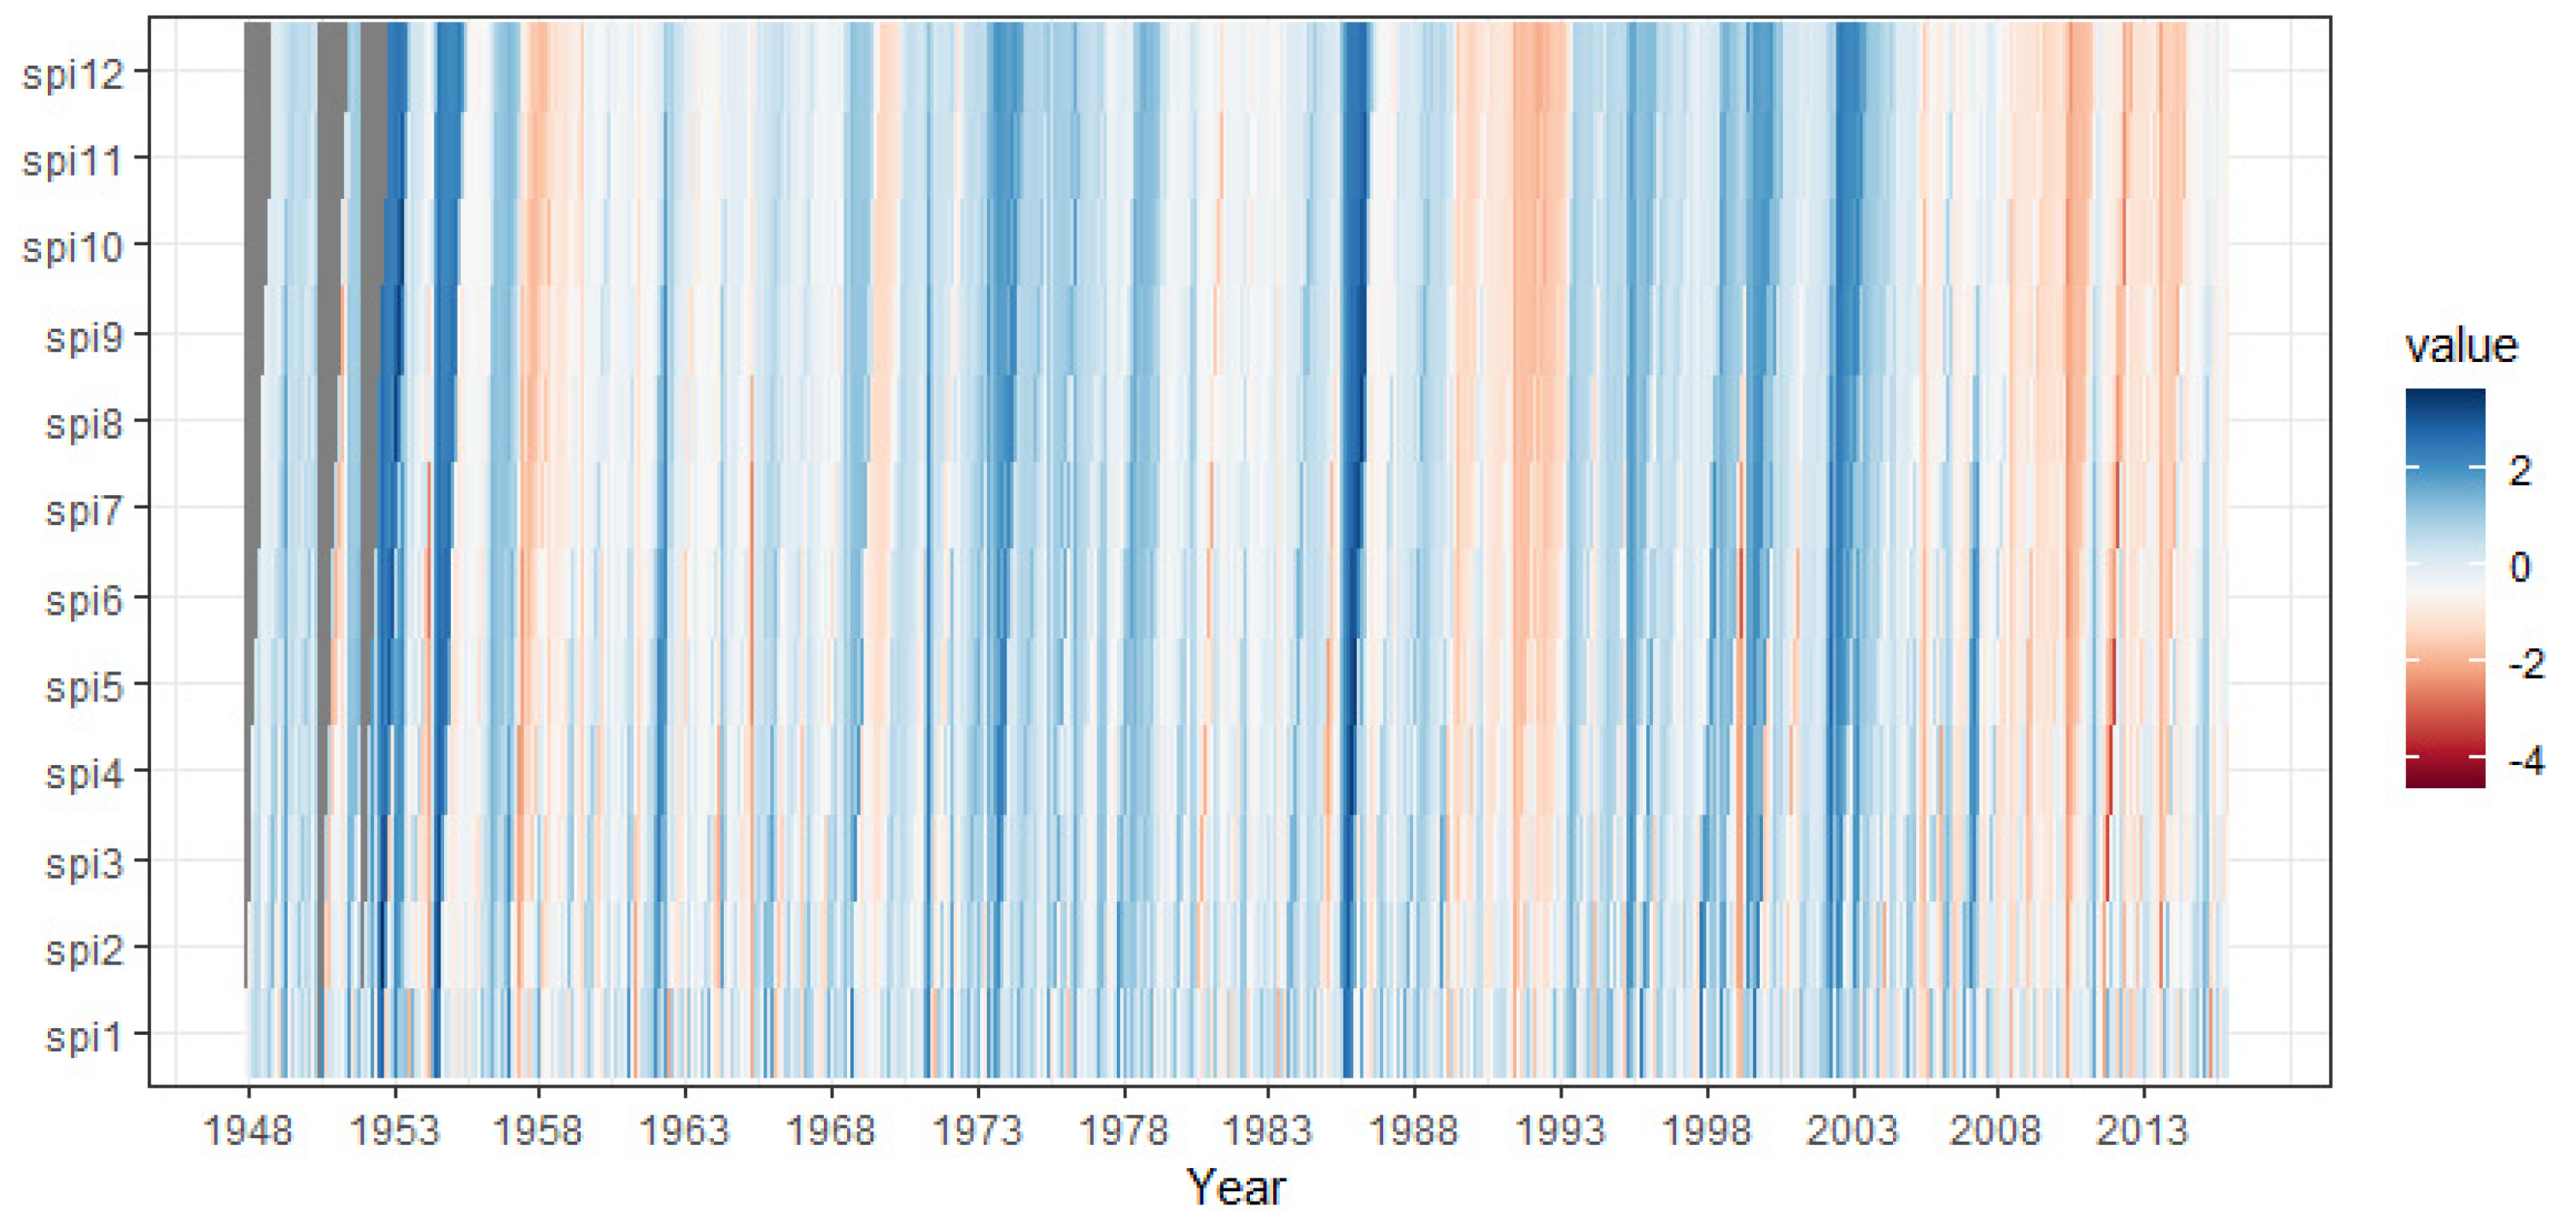
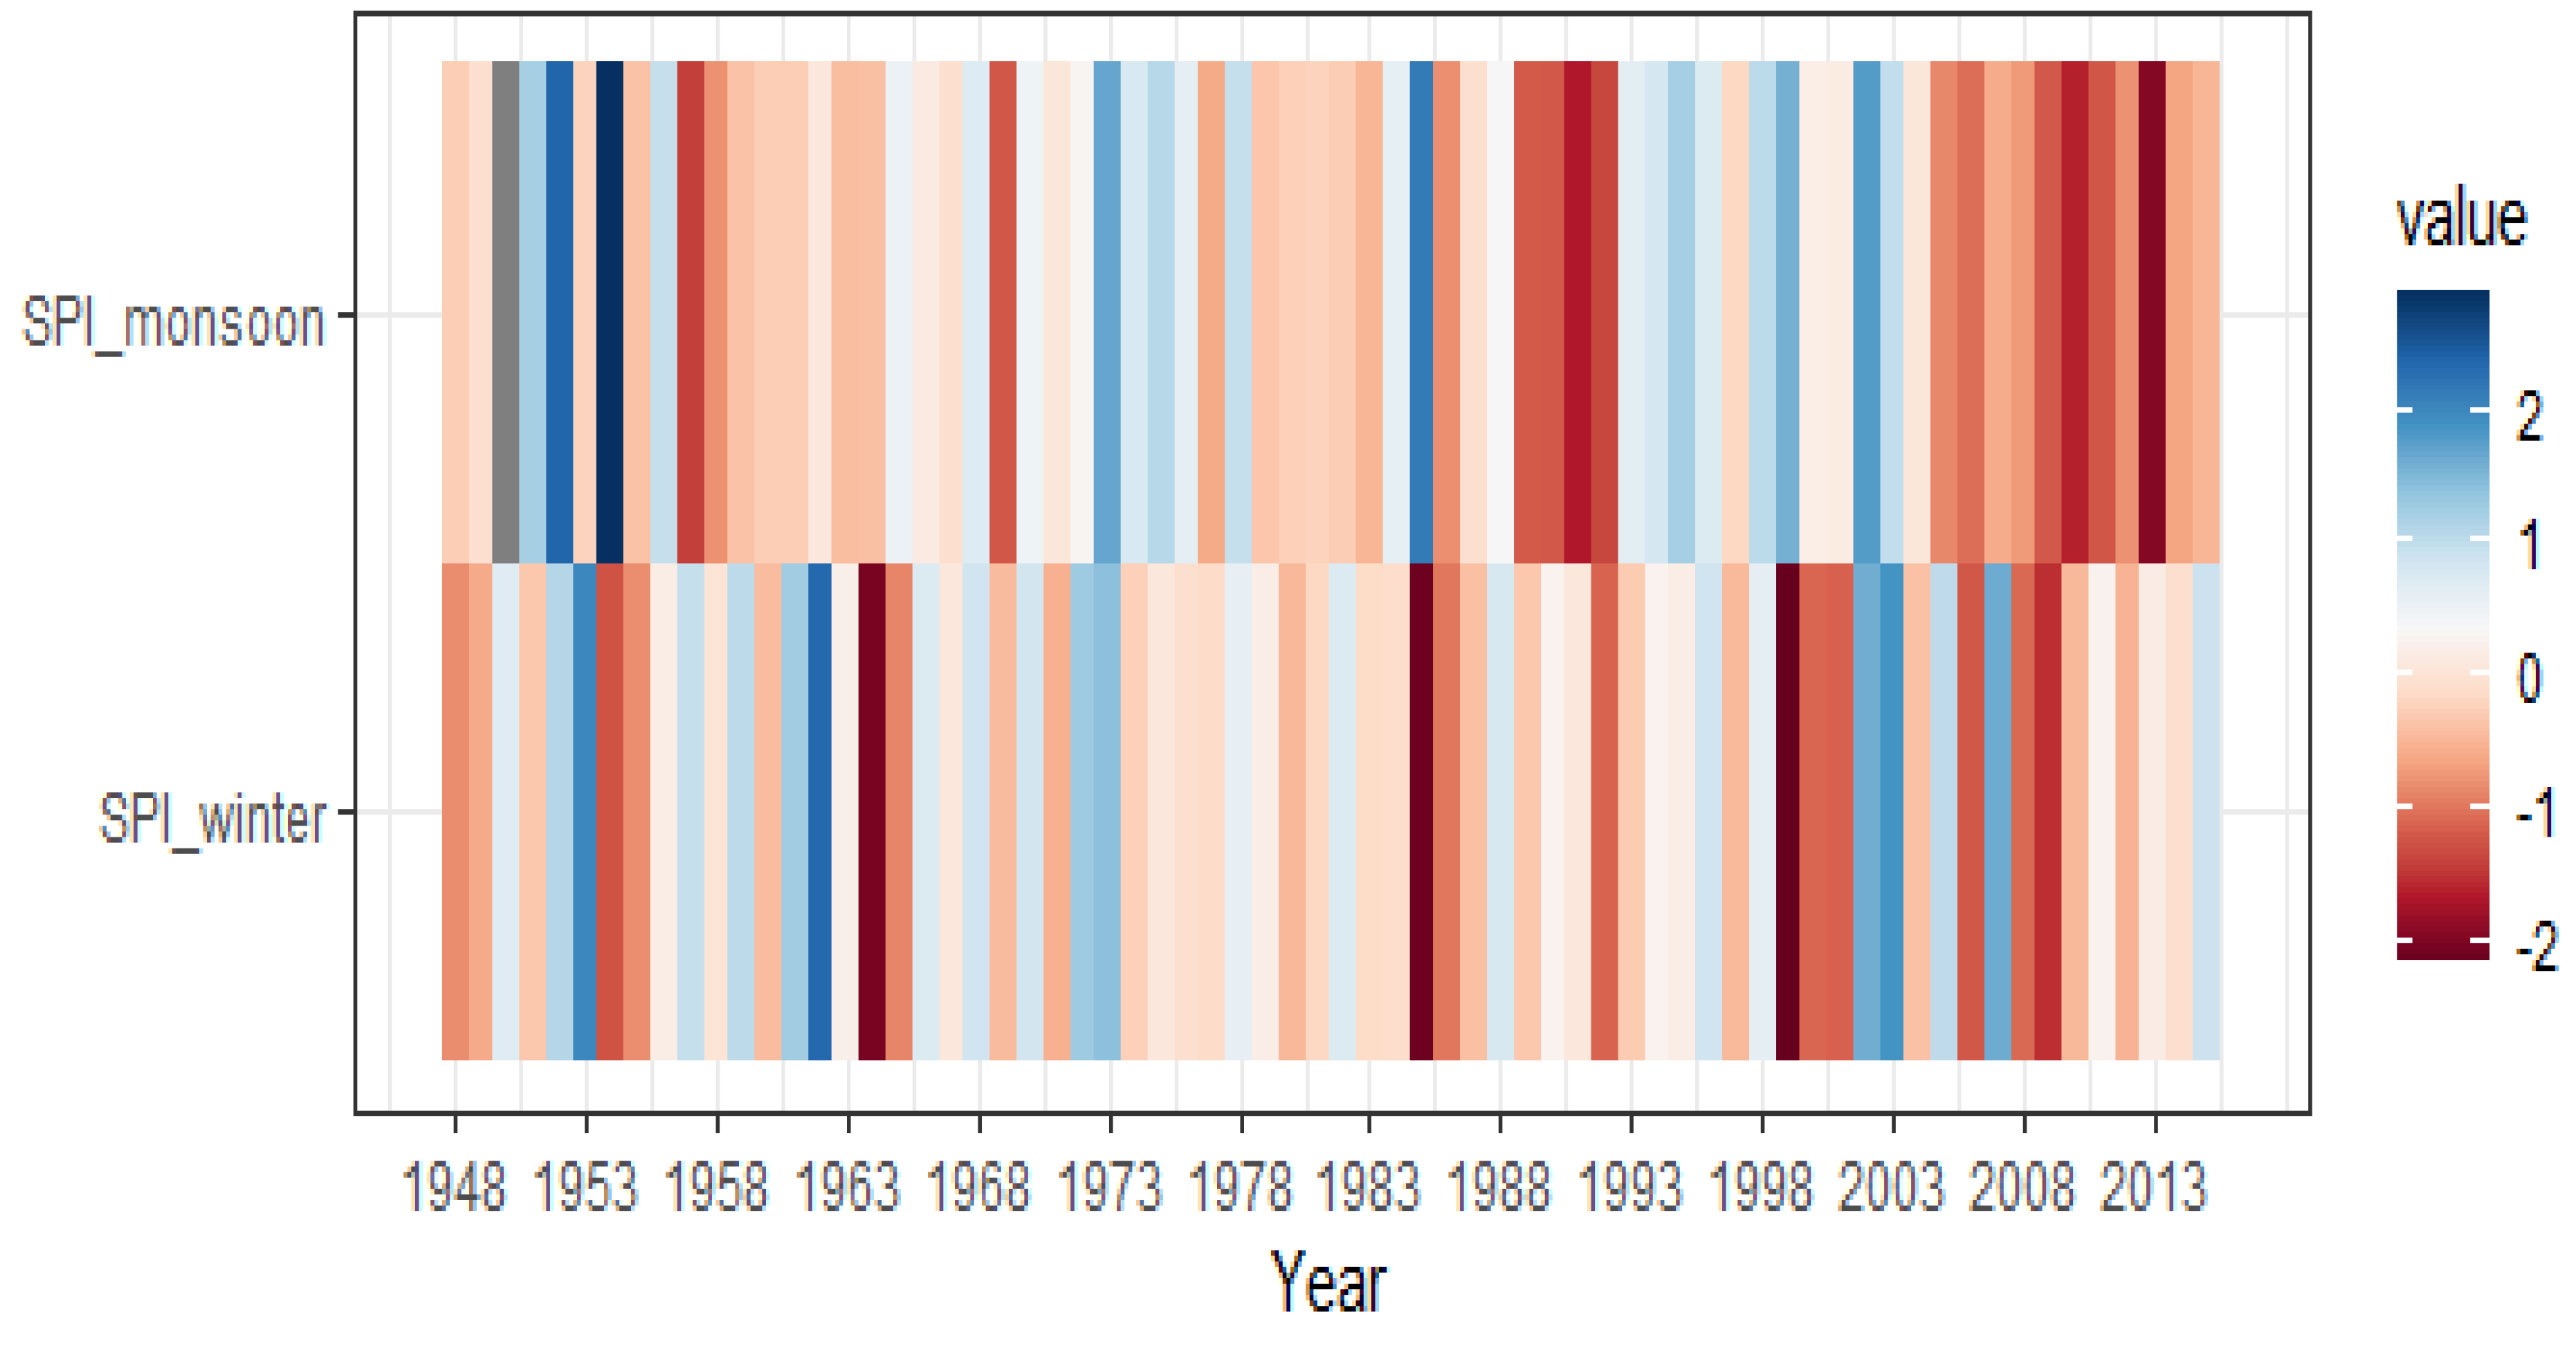
3.1.1. Precipitation Characteristics and Trend

Average (1948 to 2015) annual precipitation was 1469 mm and around 80% (1165 mm) occurring in four months (June to September) of the monsoon season in the study area (Figure 3).
Trend analysis of the annual and seasonal total precipitation recorded at Dhulikhel station showed a decreasing trend in annual (–3.55 mm year−1), monsoon (–3.22 mm year−1), and post-monsoon (–0.25 mm year−1) precipitation and increasing trend in pre-monsoon (0.25 mm year−1) precipitation (Figure 4) but none of the trends was significant at 95% confidence level indicating large inter-annual variability (Figure 5).
Although there were no convincing trends in annual and seasonal total precipitation, significant decreases in the number of rainy days in the annual (3.3 day decade−1) and monsoon season (3.2 day decade−1) were observed (Figure 6). The results indicated that extreme precipitation events may increase in the monsoon season in the study area.
In the current study, the SPI was used to provide an indicator of drought severity (Figure 7). A drought is defined as whenever the SPI reaches a value below −1. Analysis showed that the study area has experienced droughts in terms of both severity and duration in recent decades. There were severe consecutive drought years from 2004. The result also showed that drought severity was stronger for longer drought time scales. The wet/non-drought conditions (SPI > 0) are indicated by shades of light blue to dark blue and drought conditions (SPI < 0) by shades of light red to dark red (increasing drought intensity).
The drought heat map showed the monsoon drought (four-month SPI in September) and winter drought (three-month SPI in February) (Figure 8). Results suggested that both monsoon and winter droughts occurred on a periodic basis, and after 2004 there were consecutive monsoon drought years in the study area. The wet/non-drought conditions (SPI > 0) were indicated by shades of light blue to dark blue and drought conditions (SPI < 0) were indicated by shades of light red to dark red (increasing drought intensity).

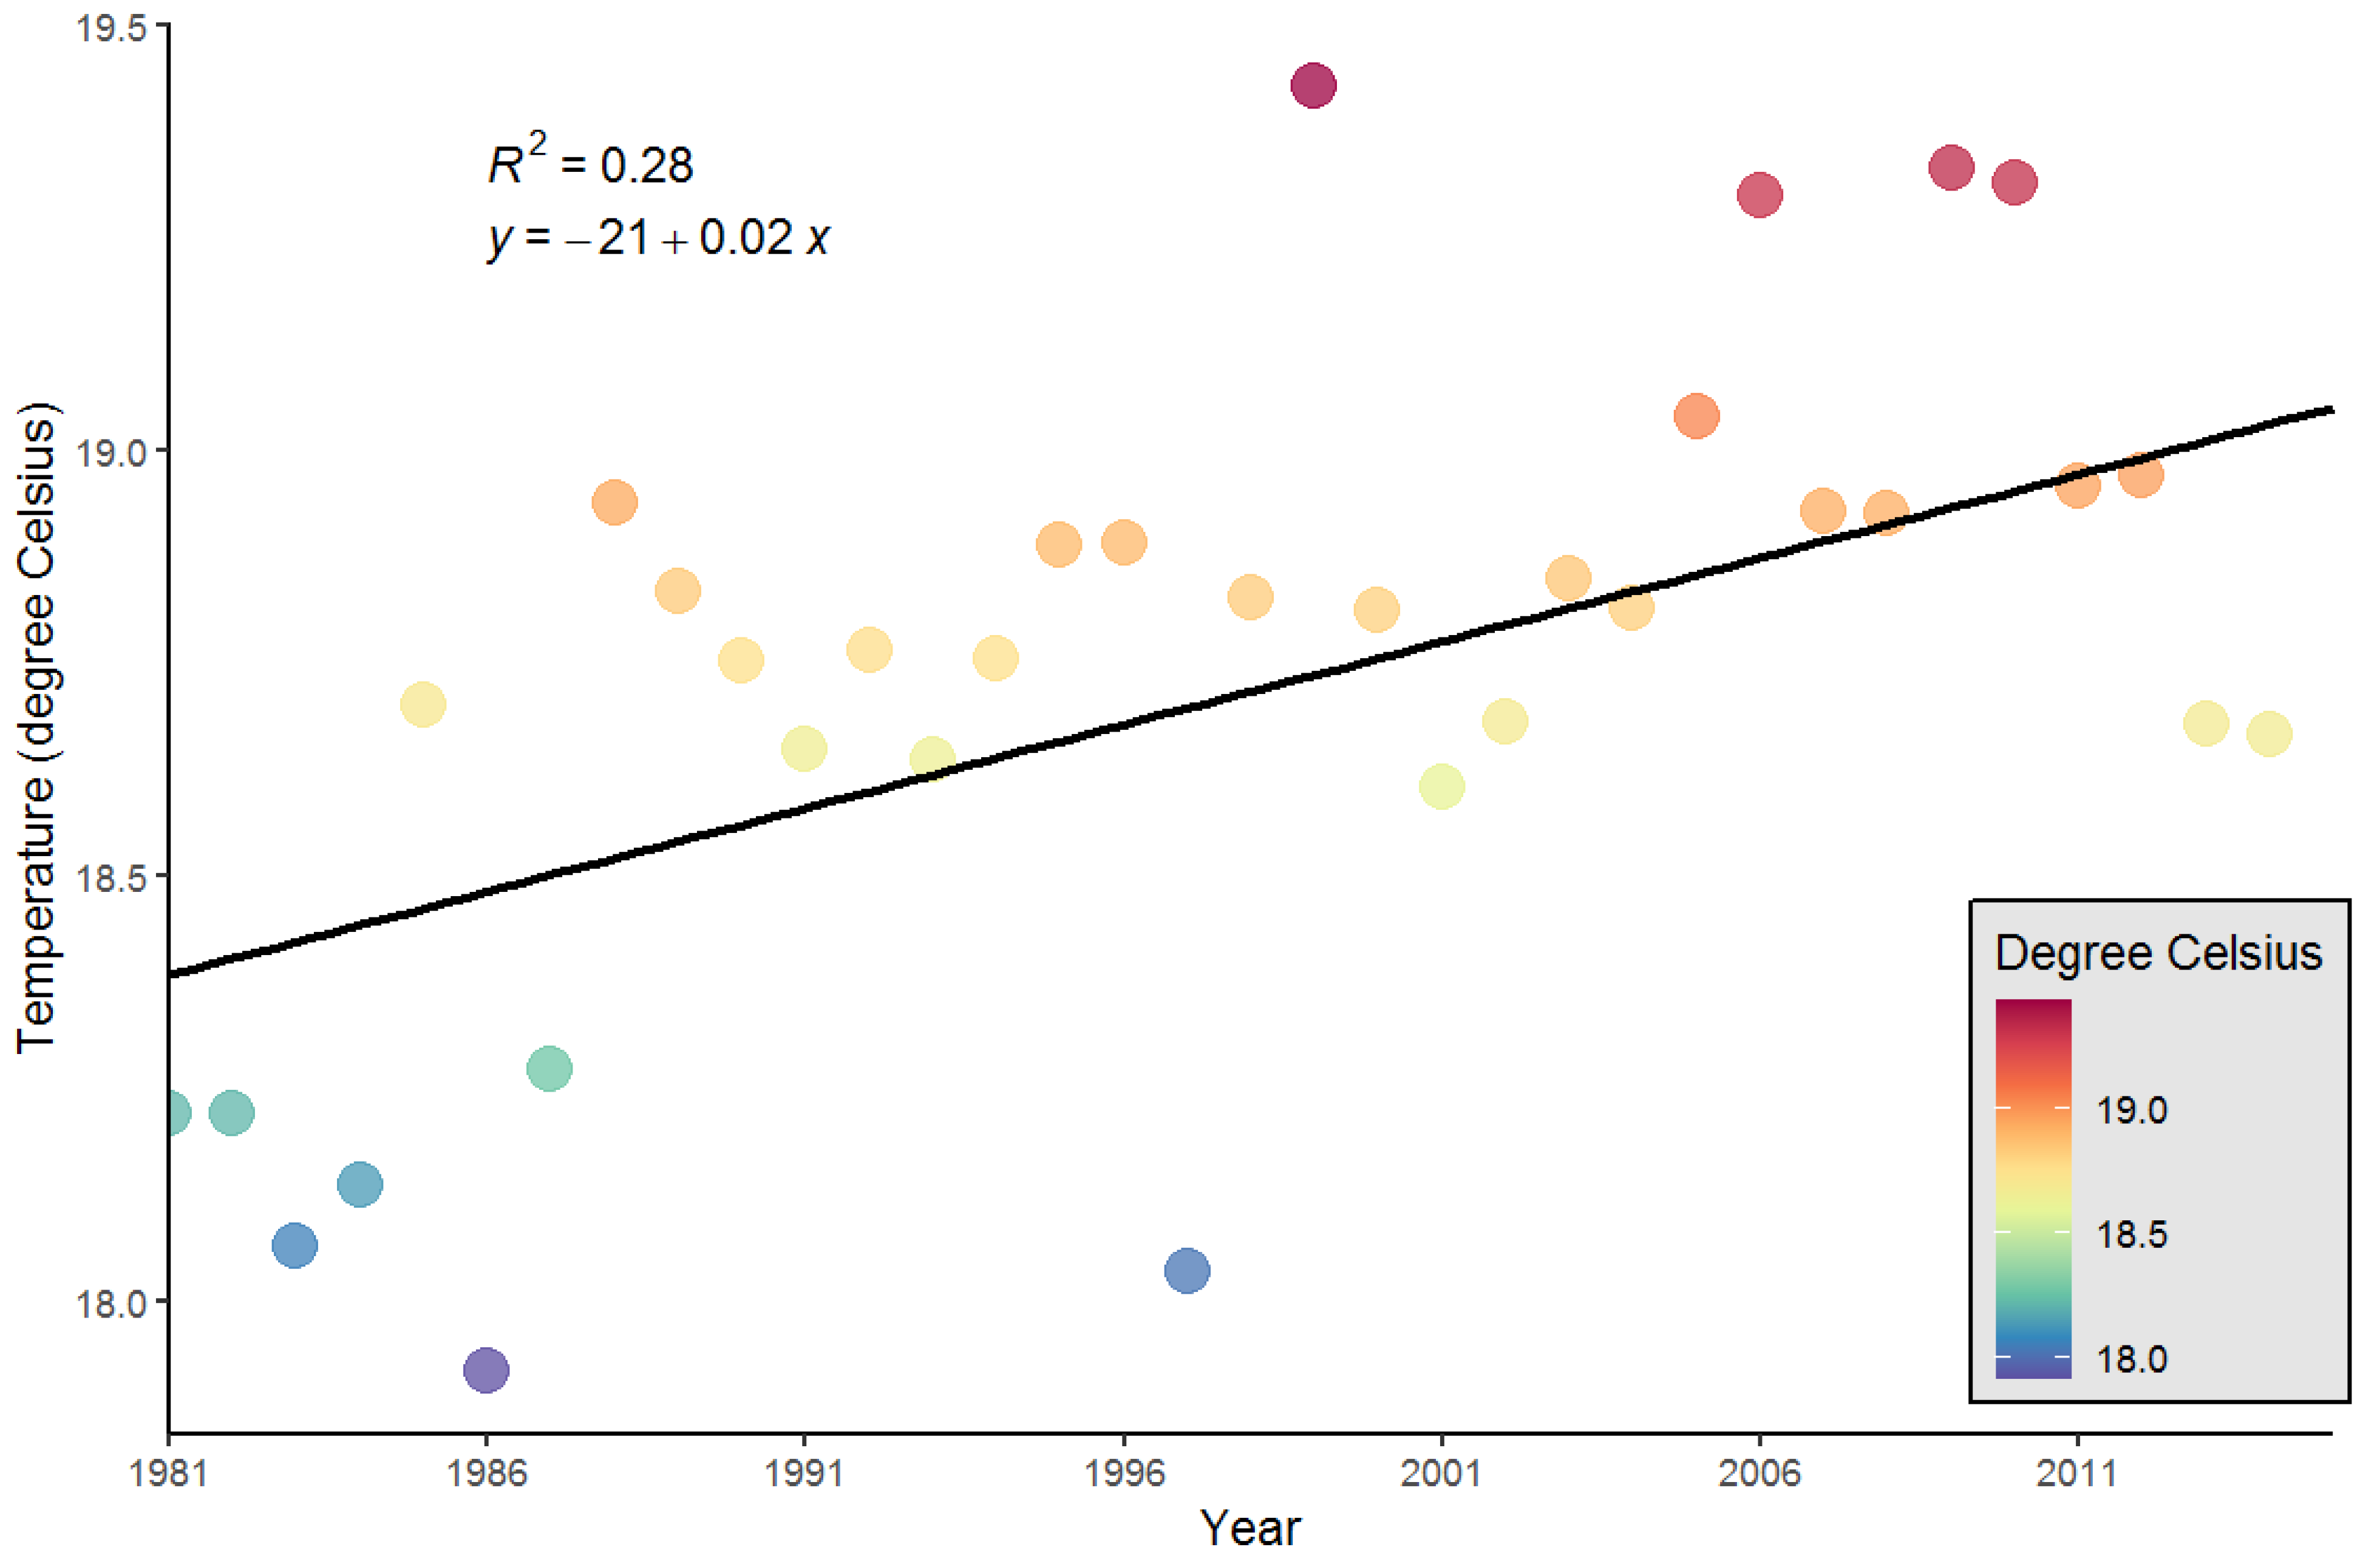
3.1.2. Temperature Characteristics and Trend

The annual mean temperature of the study site increased at the rate of 0.02 °C year−1 (Figure 9). Winter temperatures increased faster than summer and annual temperatures (Figure 10). The winter temperature increased at a rate of 0.03 °C year−1. However, the trend of summer temperature was not significant in the study area.

3.2. People’s Perception of Climate Change

3.2.1. Demographic Characteristics of Respondents

This study was conducted in 153 randomly selected respondent households from the study area. Among the total respondents, 78.4% were male and 21.6% were female. The average age of the respondents was 46.5 years with an average farming experience of 26.5 years. Only 2.6% of the respondents were under 20 years old (Table 2). This indicates that the respondents have substantial experience in observing weather events and climate over years. The average land holding of the respondent households was 0.64 ha. The result also showed that 31.4% of the respondents did not receive formal education while 51% obtained primary education, 15% obtained a secondary education and 2.6% of the respondents attained university (Table 1). About 79% of the respondents stated to have agriculture as their primary occupation.

3.2.2. Farmers’ Perception of the Indicators of Climate Change

To study the farmers’ perception of climate change, the indicators of climate change were categorized into three broad categories; change in rainfall, change in temperature, and change in season. The changes in rainfall included the changes in rainfall amount, intensity, and timing. Similarly, changes in temperature included increases, decreases, and changes in extreme events. The season was treated just as one variable, change in seasonality. Out of 153 respondents, the majority (81.7%) revealed that they have perceived at least one or more indicators of climate change in recent years. Among the respondents who perceived the change in climate, 77.6% were male and 22.4% were female. Out of three major indicators of climate change, there was a significant association of gender with the perception of temperature change (n = 55, p < 0.05) and rainfall change (n = 100, p < 0.10) while there was no significant association with the perception of season change (n = 32, p > 0.1) (Table 3).
There was no significant (p > 0.1) relationship between the level of education with changes in rainfall and temperature perceived by the respondents, but a significant (p < 0.05) association was observed with the perception of season change (Table 4).
Similarly, a significant association was found between the age of the respondents and the perception of climate change parameters at a 10% level of significance (Table 5).

3.2.3. Farmers’ Perception of Impacts of Climate Change on Agriculture

Among 125 farmers who reported that they have perceived at least one indicator of climate change, 124 (99%) claimed that they have been experiencing the impact of climate change on agriculture (Table 6).
In the current study, farmers identified many impacts of climate change on agriculture (Table 7). The farmers perceived that a decrease in soil moisture and a deficit of water for irrigation (83%), increased disease, pests, and weeds (80%), and low yields or crop failure are the most prominent impacts of climate change on agriculture. Table 6 summarizes the impacts perceived by the farmers in agriculture based on the indicators of climate change in the study area.

3.3. Local Adaptation Practices

Out of the total respondents, 115 (75.2%) were adopting one or more measures to cope with the problems brought about by changing climate. The adaptation measures were categorized into four groups, namely related to changes in crops and variety, technological changes, the input used, and farm structure. The results showed that 28.8% of the respondents have practiced crop and variety-related adaptation measures, 20.3% have practiced a technological shift, 57.5% have practiced input change, and 54.2% had practiced changes in the farm structure (Table 8). The results also revealed that there was no significant association between the gender of the household head and all climate change adaptation measures, however, a significant association (p < 0.05) was found with technological adaptation.
This study investigated the influence of different predictor variables on respondents’ decision for adaptation practices on climate change measures. The logit regression analysis (Table 9) revealed that gender, distance to market, livestock number, age, and altitude had an inverse influence on adaptation practices while education, land holding, farming experience, and farming purpose had a positive influence on adaptation. Out of these nine decisive variables, the education level of the household head and the distance to the market were found to be significant contributors to the decision on adopting adaptation measures. The negative coefficient of the gender variable indicates the greater possibility of climate change adaptation by female-headed households. Similarly, a significant negative coefficient (p < 0.05) of the distance to the market may indicate that farmers near a market have better access to information and inputs, as well as a market opportunity for their produce and help to practice different adaptation measures.

4. Discussion

Our finding of no long-term significant trends in precipitation in the study area is consistent with the studies in other parts of the Himalayas. Dahal et al. [11] reported that there was no distinct long-term trend in the precipitation records in the Gandaki Basin of central Himalaya, though there was increased frequency and severity of drought in recent decades. Shrestha et al. [66] found considerable fluctuation, but no significant long-term trend in regional precipitation in Koshi Basin in central Himalaya. However, Sigdel and Ma [67] found an increasing trend in observed precipitation based on nine stations on the northern and southern slopes of the central Himalayas. Another study by Khatiwada et al. [68] reported a decreasing trend of precipitation in the Karnali Basin of central Himalaya.
Though there is no significant change in annual precipitation, inter-annual variability is large and there is a clear reduction in precipitation from 2004 onwards, and all years from 2004 experienced extreme drought conditions in the study area. This large inter-annual variability in rainfall and consecutive drought may have a serious impact on the agriculture system in the mid-hills of the Himalayas. Selvaraju [69] studied a relationship between Indian summer monsoon rainfall (SMR) and food grain production (FGP) in India and stated that inter-annual variability in SMR and total food grain production anomalies are closely related. Many researchers have pointed out the impact of drought on agriculture and farming system in different parts of the mid-hills of the Nepaesel Himalayas [70]. Ref. [71] reported that drought in recent years has emerged as a cause of household-level vulnerability in rainfed hill agriculture in the central Himalayas.
As the results of the analysis of the temperature record clearly showed a warming trend in the study area, other studies also support this result showing the increasing trend of temperature in the central Himalayas [72,73,74,75,76]. This increasing trend of annual and winter temperatures may have an impact on crop growth and production. Wheeler et al. [77] stated that variability of temperature plays a key role in crop growth. For example, doubling the standard deviation of temperature daily, while keeping the same mean temperature will reduce grain yields by 7%. Sinha and Swaminathan [78] reported that an increase of 0.5 °C in the current mean winter temperature would shorten wheat crop duration by 7 days and reduce wheat yield by a significant amount. For wheat and rice, an increase in minimum temperature increases the rate of respiration of the crop and shortens the time to maturity and thus reducing net growth and productivity [79]. Maharjan and Joshi [80] reported a significant negative relationship between an increase in maximum summer temperature and maize yield. Increased temperature can also have significant effects on pathogens, insects, and weeds. The cold temperature in winter suppresses much of the pathogen population whereas warm winter can enhance pathogenic activities and negatively affect the crop yield. Increased temperature changes the population growth and metabolic rates of insect pests, as well as their damaging activities. This may cause yield losses of major grains to increase by 10 to 25% per degree of mean surface warming [81]. Dukes and Mooney [82] reviewed the relation of global change and dispersal of invasive weeds and stated that increase in temperature may help to wider migration of invasive weeds.
Regarding the people’s perception of climate change, changes in rainfall and temperature were identified as the most frequently used climate change indicators. Most of the respondents have noticed the rising temperature, change in rainfall time and amount, and decrease in surface water availability as common indicators of climate change. Regarding the gender of respondents, females were found closer to available climate change parameters. A comparison of farmers’ perceptions with observed trends in temperature and precipitation finds that farmers’ understanding of changing climate is in line with the actual trend. These indicators of climate change mentioned by the farmers in our study are in line with that identified by previous studies in various parts of the Himalaya [83,84,85,86,87]. People’s perceptions are similar to those reported by studies done in other parts of the Himalayas, where the majority of the respondents have perceived increasing overall temperatures, changes in rainfall patterns, and a decrease in surface water availability [86,87,88,89,90,91]. Regarding the changes in rainfall, people have perceived that the total rainfall has decreased, and in terms of timings, respondents have perceived rainfall to arrive later. These local perceptions about climate change are also supported by scientific data. The results of the present study collected from the local level contribute to the knowledge in the field of documenting perceptions of climate change in the Himalayan region. This information is very crucial for formulating site-specific adaptation and mitigation strategies.
Location-specific people’s perception of climate change is essential for adaptation planning [33,35] and farmers also need to understand the actual changes and trends in climatic conditions, associated risks, and measures to adapt to the potential impacts [41]. Haq et al. [92] and Barrett and Bosak [93] suggested that the perception of climate change differs depending on the physio-cultural condition and socio-demographic dimensions such as gender, religion, age, etc. Therefore, site-specific perception of people regarding the changing climate is essential to know the exact extent and dimension of climate change at the local level.
Since agriculture is highly dependent on the weather and climate of any location, changes in their parameters may have a serious impact on agricultural production. A decrease in soil moisture increased the need for water for irrigation, an increase in insect pests and diseases, and weed infestation resulting in low crop production and even crop failure are the biggest impacts of the changing climate on agricultural activities in the study area. Farmers felt that rainfall variability has a bigger impact on agricultural production than the change in temperature. Other studies also have reported the potential impact of climate change on the decline in crop yield—both short-term and long-term—due to rainfall variation, increase extreme events (mainly drought), and proliferation of weeds and pests [9,81,94,95,96]. A study by Chaudhary and Bawa [14] stated that approximately 73.6% and 54.2% of individuals have seen new crop pests and new weeds in their fields in recent years in the central Himalayas, respectively. In our study, local people reported that the rainfall pattern has been irregular, and the rainy season has shifted which has adversely affected their agricultural practices and production. Many people have replaced the cultivation of food crops with cash crops, mostly vegetables, in the study area. The traditional varieties of maize, paddy, and potato have been replaced by new “improved” varieties. Studies conducted in other parts of the Himalaya have also reported similar changes in rainfall patterns, and it is the main driving factor for change in farming practices [97,98,99].
As climate change is happening and is perceived by local people, they have to some extent developed adaptation strategies to cope with its adverse impact. Farmers reported that rainfall variability is the most essential determinant of adaptation decisions in farming. Adaptation measures in the community were shaped by both social and demographic factors. The level of education of farmers, purpose of farming and distance to market were found significant contributor for choosing the adaptation practices. Regarding the gender of respondents, female was found to have more decisive role for choosing the adaptation practices. The local communities have vast amount of knowledge and experience in coping with climatic change and variability, and these coping strategies are important elements of successful adaptation plans [30,100,101]. At the same time, adaptation practices being adopted in farming communities differ according to household economic status and are dependent on access to education, information, and resources within the community [102]. This traditional knowledge helps to provide efficient, appropriate, and time-tested ways of coping mechanisms in the changing climate. Therefore, this analysis helps to enhance our understanding of the status of climate change and its impact on the hill farming system of the central Himalayas.

5. Conclusions

Understanding people’s perceptions of climate change and their response to such changes are important to design location-specific community-based adaptation strategies. We assessed the local level climate change information along with the farmers’ perception of climate change indicators, broadly temperature change, rainfall change, seasonality change, and adaptation measures by using both observed climate records and perception-based approaches. This study revealed ample strong and clear evidence of changing climate in the study area, which is also perceived by the local farming communities. They are adopting various measures to cope with the impacts of climate change by making changes in their farming practices including cultivation time and methods; cropping patterns and seasons; farm inputs, crop, and variety; farm structures. The education of the farmers, distance to the market, and purpose of farming were found to be important socioeconomic factors for choosing adaptation measures for the farmers. This study will help policymakers to formulate suitable policies to lessen the adverse impact of climate change at the farm level and can contribute to the development of an appropriate strategy for designing climate-resilient farming systems in the mid-hill of the Himalayan region. The results derived from this study are based on a relatively small area of the hilly farming systems of the Himalayan range, taking into consideration of limited socioeconomic variables, the generalization of the conclusion is subject to similar geophysical, socio-cultural, and agro-ecological assumptions. So, further extensive research covering multi-locations is suggested.

Author Contributions

Conceptualization, K.R.D., P.D. and J.H.; funding acquisition, B.M., P.D. and D.P.; methodology, K.R.D., B.M., P.D. and R.K.A.; investigation, K.R.D. and V.N.; data curation, K.R.D., V.N. and N.B.; formal analysis, K.R.D., P.D. and R.K.A.; visualization, K.R.D., P.D. and D.P.; software, K.R.D., P.D. and R.K.A.; validation, K.R.D., P.D. and D.P.; writing—original draft preparation, K.R.D. and P.D.; writing—review and editing, K.R.D., P.D., V.N., D.P., R.K.A., N.B., J.H. and B.M. All authors have read and agreed to the published version of the manuscript.

Funding

The study was funded by The Asia Pacific Network (APN) for Global Change Research under the “Building Climate Resilience in Farming Systems in Sloping Lands of South Asia” Project under the Grant Number CAF2016-RR10CMY-MARAMBE.

Institutional Review Board Statement

Not applicable.

Informed Consent Statement

Not applicable.

Data Availability Statement

The data presented in this study are available on request from the corresponding/first author.

Acknowledgments

The authors are highly indebted to The Asia Pacific Network (APN) for Global Change Research for funding the study and all the farmers who shared their valuable opinion and time to accomplish this study.

Conflicts of Interest

The authors declare no conflict of interest.

References

  1. Gioli, G.; Thapa, G.; Khan, F.; Dasgupta, P.; Nathan, D.; Chhetri, N.; Adhikari, L.; Mohanty, S.K.; Aurino, E.; Mapstone Scott, L. Understanding and Tackling Poverty and Vulnerability in Mountain Livelihoods in the Hindu Kush Himalayas. In The Hindu Kush Himalaya Assessment; Spinger: Cham, Switzerland, 2019. [Google Scholar]
  2. Shrestha, U.B.; Gautam, S.; Bawa, K.S. Widespread Climate Change in the Himalayas and Associated Changes in Local Ecosystems. PLoS ONE 2012, 7, e36741. [Google Scholar] [CrossRef] [Green Version]
  3. Xu, J.; Grumbine, R.E.; Shrestha, A.; Eriksson, M.; Yang, X.; Wang, Y.; Wilkes, A. The Melting Himalayas: Cascading Effects of Climate Change on Water, Biodiversity, and Livelihoods. Conserv. Biol. 2009, 23, 520–530. [Google Scholar] [CrossRef] [PubMed]
  4. Jodha, N. Globalization and Fragile Mountain Environments. Mt. Res. Dev. 2009, 20, 296–299. [Google Scholar] [CrossRef] [Green Version]
  5. Immerzeel, W.W.; van Beek, L.P.H.; Bierkens, M.F.P. Climate Change Will Affect the Asian Water Towers. Science 2010, 328, 1382–1385. [Google Scholar] [CrossRef] [PubMed]
  6. Hussain, A.; Rasul, G.; Mahapatra, B.; Tuladhar, S. Household food security in the face of climate change in the Hindu-Kush Himalayan region. Food Sec. 2016, 8, 921–937. [Google Scholar] [CrossRef] [Green Version]
  7. Molden, D.J.; Shrestha, A.B.; Nepal, S.; Immerzeel, W.W. Downstream Implications of Climate Change in the Himalayas. In Water Security, Climate Change and Sustainable Development; Biswas, A.K., Tortajada, C., Eds.; Springer: Singapore, 2016; pp. 65–82. [Google Scholar]
  8. Ragettli, S.; Immerzeel, W.W.; Pellicciotti, F. Contrasting climate change impact on river flows from high-altitude catchments in the Himalayan and Andes Mountains. Proc. Natl. Acad. Sci. USA 2016, 113, 9222–9227. [Google Scholar] [CrossRef] [Green Version]
  9. Rasul, G.; Saboor, A.; Tiwari, P.C.; Hussain, A.; Ghosh, N.; Chettri, G.B. Food and Nutrition Security in the Hindu Kush Himalaya: Unique Challenges and Niche Opportunities. In The Hindu Kush Himalaya Assessment: Mountains, Climate Change, Sustainability and People; Wester, P., Mishra, A., Mukherji, A., Shrestha, A.B., Eds.; Springer International Publishing: Cham, Switzerland, 2019; pp. 301–338. [Google Scholar]
  10. Zhan, Y.J.; Ren, G.Y.; Shrestha, A.B.; Rajbhandari, R.; Ren, Y.Y.; Sanjay, J.; Xu, Y.; Sun, X.B.; You, Q.L.; Wang, S. Changes in extreme precipitation events over the Hindu Kush Himalayan region during 1961–2012. Adv. Clim. Change Res. 2017, 8, 166–175. [Google Scholar] [CrossRef]
  11. Dahal, P.; Shrestha, N.S.; Shrestha, M.L.; Krakauer, N.Y.; Panthi, J.; Pradhanang, S.M.; Jha, A.; Lakhankar, T. Drought risk assessment in central Nepal: Temporal and spatial analysis. Nat. Hazards 2016, 80, 1913–1932. [Google Scholar] [CrossRef] [Green Version]
  12. Kirschbaum, D.; Kapnick, S.B.; Stanley, T.; Pascale, S. Changes in Extreme Precipitation and Landslides Over High Mountain Asia. Geophys. Res. Lett. 2020, 47, e2019GL085347. [Google Scholar] [CrossRef]
  13. Vaidya, R.A.; Shrestha, M.S.; Nasab, N.; Gurung, D.R.; Kozo, N.; Pradhan, N.S.; Wasson, R.J. Disaster Risk Reduction and Building Resilience in the Hindu Kush Himalaya. In The Hindu Kush Himalaya Assessment: Mountains, Climate Change, Sustainability and People; Wester, P., Mishra, A., Mukherji, A., Shrestha, A.B., Eds.; Springer International Publishing: Cham, Switzerland, 2019; pp. 389–419. [Google Scholar]
  14. Chaudhary, P.; Bawa, K.S. Local perceptions of climate change validated by scientific evidence in the Himalayas. Biol. Lett. 2011, 7, 767–770. [Google Scholar] [CrossRef]
  15. Singh, S.P.; Thadani, R.; Negi, G.C.S.; Singh, R.D.; Gumber, S. The Impact of Climate Change in Hindu Kush Himalayas: Key Sustainability Issues. In Himalayan Weather and Climate and Their Impact on the Environment; Dimri, A.P., Bookhagen, B., Stoffel, M., Yasunari, T., Eds.; Springer International Publishing: Cham, Switzerland, 2020; pp. 453–472. [Google Scholar]
  16. Forster, P.M.; Maycock, A.C.; McKenna, C.M.; Smith, C.J. Latest climate models confirm need for urgent mitigation. Nat. Clim. Chang. 2020, 10, 7–10. [Google Scholar] [CrossRef]
  17. Basannagari, B.; Kala, C.P. Climate Change and Apple Farming in Indian Himalayas: A Study of Local Perceptions and Responses. PLoS ONE 2013, 8, e77976. [Google Scholar] [CrossRef] [Green Version]
  18. Gentle, P.; Maraseni, T.N. Climate change, poverty and livelihoods: Adaptation practices by rural mountain communities in Nepal. Environ. Sci. Policy 2012, 21, 24–34. [Google Scholar] [CrossRef]
  19. Kaul, V.; Thornton, T.F. Resilience and adaptation to extremes in a changing Himalayan environment. Reg. Environ. Chang. 2014, 14, 683–698. [Google Scholar] [CrossRef]
  20. IPCC. Summary for Policymakers. In Climate Change 2007: The Physical Science Basis; Contribution of Working Group I to the Fourth Assessment Report of the Intergovernmental Panel on Climate Change; Cambridge University Press: Cambridge, UK, 2007. [Google Scholar]
  21. Battisti David, S.; Naylor, R.L. Historical Warnings of Future Food Insecurity with Unprecedented Seasonal Heat. Science 2009, 323, 240–244. [Google Scholar] [CrossRef] [Green Version]
  22. Calzadilla, A.; Rehdanz, K.; Betts, R.; Falloon, P.; Wiltshire, A.; Tol, R.S.J. Climate change impacts on global agriculture. Clim. Chang. 2013, 120, 357–374. [Google Scholar] [CrossRef]
  23. Jasper, K.; Calanca, P.; Fuhrer, J. Changes in summertime soil water patterns in complex terrain due to climatic change. J. Hydrol. 2006, 327, 550–563. [Google Scholar] [CrossRef]
  24. Chhogyel, N.; Kumar, L.; Bajgai, Y. Consequences of Climate Change Impacts and Incidences of Extreme Weather Events in Relation to Crop Production in Bhutan. Sustainability 2020, 12, 4319. [Google Scholar] [CrossRef]
  25. Vogel, M.M.; Hauser, M.; Seneviratne, S.I. Projected changes in hot, dry and wet extreme events’ clusters in CMIP6 multi-model ensemble. Environ. Res. Lett. 2020, 15, 094021. [Google Scholar] [CrossRef]
  26. Shrestha, A.; Rahaman, M.M.; Kalra, A.; Jogineedi, R.; Maheshwari, P. Climatological Drought Forecasting Using Bias Corrected CMIP6 Climate Data: A Case Study for India. Forecasting 2020, 2, 59–84. [Google Scholar] [CrossRef]
  27. Shukla, R.; Agarwal, A.; Gornott, C.; Sachdeva, K.; Joshi, P.K. Farmer typology to understand differentiated climate change adaptation in Himalaya. Sci Rep. 2019, 9, 20375. [Google Scholar] [CrossRef] [PubMed] [Green Version]
  28. Gillies, R.R.; Wang, S.Y.; Sun, Y.; Chung, O.Y. Supportive empirical modelling for the forecast of monsoon precipitation in Nepal. Int. J. Climatol. 2013, 33, 3047–3054. [Google Scholar] [CrossRef]
  29. Karmacharya, J.; Levine, R.C.; Jones, R.; Moufouma-Okia, W.; New, M. Sensitivity of systematic biases in South Asian summer monsoon simulations to regional climate model domain size and implications for downscaled regional process studies. Clim. Dyn. 2015, 45, 213–231. [Google Scholar] [CrossRef]
  30. Adger, W.N.; Barnett, J.; Brown, K.; Marshall, N.; O’Brien, K. Cultural dimensions of climate change impacts and adaptation. Nat. Clim Chang. 2013, 3, 112–117. [Google Scholar] [CrossRef]
  31. Smit, B.; Wandel, J. Adaptation, adaptive capacity and vulnerability. Glob. Environ. Chang. 2006, 16, 282–292. [Google Scholar] [CrossRef]
  32. Brace, C.; Geoghegan, H. Human geographies of climate change: Landscape, temporality, and lay knowledges. Prog. Hum. Geogr. 2011, 35, 284–302. [Google Scholar] [CrossRef]
  33. Ford, J.D.; Vanderbilt, W.; Berrang-Ford, L. Authorship in IPCC AR5 and its implications for content: Climate change and Indigenous populations in WGII. Clim. Chang. 2012, 113, 201–213. [Google Scholar] [CrossRef] [Green Version]
  34. Lebel, L. Local knowledge and adaptation to climate change in natural resource-based societies of the Asia-Pacific. Mitig. Adapt. Strateg. Glob. Chang. 2013, 18, 1057–1076. [Google Scholar] [CrossRef]
  35. Lehner, F.; Stocker, T.F. From local perception to global perspective. Nat. Clim. Chang. 2015, 5, 731–734. [Google Scholar] [CrossRef]
  36. Islam, M.D.M.; Jannat, A.; Dhar, A.R.; Ahamed, T. Factors determining conversion of agricultural land use in Bangladesh: Farmers’ perceptions and perspectives of climate change. GeoJournal 2020, 85, 343–362. [Google Scholar] [CrossRef]
  37. Alexander, C.; Bynum, N.; Johnson, E.; King, U.; Mustonen, T.; Neofotis, P.; Oettlé, N.; Rosenzweig, C.; Sakakibara, C.; Shadrin, V.; et al. Linking Indigenous and Scientific Knowledge of Climate Change. BioScience 2011, 61, 477–484. [Google Scholar] [CrossRef] [Green Version]
  38. Makondo, C.C.; Thomas, D.S.G. Climate change adaptation: Linking indigenous knowledge with western science for effective adaptation. Environ. Sci. Policy 2018, 88, 83–91. [Google Scholar] [CrossRef]
  39. Li, H.; Haugen, J.E.; Xu, C.Y. Precipitation pattern in the Western Himalayas revealed by four datasets. Hydrol. Earth Syst. Sci. 2018, 22, 5097–5110. [Google Scholar] [CrossRef] [Green Version]
  40. Pandit, A.; Jain, A.; Singha, R.; Suting, A.; Jamir, S.; Pradhan, N.S.; Choudhury, D. Community Perceptions and Responses to Climate Variability: Insights from the Himalayas. In Climate Change Adaptation Strategies—An Upstream-Downstream Perspective; Salzmann, N., Huggel, C., Nussbaumer, S.U., Ziervogel, G., Eds.; Springer International Publishing: Cham, Switzerland, 2016; pp. 179–194. [Google Scholar]
  41. Esham, M.; Garforth, C. Agricultural adaptation to climate change: Insights from a farming community in Sri Lanka. Mitig. Adapt. Strateg. Glob. Chang. 2013, 18, 535–549. [Google Scholar] [CrossRef]
  42. Yatagai, A.; Kamiguchi, K.; Arakawa, O.; Hamada, A.; Yasutomi, N.; Kitoh, A. APHRODITE: Constructing a Long-Term Daily Gridded Precipitation Dataset for Asia Based on a Dense Network of Rain Gauges. Bull. Am. Meteorol. Soc. 2012, 93, 1401–1415. [Google Scholar] [CrossRef]
  43. Kendall, M.G. Rank Correlation Methods, 4th ed.; Griffin: London, UK, 1975; 202p. [Google Scholar]
  44. Mann, H.B. Nonparametric Tests Against Trend. Econometrica 1945, 13, 245. [Google Scholar] [CrossRef]
  45. Sen, P.K. Estimates of the Regression Coefficient Based on Kendall’s Tau. J. Am. Stat. Assoc. 1968, 63, 1379–1389. [Google Scholar] [CrossRef]
  46. McKee, T.B.; Doesken, N.J.; Kleist, J. The relationship of drought frequency and duration to time scales. In Proceedings of the 8th Conference on Applied Climatology, Anheim, CA, USA, 17–22 January 1993; pp. 179–184. [Google Scholar]
  47. Al-Karablieh, E.K.; Al-Rimawi, A.S.; Hunaiti, D.A. Logit models for identifying the factors that influence the adoption of barley production technologies in low rainfall areas. Jordan J. Agric. Sci. 2010, 5, 251–265. [Google Scholar]
  48. Amemiya, T. Qualitative response models: A survey. J. Econ. Lit. 1981, 19, 1483–1536. [Google Scholar]
  49. Greene, W. Econometric Analysis, 6th ed.; Prentice Hall: Hoboken, NJ, USA, 2008; 1178p. [Google Scholar]
  50. Gujarati, D. Basic Econometrics, 3rd ed.; McGraw-Hill, Inc: New York, NY, USA, 1995; 568p. [Google Scholar]
  51. Horowitz, J.L.; Savin, N.E. Binary response models: Logits, probits and semiparametrics. J. Econ. Perspect. 2001, 15, 43–56. [Google Scholar] [CrossRef] [Green Version]
  52. Perry, G.M.; Rister, M.E.; Richardson, J.W.; Grant, W.R. Analyzing tenure arrangements and crop rotations using farm simulation and probit analysis. South. J. Agric. Econ. 1986, 18, 165–174. [Google Scholar] [CrossRef] [Green Version]
  53. Shideed, K.; El Mourid, M. Adoption and Impact Assessment of Improved Technologies in Crop and Livestock Production Systems in the WANA Region: The Development of Integrated Crop/Livestock Production in Low Rainfall Areas of Mashreq and Maghreb Regions; ICARDA: Aleppo, Syria, 2005; p. 160. [Google Scholar]
  54. Gerfin, M. Parametric and semi-parametric estimation of the binary response model of labour market participation. J. Appl. Econ. 1996, 11, 321–339. [Google Scholar] [CrossRef]
  55. Karli, B.; Bilgic, A.; Celik, Y. Factors affecting farmers’ decision to enter agricultural cooperatives using random utility model in the South Eastern Anatolian region of Turkey. J. Agric. Rural. Dev. Trop. Subtrop. 2006, 107, 115–127. [Google Scholar]
  56. Kebede, Y.; Gunjal, K.; Coffin, G. Adoption of new technologies in Ethiopian agriculture: The case of Tegulet-Bulga District, Shoa province. Agric. Econ. Agric. Econ. 1990, 4, 27–43. [Google Scholar]
  57. Kega, V.; Kasina, M.; Olubayo, F.; Kamau, G.; Nderitu, J. A logit analysis of farmer knowledge on rice blast disease (Pyricularia grisea [Cook, Sacc]) at Mwea irrigation scheme, Kirinyaga county, central province, Kenya. Univers. J. Agric. Res. 2015, 3, 114–117. [Google Scholar]
  58. Nyangena, W. Social determinants of soil and water conservation in rural Kenya. Environ. Dev. Sustain. 2007, 10, 745–767. [Google Scholar] [CrossRef]
  59. Sarap, K.; Vashist, D. Adoption of modern varieties of rice in Orissa: A farm level analysis. Indian J. Agric. Econ. 1994, 49, 88–93. [Google Scholar]
  60. Maddala, G.S. Limited Dependent and Qualitative Variables in Econometrics; Cambridge University Press: Cambridge, UK, 1983; 401p. [Google Scholar]
  61. Bortamuly, A.B.; Goswami, K. Determinants of the adoption of modern technology in the handloom industry in Assam. Technol. Forecast. Soc. Chang. 2015, 90, 400–409. [Google Scholar] [CrossRef]
  62. Kassa, B.A.; Abdi, A.T. Factors Influencing the Adoption of Climate-Smart Agricultural Practice by Small-Scale Farming Households in Wondo Genet, Southern Ethiopia. SAGE Open 2022, 12, 1–13. [Google Scholar] [CrossRef]
  63. Nandi, F.; Nandi, C.; Chikaire, J.; Umunnakwe, P.; Ihenacho, R. Analysis of rural cassava farmers’ participation in the Nigeria agricultural insurance scheme in Imo State, Nigeria. Glob. J. Sci. Front. Res. 2013, 13, 39–45. [Google Scholar]
  64. Shahbaz, P.; Boz, I.; Haq, S. Do socio economic characteristics of farming community really matter for the adoption of climate change strategies? A case study of central Punja, Pakistan. Fresenius Environ. Bull. 2021, 30, 80–92. [Google Scholar]
  65. Ul Haq, S.; Boz, I.; Shahbaz, P. Adoption of climate-smart agriculture practices and differentiated nutritional outcome among rural households: A case of Punjab province, Pakistan. Food Secur. 2021, 13, 913–931. [Google Scholar] [CrossRef]
  66. Shrestha, A.B.; Bajracharya, S.R.; Sharma, A.R.; Duo, C.; Kulkarni, A. Observed trends and changes in daily temperature and precipitation extremes over the Koshi river basin 1975–2010. Int. J. Climatol. 2017, 37, 1066–1083. [Google Scholar] [CrossRef] [Green Version]
  67. Sigdel, M.; Ma, Y. Variability and trends in daily precipitation extremes on the northern and southern slopes of the central Himalaya. Theor. Appl. Climatol. 2017, 130, 571–581. [Google Scholar] [CrossRef]
  68. Khatiwada, K.R.; Panthi, J.; Shrestha, M.L.; Nepal, S. Hydro-Climatic Variability in the Karnali River Basin of Nepal Himalaya. Climate 2016, 4, 17. [Google Scholar] [CrossRef]
  69. Selvaraju, R. Impact of El Niño–southern oscillation on Indian foodgrain production. Int. J. Climatol. 2003, 23, 187–206. [Google Scholar] [CrossRef]
  70. Adhikari, S. Drought Impact and Adaptation Strategies in the Mid-Hill Farming System of Western Nepal. Environments 2018, 5, 101. [Google Scholar] [CrossRef] [Green Version]
  71. Ghimire, Y.N.; Shivakoti, G.P.; Perret, S.R. Household-level vulnerability to drought in hill agriculture of Nepal: Implications for adaptation planning. Int. J. Sustain. Dev. World Ecol. 2010, 17, 225–230. [Google Scholar] [CrossRef]
  72. Krishnan, R.; Shrestha, A.B.; Ren, G.; Rajbhandari, R.; Saeed, S.; Sanjay, J.; Syed, M.; Vellore, R.; Xu, Y.; You, Q.; et al. Unravelling Climate Change in the Hindu Kush Himalaya: Rapid Warming in the Mountains and Increasing Extremes. In The Hindu Kush Himalaya Assessment; Wester, P., Mishra, A., Mukherji, A., Shrestha, A.B., Eds.; Springer: Cham, Switzerland, 2019; pp. 57–97. [Google Scholar]
  73. Norris, J.; Carvalho, L.M.V.; Jones, C.; Cannon, F. Warming and drying over the central Himalaya caused by an amplification of local mountain circulation. NPJ Clim. Atmos. Sci. 2020, 3, 1. [Google Scholar] [CrossRef] [Green Version]
  74. Ren, Y.Y.; Ren, G.Y.; Sun, X.B.; Shrestha, A.B.; You, Q.L.; Zhan, Y.J.; Rajbhandari, R.; Zhang, P.F.; Wen, K.M. Observed changes in surface air temperature and precipitation in the Hindu Kush Himalayan region over the last 100-plus years. Adv. Clim. Chang. Res. 2017, 8, 148–156. [Google Scholar] [CrossRef]
  75. Thakuri, S.; Dahal, S.; Shrestha, D.; Guyennon, N.; Romano, E.; Colombo, N.; Salerno, F. Elevation-dependent warming of maximum air temperature in Nepal during 1976–2015. Atmos. Res. 2019, 228, 261–269. [Google Scholar] [CrossRef]
  76. Zhao, W.; He, J.; Wu, Y.; Xiong, D.; Wen, F.; Li, A. An Analysis of Land Surface Temperature Trends in the Central Himalayan Region Based on MODIS Products. Remote Sens. 2019, 11, 900. [Google Scholar] [CrossRef] [Green Version]
  77. Wheeler, T.R.; Craufurd, P.Q.; Ellis, R.H.; Porter, J.R.; Vara Prasad, P.V. Temperature variability and the yield of annual crops. Agric. Ecosyst. Environ. 2000, 82, 159–167. [Google Scholar] [CrossRef]
  78. Sinha, S.K.; Swaminathan, M.S. Deforestation, climate change and sustainable nutrition security: A case study of India. Clim. Chang. 1991, 19, 201–209. [Google Scholar] [CrossRef]
  79. Lal, M. Implications of climate change in sustained agricultural productivity in South Asia. Reg. Environ. Chang. 2011, 11, 79–94. [Google Scholar] [CrossRef]
  80. Maharjan, K.L.; Joshi, N.P. Effect of Climate Variables on Yield of Major Food-Crops in Nepal: A Time-Series Analysis. In Climate Change, Agriculture and Rural Livelihoods in Developing Countries; Maharjan, K.L., Joshi, N.P., Eds.; Springer: Tokyo, Japan, 2013; pp. 127–137. [Google Scholar]
  81. Deutsch, C.A.; Tewksbury, J.J.; Tigchelaar, M.; Battisti, D.S.; Merrill, S.C.; Huey, R.B.; Naylor, R.L. Increase in crop losses to insect pests in a warming climate. Science 2018, 361, 916–919. [Google Scholar] [CrossRef] [Green Version]
  82. Dukes, J.S.; Mooney, H.A. Does global change increase the success of biological invaders? Trends Ecol. Evol. 1999, 14, 135–139. [Google Scholar] [CrossRef]
  83. Chhogyel, N.; Kumar, L.; Bajgai, Y.; Hasan, M.K. Perception of farmers on climate change and its impacts on agriculture across various altitudinal zones of Bhutan Himalayas. Int. J. Environ. Sci. Technol. 2020, 17, 3607–3620. [Google Scholar] [CrossRef]
  84. Dey, T.; Pala, N.A.; Shukla, G.; Pal, P.K.; Das, G.; Chakarvarty, S. Climate change perceptions and response strategies of forest fringe communities in Indian Eastern Himalaya. Environ. Dev. Sustain. 2018, 20, 925–938. [Google Scholar] [CrossRef]
  85. Huang, X.; Zhou, Y.; Fang, J.; Hou, L. Climate change has more adverse impacts on the higher mountain communities than the lower ones: People’s perception from the northern Himalayas. J. Mt. Sci. 2019, 16, 2625–2639. [Google Scholar] [CrossRef]
  86. Paudel, B.; Zhang, Y.; Yan, J.; Rai, R.; Li, L.; Wu, X.; Chapagain, P.S.; Khanal, N.R. Farmers’ understanding of climate change in Nepal Himalayas: Important determinants and implications for developing adaptation strategies. Clim. Chang. 2020, 158, 485–502. [Google Scholar] [CrossRef]
  87. Pradhan, N.S.; Sijapati, S.; Bajracharya, S.R. Farmers’ responses to climate change impact on water availability: Insights from the Indrawati Basin in Nepal. Int. J. Water Resour. Dev. 2015, 31, 269–283. [Google Scholar] [CrossRef] [Green Version]
  88. Negi, V.S.; Maikhuri, R.K.; Pharswan, D.; Thakur, S.; Dhyani, P.P. Climate change impact in the Western Himalaya: People’s perception and adaptive strategies. J. Mt. Sci. 2017, 14, 403–416. [Google Scholar] [CrossRef]
  89. Uprety, Y.; Shrestha, U.B.; Rokaya, M.B.; Shrestha, S.; Chaudhary, R.P.; Thakali, A.; Cockfield, G.; Asselin, H. Perceptions of climate change by highland communities in the Nepal Himalaya. Clim. Dev. 2017, 9, 649–661. [Google Scholar] [CrossRef]
  90. Devkota, R.P.; Pandey, V.P.; Bhattarai, U.; Shrestha, H.; Adhikari, S.; Dulal, K.N. Climate change and adaptation strategies in Budhi Gandaki River Basin, Nepal: A perception-based analysis. Clim. Chang. 2017, 140, 195–208. [Google Scholar] [CrossRef]
  91. Sharma, R.K.; Shrestha, D.G. Climate perceptions of local communities validated through scientific signals in Sikkim Himalaya, India. Environ. Monit. Assess. 2016, 188, 578. [Google Scholar] [CrossRef]
  92. Haq, S.M.; Ahmed, K.J. Does the perception of climate change vary with the socio-demographic dimensions? A study on vulnerable populations in Bangladesh. Nat. Hazards 2017, 85, 1759–1785. [Google Scholar] [CrossRef]
  93. Barrett, K.; Bosak, K. The Role of Place in Adapting to Climate Change: A Case Study from Ladakh, Western Himalayas. Sustainability 2018, 10, 898. [Google Scholar] [CrossRef]
  94. Abid, M.; Schilling, J.; Scheffran, J.; Zulfiqar, F. Climate change vulnerability, adaptation and risk perceptions at farm level in Punjab, Pakistan. Sci. Total Environ. 2016, 547, 447–460. [Google Scholar] [CrossRef]
  95. Joshi, A.; Joshi, P.K. A rapid inventory of indicators of climate change in the middle Himalaya. Curr. Sci. 2011, 100, 831–833. [Google Scholar]
  96. Lobell, D.B.; Burke, M.B.; Tebaldi, C.; Mastrandrea, M.D.; Falcon, W.P.; Naylor, R.L. Prioritizing Climate Change Adaptation Needs for Food Security in 2030. Science 2008, 319, 607–610. [Google Scholar] [CrossRef] [PubMed]
  97. Batool, N.; Shah, S.A.; Dar, S.N.; Skinder, S. Rainfall variability and dynamics of cropping pattern in Kashmir Himalayas: A case study of climate change and agriculture. SN Appl. Sci. 2019, 1, 606. [Google Scholar] [CrossRef] [Green Version]
  98. Poudel, S.; Shaw, R. The Relationships between Climate Variability and Crop Yield in a Mountainous Environment: A Case Study in Lamjung District, Nepal. Climate 2016, 4, 13. [Google Scholar] [CrossRef] [Green Version]
  99. Rahut, D.B.; Ali, A. Coping with climate change and its impact on productivity, income, and poverty: Evidence from the Himalayan region of Pakistan. Int. J. Disaster Risk Reduct. 2017, 24, 515–525. [Google Scholar] [CrossRef]
  100. Pandey, R.; Kumar, P.; Archie, K.M.; Gupta, A.K.; Joshi, P.K.; Valente, D.; Petrosillo, I. Climate change adaptation in the western-Himalayas: Household level perspectives on impacts and barriers. Ecol. Indic. 2018, 84, 27–37. [Google Scholar] [CrossRef]
  101. Klein, R.J.; Midgley, G.; Preston, B.L.; Alam, M.; Berkhout, F.; Dow, K.; Shaw, M.R. Adaptation Opportunities Constraints and Limits. In Climate Change 2014: Impacts, Adaptation and Vulnerability; Field, C.B., Barros, V.R., Dokken, D.J., Mack, K.J., Mastrandea, M.D., Eds.; Cambridge University Press: Cambridge, UK, 2014; pp. 899–943. [Google Scholar]
  102. Gentle, P.; Thwaites, R.; Race, D.; Alexander, K.; Maraseni, T. Household and community responses to impacts of climate change in the rural hills of Nepal. Clim. Chang. 2018, 147, 267–282. [Google Scholar] [CrossRef]
Figure 1. Location map of the study area in the mid-hills of central Himalayas, Nepal.
Climate 11 00011 g001
Figure 2. Research framework for climate change perception and adoption.
Climate 11 00011 g002
Figure 3. Mean daily (black dots) and smoothed average (blue line) precipitation in the study area over the years, averaged over 68 years (1948 to 2015).
Climate 11 00011 g003
Figure 4. Trends of seasonal and annual total precipitation in the study area.
Climate 11 00011 g004
Figure 5. Deviation (%) of annual precipitation from the mean over 1948 to 2015 of 1469 mm in the study area.
Climate 11 00011 g005
Figure 6. Trends in the number of rainy days (1948 to 2015) in the study area.
Climate 11 00011 g006
Figure 7. Drought heat map of Standard Precipitation Index SPI (SPI 1 to SPI 12) in the study area.
Climate 11 00011 g007
Figure 8. Drought heatmap monsoon and winter drought in the study area.
Climate 11 00011 g008
Figure 9. Trend of annual mean temperature in the study area.
Climate 11 00011 g009
Figure 10. Trend of seasonal mean temperature in the study area.
Climate 11 00011 g010
Table 1. Key exogenous variables and their possible effect on the decision.
VariableMeasurementPossible Effect
EDUCATIONLevel of education of the farmer measured in years of schooling+
AGEAge of responding farmer measured in years
GENDERGender of farmer respondent as binary variable noted as 1 = male and 0 = female farmer+
LANDHOLDINGSize of operational land holding by the farmer measured in hectare+
DISTANCE TO MARKEDistance to nearest market to sale of agricultural produce measured in kilometer+/−
LIVESTOCKNumber of livestock holding measured in numbers+
FARMING EXPERIENCEYears of farming experience of the responding farmers+
FARM ALTITUDELocation of farm expressed as altitude meter above sea level (masl)
FARMING PURPOSEPrimary purpose of the farming activity as binary variable 1 = market purpose otherwise 0 = subsistence.+
Table 2. Socio-demographic characteristics of farmers.
Variables and CategoryMeasuresValue
Gender [BIN]FemaleFrequency33 (21.6%)
MaleFrequency120 (78.4%)
Age [CONT]Overall, in yearsMean46.5 ± 14.9
Up to 20 yearsFrequency4 (2.6%)
21–40 yearsFrequency59 (38.6%)
41 to 60 yearsFrequency57 (37.3%)
61 and aboveFrequency33 (21.6%)
Farming experience (years) [CONT]Mean26.5 ± 14.9
Land Area (ha) [CONT]Mean0.64 ± 0.43
Education
[ORDINAL]
No SchoolingFrequency48 (31.4%)
Primary EducationFrequency78 (51.0%)
Secondary educationFrequency23 (15.0%)
College/UniversityFrequency4 (2.6%)
Primary occupation [ORDINAL]Only agricultureFrequency102 (66.66%)
Agriculture with local grocery and tea shopFrequency12 (7.84%)
Agriculture with serviceFrequency6 (3.92%)
OthersFrequency33 (21.56%)
Livestock holding [CONT]Mean5.8 ± 3.6
Distance to market [Ordinal]<1 KMFrequency36 (23.5%)
1–5 KMFrequency50 (32.7%)
5–10 KMFrequency19 (12.4%)
>10 KMFrequency48 (31.4%)
Farming purpose [BIN]Market purpose = 1Frequency124 (81%)
Subsistence = 0Frequency29 (19%)
Altitude (masl) [CONT]Mean1278.11 ± 223.8
Table 3. Climate change perception by gender of the respondent in the study area.
Perception ParameterPerception
Category
Gender of HH Headp-Value (χ2-Test)
Female (n = 33)Male
(n = 120)
Rainfall Changes (pool)
n = 100; f = 65.4%
No21.2%38.3%0.049
Yes78.8%61.7%
Temperature change (pool)
n = 55; f = 35.9%
No39.4%70.8%0.001
Yes60.6%29.2%
Season Change (pool)
n = 32, f = 20.9%
No81.8%78.3%0.434
Yes18.8%21.7%
Overall climate change
(frequency)
No (18.3%)
Yes (81.7%)
17.9%
22.4%
82.1%
77.6%
-
Note: “n” refers to the number of responses to the indicator while “f” indicates the frequency in the percentage of respective responses.
Table 4. Climate change perception by education category of the respondent in the study area.
Climate ParametersPerception CategoryEducation of HH Headp-Value (χ2-Test)
No SchoolingPrimary EducationSecondary EducationCollege/University
Rainfall changeNo33.3%35.9%34.8%25.0%0.968
Yes66.7%64.1%65.2%75.0%
Temperature ChangeNo58.3%65.4%73.9%50.0%0.561
Yes41.7%34.6%26.1%50.0%
Season ChangeNo93.8%71.8%78.3%50.0%0.013
Yes6.2%28.2%21.7%50.0%
Table 5. Climate change perception and age of respondents in the study area.
Climate ParametersCC PerceptionHH Agep-Value (χ2-Test)
Upto 2021–40 Years41 to 6061 and above
Rainfall changeNo0.0%45.8%29.8%27.3%0.081
Yes100.0%54.2%70.2%72.7%
Temperature ChangeNo100.0%67.8%66.7%48.5%0.100
Yes0.0%32.2%33.3%51.5%
Season ChangeNo50.078.073.793.90.058
Yes50.022.026.36.1
Table 6. Farmers’ perception of major impacts of climate change in the agriculture sector (n = 124) in the study area.
ImpactNumber of Respondents
Decrease soil moisture/need more water for irrigation103 (83%)
Increase disease, insect, pest and weeds99 (80%)
Low yield/crop failure63 (51%)
Table 7. Different problems of climate change on agriculture based on climate change indicators as perceived by the farmers in the study area.
Climate Change/VariabilityChange Observed in Agriculture
Change and variability in rainfallDifficult to puddle to transplant rice
Decreased crop yield
Decreased soil moisture
Delayed in time of sowing of crops
Increase mortality of seedlings
Witlings crop in the field
Change and variability in temperatureIncreased incidence of pest and diseases
Appearance of newer pests and disease
Increased weeds
Change in crop phenology; time of flowering and fruiting
Burning younger new leaves of crop plants
Change in surface water availabilityDrying natural water sources.
Table 8. Gender and climate change adaptation measures in the study area.
Adaptation MeasuresAdaptation DecisionGender of HH Headp-Value (χ2-Test)
FemaleMale
Crop and variety adaptationNo78.8%69.2%0.280
Yes21.2%30.8%
Technological adaptationNo93.9%75.8%0.022
Yes6.1%24.2%
Input adaptationNo54.5%39.2%0.113
Yes45.5%60.8%
Farm structural adaptationNo36.4%48.3%0.222
Yes63.6%51.7%
Table 9. Adoption of climate change mitigation measures in the study area.
Explanatory VariablesBS.E.Sig.
Gender (Male = 1, Female = 0) BIN–0.4030.5770.485
Education ORDINAL0.7470.3690.043
Landholding (ha) CONT.0.5350.5400.322
Distance to market (km) CONT.–0.7510.2220.001
Livestock number (number) CONT.–0.0080.0630.898
Age (years) CONT.–0.0340.0230.151
Farming experience (years) CONT.0.0200.0270.460
Farm Altitude (masl) CONT.–0.0010.0010.551
Farming purpose [Market = 1
Subsistence -0) BIN
1.5790.5300.003
Constant3.2791.6910.052
Log likelihood = 129.201, Cox and Snell R Square = 0.242, Nagelkerke R Square = 0.358
Disclaimer/Publisher’s Note: The statements, opinions and data contained in all publications are solely those of the individual author(s) and contributor(s) and not of MDPI and/or the editor(s). MDPI and/or the editor(s) disclaim responsibility for any injury to people or property resulting from any ideas, methods, instructions or products referred to in the content.

