1. Introduction
Climate change has had several negative effects, including more severe storms, warmer oceans, loss of species, high temperatures and, in particular, increased drought, directly affecting the water availability in a region. According to the United Nations report [
1], periods of drought aggravated by global warming have been increasingly common in regions already susceptible to water shortages, increasing the risk of agricultural and ecological droughts.
Climate change has made droughts more frequent and prolonged, causing negative consequences such as the risk of forest fires, acceleration of the desertification process and water scarcity [
2]. Thus, effective modeling of the droughts in a region becomes inevitable, applying different indices and statistical methodologies that allow the presentation of scenarios so that the destructive impacts of this phenomenon can be minimized.
The growth of the human population has increasingly required an increase in agricultural production. However, the effects of drought have caused significant reductions in production [
3]. A study on the impacts of drought on the yield of irrigated and rainfed crops in the state of Texas showed a greater impact on winter wheat (
Triticum aestivum L.) and corn (
Zea mays L.); differently, the production of cotton (
Gossypium spp.) and sorghum [
Sorghum bicolor(L.) Moench] were less impacted by drought effects [
4]. A review of water management in dry regions pointed out that places with dry seasons need adaptations on the part of the phenology of the plant and also on water savings to guarantee stable yields, concluding that it is essential to understand the water stress in a region to propose efficient measures to mitigate this stress [
5].
The Northeast Region of Brazil (NEB) is known to have scarce rainfall, especially in the northeastern semiarid region. Droughts and high temperatures in the NEB negatively affect water resources in the region, resulting in a gradual decrease in the storage volume in the reservoirs and contributing to unprecedented water scarcity [
6].
In general, droughts in the NEB generate profound environmental, social and economic impacts. In dry years, when rainfall is insufficient for harvesting and water storage, farmers residing in the northeastern semiarid region interrupt agricultural production, causing a social calamity, unemployment, because the region does not offer other job opportunities, forcing the inhabitants to abandon their lands and migrate to the great centers of Brazil, such as the regions of São Paulo, Rio de Janeiro and Brasília [
7].
The state of Paraíba, which makes up one of the nine federative units of the NEB, has been impacted by droughts in recent years. It is estimated that 94.60% of the territory of Paraíba presents an area susceptible to desertification as a result of soil degradation caused by the combination of human activities and climate change [
8]. Due to the migratory processes caused by the droughts in Paraíba, municipalities in this region have the highest rates of population aging, since young people leave their lands in search of employment opportunities [
9].
Agricultural production throughout the State of Paraíba has been suffering negative impacts due to the droughts that affect the entire region. In the period from 2012 to 2016, due to the droughts and high temperatures that affected the state, the productivity of crops such as maize, cowpea and rice showed a drastic reduction in relation to the planted area [
10].
The standardized precipitation index (SPI) has been commonly used for drought monitoring and analysis in different regions of the globe [
11,
12,
13]. Several studies have modeled drought rates in regions of the State of Paraíba through the SPI. An analysis in the Alto Paraíba basin between 2012 and 2017 revealed a strong influence of droughts on the spatiotemporal variability of vegetation in this region [
14]. A study using the SPI identified rainy and dry periods across the region, concluding that the months from September to December are the driest in the entire state [
15]. Research on drought trends in Paraíba from 1998 to 2017 concluded, through the SPI, that drought events tend to have a higher temporal frequency and tend to be more severe [
16]. Although the aforementioned studies have presented interpolated maps of drought-related indices, they did not take into account the joint, space–time dependence of these attributes and did not present projections so that government agencies can use them to minimize the damage caused by long periods without rain.
In view of this, the impacts on a region related to natural disasters such as droughts undoubtedly cause several upsets to society and the environment. Therefore, there is a need to apply strategic planning to minimize the impacts generated by these disasters. The construction of cisterns, weirs and dams can be adopted by governments to solve this serious problem. In addition, to adopt efficient public policies, statistical analysis becomes an indispensable tool for planning, providing precious information based on the historical series of rainfall in the region and presenting projections so that the needs of the entire society can be anticipated.
Therefore, the main objective of this research was to investigate the spatiotemporal behavior of the number of days without rain in the year throughout the state of Paraíba, thus presenting high resolution maps of this attribute so that government agencies can use them as tools in the presentation of projects to minimize the impacts generated by droughts.
2. Materials and Methods
The study area corresponds to the State of Paraíba, located in the Northeast Region of Brazil, with a territorial extension of 56,467 km
2, which corresponds to 0.664% of the entire territory of Brazil [
17]. To obtain an idea of the extent of this region, countries on the European continent, such as Slovakia (48,845 km
2), Denmark (43,094 km
2) and Switzerland (41,290 km
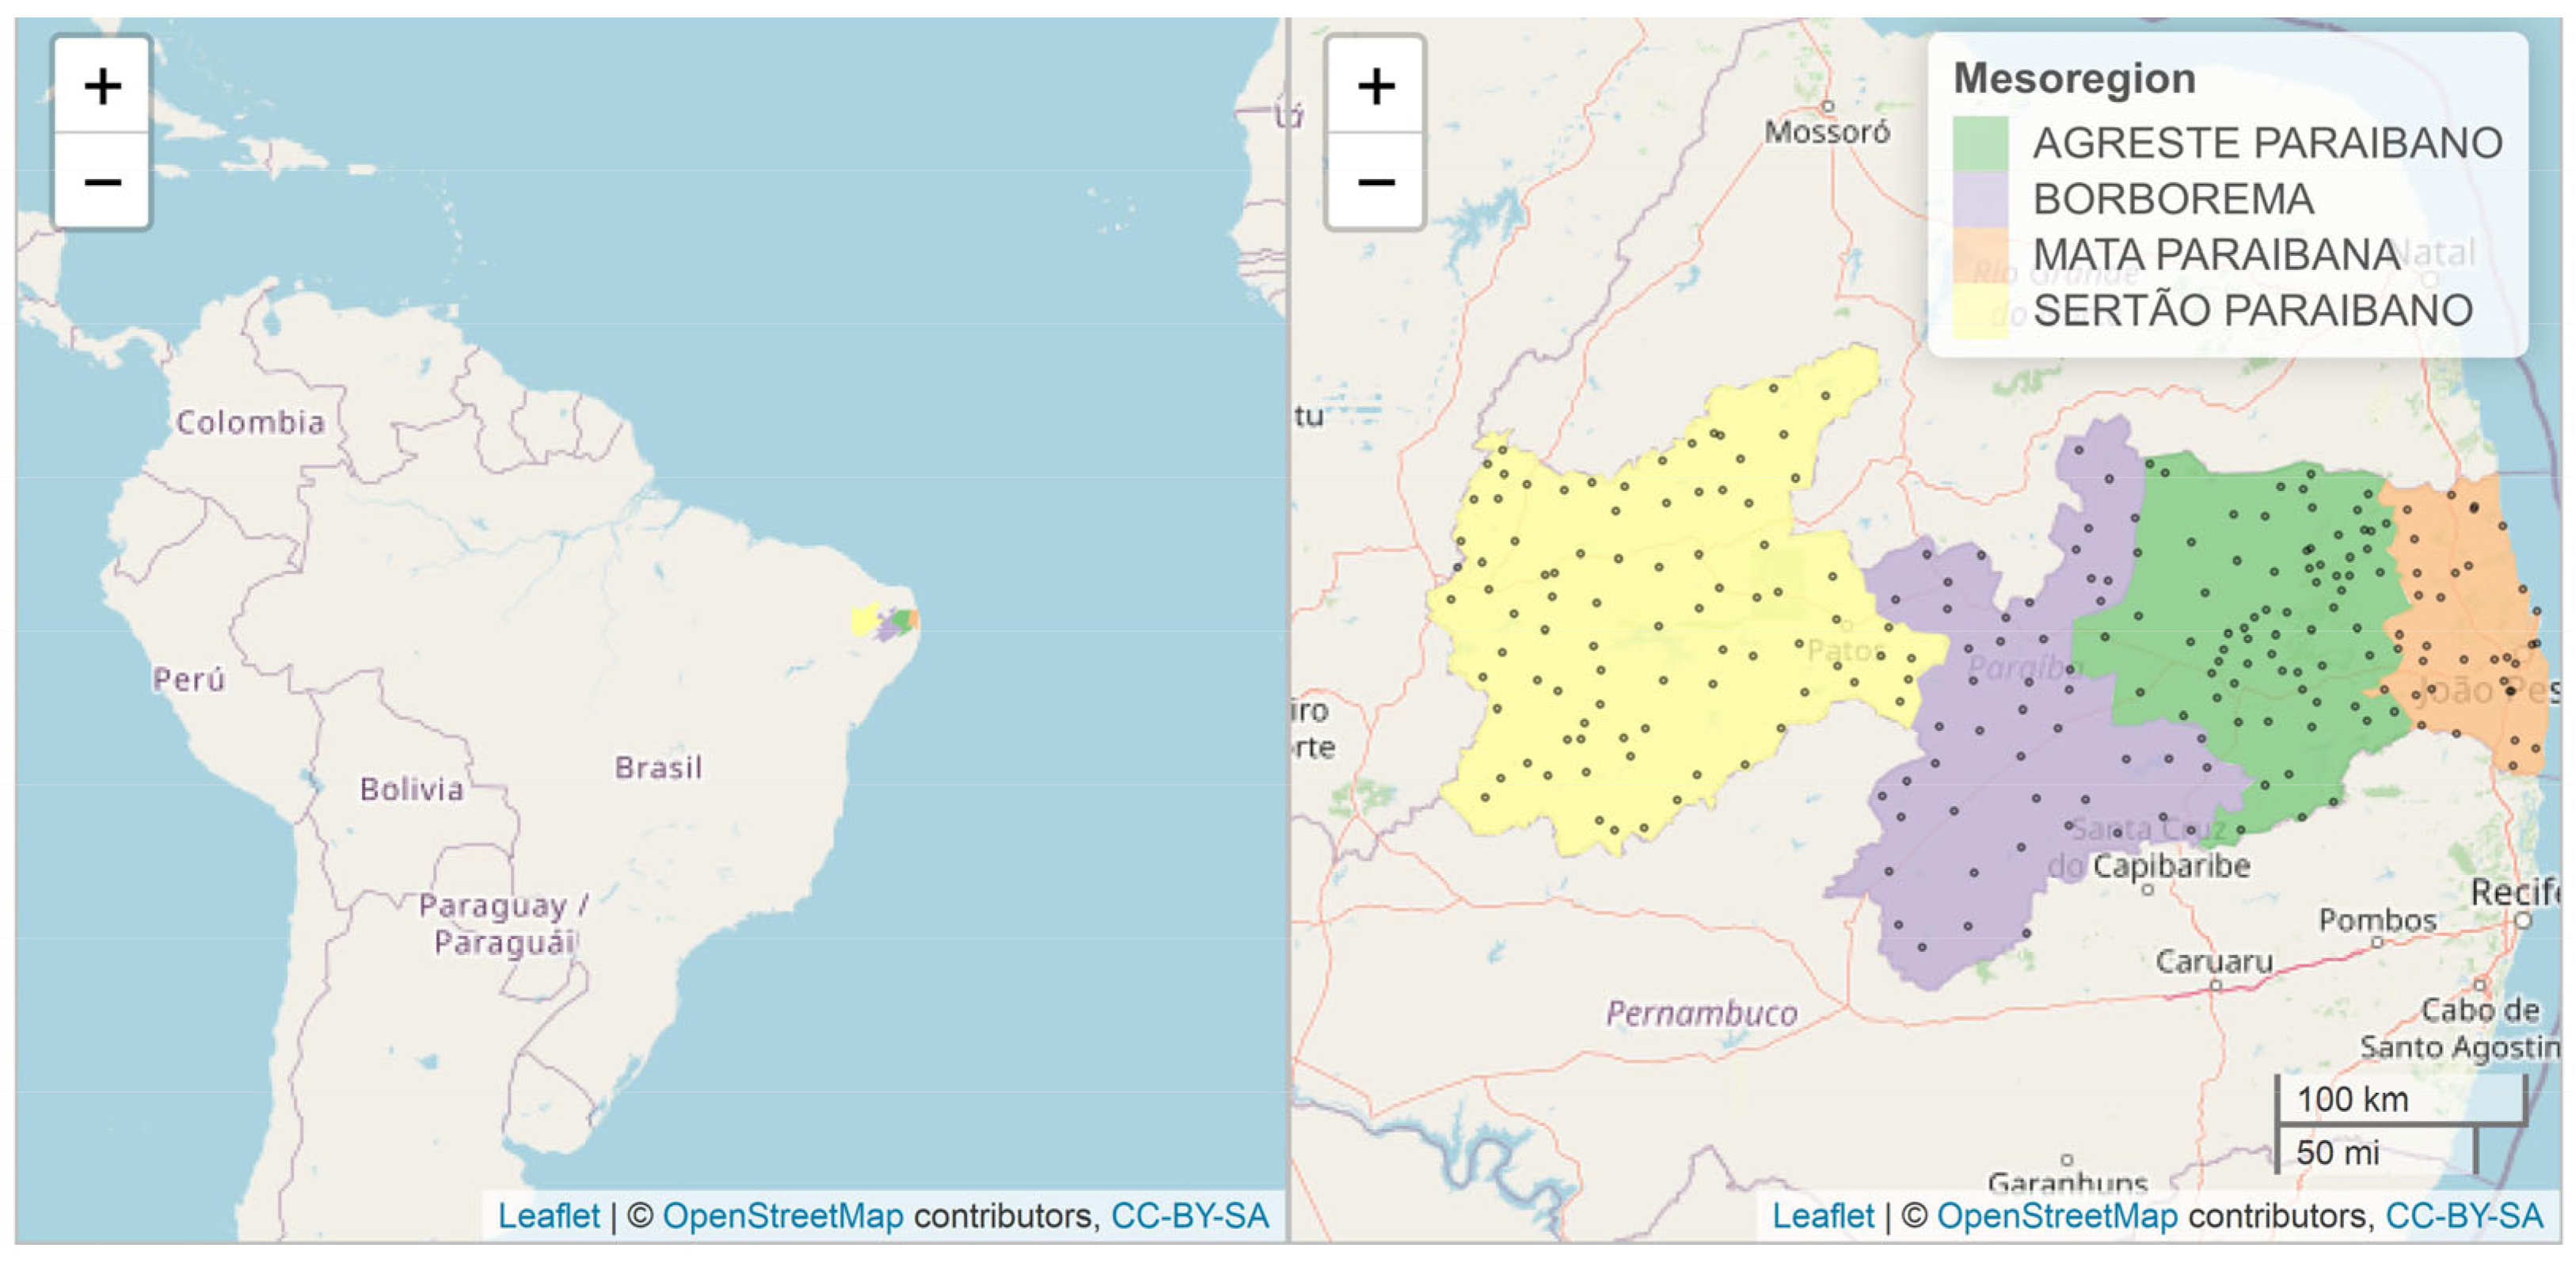
2) have areas smaller than the State of Paraíba. The state is divided into four mesoregions (Sertão Paraibano, Borborema, Agreste Paraibano and Mata Paraibana) with different climatic and environmental conditions (
Figure 1).
The dataset used in this study consisted of 238 rainfall stations irregularly distributed throughout the study region (
Figure 1). The original dataset refers to the daily rainfall recorded at each of the rainfall stations from 1994 to 2020. We consider a day without rain as a day when there was no record of rainfall on the day (0 mm). At each rainfall station, the total number of days without rain (DWR) per year was extracted, considering only stations with more than 180 days without rain in the year. The dataset was provided by AESA—Executive Agency for Water Management of the State of Paraíba (
http://www.aesa.pb.gov.br/aesa-website/ (accessed on 1 December 2022.)).
In this study, we considered the stochastic process
where
represents the geographic coordinates and
represents the temporal dimension. In this model, we can decompose the space–time component (
in the following expression:
In Equation (1), the stochastic process was decomposed by the tendency components (
) and the stochastic error (
). In our modeling, we assumed that the random error was second-order stationary, mutually independent and spatially isotropic [
18].
For tendency modeling, we performed a preliminary analysis using scatter plots, considering the DWR as the dependent variable and the geographic coordinates and the year as independent variables. To adjust this component, we adjusted multiple linear regression, followed by the t test to verify the significance of the parameters related to the linear effects of latitude, longitude and temporal index and the quadratic effect of longitude. The coefficient of determination (R2) was calculated to determine how much of the variability in the DWR is explained by the tendency.
The residuals of the regression model were submitted to an empirical spatiotemporal variogram. The generalized product-sum theoretical model, with the exponential function in the spatial and temporal components, was adjusted to the point cloud of the empirical variogram. The generalized sum-product has been widely used in spatiotemporal geostatistical analysis by presenting a nonseparable space–time structure and providing suitable adjustments to kriging [
19,
20].
To obtain the interpolated maps, ordinary spatiotemporal kriging was first applied to the residuals, which is expressed by the following expression:
In Equation (2), the term
concerns the interpolated residue of the DWR at spatial position
and time
. The component
represents the transposed vector of the residual covariance between the “observed” residuals (estimated by the trend) with the estimated one for the point (
).
represents the inverse matrix of residual covariances, and
is the vector of the residuals of the trend-adjusted model. The final predictor of DWR (Equation (3)) at position
and at time
is given by:
Equation (3) is known as spatiotemporal regression kriging [
18,
20]. The terms
and
are obtained by tendency fitting and ordinary spatiotemporal kriging, respectively. The “leave-one-out” cross-validation was used to extract the metrics to present the results of the quality of fit of the DWR estimates obtained by Equation (3). The metrics used were the mean absolute error and the coefficient of determination between the observed and interpolated values.
Finally, for the construction of spatiotemporal kriging maps, a grid with 28,300 points distributed regularly in the region under study was constructed, resulting in a spatial resolution of 1 point every 2 km2.
Statistical analyses were performed in R software [
21]. In the software, the main libraries used were ggplot2 [
22] and gstat [
23] for graphical presentation and for geostatistical modeling, respectively.
3. Results and Discussion
Table 1 shows a descriptive analysis of the DWR of the mesoregions that make up the state of Paraíba between 1994 and 2020. The Zona da Mata region draws attention by having the lowest average number of 240 days a year without rain and the greatest variability, with a coefficient of variation of 15.86%. However, Borborema presented the highest average of 325 days in the year without rain, with a low variability between the rainfall stations that make up this region.
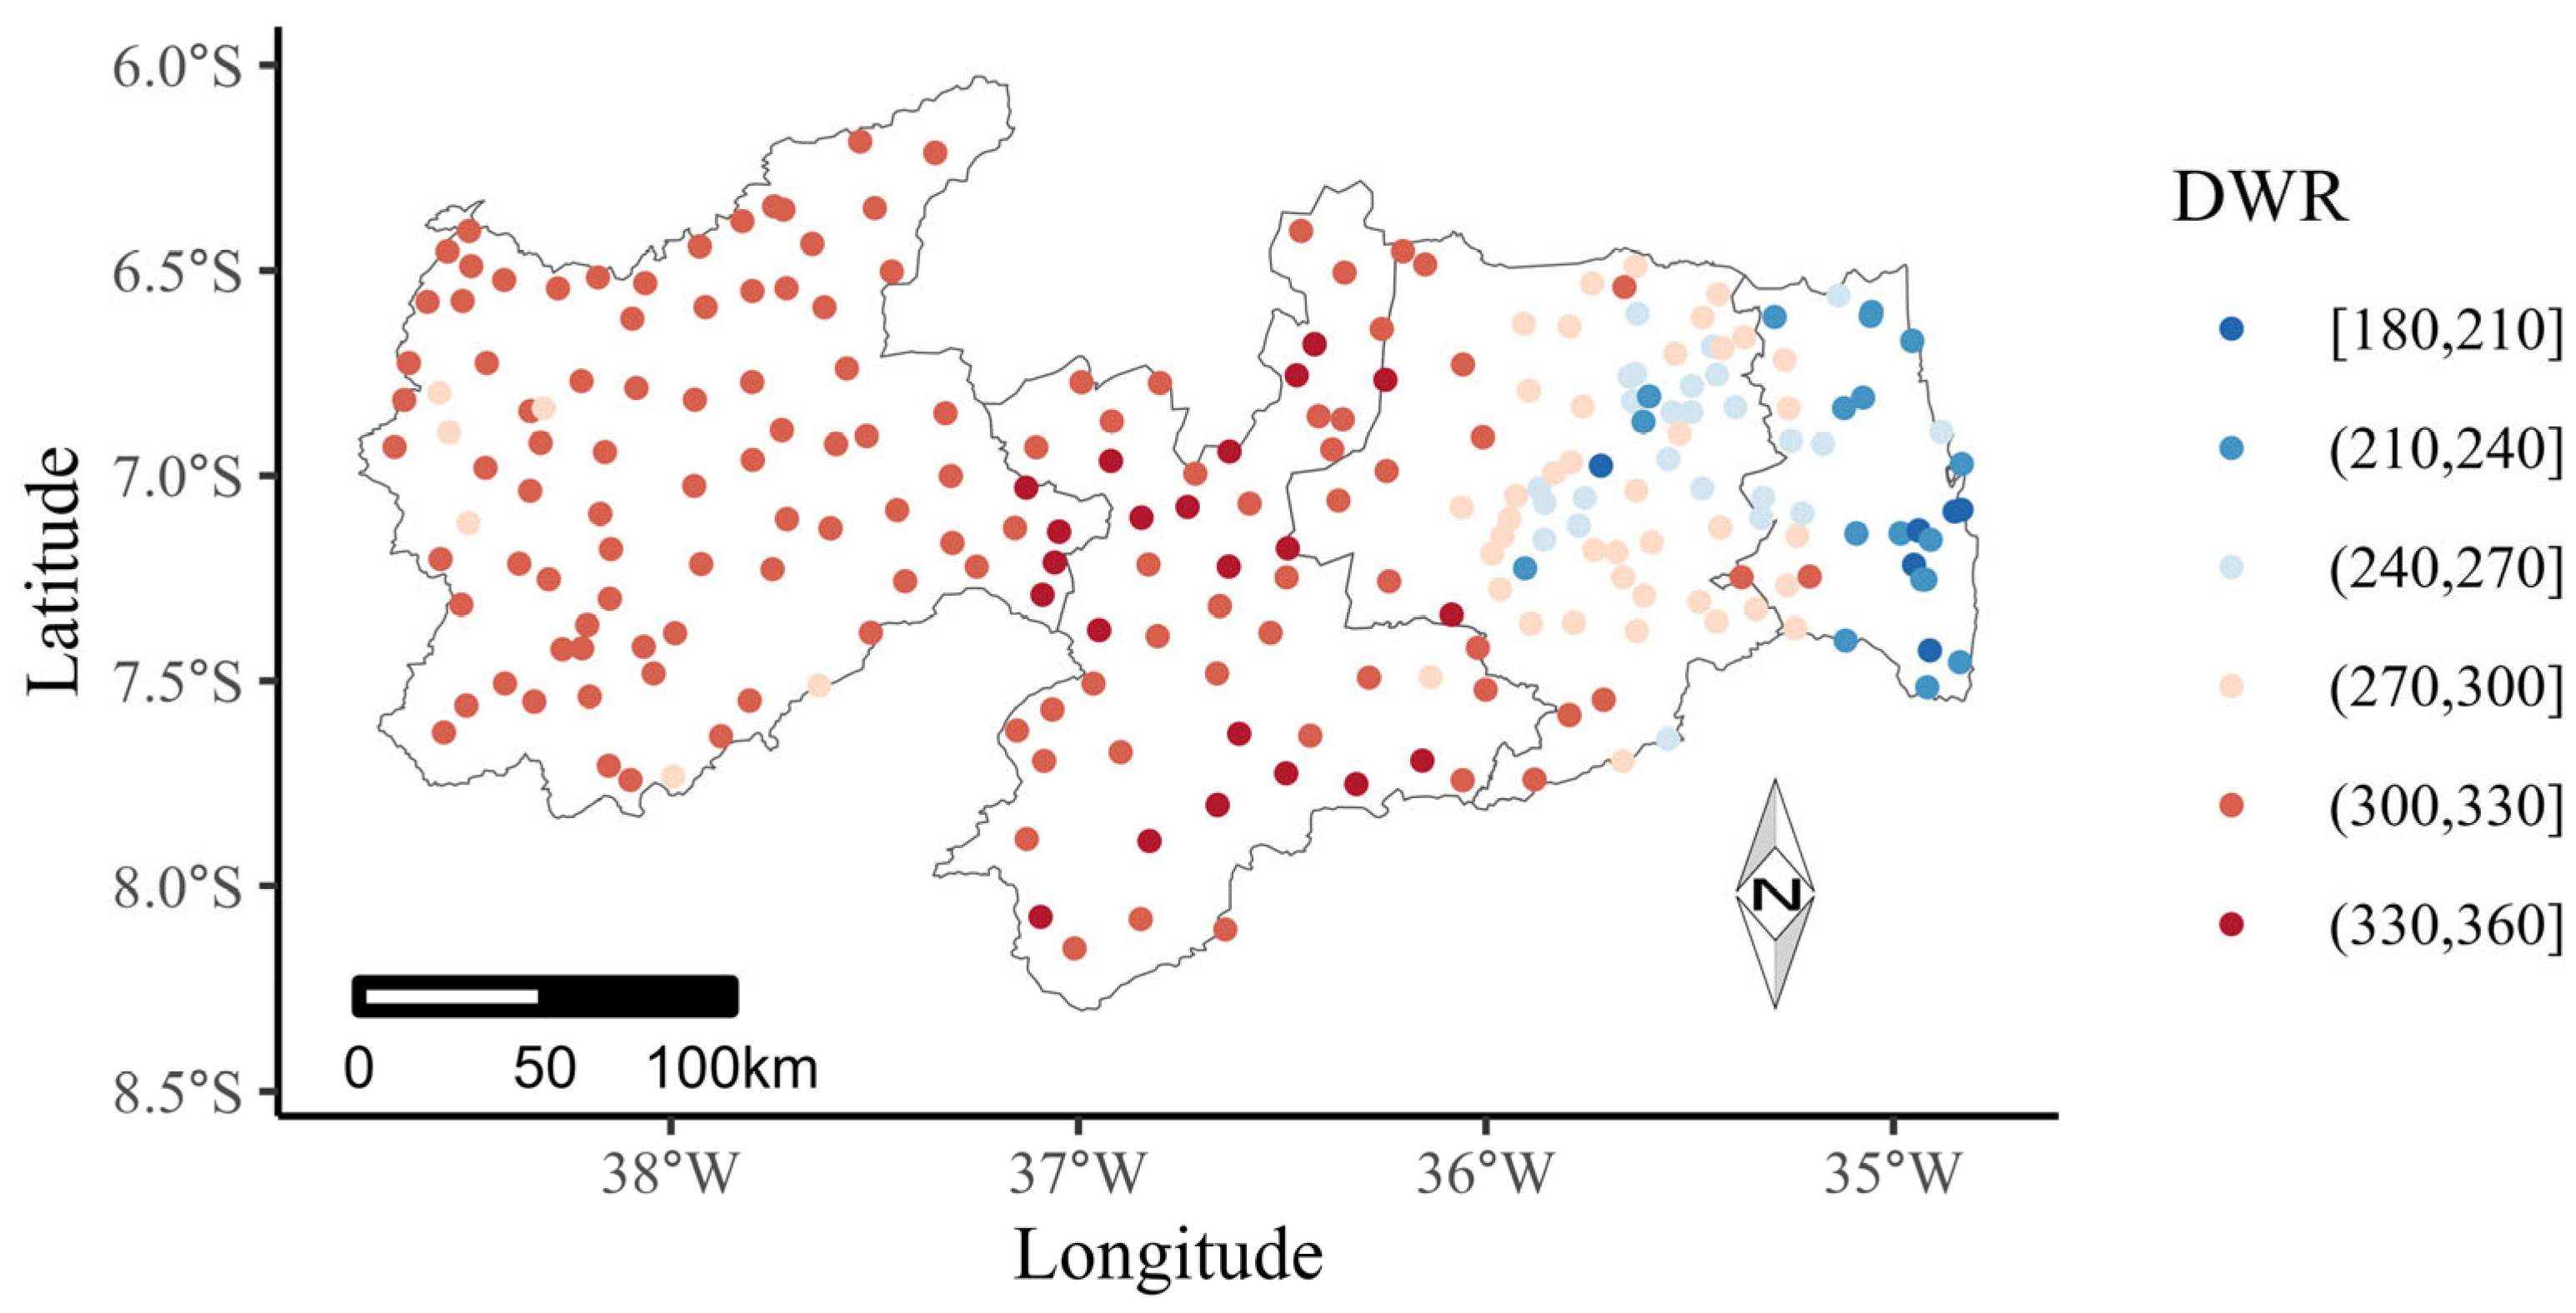
Figure 2 shows the spatial distribution of the average annual number of DWRs for the State of Paraíba from 1994 to 2020. As already described in
Table 1, the Zona da Mata mesoregion presented the lowest average DWR, and most rainfall stations presented a maximum of 240 days without rain in the year. However, some rainfall stations located in the Borborema mesoregion showed the highest average DWR values, with at least 330 days a year without rainfall.
The dryness phenomenon occurs when there is a delay of more than 15 days in the rainy season, implying a reduction of 60% or more of the historical monthly rainfall averages [
24]. According to this author, drought is the occurrence of prolonged dryness, causing a significant reduction in water reserves in a region. In the State of Paraíba, 1984 occurrences of drought were recorded in the period from 1994 to 2012, with at least 212 municipalities affected by this type of natural disaster. These municipalities are located in the different mesoregions of the state; however, a significant number of these records occurred in the central region of the state, where the Agreste Paraibano and Borborema mesoregions are located, totaling 1205 drought records [
25]. However, among the four mesoregions, Sertão Paraibano presents the highest number of natural disaster records, with 711 occurrences.
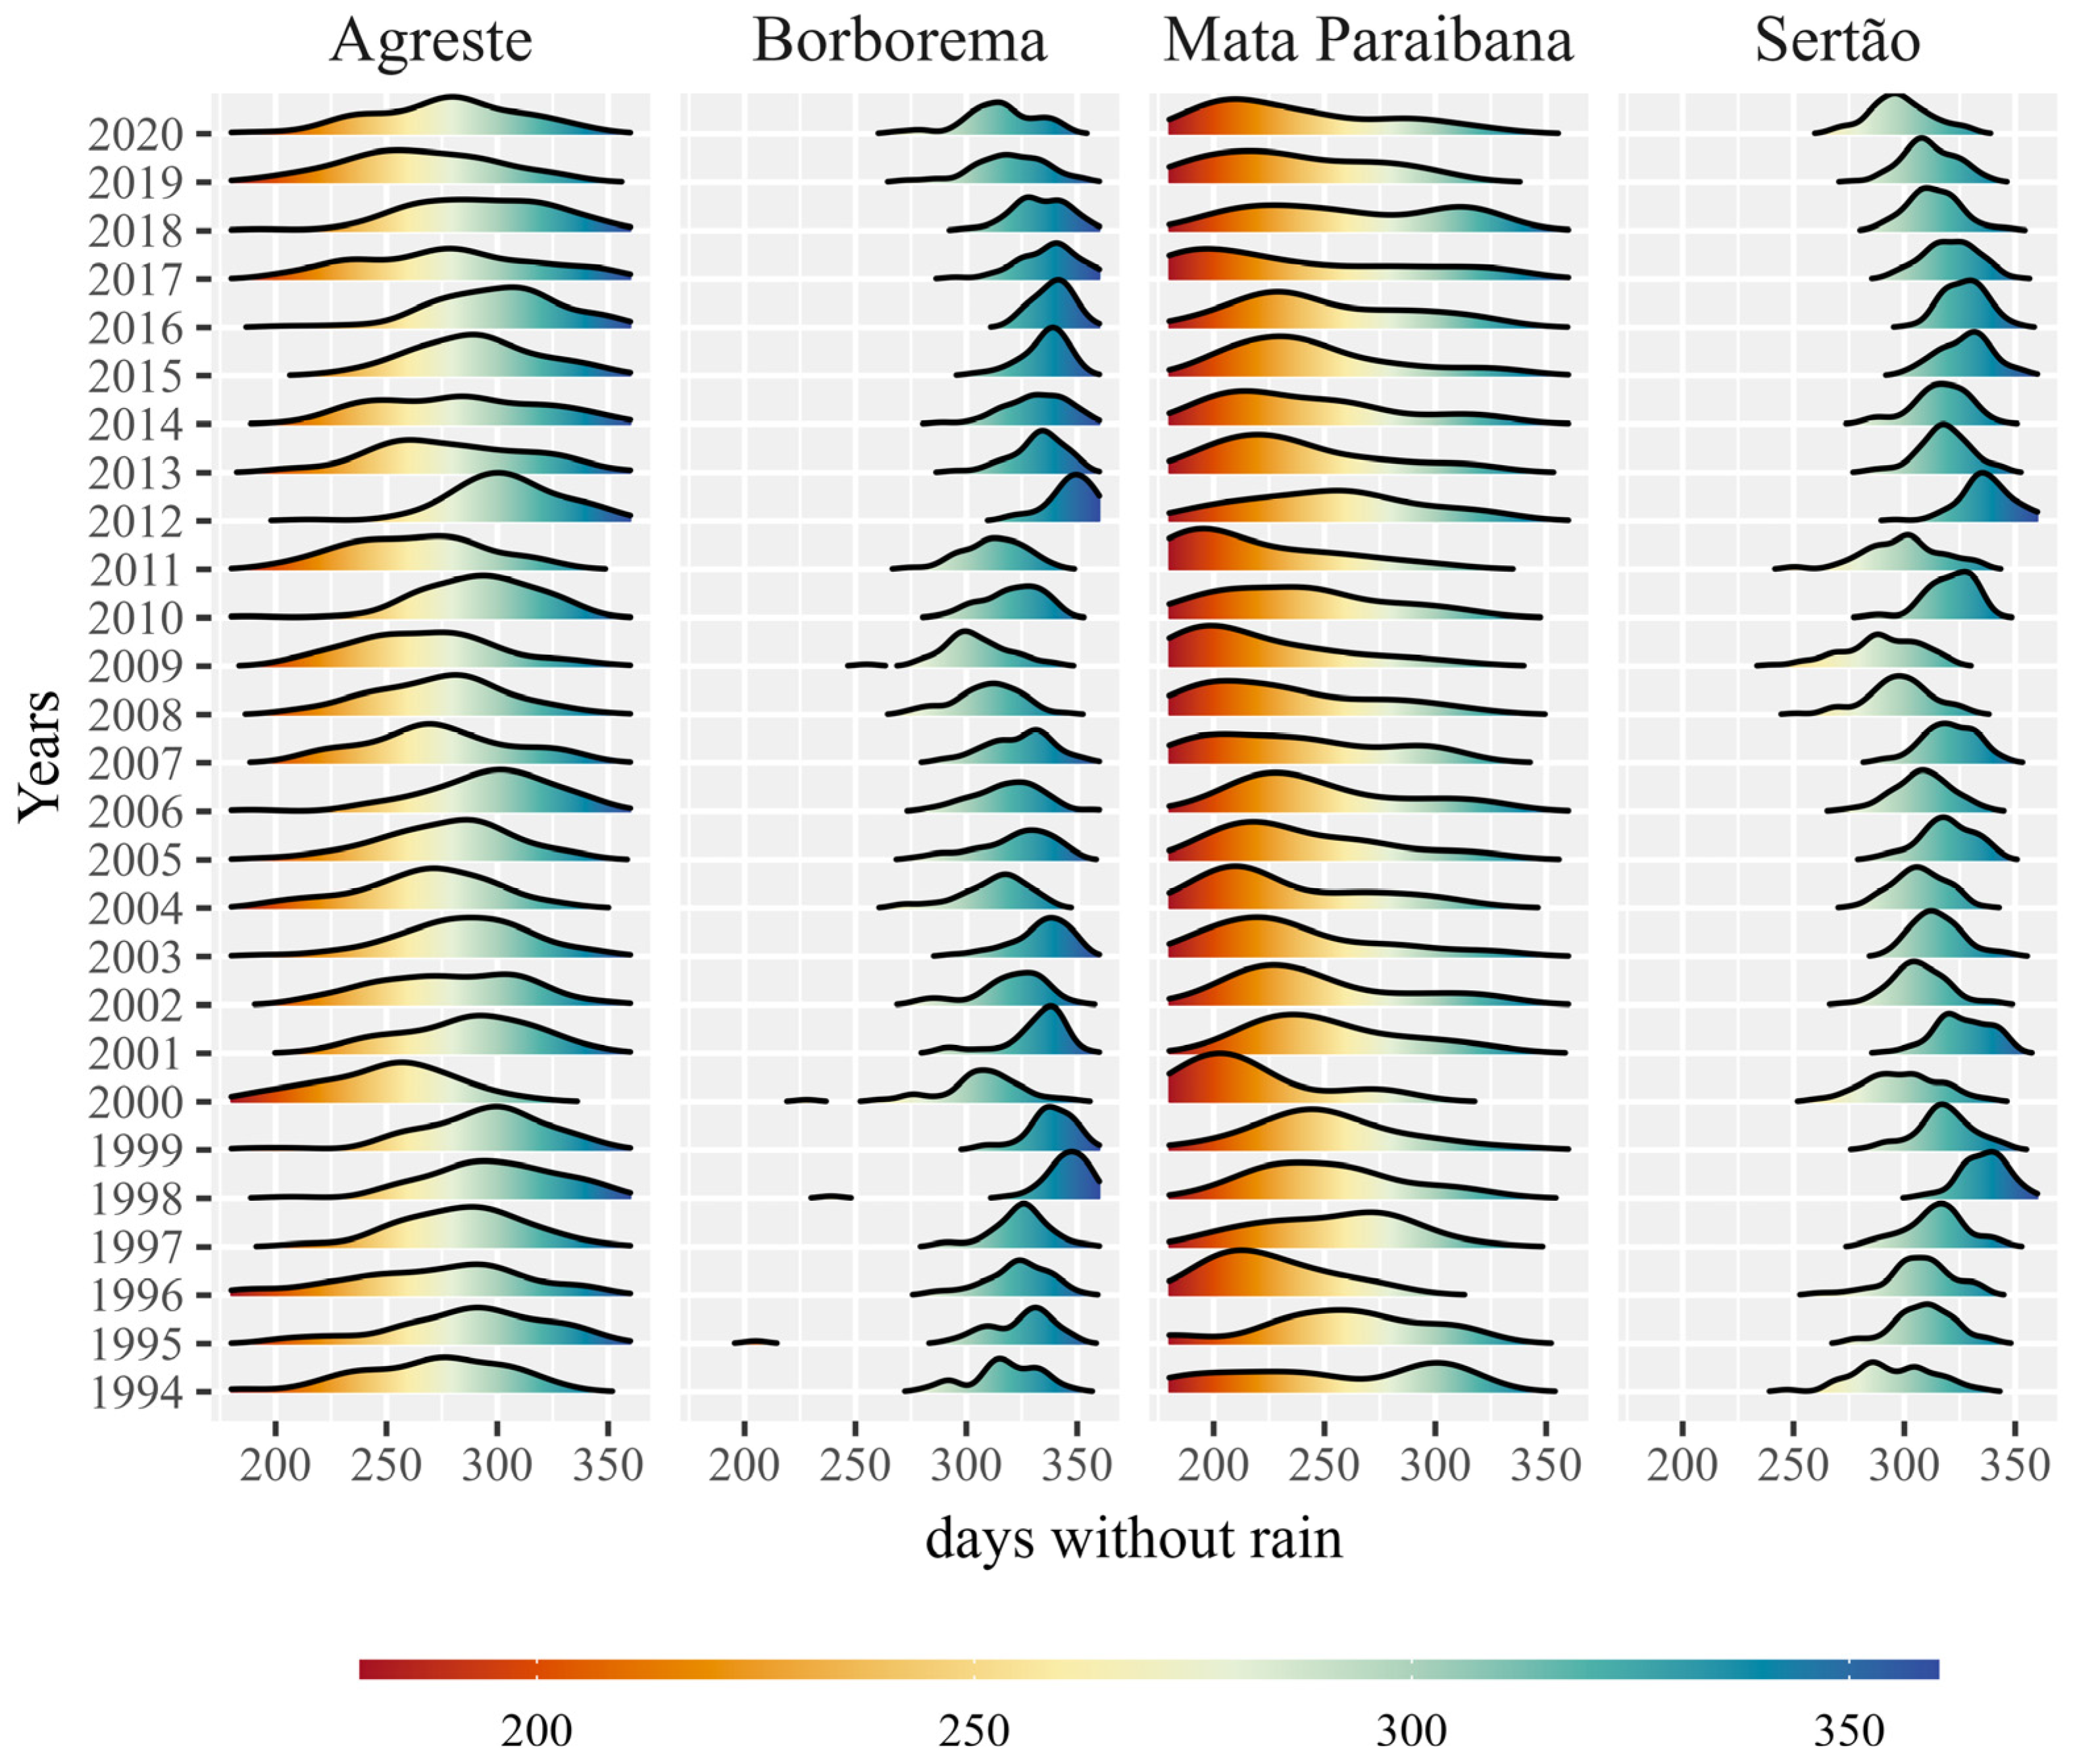
The year 2012 drew attention in the region under study for presenting a high density of DWRs in all mesoregions (
Figure 3). According to the Brazilian Atlas of Natural Disasters [
25], in 2012, they presented the highest occurrences of prolonged drought in the State of Paraíba, with a total of 391 records, 20% of the records during the period from 1991 to 2012.
When analyzing the percentage of storage volumes in reservoirs across the state, a downward trend was noted for the period from 2012 to 2015, from 50% storage of reservoirs in 2012 to less than 20% in 2015 [
26]. The Brazil Drought Monitor pointed out that in Paraíba, between 2014 and 2019, the presence of droughts classified as S3 (extreme drought) and S4 (exceptional drought), indicated losses of crops and a pastures and lack of water in reservoirs, resulting in emergency situations [
27].
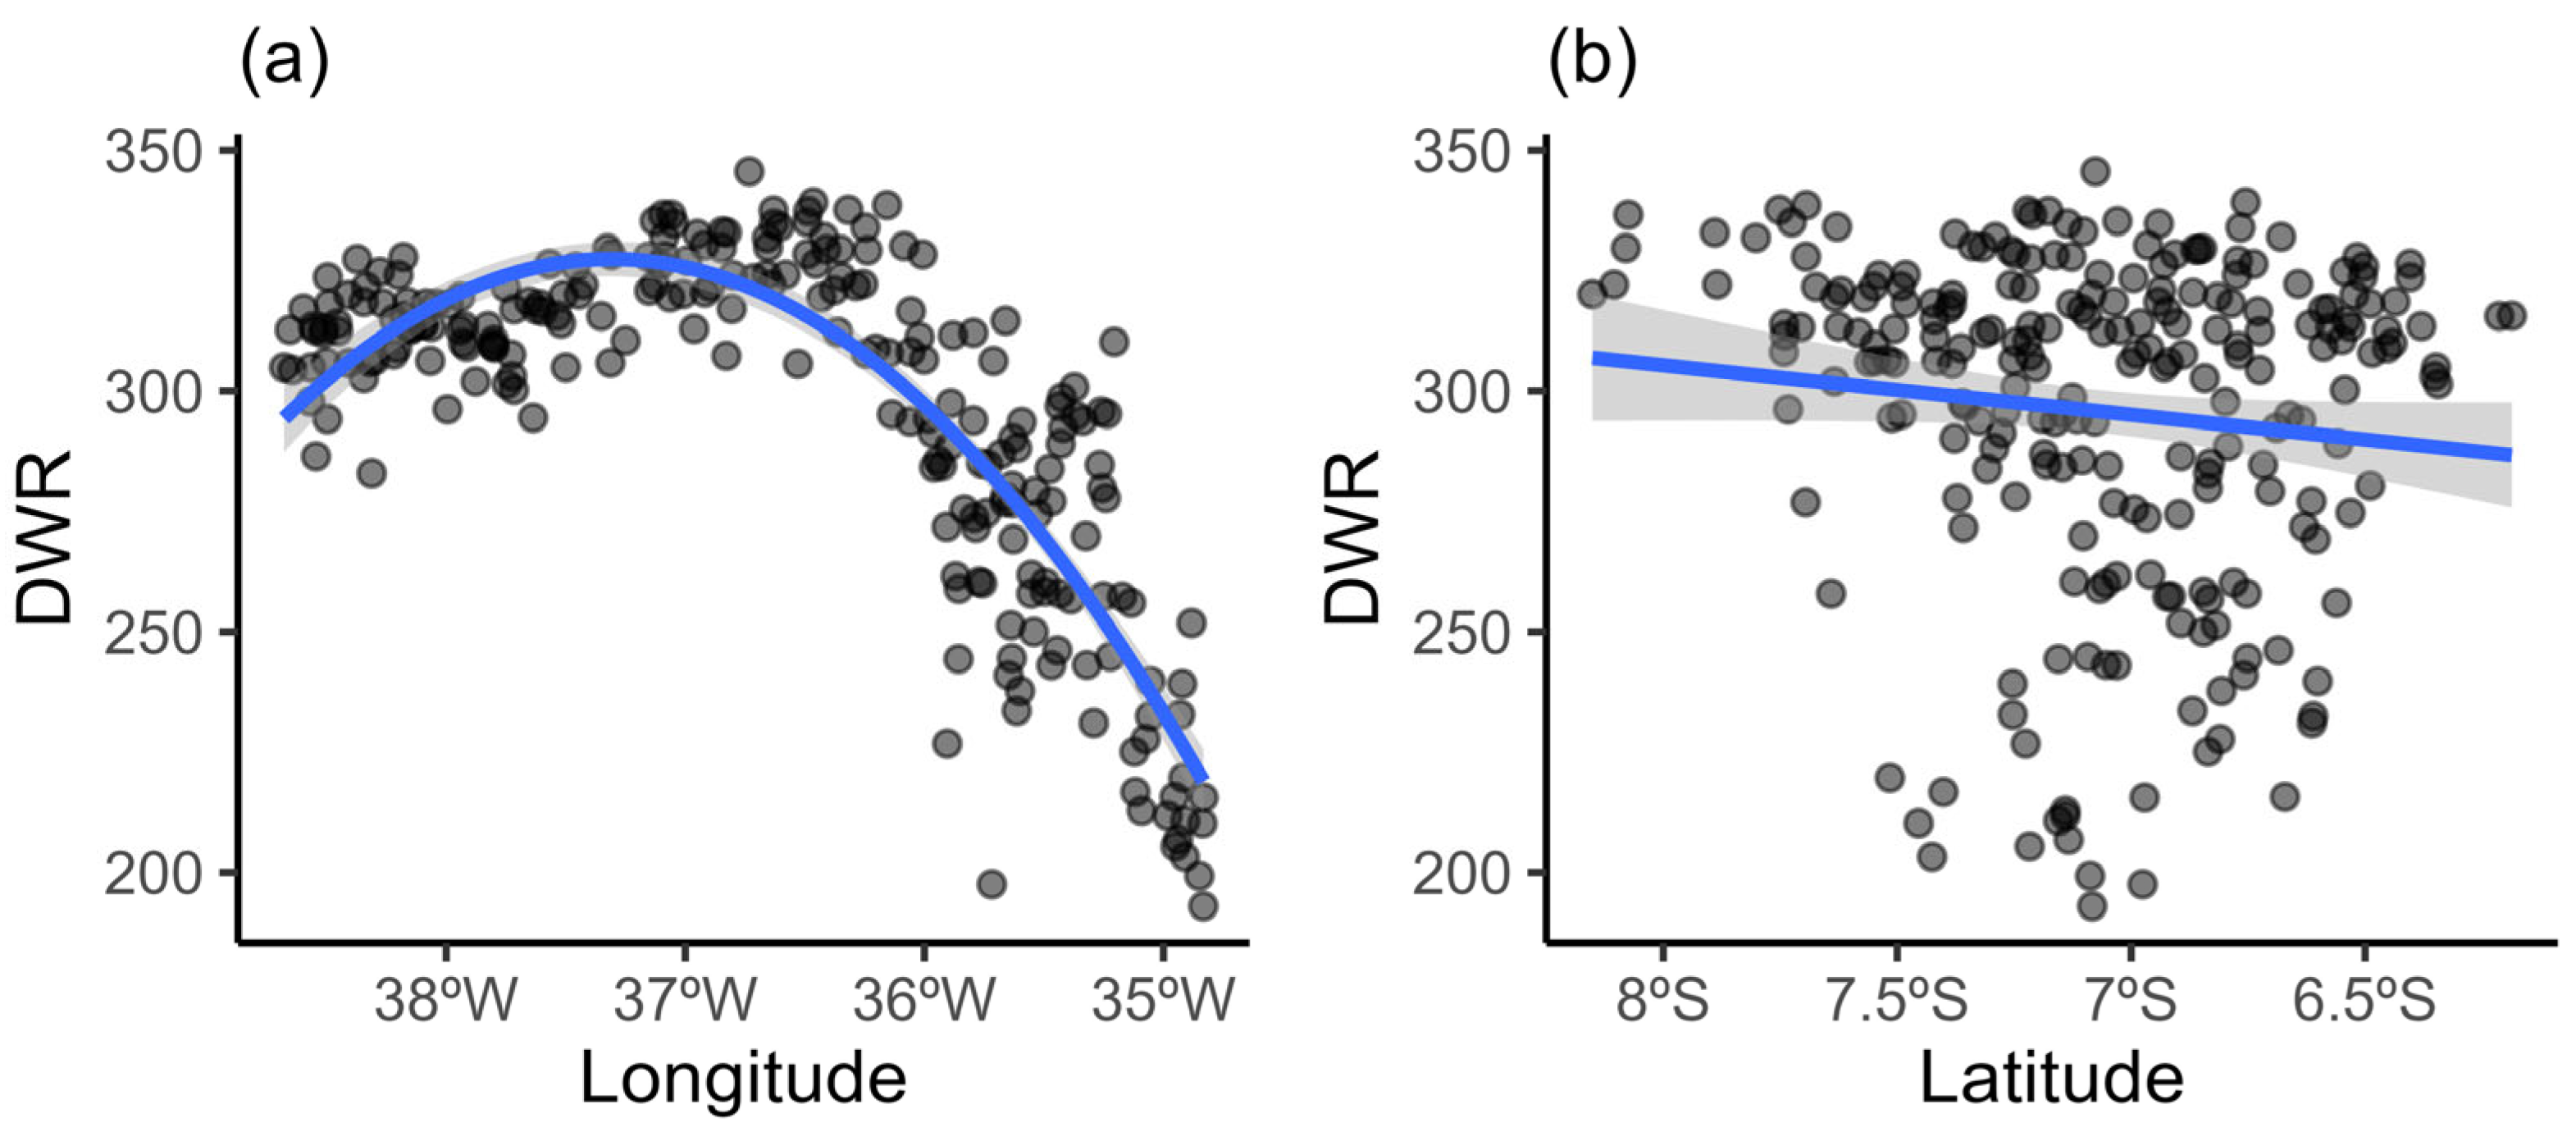
Figure 4 shows an exploratory analysis to investigate the relationship between the DWR variable and the geographic coordinates of longitude and latitude. We can clearly see a quadratic effect between DWR and longitude (
Figure 4a). However, there is no causal relationship between the variable and latitude (
Figure 4b).
Table 2 shows the results of the multiple linear regression adjustment considering the linear and quadratic effects of longitude.
The results of the multiple regression fit indicate that the linear and quadratic effects of longitude were statistically significant (p < 0.05) for the DWR. It was noted that 55.64% of the DWR variability was explained by tendency adjustment.
It is clearly noted that the space–time distribution of rainfall in the State of Paraíba shows a trend in relation to the geographic coordinates, and that more than half of this variability is due to the effect of the trend, with prior modeling of this component being of fundamental importance. The authors in [
15] constructed interpolated maps of descriptive measures related to rainfall in Paraíba, which clearly showed a spatial tendency of these estimates, which was not considered by the authors.
Therefore, we can see the great importance of first modeling the trend so that, after removing it, we proceed to the analysis of spatiotemporal dependence. A study on the space–time distribution of monthly accumulated precipitation in the State of Paraíba found the presence of a tendency for this variable as a function of latitude and longitude geographical coordinates, with an R
2 of 29% [
18].
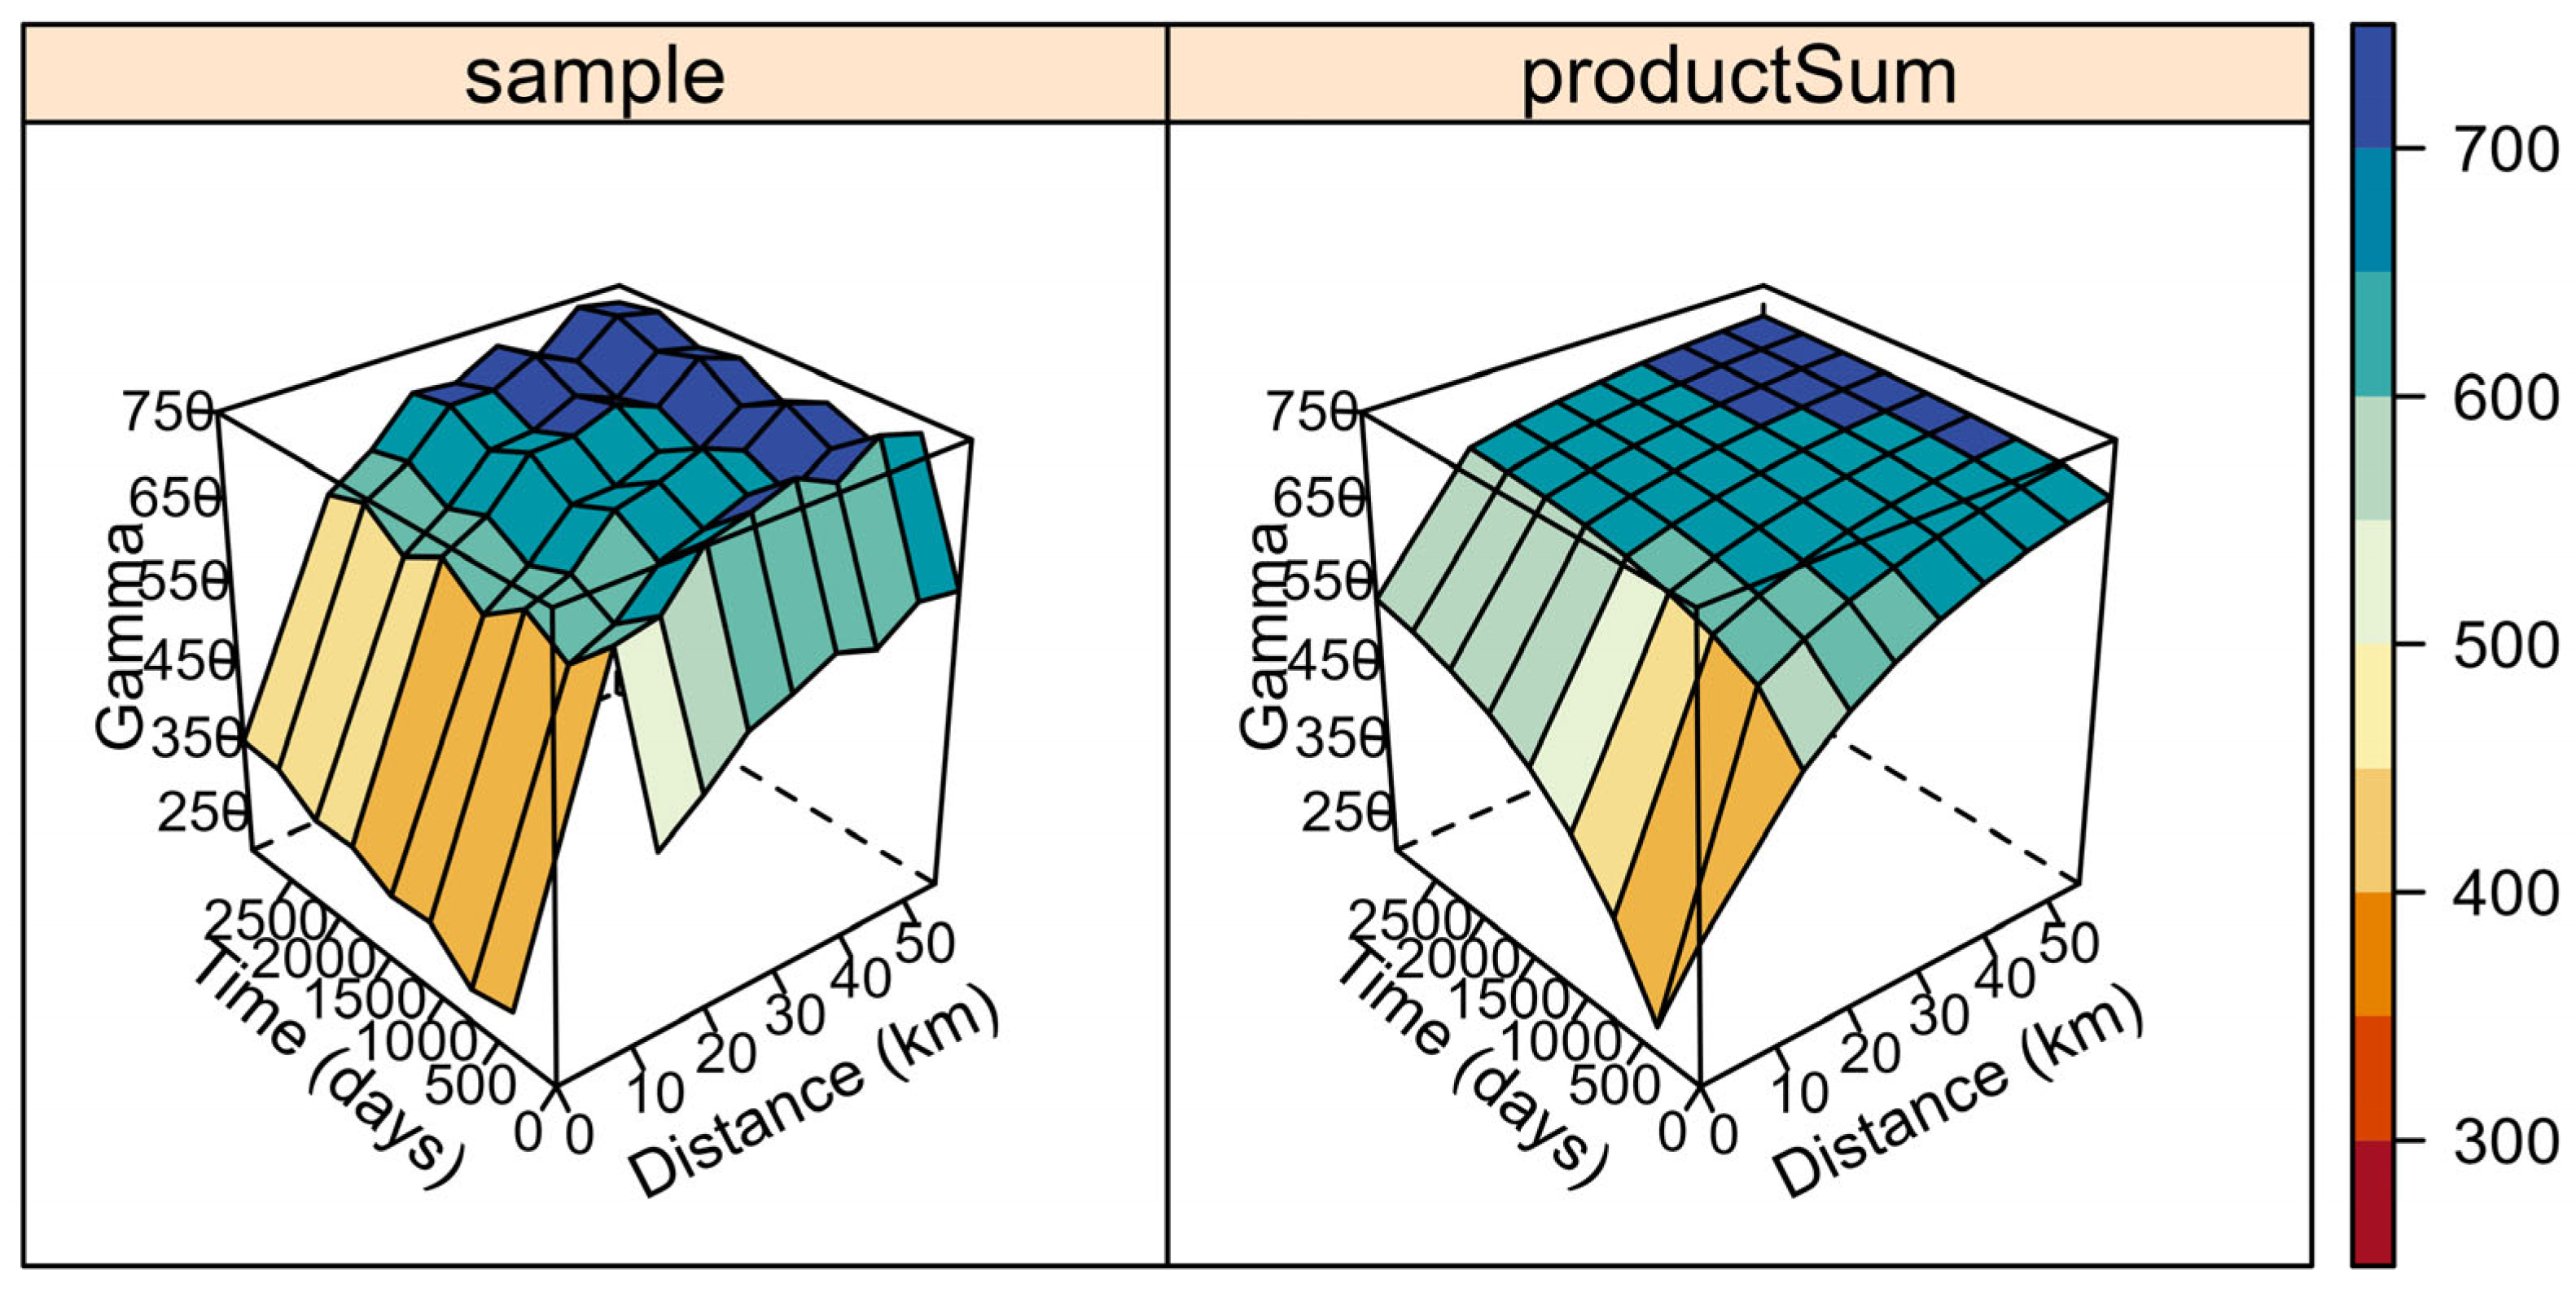
After removing the trend, the experimental variograms and the theoretical generalized product-sum were obtained (
Figure 5). In this figure, we can see that the greatest contribution to the space–time variability of the DWR was due to the spatial component.
Table 3 shows the estimates of the parameters of the generalized product-sum model. As mentioned in
Figure 5, the variability of the spatial component (sill = 272.274) was greater than that of the temporal component (sill = 3.176), indicating that the variability of the DWR was more related to space than to time. The results showed that there is a spatial dependence of the DWR between neighboring points separated by a radius of up to 39 km. However, the number of days without rain in the year of a location presents a temporal dependence, and what happens today in the region influences the results in the next 2.8 years.
When using the generalized product-sum model, we consider in the modeling that the DWR presents a space–time interaction of its variability, thus making it possible to interpolate this variable in nonsampled locations and in nonobserved times, thus creating forecast maps.
A study on the variability of dry and rainy periods in the State of Paraíba used geostatistical techniques for interpolation; however, this research did not take into account the existence of temporal dependence of rainfall in the region [
15].
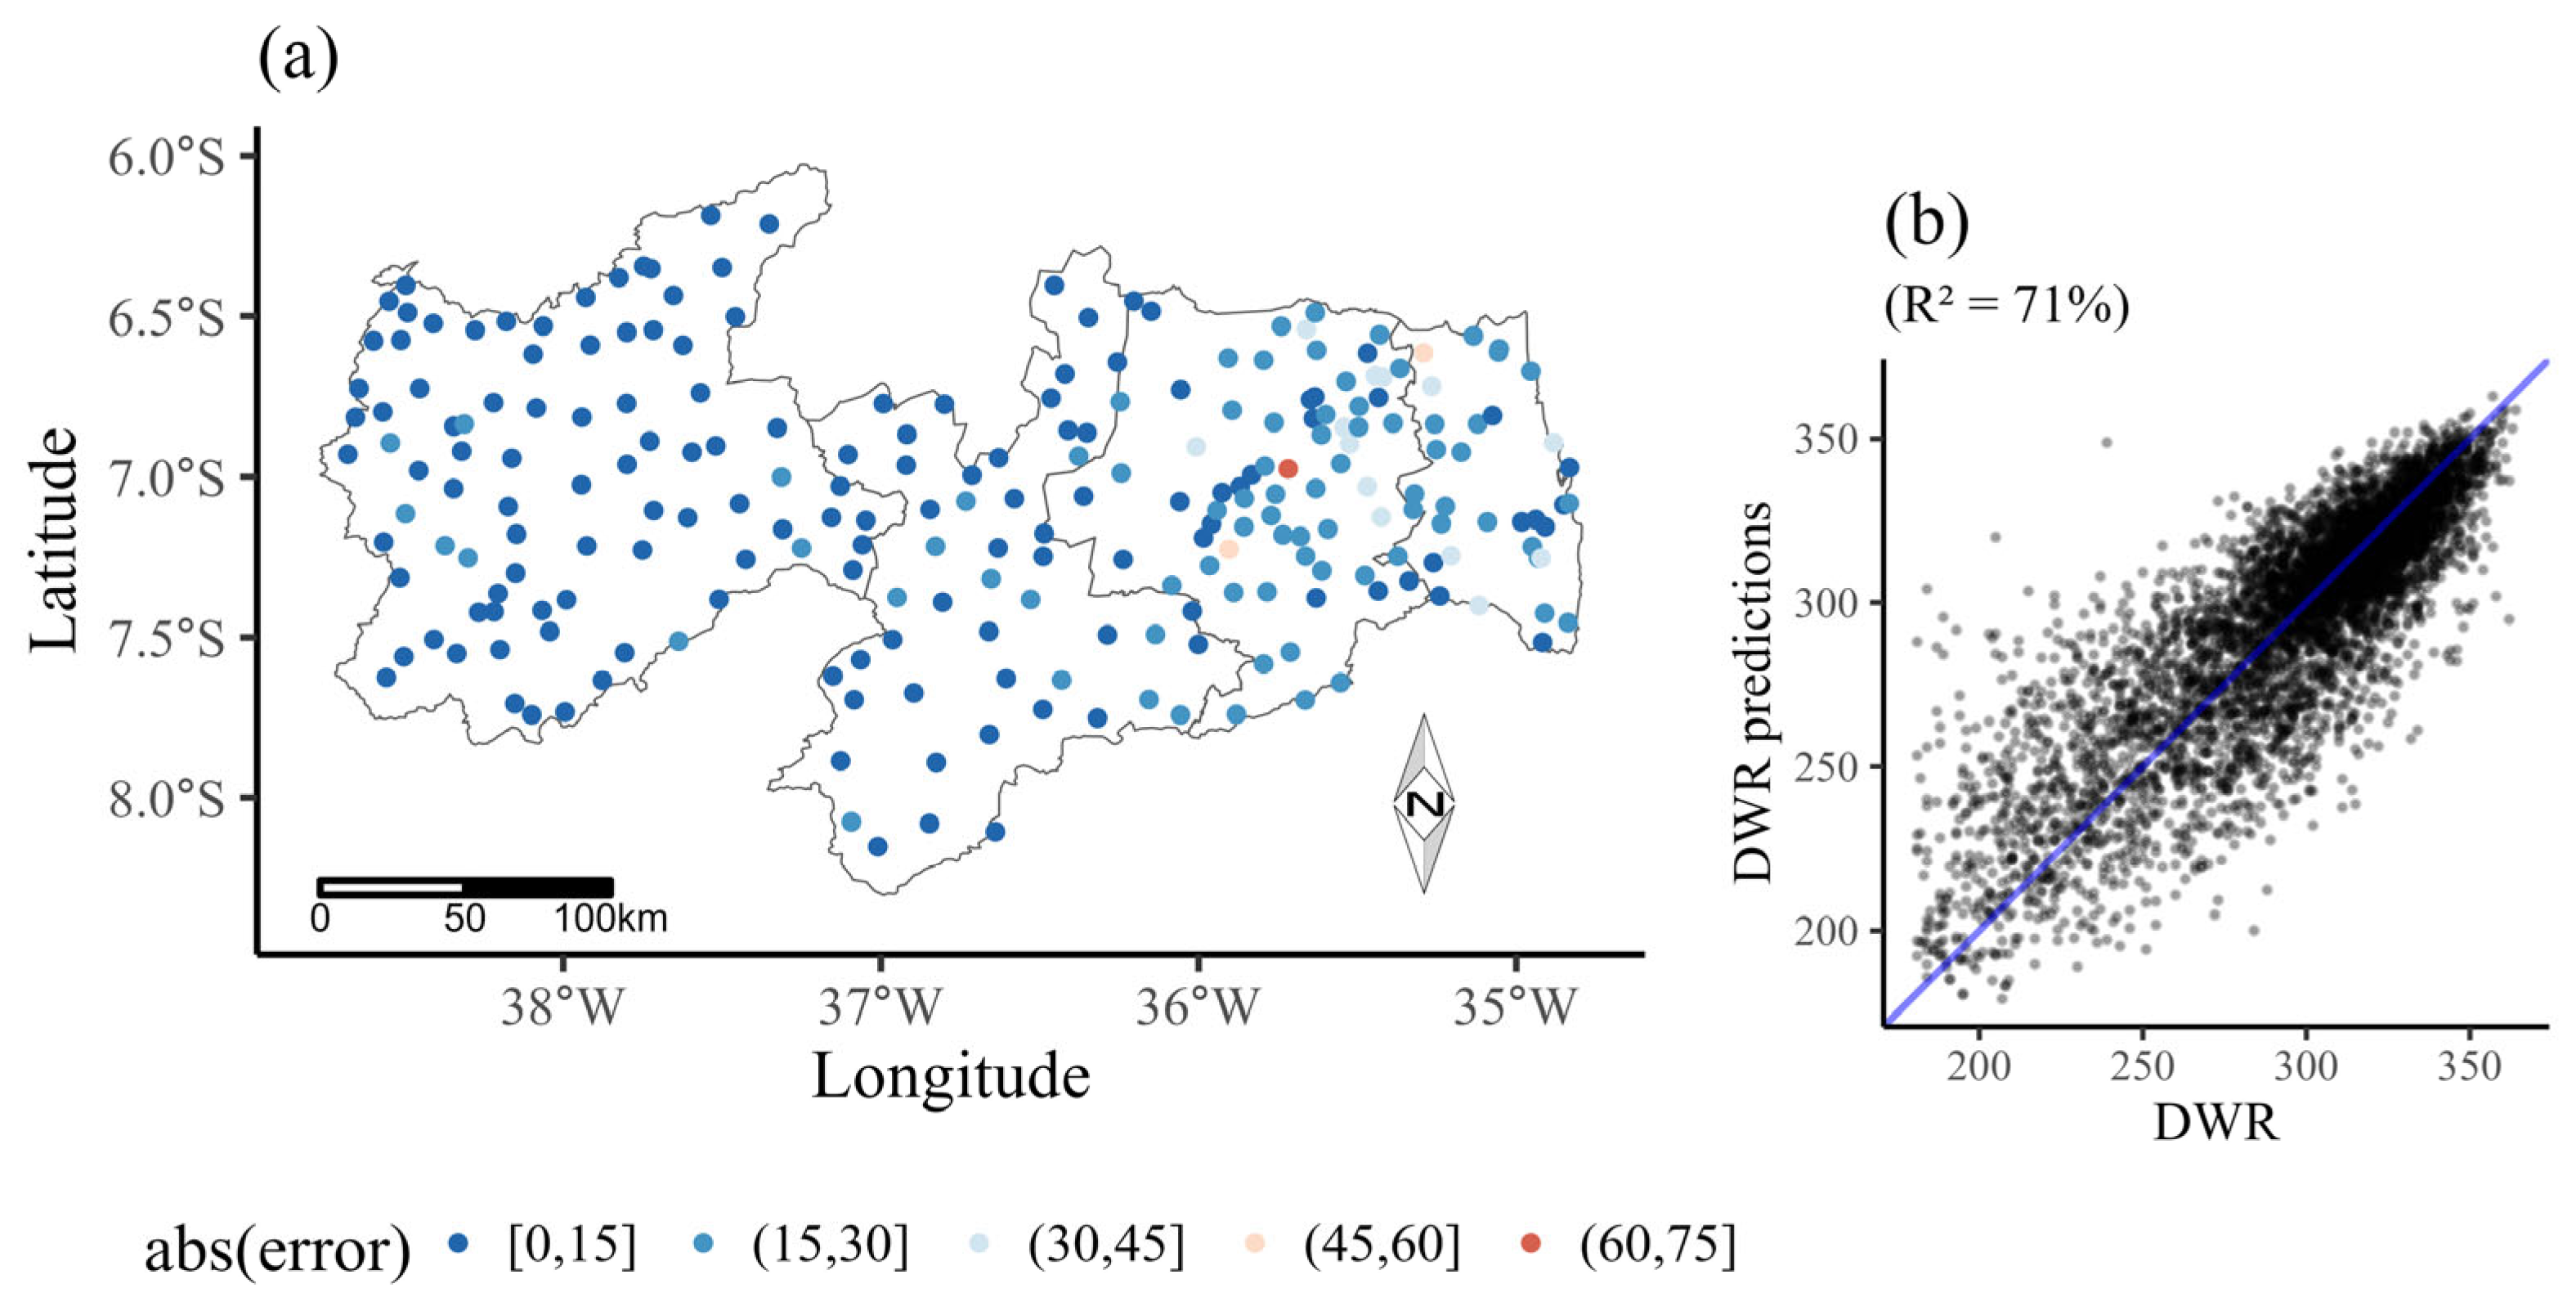
Figure 6 shows the result of the “leave-one-out” cross-validation when space–time kriging is applied to the number of days without rain in the year.
Figure 6a shows that the mean absolute error varied between 0 and 75 days, and Agreste Paraibano had stations that presented the largest and the smallest errors, an expected result due to the high variability of the DWR between the rainfall stations located in this region. In
Figure 6b, we have the scatter plot between the observed and estimated values by space–time kriging, in which we observed a good performance of the method, reaching a coefficient of determination of 71%.
The generalized product-sum theoretical model has been shown to be suitable for modeling indexed phenomena in space–time. Ref. [
18], when using the geostatistical methodology for spatiotemporal modeling of monthly rainfall, found that the generalized product-sum model, with adjustments of the Gaussian model in the temporal and spatial components, presented excellent results, reaching an R
2 of 85% in the “leave-one-out” cross-validation. Research on the space–time distribution of pests and predators in maize production used the generalized product-sum model. However, they only verified the adequacy of this model to the point cloud of the empirical variogram, not using cross-validation to verify the predictive quality of the fit [
28].
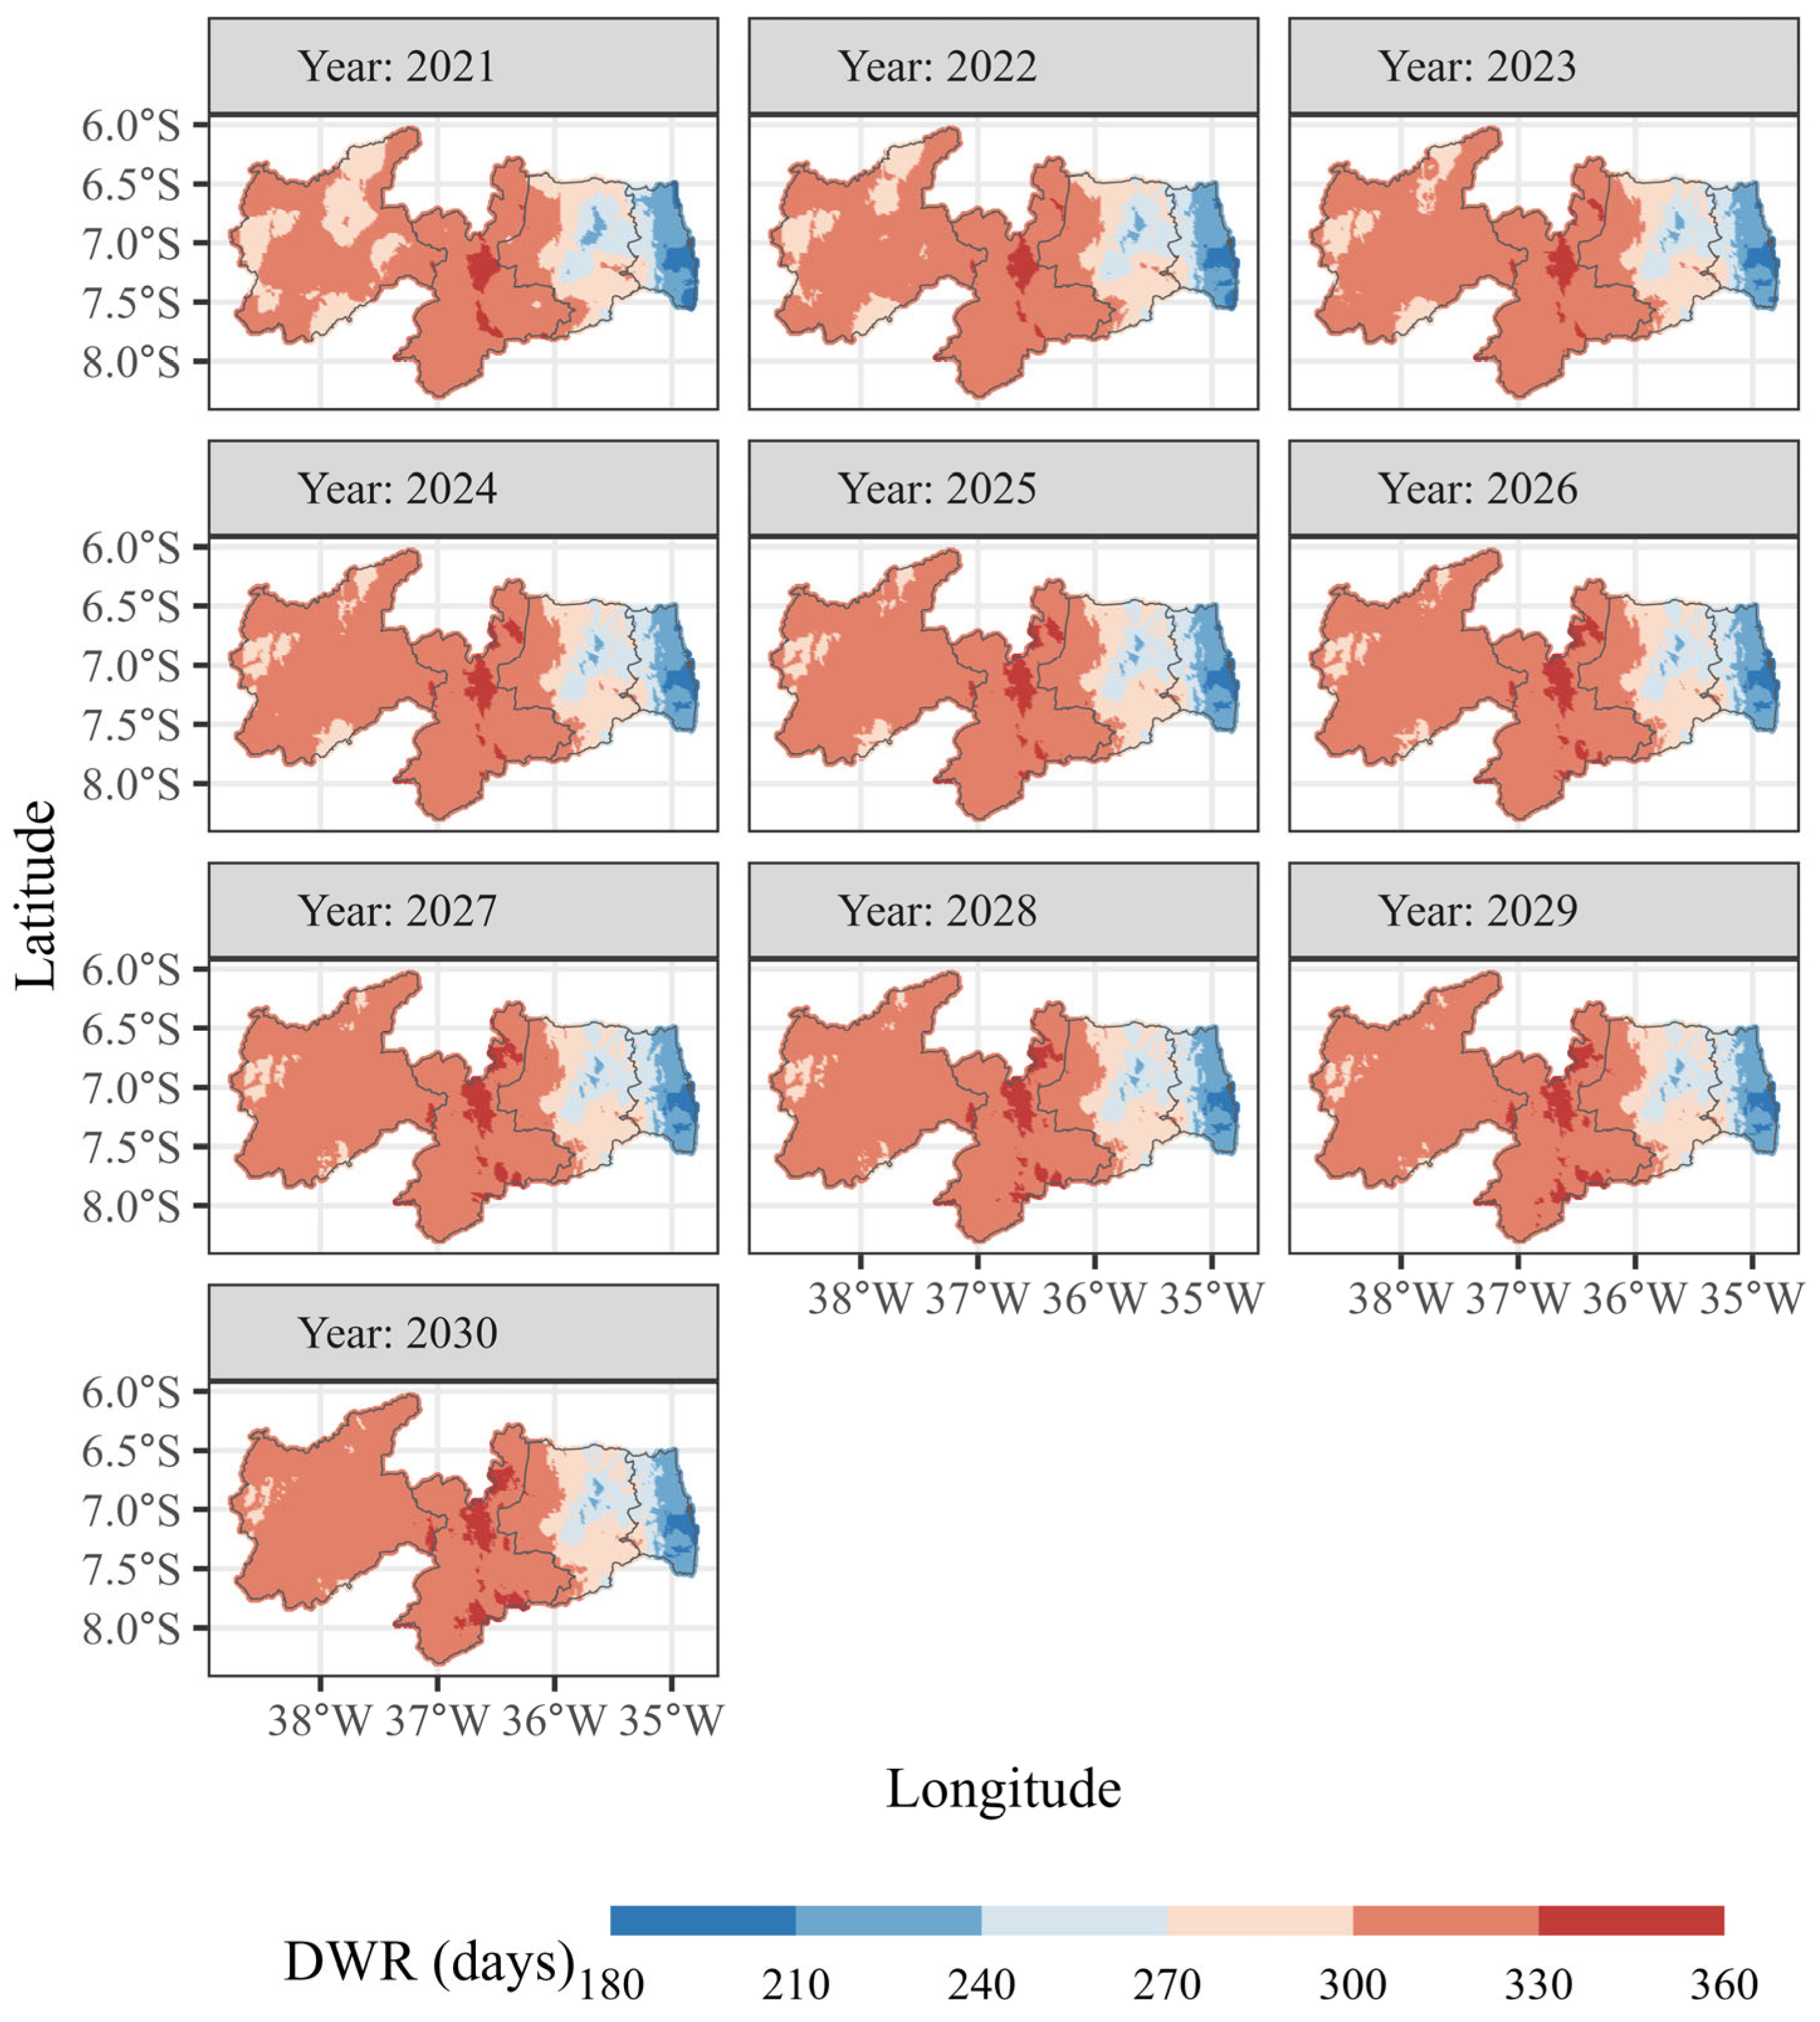
Figure 7 shows the results of the space–time kriging of the DWR from 2021 to 2030. The results indicate an increase in the number of dry days in the coming years in all mesoregions. As expected, the Borborema mesoregion is the one with the highest estimates, followed by the Sertão Paraibano.
Comparing the years 2021 and 2030, it is possible to see that in some areas of Sertão Paraibano, the minimum number of dry days will increase from 270 to 300 days in the year, corresponding to a whole month without rainfall, which can result in unprecedented water scarcity. A study on the quantity, duration and intensity of drought events in Paraíba from 1998 to 2017 showed that the highest and lowest records of these events were for Sertão and Mata Paraibana, respectively [
29].
An important point to be discussed in our research is the fact that we do not model drought rates, but we present estimates for the number of days without rain, which is directly related to drought events. It is known that drought is a phenomenon that is influenced by various physical and biological processes, making it a difficult task to understand [
2,
30]. The difficulty is the very definition of drought and what is the best index to be used for its characterization [
30]. Ref. [
2] presents a discussion on the different indicators used for modeling droughts, showing that these indications must be improved so that they can result in more reliable and accurate estimates. The authors in [
30], similarly, carried out a review of the past–future models used to create drought scenarios, commenting that the climatic changes provoked by the droughts depend, initially, on how this was defined and the use of different statistical indicators becomes a little precise investigation. Thus, it is evident that studies on droughts present weaknesses and open up space for discussions, from its definition to the use of its indexes and statistical methods. However, in our manuscript we emphasized modeling the annual number of days without rain becoming a tool for diagnosis and impact caused by climate change in the region under study and that this should be used as an additional tool for conclusions about droughts in the region.
As previously mentioned, the Borborema region presented the highest estimates of DWR in the year; however, this region presents a great contribution to the water supply in the State of Paraíba. Located in Borborema, the Alto Rio Paraíba Basin has great importance for the water resources of Paraíba since it is responsible for supplying the second largest water reservoir in the state [
31]. Ref. [
32] asserts, based on a historical analysis from 1950 to 2013, that this region of the basin has presented a process of desertification. However, this process has not been directly impacted by the low levels of rainfall but possibly by human activities that have led to soil and vegetation degradation.
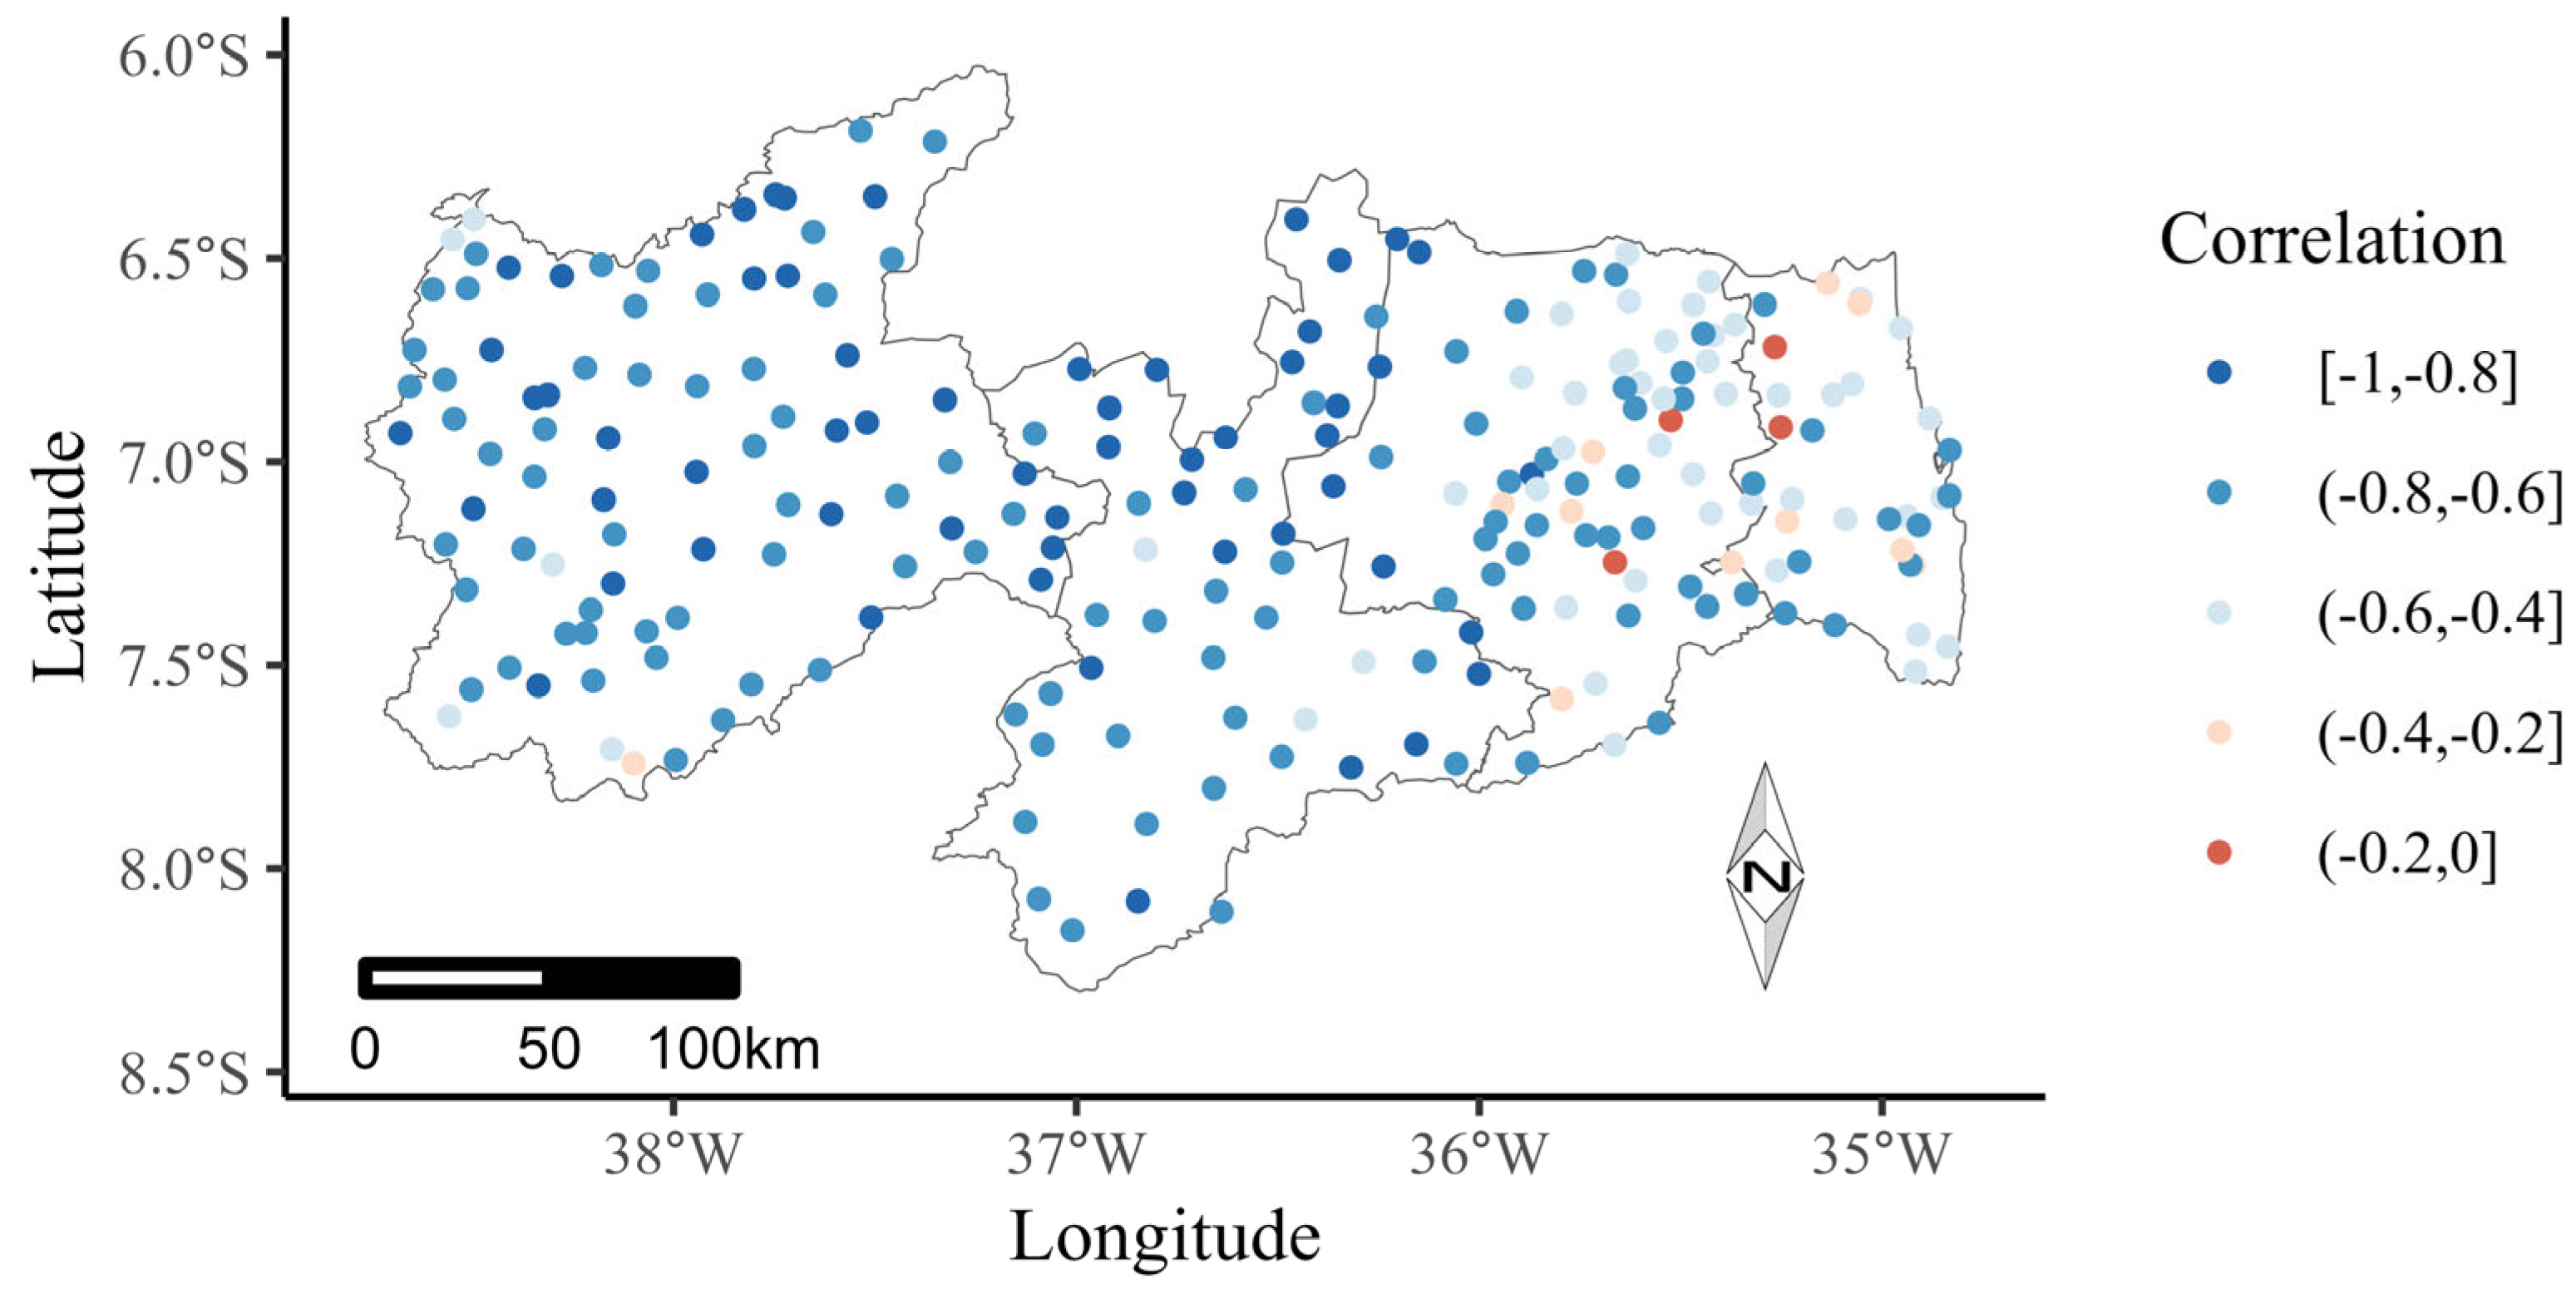
Finally, our study modeled the annual number of dry days. Although a region may have 330 or more dry days a year, we can say nothing about its rainfall levels since in a single day a significant amount can occur. However, DWR estimates are directly related to water availability, making it an additional tool for preventing natural disasters caused by prolonged dry spells. To verify the relationship between DWR and accumulated annual rainfall, a map of correlations between these two variables was proposed (
Figure 8).
As expected, the region showed an inversely proportional relationship between the DWR and the annual accumulated rainfall at the rainfall stations. The highest ratios are found in the Sertão Paraibano and Borborema mesoregions, with a negative coefficient greater than 0.80. However, we have low correlations in the Agreste Paraibano and Mata Paraíba mesoregions, places where we have the highest rainfall volumes and the lowest DWR.
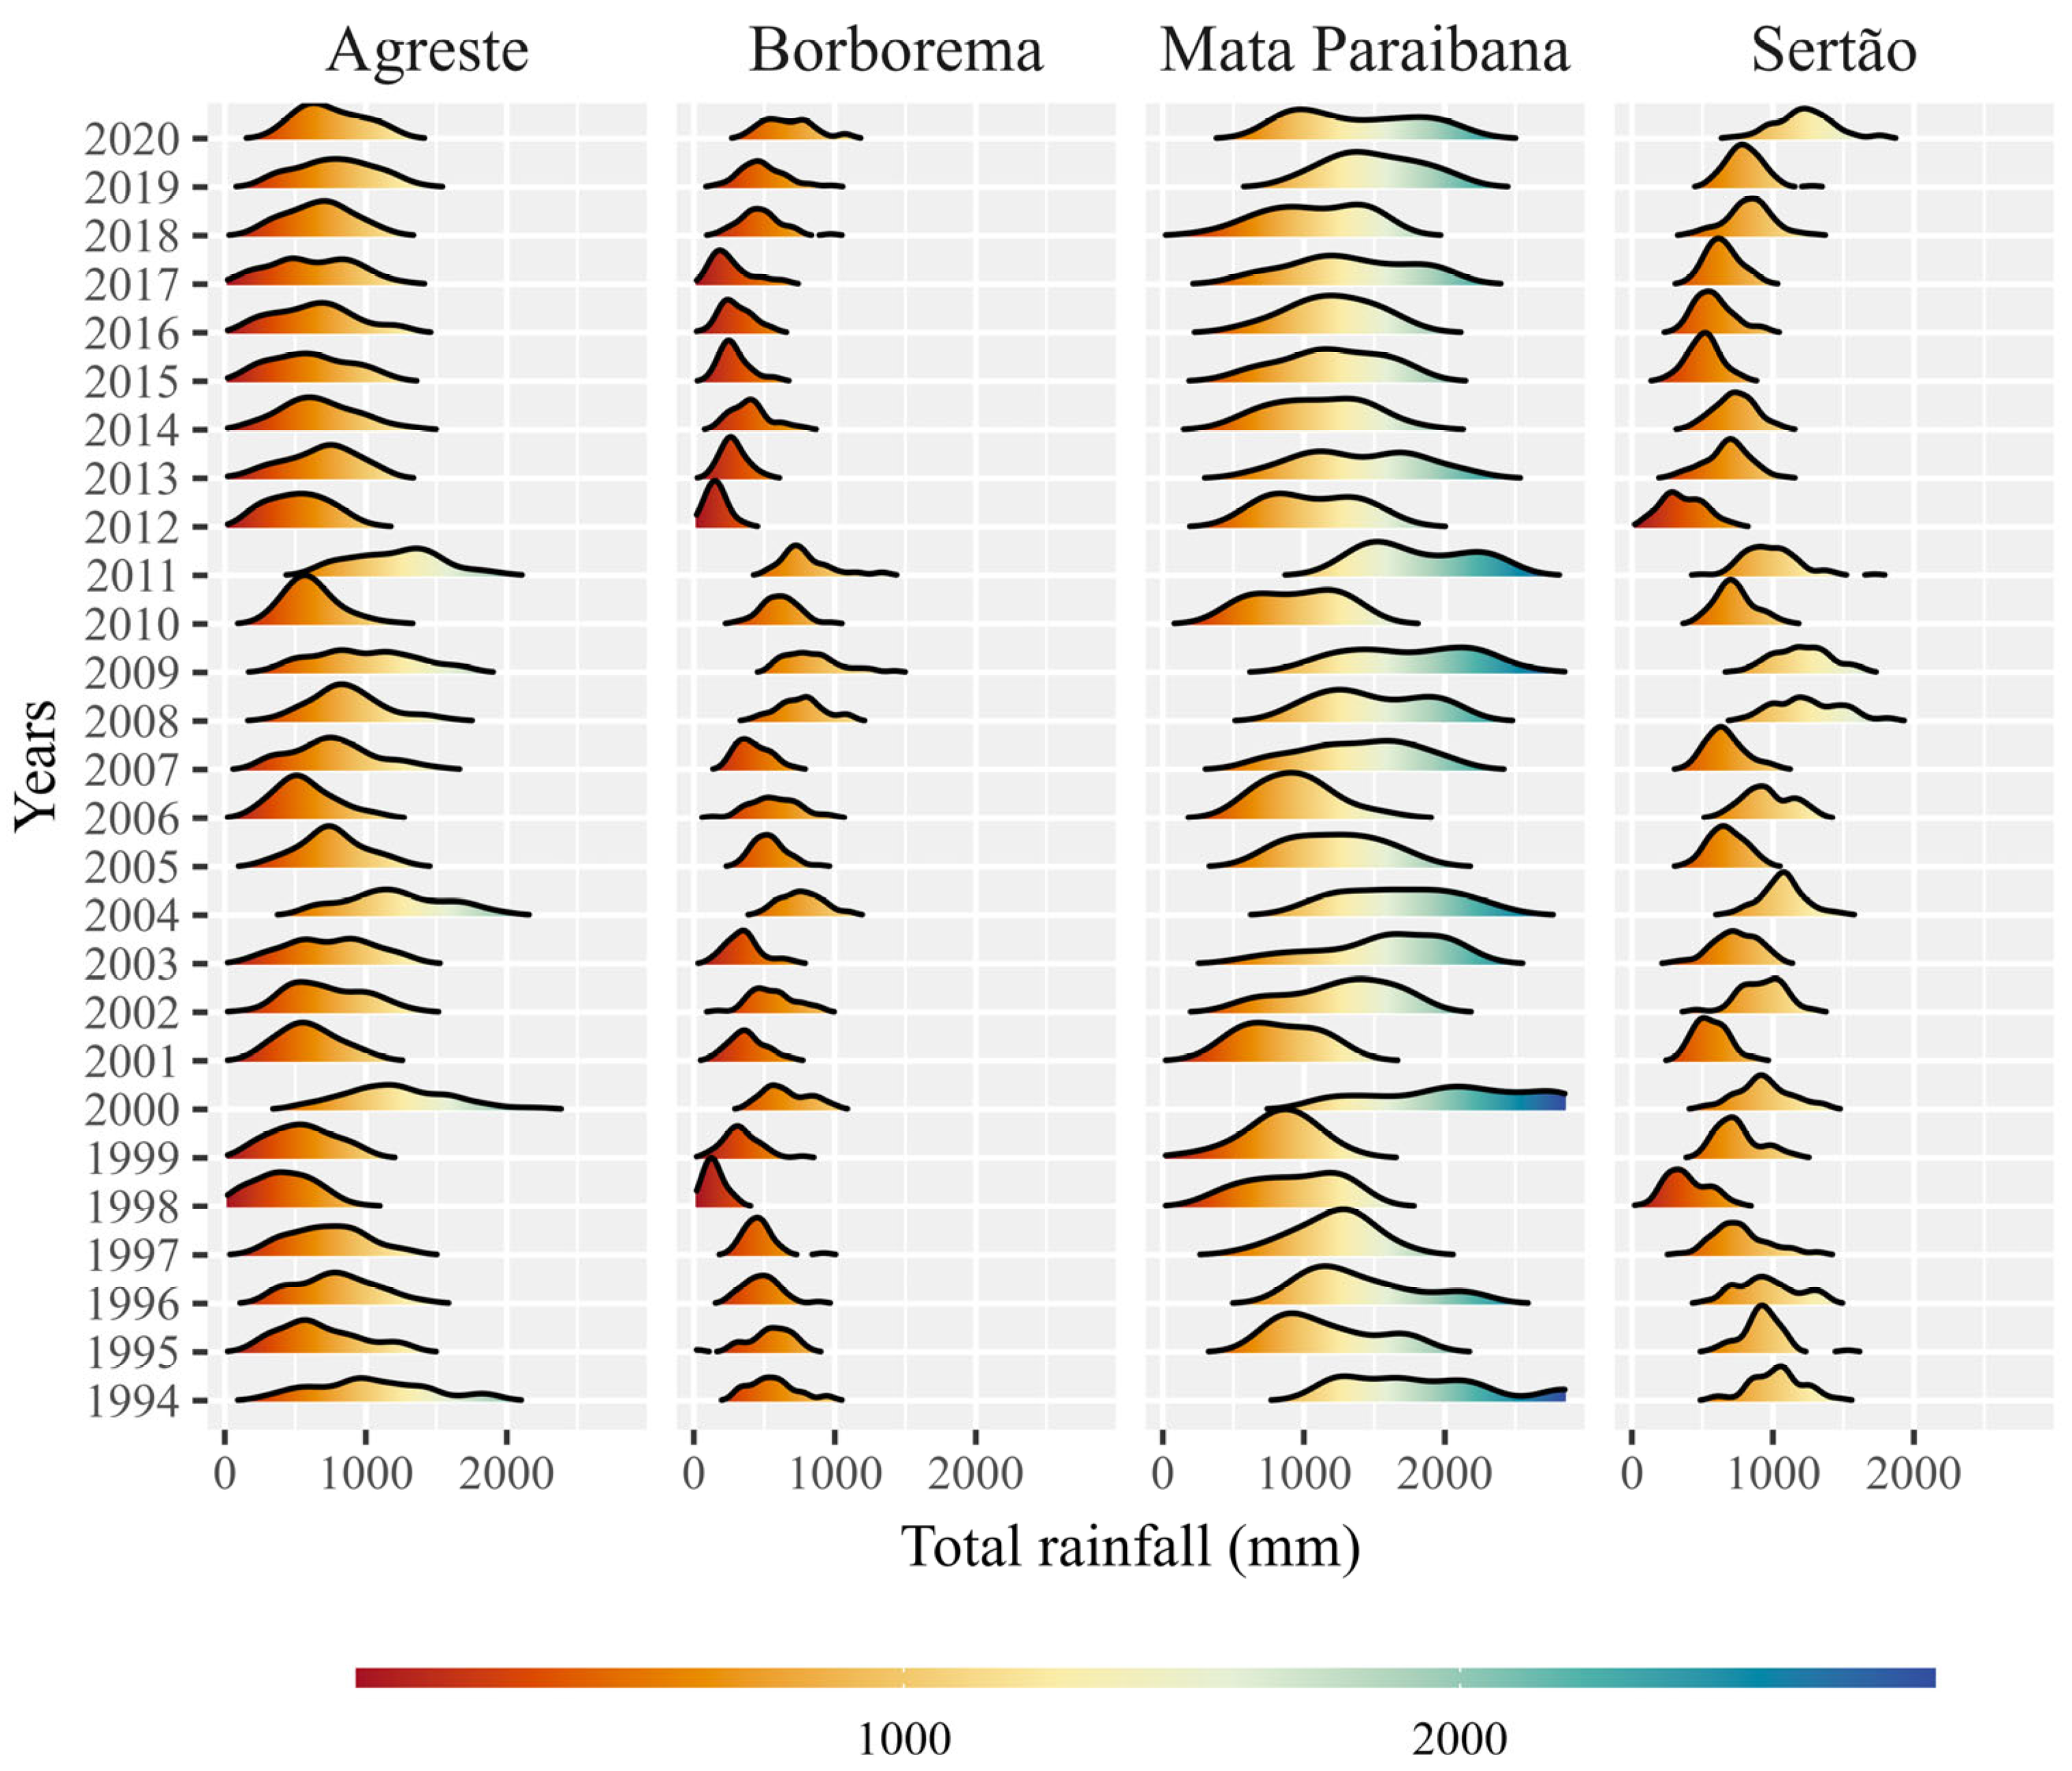
Additionally, the densities of the total annual rainfall in the different mesoregions were constructed (
Figure 9).
In comparison with the density for the DWR (
Figure 3), it is noted in relation to the total annual rainfall. Similar to DWR, the year 2012 presented the lowest levels of total rainfall, with Mata Paraibana and Borborema presenting the highest and lowest distributions of annual rainfall, respectively.


