Next Issue
Volume 11, March
Previous Issue
Volume 11, January


Climate, Volume 11, Issue 2 (February 2023) – 22 articles

Cover Story (view full-size image): 
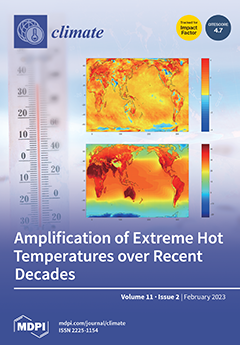
The hottest conditions each year are disproportionately impactful, and therefore, it is particularly important to know how fast they have been warming. This is examined here using reanalysis data from 1959 to 2021 with comparison to station observations. On average, the hottest temperatures have warmed about as much as typical summer temperatures (slightly more over water and less over land), but there are several populated land regions where the hottest temperatures have warmed substantially faster. Possible reasons and follow-up investigations using climate models are outlined. View this paper
  • Issues are regarded as officially published after their release is announced to the table of contents alert mailing list.
  • You may sign up for e-mail alerts to receive table of contents of newly released issues.
  • PDF is the official format for papers published in both, html and pdf forms. To view the papers in pdf format, click on the "PDF Full-text" link, and use the free Adobe Reader to open them.
Order results
Result details
Section
Select all
Export citation of selected articles as:
14 pages, 2910 KiB  
Article
Subseasonal Variation in the Winter ENSO-NAO Relationship and the Modulation of Tropical North Atlantic SST Variability
by Wenjun Zhang and Feng Jiang
Climate 2023, 11(2), 47; https://doi.org/10.3390/cli11020047 - 14 Feb 2023
Cited by 5 | Viewed by 2860
Abstract
The impact of El Niño–Southern Oscillation (ENSO) on the North Atlantic Oscillation (NAO) has been controversially discussed for several decades, which exhibits prominent seasonality and nonstationarity. During early winter, there appears a positive ENSO-NAO relationship, while this relationship reverses its sign in late [...] Read more.
The impact of El Niño–Southern Oscillation (ENSO) on the North Atlantic Oscillation (NAO) has been controversially discussed for several decades, which exhibits prominent seasonality and nonstationarity. During early winter, there appears a positive ENSO-NAO relationship, while this relationship reverses its sign in late winter. Here, we show that this subseasonal variation in the ENSO-NAO relationship could be attributed to the different mechanisms involved in early and late winters. In early winter, the positive linkage between the ENSO and NAO could be simply understood as resulting from the changes in tropical Walker circulation and the associated atmospheric meridional circulation over the North Atlantic. In the following late winter, an opposite NAO-like response appears as the large-scale Pacific–North Atlantic teleconnection pattern fully establishes and evident sea surface temperature anomalies occur over the North Tropical Atlantic (NTA). We further show that the phase shift in NAO during ENSO late winter is largely contributed by the establishment of the ENSO-associated NTA SST anomaly via its excited convection in the subtropical Atlantic. The competing roles of mechanisms explain the subseasonal variation in the ENSO-NAO relationship from early to late winter, providing useful information for seasonal prediction over the North Atlantic–European region. Full article
Show Figures

Figure 1

24 pages, 13859 KiB  
Article
Modelling Drought Risk Using Bivariate Spatial Extremes: Application to the Limpopo Lowveld Region of South Africa
by Murendeni Maurel Nemukula, Caston Sigauke, Hector Chikoore and Alphonce Bere
Climate 2023, 11(2), 46; https://doi.org/10.3390/cli11020046 - 13 Feb 2023
Viewed by 1878
Abstract
Weather and climate extremes such as heat waves, droughts and floods are projected to become more frequent and intense in several regions. There is compelling evidence indicating that changes in climate and its extremes over time influence the living conditions of society and [...] Read more.
Weather and climate extremes such as heat waves, droughts and floods are projected to become more frequent and intense in several regions. There is compelling evidence indicating that changes in climate and its extremes over time influence the living conditions of society and the surrounding environment across the globe. This study applies max-stable models to capture the spatio–temporal extremes with dependence. The objective was to analyse the risk of drought caused by extremely high temperatures and deficient rainfall. Hopkin’s statistic was used to assess the clustering tendency before using the agglomerative method of hierarchical clustering to cluster the study area into n=3 temperature clusters and n=3 precipitation clusters. For the precipitation and temperature data, the values of Hopkin’s statistic were 0.7317 and 0.8446, respectively, which shows that both are significantly clusterable. Various max-stable process models were then fitted to each cluster of each variable, and the Schlather model with several covariance functions was found to be a good fit on both datasets compared to the Smith model with the Gaussian covariance function. The modelling approach presented in this paper could be useful to hydrologists, meteorologists and climatologists, including decision-makers in the agricultural sector, in enhancing their understanding of the behaviour of drought caused by extremely high temperatures and low rainfall. The modelling of these compound extremes could also assist in assessing the impact of climate change. It can be seen from this study that the size, including the topography of the location (cluster/region), provides important information about the strength of the extremal dependence. Full article
(This article belongs to the Special Issue Climate and Weather Extremes: Volume II)
Show Figures

Figure 1

20 pages, 4295 KiB  
Article
Long-Term Seasonal Drought Trends in the China-Pakistan Economic Corridor
by Sherly Shelton and Ross D. Dixon
Climate 2023, 11(2), 45; https://doi.org/10.3390/cli11020045 - 12 Feb 2023
Cited by 6 | Viewed by 3170
Abstract
In recent years, drought events have influenced agriculture, water-dependent industries, and energy supply in many parts of the world. The China–Pakistan Economic Corridor (CPEC) is particularly susceptible to drought events due to large-scale monsoon circulation anomalies. Using the 0.5 × 0.5 resolution rainfall [...] Read more.
In recent years, drought events have influenced agriculture, water-dependent industries, and energy supply in many parts of the world. The China–Pakistan Economic Corridor (CPEC) is particularly susceptible to drought events due to large-scale monsoon circulation anomalies. Using the 0.5 × 0.5 resolution rainfall and potential evapotranspiration data set from the Climatic Research Unit (CRU), we assessed the changes in seasonal drought variation and effects of climate variables on drought over the CPEC for the period of 1980 to 2018 using the Standardized Precipitation Evapotranspiration Index (SPEI). Our results show a statistically significant negative trend of SPEI over the hyper-arid region for two monsoons (December–February and June–September) and intra-monsoonal seasons (March–May and October–November), suggesting that the hyper-arid region (southern and southwestern part of the CPEC) is experiencing more frequent drought. A high probability for the occurrence of winter (30–35%) and summer (20–25%) droughts are observed in hyper-arid regions and gradually decreases from south to north of the CPEC. Decreasing seasonal rainfall and increasing potential evapotranspiration with increasing temperature in hyper-arid and arid regions resulted in frequent drought events during the winter monsoon season (from December to February). The findings from this study provide a theoretical basis for the drought management of the CPEC and a framework for understanding changes in drought in this region from climate projections. Full article
(This article belongs to the Special Issue Coping with Flooding and Drought)
Show Figures

Figure 1

14 pages, 7145 KiB  
Article
A Comparison of Wave Spectra during Pre-Monsoon and Post-Monsoon Tropical Cyclones under an Intense Positive IOD Year 2019
by Mourani Sinha, Somnath Jha and Anupam Kumar
Climate 2023, 11(2), 44; https://doi.org/10.3390/cli11020044 - 12 Feb 2023
Cited by 1 | Viewed by 1855
Abstract
The impact of Indian Ocean Dipole (IOD) events on the generation and intensity of tropical cyclones under the influence of monsoons is explored. The standardized sea surface temperature (SST) anomalies are computed for the pre-monsoon and post-monsoon months for the Bay of Bengal [...] Read more.
The impact of Indian Ocean Dipole (IOD) events on the generation and intensity of tropical cyclones under the influence of monsoons is explored. The standardized sea surface temperature (SST) anomalies are computed for the pre-monsoon and post-monsoon months for the Bay of Bengal (BOB) and Arabian Sea (AS) from 1971 to 2020 and relationships are analyzed with the frequency of tropical cyclones for the neutral, positive and negative IOD years. Ocean states are sensitive to cyclonic conditions exhibiting a complex spectral distribution of the wave energy. Due to a tropical cyclone, the surface waves remain under high wind forcing conditions for prolonged periods generating a huge amount of energy. The spectral wave model SWAN (Simulating WAves Nearshore) is used to generate the energy density spectra during FANI (26 April–5 May 2019), which was a pre-monsoon extreme severe cyclonic storm, and BULBUL (5–12 November 2019), which was a post-monsoon very severe cyclonic storm in the BOB region. This study aims to estimate the intensity of wave energy during tropical cyclones in the pre- and post-monsoon months for 2019 (an extremely positive IOD year). Full article
(This article belongs to the Special Issue Subseasonal to Seasonal Climate Forecasting)
Show Figures

Figure 1

11 pages, 253 KiB  
Article
Ten Lessons for Effective Place-Based Climate Adaptation Planning Workshops
by Marc J. Stern, Kristin F. Hurst, Jennifer J. Brousseau, Caleb O’Brien and Lara J. Hansen
Climate 2023, 11(2), 43; https://doi.org/10.3390/cli11020043 - 10 Feb 2023
Cited by 3 | Viewed by 1905
Abstract
Community efforts to consider climate change within local planning processes are increasingly common. Place-based climate adaptation workshops are commonly employed tools within these larger processes. The research, to date, on these phenomena has yielded mixed results, and the empirical evidence regarding what makes [...] Read more.
Community efforts to consider climate change within local planning processes are increasingly common. Place-based climate adaptation workshops are commonly employed tools within these larger processes. The research, to date, on these phenomena has yielded mixed results, and the empirical evidence regarding what makes these workshops more or less effective has been mostly based on small samples in disparate contexts. In an effort to seek consensus regarding what factors lead to effective workshop outcomes, including participant learning and the motivation to take action; improved adaptation planning processes and implementation; and the development or strengthening of positive relationships between the participants, twenty-two experienced climate adaptation workshop facilitators participated in a Delphi study involving iterative surveys followed by focus groups. In this short report, we present a synthesis of consensus-based recommendations resulting from the Delphi study for enhancing place-based climate adaptation workshop outcomes. These recommendations address recruitment; fitting the local context; adequately preparing the participants; clarifying the objectives; facilitation strategies; promoting local leadership, efficacy and accountability; and providing post-workshop support. We discuss the role of these strategies in developing feelings of collective efficacy, local leadership and accountability through social learning. Full article
(This article belongs to the Collection Adaptation and Mitigation Practices and Frameworks)
13 pages, 2913 KiB  
Article
Amplification of Extreme Hot Temperatures over Recent Decades
by Nir Y. Krakauer
Climate 2023, 11(2), 42; https://doi.org/10.3390/cli11020042 - 10 Feb 2023
Viewed by 2081
Abstract
While global warming is mostly conceptualized in terms of increases in mean temperature, changes in the most extreme conditions encountered often have disproportionate impacts. Here, a measure of warming amplification is defined as the change in the highest yearly temperature (denoted TXx), representing [...] Read more.
While global warming is mostly conceptualized in terms of increases in mean temperature, changes in the most extreme conditions encountered often have disproportionate impacts. Here, a measure of warming amplification is defined as the change in the highest yearly temperature (denoted TXx), representing extreme heat, minus that in the 80th percentile daily high temperature (Tmax80), which represents typical summer conditions. Based on the ERA5 reanalysis, over 1959–2021, warming of TXx averaged 1.56 K over land areas, whereas warming of Tmax80 averaged 1.60 K. However, the population-weighted mean warming of TXx significantly exceeded warming of Tmax80 (implying positive amplification) over Africa, South America, and Oceania. Where available, station temperature observations generally showed similar trends to ERA5. These findings provide a new target for climate model calibration and insight for evaluating the changing risk of temperature extremes. Full article
(This article belongs to the Special Issue Climate and Weather Extremes: Volume II)
Show Figures

Figure 1

19 pages, 7496 KiB  
Article
Comparison of Flood Frequency at Different Climatic Scenarios in Forested Coastal Watersheds
by Shreeya Bhattarai, Prem B. Parajuli and Filip To
Climate 2023, 11(2), 41; https://doi.org/10.3390/cli11020041 - 09 Feb 2023
Cited by 3 | Viewed by 1821
Abstract
Climate change-induced extreme precipitation causes coastal flooding. A streamflow simulation in coastal watersheds, Wolf River Watershed (WRW) and Jourdan River Watershed (JRW), was conducted using the Soil and Water Assessment Tool (SWAT) to compare variation in flow at different climates and to analyze [...] Read more.
Climate change-induced extreme precipitation causes coastal flooding. A streamflow simulation in coastal watersheds, Wolf River Watershed (WRW) and Jourdan River Watershed (JRW), was conducted using the Soil and Water Assessment Tool (SWAT) to compare variation in flow at different climates and to analyze the flood frequency. Baseline models were auto-calibrated with SWAT calibration and uncertainty programs (SWAT-CUP). Kling–Gupta efficiency (KGE), defined as the objective function in SWAT-CUP, ranged from 0.8 to 0.7 in WRW and from 0.55 to 0.68 in JRW during the calibration–validation process. Results indicated reliability of the model performances. Monthly averaged baseline flow was 1% greater than historical and 8.9% lower than future climate in WRW. In JRW, monthly averaged baseline flow was 11% greater than historical and 5.7% lower than future climate. Flood frequency analysis showed the highest 1% exceedance probability in annual maximum series (AMS) of baseline model in WRW, whereas AMS of projected model was estimated the highest in JRW. This study aids in preparing for future flood management. Full article
Show Figures

Figure 1

19 pages, 658 KiB  
Article
Climate-Related Co-Benefits and the Case of Swedish Policy
by Mikael Karlsson, Nils Westling and Oskar Lindgren
Climate 2023, 11(2), 40; https://doi.org/10.3390/cli11020040 - 09 Feb 2023
Viewed by 2260
Abstract
There is strong scientific evidence for the existence of the significant economic value of several climate-related co-benefits. However, these are seldom recognised in policy-making, and knowledge is still scarce on some co-benefit types and categories. To identify research needs and highlight policy-making opportunities, [...] Read more.
There is strong scientific evidence for the existence of the significant economic value of several climate-related co-benefits. However, these are seldom recognised in policy-making, and knowledge is still scarce on some co-benefit types and categories. To identify research needs and highlight policy-making opportunities, we propose a new framework and three-type-taxonomy of climate-related co-benefits. We define climate policy co-benefits, such as improved air quality, as ‘Type 1’; co-benefits for climate objectives from policy-making in other fields, such as taxation, as ‘Type 2’; and co-benefits from policies designed to achieve multiple objectives as ‘Type 3’. In order to apply the framework and to analyse how co-benefits have been regarded in policy-making in a climate pioneering country, we also explore the case of Sweden. It is shown that several co-benefits exist, but that these are overlooked almost entirely in policy-making, constituting a bias against climate mitigation. In order to counteract this problem, the article presents a number of recommendations, including a call to researchers to identify and quantify additional co-benefits and to policy-makers on governance reforms, including the need to organise policy-making processes and set decision criteria that promote the consideration of co-benefits. Full article
(This article belongs to the Section Policy, Governance, and Social Equity)
Show Figures

Figure 1

20 pages, 6731 KiB  
Article
Flood Resilience Assessment and Mapping: A Case Study from Australia’s Hawkesbury-Nepean Catchment
by Imogen Schwarz, Mark Ziegelaar, Matthew Kelly, Andrew B. Watkins and Yuriy Kuleshov
Climate 2023, 11(2), 39; https://doi.org/10.3390/cli11020039 - 07 Feb 2023
Cited by 1 | Viewed by 2373
Abstract
Floods are the most common and costliest natural hazard in Australia. However, the Flood Resilience Assessments (FReAs) employed to manage them lack a focus on adaptive capacity and tend not to be incorporated into established flood risk frameworks. This leaves potential for Australian [...] Read more.
Floods are the most common and costliest natural hazard in Australia. However, the Flood Resilience Assessments (FReAs) employed to manage them lack a focus on adaptive capacity and tend not to be incorporated into established flood risk frameworks. This leaves potential for Australian FReAs to make better use of a methodology which holistically incorporates more accurate flood resilience characterisations into flood risk frameworks. In this study, a FReA and mapping for the Hawkesbury-Nepean Catchment (HNC), a flood-prone region in Australia, were conducted. Nine flood resilience indicators were selected to derive the Flood Resilience Index (FReI). Results demonstrated that Statistical Areas Level 2 (SA2s) on or near the floodplain, located near the eastern border of the HNC, present moderate to very high levels of resilience due to increased socio-economic development and urbanisation in the region. Ultimately, this novel FReI can contribute to knowledge bolstering flood resilience in the HNC, as well as assist in flood risk reduction. Additionally, the developed scalable and replicable methodology can be applied to other flood-prone regions of Australia. Full article
Show Figures

Figure 1

22 pages, 6185 KiB  
Article
Heatwave Variability and Structure in South Africa during Summer Drought
by Innocent L. Mbokodo, Mary-Jane M. Bopape, Thando Ndarana, Sifiso M. S. Mbatha, Tshimbiluni P. Muofhe, Mukovhe V. Singo, Nkosinathi G. Xulu, Tumelo Mohomi, Kingsley K. Ayisi and Hector Chikoore
Climate 2023, 11(2), 38; https://doi.org/10.3390/cli11020038 - 05 Feb 2023
Cited by 6 | Viewed by 5746
Abstract
Pronounced subsidence leading to summer drought over southern Africa causes warmer than average surface air temperatures or even heatwave (HW) conditions. We investigated the occurrence of HWs during the summer drought over South Africa based on station data and the ECMWF ERA5 reanalyses. [...] Read more.
Pronounced subsidence leading to summer drought over southern Africa causes warmer than average surface air temperatures or even heatwave (HW) conditions. We investigated the occurrence of HWs during the summer drought over South Africa based on station data and the ECMWF ERA5 reanalyses. Temperature observations from the South African Weather Service were analyzed for seasonality and long-term trends (1981–2020) as background to the occurrence and variability of HWs. We focused on three severe El Niño Southern Oscillation (ENSO)-induced drought seasons, i.e., 1982/83, 1991/92, and 2015/16, to investigate HW characteristics. While 1997/98 was among the strongest El Niño seasons, the impacts were not as severe because it coincided with an intense Angola low, which allowed for rain-bearing cloud bands to form. Results showed that the hottest months were spread across the austral summer season from December to February. Regions experiencing high mean maximum temperatures and high HW frequencies exhibited a strong ENSO signal, with record HWs occurring during 2015/16. The establishment and persistence of a middle-level high-pressure system over Botswana/Namibia (Botswana High) appears to trigger the longest-lasting HWs during drought seasons. The Botswana high is usually coupled with a near-surface continental heat low and/or tropical warm air advection towards the affected region. It was also found that intense ENSO-induced drought events coincided with high HW frequency over South Africa, such as during 1982/83, 1991/92, and the recent 2015/16 events. The results of this study contribute to understanding drought and heat wave dynamics in a region experiencing rapid warming as a result of climate change. Full article
Show Figures

Figure 1

23 pages, 3181 KiB  
Article
Macro-Regional Strategies, Climate Policies and Regional Climatic Governance in the Alps
by Valentina Cattivelli
Climate 2023, 11(2), 37; https://doi.org/10.3390/cli11020037 - 03 Feb 2023
Cited by 2 | Viewed by 1949
Abstract
This paper describes the macro-regional governance framework behind the climate adaptation policies that are currently in place in the Alpine area. Through this discussion, it specifically considers the implications of the regional governance of South Tyrol and Lombardy as case studies. Despite rising [...] Read more.
This paper describes the macro-regional governance framework behind the climate adaptation policies that are currently in place in the Alpine area. Through this discussion, it specifically considers the implications of the regional governance of South Tyrol and Lombardy as case studies. Despite rising concern at the European level, there are still no specific guidelines in place for climate change governance at the macro-regional level. Macro-regions encompass multiple regions that have certain shared morphological characteristics. To address climate changes that occur here, they adopt optional larger-scale strategies without adequately considering territorial and governmental specificities at the regional level. Each individual region adopts specific climate adaptation strategies to deal with the challenges of the territories they govern, without considering the effects on their neighbours, decentralises climate policies to the lowest tiers of government, and encourages participation from individuals and non-governmental organisations. The Alpine macro-region is governed by three separate international/transnational institutions at the macro-regional level and is subject to different regulations from each of the 48 regions/autonomous provinces. One of these regions is Lombardy, which is particularly exposed to the effects of climate change due to having the highest values for land consumption and pollution in Italy. From the administrative point of view, it is an ordinary region, which means that it has the same legislative competences of the other Italian regions. South Tyrol is entirely mountainous. Being an autonomous province, it benefits from greater legislative autonomy than ordinary regions. Based on documental analysis of climate adaptation strategies, findings demonstrate that the preferred governance structure involves the presence of a coordinating institution (such as the province in South Tyrol or the region in Lombardy) that decides climate action, along with several other local institutions and stakeholders that have less decision-making power. Its preferred mechanism for addressing specific climate challenges is the definition of specific regulations and the draft of regional and mono-sectoral plans. These regulations do not relate strongly to wider-scale strategies at the macro-regional level, but are inspired by their principles and priorities. At both definition and implementation levels, the participation of local organisations is limited and not incentivised. Administratively, South Tyrol enjoys greater autonomy, whereas Lombardy must comply more closely with state regulations that limit its decision-making freedom. Full article
(This article belongs to the Special Issue Regional Special Issue: Climate Change in Italy)
Show Figures

Figure 1

13 pages, 1749 KiB  
Article
Hydrometeorological Conditions of the Volga Flow Generation into the Caspian Sea during the Last Glacial Maximum
by Andrey Kalugin and Polina Morozova
Climate 2023, 11(2), 36; https://doi.org/10.3390/cli11020036 - 02 Feb 2023
Cited by 1 | Viewed by 2041
Abstract
The goal of this study is to evaluate annual and seasonal inflow from the Volga catchment area to the Caspian Sea during the Last Glacial Maximum (LGM ~21,000 years ago) using paleoclimate modeling data. The first approach is based on the LGM simulation [...] Read more.
The goal of this study is to evaluate annual and seasonal inflow from the Volga catchment area to the Caspian Sea during the Last Glacial Maximum (LGM ~21,000 years ago) using paleoclimate modeling data. The first approach is based on the LGM simulation by the general circulation models (GCMs) in the framework of the Paleoclimate Modelling Intercomparison Project (PMIP4) and the Coupled Modelling Intercomparison Project (CMIP6). We used four GCMs: INM-CM4-8, MIROC-ES2L, AWI-ESM1-1-LR, and MPI-ESM1-2-LR. The second approach is based on the spatially distributed process-based runoff generation model using PMIP4-CMIP6 model data as boundary conditions. The use of the hydrological ECOMAG model allows us to refine estimates of the Volga runoff in comparison to GCM calculations by considering seasonal features of runoff generation related to periglacial vegetation distribution, permafrost, and streamflow transformation along the channel network. The LGM is characterized by a high uncertainty in meteorological values calculated for the Volga basin using various GCMs. The share of runoff from the three most flooded months from the annual calculated in the LGM was 95%, according to INM-CM4-8, while other GCMs ranged from 69–78%. Three GCMs (MIROC-ES2L, AWI-ESM1-1-LR, and MPI-ESM1-2-LR) showed 83–88% of the present-day value of precipitation in the Volga basin during cooling for more than 10 °C, while INM-CM4-8 showed a two-fold decrease. According to hydrological modeling results using data from three models, the annual Volga runoff was significantly higher than the present-day value, and, when using data from INM-CM4-8, it was lower. Full article
(This article belongs to the Special Issue Responses of the Water Cycle to Changing Climate)
Show Figures

Figure 1

22 pages, 8714 KiB  
Article
Recent Warming Trends in the Arabian Sea: Causative Factors and Physical Mechanisms
by Jiya Albert, Venkata Sai Gulakaram, Naresh Krishna Vissa, Prasad K. Bhaskaran and Mihir K. Dash
Climate 2023, 11(2), 35; https://doi.org/10.3390/cli11020035 - 29 Jan 2023
Cited by 8 | Viewed by 3334
Abstract
In recent years, and particularly from 2000 onwards, the North Indian Ocean (NIO) has been acting as a major sink of ocean heat that is clearly visible in the sub-surface warming trend. Interestingly, a part of the NIO—the Arabian Sea (AS) sector—witnessed dramatic [...] Read more.
In recent years, and particularly from 2000 onwards, the North Indian Ocean (NIO) has been acting as a major sink of ocean heat that is clearly visible in the sub-surface warming trend. Interestingly, a part of the NIO—the Arabian Sea (AS) sector—witnessed dramatic variations in recent sub-surface warming that has direct repercussion on intense Tropical Cyclone (TC) activity. This study investigated the possible causative factors and physical mechanisms towards the multi-decadal warming trends in surface and sub-surface waters over the AS region. Responsible factors towards warming are examined using altimetric observations and reanalysis products. This study used ORAS5 OHC (Ocean Heat Content), derived meridional and zonal heat transport, currents, temperature, salinity, Outgoing Longwave Radiation (OLR), and air-sea fluxes to quantify the OHC build-up and its variability at water depths of 700 m (D700) and 300 m (D300) during the past four decades. The highest variability in deeper and upper OHC is noticed for the western and southern regions of the Indian Ocean. The warming trend is significantly higher in the deeper regions of AS compared to the upper waters, and relatively higher compared to the Bay of Bengal (BoB). Increased OHC in AS show good correlation with decreased OLR in the past 20 years. An analysis of altimetric observations revealed strengthening of downwelling Kelvin wave propagation leading to warming in eastern AS, mainly attributed due to intrusion of low saline water from BoB leading to stratification. Rossby wave associated with deepening of thermocline warmed the southern AS during its propagation. Heat budget analysis reveals that surface heat fluxes play a dominant role in warming AS during the pre-monsoon season. Increasing (decreasing) trend of surface heat fluxes (vertical entrainment) during 2000–2018 played a significant role in warming the southeastern sector of AS. Full article
(This article belongs to the Special Issue Subseasonal to Seasonal Climate Forecasting)
Show Figures

Figure 1

16 pages, 3508 KiB  
Article
Efficiency of the NWC SAF Version 2021 CRRPh Precipitation Product: Comparison against Previous NWC SAF Precipitation Products and the Influence of Topography
by Athanasios Karagiannidis, José Alberto Lahuerta, Xavier Calbet, Llorenç Lliso, Konstantinos Lagouvardos, Vassiliki Kotroni and Pilar Ripodas
Climate 2023, 11(2), 34; https://doi.org/10.3390/cli11020034 - 25 Jan 2023
Cited by 1 | Viewed by 1277
Abstract
The algorithm of the Convective Rainfall Rate with Microphysical Properties (CRRPh) product of the 2021 version of the Nowcasting and Very Short Range Forecasting Satellite Application Facility (NWC SAF) presents innovative characteristics. It was developed employing principal components analysis to reduce the number [...] Read more.
The algorithm of the Convective Rainfall Rate with Microphysical Properties (CRRPh) product of the 2021 version of the Nowcasting and Very Short Range Forecasting Satellite Application Facility (NWC SAF) presents innovative characteristics. It was developed employing principal components analysis to reduce the number of utilized parameters and uses the same mathematical scheme for day and night, simulating the missing visual channels and satellite-derived cloud water path information that is unavailable during nighttime. Applying adequate statistical methodologies and scores and using rain gauge data as ground truth, it is shown that the new algorithm appears to be significantly improved compared to its predecessors in regard to the delineation of the precipitation areas. In addition, it minimizes the day–night difference in the estimation efficiency, which is a remarkable achievement. The new product suffers from slightly higher errors in the precipitation accumulations. Finally, it is shown that topography does not seem to affect the estimation efficiency of the product. In light of these results, it is argued that, overall, the new algorithm outperforms its predecessors and, possibly after adequate adaptations, can be used as a real-time total precipitation product. Full article
(This article belongs to the Special Issue Climate: 10th Anniversary)
Show Figures

Graphical abstract

19 pages, 8917 KiB  
Article
An Assessment of the Present Trends in Temperature and Precipitation Extremes in Kazakhstan
by Vitaliy Salnikov, Yevgeniy Talanov, Svetlana Polyakova, Aizhan Assylbekova, Azamat Kauazov, Nurken Bultekov, Gulnur Musralinova, Daulet Kissebayev and Yerkebulan Beldeubayev
Climate 2023, 11(2), 33; https://doi.org/10.3390/cli11020033 - 23 Jan 2023
Cited by 6 | Viewed by 2309
Abstract
The article presents the results of a study on the assessment of modern space–time trends of extreme values of air temperature and precipitation in 42 meteorological stations throughout Kazakhstan for the period from 1971 to 2020. Spatial and temporal analysis of the distribution [...] Read more.
The article presents the results of a study on the assessment of modern space–time trends of extreme values of air temperature and precipitation in 42 meteorological stations throughout Kazakhstan for the period from 1971 to 2020. Spatial and temporal analysis of the distribution of specialized climatic indices was recommended by the WMO climatology commission and an assessment of their trends was carried out. Spatial heterogeneity was revealed in terms of the degree of manifestation of changes and trends. Temperature indices are shown to confirm the overall warming trend. The division of the territory of Kazakhstan by the degree of manifestation of climate change into the southwestern and northeastern half was revealed. Extreme trends are most pronounced in the southwestern half, where a significant trend has been identified both for an increase in extremely high daytime and extremely low night temperatures. The calculated trends in temperature indices are generally significant, but the significance is mainly not ubiquitous; the trends are significant only in certain parts of Kazakhstan. WSDI and CSDI trends were found to confirm a widespread increase in the overall duration of heat waves and a reduction in the overall duration of cold waves. No significant extreme effects were found in the sediments. It is confirmed that Kazakhstan has weak, statistically insignificant, positive and negative trends in the maximum duration of the non-traveling period. Precipitation index trends, unlike temperature ones, are statistically insignificant in most of the country. Full article
Show Figures

Figure 1

24 pages, 5455 KiB  
Article
The Changing Nature of Hazardous Weather and Implications for Transportation: Example from Oklahoma, USA
by Esther Mullens and Renee McPherson
Climate 2023, 11(2), 32; https://doi.org/10.3390/cli11020032 - 20 Jan 2023
Viewed by 1797
Abstract
Central Oklahoma is undergoing investment in new intermodal transportation and rehabilitation of its infrastructure. Despite a highly variable historical climate, future changes resulting from anthropogenic climate change may be outside of the range for which infrastructure was designed. We examined 21st century trends, [...] Read more.
Central Oklahoma is undergoing investment in new intermodal transportation and rehabilitation of its infrastructure. Despite a highly variable historical climate, future changes resulting from anthropogenic climate change may be outside of the range for which infrastructure was designed. We examined 21st century trends, focusing on weather and climate extremes of demonstrated importance to transportation professionals as identified through expert input. We assessed trends from a suite of 15 global climate models (GCMs) using two emissions scenarios and two high-resolution statistically downscaled datasets. This ensemble provided a quantitative range for potential future climate conditions whilst revealing uncertainties associated with different models and downscaling methods. Our results support the general consensus of a reduction in the frequency of cold temperatures, freeze–thaw cycles, and winter weather; however, for the latter, there is not necessarily a reduction in intensity. Extreme heat days (e.g., days ≥100 °F) increased by factors of 3–6, with this upper range associated with high greenhouse gas emissions, while the seasonal duration of extreme heat extended by 4–10 weeks. Projected return intervals for heavy rainfall increased in frequency and magnitude in the mid and late 21st century. Although the contribution of the emissions pathway to these changes is evident, different extreme value distributions and the varying simulations of precipitation from the GCMs have a large effect on magnitudes, leading to a range of possible futures to consider in infrastructure design. Precipitation metrics, particularly at the extremes, were more sensitive to the selection of downscaled data, as compared with temperature metrics. Our approach represents a resource for transportation professionals seeking to identify changing risk probabilities at regional to local scales, as a precursor to planning and adaptation. Full article
(This article belongs to the Section Weather, Events and Impacts)
Show Figures

Figure 1

13 pages, 3421 KiB  
Article
Evaluation of the Impact of Seasonal Agroclimatic Information Used for Early Warning and Farmer Communities’ Vulnerability Reduction in Southwestern Niger
by Tinni Halidou Seydou, Alhassane Agali, Sita Aissatou, Traore B. Seydou, Lona Issaka and Bouzou Moussa Ibrahim
Climate 2023, 11(2), 31; https://doi.org/10.3390/cli11020031 - 20 Jan 2023
Viewed by 1529
Abstract
In Niger (a fully Sahelian country), the use of climate information is one of the early warning strategies (EWSs) for reducing socio-economic vulnerabilities in farmer communities. It helps farmers to better anticipate risks and choose timely alternative options that can allow them to [...] Read more.
In Niger (a fully Sahelian country), the use of climate information is one of the early warning strategies (EWSs) for reducing socio-economic vulnerabilities in farmer communities. It helps farmers to better anticipate risks and choose timely alternative options that can allow them to generate more profit. This study assesses the impacts of the use of climate information and services that benefit end-users. Individual surveys and focus groups were conducted with a sample of 368 people in eight communes in Southwestern Niger. The survey was conducted within the framework of the ANADIA project implemented by the National Meteorological Direction (NMD) of Niger. The survey aims to identify different types of climate services received by communities and evaluates the major benefits gained from their use. Mostly, the communities received climate (73.6%) and weather (99%) information on rainfall, temperature, dust, wind, clouds, and air humidity. Few producers in the area (10%) received information on seasonal forecasts of the agrometeorological characteristics of the rainy season. The information is not widely disseminated in the villages during the roving seminars conducted by the NMD. For most people, this information is highly relevant to their needs because of its practical advice for options to be deployed to mitigate disasters for agriculture, livestock, health, water resources, and food security. In those communities, 82% of farmers have (at least once) changed their routine practices as a result of the advice and awareness received according to the climate information. The information received enables farmers (64.4%) to adjust their investments according to the profile of the upcoming rainfall season. The use of climate information and related advice led to an increase of about 64 bunches (equivalent to 10 bags of 100 kg) in annual millet production, representing an income increase of about 73,000 FCFA from an average farmland of 3 ha per farmer. In addition, the use of climate information helps to reduce the risks of floods and droughts, which often cause massive losses to crop production, animal and human life, infrastructure, materials, and goods. It has also enabled communities to effectively manage seeds and animal foods and to plan social events, departures and returns to rural exodus. These analyses confirm that the use of climate information serves as an EWS that contributes to increasing the resilience of local populations in the Sahel. Full article
(This article belongs to the Special Issue Drought Early Warning)
Show Figures

Figure 1

13 pages, 734 KiB  
Article
Apparent Temperature Modifies the Effects of Air Pollution on Cardiovascular Disease Mortality in Cape Town, South Africa
by Bukola G. Olutola, Nandi S. Mwase, Joyce Shirinde and Janine Wichmann
Climate 2023, 11(2), 30; https://doi.org/10.3390/cli11020030 - 19 Jan 2023
Cited by 2 | Viewed by 2074
Abstract
Cardiovascular disease (CVD) is the top cause of mortality and a main contributor to disability globally. The evidence so far is varied on whether cold or heat modifies the CVD effects of air pollution. Weather conditions and air pollution sources and levels are [...] Read more.
Cardiovascular disease (CVD) is the top cause of mortality and a main contributor to disability globally. The evidence so far is varied on whether cold or heat modifies the CVD effects of air pollution. Weather conditions and air pollution sources and levels are different in different countries. Studies in low-and middle-income countries are lacking. Mortality data were obtained from Statistics South Africa. Air pollution and meteorological data were obtained from the South African Weather Service. A time-stratified case–crossover epidemiological design was applied. The association between air pollutants (PM10, NO2 and SO2) and CVD mortality was investigated using conditional logistic regression models. Susceptibility by sex and age groups was investigated. In total, 54,356 CVD deaths were included in the 10-year study. The daily PM10, NO2 and SO2 levels exceeded the daily WHO guidelines on 463, 421 and 8 days of the 3652 days, respectively. Higher air pollution risks were observed in this study compared to those reported in meta-analyses. In general, the elderly and females seemed to be vulnerable to air pollutants, especially at high and moderate apparent temperature levels. Harvesting effects were observed at longer lags. The results can be used to develop an early warning system for the city. Full article
(This article belongs to the Special Issue Climate Change and Outdoor-Indoor Air Pollution in Urban Environments)
Show Figures

Figure 1

25 pages, 352 KiB  
Article
Opportunities for Post−COP26 Governance to Facilitate the Deployment of Low−Carbon Energy Infrastructure: An Open Door Policy
by Muhammad Imran, Shiraz Khan, Khalid Zaman, Muhammad Siddique and Haroon ur Rashid Khan
Climate 2023, 11(2), 29; https://doi.org/10.3390/cli11020029 - 19 Jan 2023
Cited by 7 | Viewed by 1728
Abstract
Temperatures worldwide continue to climb, while carbon emissions have exceeded previous records. To achieve environmental sustainability, countries with the Kyoto Protocol and Paris Agreement (COP26) demonstrate sophisticated technical expertise and deploy environmentally driven technologies, such as greenfield investment and renewable energy infrastructure. This [...] Read more.
Temperatures worldwide continue to climb, while carbon emissions have exceeded previous records. To achieve environmental sustainability, countries with the Kyoto Protocol and Paris Agreement (COP26) demonstrate sophisticated technical expertise and deploy environmentally driven technologies, such as greenfield investment and renewable energy infrastructure. This proposal presents an intriguing opportunity for policymakers to identify the distinct characteristics of institutional reforms and green energy sources that may be used to mitigate carbon emissions. Governance regulatory factors, foreign direct investment (FDI), renewable energy consumption (REC), research and development expenditures, urbanization, and carbon emissions are examined in Pakistan. The study estimated the short- and long-run association between the variables using the ARDL bounds testing method for 1996Q1 to 2020Q4. In the short run, in terms of carbon emissions and economic output, the country has an upturned cord environmental Kuznets curve (EKC). The race-to-the-bottom concept holds for countries with U-shaped EKCs in the long term. The negative correlation between overseas investment and environmental damage supports the environmental halo hypothesis. Investment in research and technology may reduce emissions, even though urbanization increases them. Future and present REC are often intertwined with carbon footprints. Carbon emissions are also strongly connected with indicators of institutional quality (IQ), such as procedural efficiency, administrative effectiveness, and political unrest. The research findings demonstrated unidirectional Granger causality running from urbanization, government effectiveness, economic growth, and R&D expenditures to carbon emissions to validate urban-led emissions, institutional-led emissions, growth-led emissions, and innovation-led emissions in a country. Furthermore, R&D expenditure Granger causality was linked to inbound FDI, while government effectiveness Granger causality was linked to REC and R&D expenditures. Following the COP26 guidelines for achieving shared prosperity, the study concluded that good governance reforms, R&D expenditures, greenfield investment, and REC promote environmental sustainability and maintain air quality. Full article
(This article belongs to the Collection Adaptation and Mitigation Practices and Frameworks)
26 pages, 16796 KiB  
Article
Impact of Blue Space Geometry on Urban Heat Island Mitigation
by Petros Ampatzidis, Carlo Cintolesi and Tristan Kershaw
Climate 2023, 11(2), 28; https://doi.org/10.3390/cli11020028 - 19 Jan 2023
Cited by 3 | Viewed by 3232
Abstract
A growing body of literature recognises the importance of nature-based solutions in providing resilience to the effects of climate change by mitigating urban heat islands. However, a knowledge gap exists regarding the contribution of blue spaces to the urban environment. Recent evidence suggests [...] Read more.
A growing body of literature recognises the importance of nature-based solutions in providing resilience to the effects of climate change by mitigating urban heat islands. However, a knowledge gap exists regarding the contribution of blue spaces to the urban environment. Recent evidence suggests that blue spaces within urban canyons can promote pollutant removal via the vertical transport of air under certain conditions, but this is inconclusive. Using a numerical solver that accounts for evaporation effects, we investigate the influence of blue space size and shape on the in-canyon flow structure, temperature and water vapour distribution. Simulations were performed for water bodies of varying size and shape at different temperatures compared to the surrounding air. Results suggest that inadequately sized warmer water bodies are unable to promote sufficient vertical transport for pollutant removal, leading to overturning and increased temperature and humidity levels at the pedestrian level, thereby worsening environmental conditions and increasing the risk of heat-related illness and mortality. Hence, larger water bodies are better suited to nocturnal transport of pollutants and accumulated warm air away from the urban surface, while smaller water bodies are better suited to providing localised evaporative cooling. Lastly, irregular water bodies may have a greater cooling effect across a larger area. Full article
Show Figures

Figure 1

28 pages, 12692 KiB  
Article
Precipitation Variability for Protected Areas of Primary Forest and Pastureland in Southwestern Amazônia
by Rodrigo Martins Moreira, Bruno César dos Santos, Rafael Grecco Sanches, Vandoir Bourscheidt, Fernando de Sales, Stefan Sieber and Paulo Henrique de Souza
Climate 2023, 11(2), 27; https://doi.org/10.3390/cli11020027 - 17 Jan 2023
Cited by 2 | Viewed by 1969
Abstract
Daily and monthly rainfall data provided by surface rain gauges in the Amazon Basin are sparse and defective, making it difficult to monitor rainfall patterns for certain portions of its territory, in this sense, estimations of precipitation from remote sensing calibrated with rain [...] Read more.
Daily and monthly rainfall data provided by surface rain gauges in the Amazon Basin are sparse and defective, making it difficult to monitor rainfall patterns for certain portions of its territory, in this sense, estimations of precipitation from remote sensing calibrated with rain gauge data are key to overcome this problem. This paper presents a spatiotemporal analysis of the precipitation distribution for Rondônia State, in southwestern Amazonia. Data from Climate Hazards Group InfraRed Precipitation and Station (CHIRPS) were analyzed, using a pooled time analysis of a forty-year period (1981–2020). Data obtained from remote sensing were validated by rain gauges distributed over the study region. Pixel-by-pixel trend analyzes were developed by applying the Mann-Kendall test and Sen’s slope test to study the magnitude of the trend. The analysis revealed that CHIRPS presents a tendency to underestimate precipitation values in most cases. Among the metrics, mean values between very good (<±15%) and good (±15–±35%) were observed using PBIAS; mean RMSE values range from 57.8 mm to 107.9 mm; an average agreement level of 0.9 and an average SES of 0.5; and good fit for the linear regression model (average R2 > 0.70) for about 64.7% of the stations. Sen’ slope spatialization results show a reduction of approximately −15 mm year−1, with decrease mainly in the Northern Region of Rondônia, which has extensive areas where the native forest has been replaced by pasture. Full article
Show Figures

Figure 1

16 pages, 313 KiB  
Article
White Identity and Climate Change Skepticism: Assessing the Mediating Roles of Social Dominance Orientation and Conspiratorial Ideation
by Matthew Grindal, Dilshani Sarathchandra and Kristin Haltinner
Climate 2023, 11(2), 26; https://doi.org/10.3390/cli11020026 - 17 Jan 2023
Cited by 4 | Viewed by 2291
Abstract
Prior research has found that white people are more likely to be climate change skeptics. In much of this prior work, white identity is treated as a categorical label, limiting the theoretical and empirical understanding of this relationship. Drawing on survey data from [...] Read more.
Prior research has found that white people are more likely to be climate change skeptics. In much of this prior work, white identity is treated as a categorical label, limiting the theoretical and empirical understanding of this relationship. Drawing on survey data from a US national sample of 933 white young adults, we theorize that white identity is a developmental process where people explore the meanings of their racial identity and commit to a white identity marked by enhanced levels of social dominance orientation and conspiratorial ideation, two social-psychological constructs consistently associated with climate change skepticism. Using regression analyses, we tested a mediation model that a strong white identity would increase climate change skepticism by enhancing one’s social dominance orientation and conspiratorial ideation. We found partial support for our model. While a strong white identity was positively associated with social dominance orientation and conspiratorial ideation, only social dominance orientation increased climate change skepticism. Conspiratorial ideation reduced climate change skepticism. We discuss the implications of our findings for the climate change literature as well as how our findings can inform policies that could reduce climate change skepticism among white people. Full article
Previous Issue
Next Issue
Back to TopTop