Next Issue
Volume 5, June
Previous Issue
Volume 4, December


GeoHazards, Volume 5, Issue 1 (March 2024) – 15 articles

Cover Story (view full-size image): 
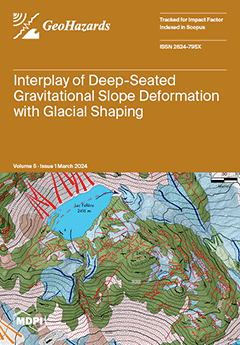
In high mountain areas, morphology is mainly conditioned by glacial shaping. Deep-seated gravitational slope deformations may also develop due to high relief energy. The Lac Fallère area represents a significant example of how it is possible to preserve and identify the relationships between glacial shaping (mainly evidenced by glacial slopes, moraines, roches moutonnées) and gravitational structures (minor scarps, trenches, counterscarps, bulging reliefs). Lac Fallère is not a typical subcircular cirque lake. Its elongated shape in the WSW–ENE direction and the presence of a straight wall upstream suggest a glacial cirque significantly affected by the evolution of gravitational trenches. The glacier was barred by a wide and relatively high gravitational bulging relief that forced it to flow through two glacial tongues with opposite flow directions, resulting in a glacial diffluence. View this paper
  • Issues are regarded as officially published after their release is announced to the table of contents alert mailing list.
  • You may sign up for e-mail alerts to receive table of contents of newly released issues.
  • PDF is the official format for papers published in both, html and pdf forms. To view the papers in pdf format, click on the "PDF Full-text" link, and use the free Adobe Reader to open them.
Order results
Result details
Select all
Export citation of selected articles as:
24 pages, 8817 KiB  
Article
Landslide Risks to Bridges in Valleys in North Carolina
by Sophia Lin, Shen-En Chen, Wenwu Tang, Vidya Chavan, Navanit Shanmugam, Craig Allan and John Diemer
GeoHazards 2024, 5(1), 286-309; https://doi.org/10.3390/geohazards5010015 - 21 Mar 2024
Viewed by 739
Abstract
This research delves into the intricate dynamics of landslides, emphasizing their consequences on transportation infrastructure, specifically highways and roadway bridges in North Carolina. Based on a prior investigation of bridges in Puerto Rico after Hurricane Maria, we found that bridges above water and [...] Read more.
This research delves into the intricate dynamics of landslides, emphasizing their consequences on transportation infrastructure, specifically highways and roadway bridges in North Carolina. Based on a prior investigation of bridges in Puerto Rico after Hurricane Maria, we found that bridges above water and situated in valleys can be exposed to both landslide and flooding risks. These bridges faced heightened vulnerability to combined landslides and flooding events due to their low depth on the water surface and the potential for raised flood heights due to upstream landslides. Leveraging a dataset spanning more than a century and inclusive of landslide and bridge information, we employed logistic regression (LR) and random forest (RF) models to predict landslide susceptibility in North Carolina. The study considered conditioning factors such as elevation, aspect, slope, rainfall, distance to faults, and distance to rivers, yielding LR and RF models with accuracy rates of 76.3% and 82.7%, respectively. To establish that a bridge’s location is at the bottom of a valley, data including landform, slope, and elevation difference near the bridge location were combined to delineate a bridge in a valley. The difference between bridge height and the lowest river elevation is established as an assumed flooding potential (AFP), which is then used to quantify the flooding risk. Compared to traditional flood risk values, the AFP, reported in elevation differences, is more straightforward and helps bridge engineers visualize the flood risk to a bridge. Specifically, a bridge (NCDOT ID: 740002) is found susceptible to both landslide (92%) and flooding (AFT of 6.61 m) risks and has been validated by field investigation, which is currently being retrofitted by North Carolina DOT with slope reinforcements (soil nailing and grouting). This paper is the first report evaluating the multi-hazard issue of bridges in valleys. The resulting high-fidelity risk map for North Carolina can help bridge engineers in proactive maintenance planning. Future endeavors will extend the analysis to incorporate actual flooding risk susceptibility analysis, thus enhancing our understanding of multi-hazard impacts and guiding resilient mitigation strategies for transportation infrastructure. Full article
Show Figures

Figure 1

15 pages, 48647 KiB  
Article
Three-Dimensional Amplitude versus Offset Analysis for Gas Hydrate Identification at Woolsey Mound: Gulf of Mexico
by Saiful Alam, Camelia Knapp and James Knapp
GeoHazards 2024, 5(1), 271-285; https://doi.org/10.3390/geohazards5010014 - 08 Mar 2024
Viewed by 859
Abstract
The Gulf of Mexico Hydrates Research Consortium selected the Mississippi Canyon Lease Block 118 (MC118) as a multi-sensor, multi-discipline seafloor observatory for gas hydrate research with geochemical, geophysical, and biological methods. Woolsey Mound is a one-kilometer diameter hydrate complex where gas hydrates outcrop [...] Read more.
The Gulf of Mexico Hydrates Research Consortium selected the Mississippi Canyon Lease Block 118 (MC118) as a multi-sensor, multi-discipline seafloor observatory for gas hydrate research with geochemical, geophysical, and biological methods. Woolsey Mound is a one-kilometer diameter hydrate complex where gas hydrates outcrop at the sea floor. The hydrate mound is connected to an underlying salt diapir through a network of shallow crestal faults. This research aims to identify the base of the hydrate stability zone without regionally extensive bottom simulating reflectors (BSRs). This study analyzes two collocated 3D seismic datasets collected four years apart. To identify the base of the hydrate stability zone in the absence of BSRs, shallow discontinuous bright spots were targeted. These bright spots may mark the base of the hydrate stability field in the study area. These bright spots are hypothesized to produce an amplitude versus offset (AVO) response due to the trapping of free gas beneath the gas hydrate. AVO analyses were conducted on pre-stacked 3D volume and decreasing amplitude values with an increasing offset, i.e., Class 4 AVO anomalies were observed. A comparison of a time-lapse analysis and the AVO analysis was conducted to investigate the changes in the strength of the AVO curve over time. The changes in the strength are correlated with the decrease in hydrate concentrations over time. Full article
Show Figures

Figure 1

16 pages, 2763 KiB  
Article
Rapid Earthquake Damage Assessment System in the Black Sea Basin: Selection/Adoption of Ground Motion Prediction Equations with Emphasis in the Cross-Border Areas
by Nikolaos Theodoulidis, Basil Margaris, Dimitris Sotiriadis, Can Zulfikar, Seyhan Okuyan Akcan, Carmen Ortanza Cioflan, Elena Florinela Manea and Dragos Toma-Danila
GeoHazards 2024, 5(1), 255-270; https://doi.org/10.3390/geohazards5010013 - 05 Mar 2024
Viewed by 805
Abstract
In the present study, an effort to propose and adopt appropriate Ground Motion Prediction Equations (GMPEs) for the Rapid Earthquake Damage Assessment System (REDAS) in the Black Sea basin is attempted. Emphasis of GMPE harmonization in the cross-border areas (CBA) is given. For [...] Read more.
In the present study, an effort to propose and adopt appropriate Ground Motion Prediction Equations (GMPEs) for the Rapid Earthquake Damage Assessment System (REDAS) in the Black Sea basin is attempted. Emphasis of GMPE harmonization in the cross-border areas (CBA) is given. For this reason, two distinct sub-areas are investigated, taking into consideration their seismotectonic regime. One sub-area refers to active shallow crustal earthquakes (Greece-Turkey, CBA) and the other to intermediate-depth and shallow crustal earthquakes (Romania-Moldova, Western Black Sea CBA). Testing and ranking of pre-selected GMPEs has been performed using strong motion data of the broader CBA regions of both sub-areas. The final proposed GMPEs to feed the REDA System may assure the effective estimation of ShakeMaps and—in combination with the appropriate vulnerability curves—reliable near-real-time damage assessment in the cross-border earthquake affected areas. Full article
(This article belongs to the Collection Geohazard Characterization, Modeling, and Risk Assessment)
Show Figures

Figure 1

22 pages, 6020 KiB  
Article
New Observational Material about Seismic and Non-Seismic Tsunamis in Greece and Surrounding Areas from 1900 to 2023
by Ioanna Triantafyllou and Gerassimos A. Papadopoulos
GeoHazards 2024, 5(1), 233-254; https://doi.org/10.3390/geohazards5010012 - 04 Mar 2024
Viewed by 1757
Abstract
A new set of observations has been compiled for tsunamis occurring in Greece and in the surrounding areas from 1900 to 2023. A variety of information sources has been collected and examined, including scientific and press reports, books, eyewitness accounts, pictorial and video [...] Read more.
A new set of observations has been compiled for tsunamis occurring in Greece and in the surrounding areas from 1900 to 2023. A variety of information sources has been collected and examined, including scientific and press reports, books, eyewitness accounts, pictorial and video material, and tide-gauge records. New material was also collected during our field surveys in the islands of Cephalonia, Karpathos, and Kos. Our investigation included 26 distinct events and revealed several tsunamis. The majority of them have remained unknown so far in the tsunami community. Our compilation also included little-known events for which further documentation has been provided. Among others, of particular importance is the collection of new information about the well-known tsunami associated with the 9 February 1948 large earthquake in Karpathos Island as well as the unknown so far series of local but powerful tsunamis generated during the seismic crisis of very strong earthquakes that destroyed the Ionian islands during August 1953. The new observational material collected is significant for the enrichment of existing tsunami catalogs with positive implications for better understanding the tsunami generation mechanisms and the assessment of tsunami hazards and risks. Full article
Show Figures

Figure 1

24 pages, 41807 KiB  
Article
A GIS-Based Approach for Shallow Landslides Risk Assessment in the Giampilieri and Briga Catchments Areas (Sicily, Italy)
by Giulio Vegliante, Valerio Baiocchi, Luca Maria Falconi, Lorenzo Moretti, Maurizio Pollino, Claudio Puglisi and Gaia Righini
GeoHazards 2024, 5(1), 209-232; https://doi.org/10.3390/geohazards5010011 - 01 Mar 2024
Cited by 1 | Viewed by 1101
Abstract
Shallow landslides pose a widely growing hazard and risk, globally and particularly in Mediterranean areas. The implementation of adequate adaptation and mitigation measures necessarily requires the development of practical and affordable methodologies and technologies for assessing the shallow landslides hazard and its territorial [...] Read more.
Shallow landslides pose a widely growing hazard and risk, globally and particularly in Mediterranean areas. The implementation of adequate adaptation and mitigation measures necessarily requires the development of practical and affordable methodologies and technologies for assessing the shallow landslides hazard and its territorial impact. The assessment of shallow landslide hazard maps involves two different and sequential steps: the susceptibility and the runout analysis, respectively, aimed at the identification of the initiation and the propagation areas. This paper describes the application in the Giampilieri and Briga Villages area (Sicily, Italy) of a shallow landslide risk process at a basin scale with an innovative approach in the runout assessment segment. The runout analysis was conducted using specific GIS tools employing an empirical–geometric approach at a basin scale. The exposure and vulnerability values of the elements at risk were assigned using a qualitative and semi-quantitative approach, respectively. The results highlight the effectiveness of the procedure in producing consistent runout hazard and risk assessments in the valley areas where the more important and vulnerable exposed elements are located. This study contributes to addressing the public administration demand for valuable and user-friendly tools to manage and drive regional planning. Full article
(This article belongs to the Topic Landslide Prediction, Monitoring and Early Warning)
Show Figures

Figure 1

17 pages, 2371 KiB  
Article
Seismic Fragility Curves of RC Buildings Subjected to Aging
by Spyridon Diamantopoulos, Zeinep Achmet, Sotiria Stefanidou, Olga Markogiannaki and Michalis Fragiadakis
GeoHazards 2024, 5(1), 192-208; https://doi.org/10.3390/geohazards5010010 - 27 Feb 2024
Cited by 1 | Viewed by 972
Abstract
A large number of existing reinforced concrete (RC) buildings have surpassed their anticipated service life and show signs of degradation due to aging; this degradation is a function of the construction practices adopted in the past as well as environmental conditions. This paper [...] Read more.
A large number of existing reinforced concrete (RC) buildings have surpassed their anticipated service life and show signs of degradation due to aging; this degradation is a function of the construction practices adopted in the past as well as environmental conditions. This paper discusses seismic fragility and the risk assessment of RC structures, emphasizing the impact of corrosion due to concrete aging and the associated deterioration mechanisms. The literature on this topic is critically reviewed, and a methodology for studying the seismic fragility of deteriorated RC buildings is proposed. As a case study, a four-story RC building designed according to contemporary code provisions is examined. The investigation encompasses the derivation of fragility curves, considering critical parameters such as the corrosion rate, the initiation time, and the cover depth. The proposed approach enables the evaluation and quantification of the impact of corrosion mechanisms on the seismic performance of buildings. Full article
Show Figures

Figure 1

16 pages, 8042 KiB  
Article
Examining the Relationship between Rainfall, Runoff, and Turbidity during the Rainy Season in Western Japan
by Mohamad Basel Al Sawaf, Kiyosi Kawanisi and Masoud Bahreinimotlagh
GeoHazards 2024, 5(1), 176-191; https://doi.org/10.3390/geohazards5010009 - 18 Feb 2024
Viewed by 928
Abstract
Given the changing climate, understanding the recent variability in large-scale rainfall patterns is a crucial task in order to better understand the underlying hydrological processes that occur within a watershed. This study aims to investigate how rainfall events in western Japan have changed [...] Read more.
Given the changing climate, understanding the recent variability in large-scale rainfall patterns is a crucial task in order to better understand the underlying hydrological processes that occur within a watershed. This study aims to investigate how rainfall events in western Japan have changed due to climate change and how these changes have affected runoff–turbidity dynamics during the rainy season. To address the research objectives, we analyzed two decades of precipitation records in the Gōno River watershed and examined the associated runoff–turbidity dynamics during floods using turbidity–discharge (T-Q) loops, quantified using an enhanced hysteresis index. Our findings revealed a kind of intense rainfall event occurring every 3 to 4 years. Additionally, spatial pentad analysis showed varying intensities of accumulated precipitation, indicating that extreme rainfall is not confined to a specific spatial zone. Regarding turbidity–discharge behavior, we found that clockwise hysteresis patterns were caused by sediment sources from near-channel areas, while anticlockwise patterns were caused by soil erosion from nearby areas. Another notable finding was that turbidity peaks during floods may represent the earlier (or later) arrival of turbid water from distant upstream sources due to intense precipitation. One of the key challenges in quantifying hysteresis patterns is that there is no agreed-upon definition for how to determine the start and end of a flood event. This can lead to bias in the quantification of these patterns. Full article
Show Figures

Figure 1

10 pages, 853 KiB  
Article
Estimation of Return Levels with Long Return Periods for Extreme Sea Levels by the Average Conditional Exceedance Rate Method
by Jesper Rydén
GeoHazards 2024, 5(1), 166-175; https://doi.org/10.3390/geohazards5010008 - 18 Feb 2024
Viewed by 859
Abstract
Estimation of so-called return levels for environmental extremes is of importance for risk assessment. A particular challenge is to find estimates corresponding to long return periods, as uncertainties in the form of confidence intervals became too wide for practical use when applying conventional [...] Read more.
Estimation of so-called return levels for environmental extremes is of importance for risk assessment. A particular challenge is to find estimates corresponding to long return periods, as uncertainties in the form of confidence intervals became too wide for practical use when applying conventional methodology where large portions of data are not used. A recently proposed technique, the Average Conditional Exceedance Rate (ACER), makes effective use of all available data. For risk analysis related to nuclear infrastructure, usually located along a coastline, extreme sea levels are of concern. We demonstrate, for measurements of the sea level along the Swedish coast at locations close to nuclear power plants, that the methodology results in considerably shorter confidence intervals compared to conventional approaches. Full article
Show Figures

Figure 1

24 pages, 5343 KiB  
Article
Archeoseismic Study of Damage in Medieval Monuments around New Delhi, India: An Approach to Understanding Paleoseismicity in an Intraplate Region
by Sambit Prasanajit Naik, Klaus Reicherter, Miklos Kázmér, Jens Skapski, Asmita Mohanty and Young-Seog Kim
GeoHazards 2024, 5(1), 142-165; https://doi.org/10.3390/geohazards5010007 - 14 Feb 2024
Viewed by 1109
Abstract
The seismic shaking observed around Delhi and the surrounding region due to near-field and far-field earthquakes is a matter of concern for the seismic safety of the national capital of India, as well as the historical monuments of the region. Historical seismicity indicates [...] Read more.
The seismic shaking observed around Delhi and the surrounding region due to near-field and far-field earthquakes is a matter of concern for the seismic safety of the national capital of India, as well as the historical monuments of the region. Historical seismicity indicates that the Delhi region has been affected by several damaging earthquakes originating from the Himalayan region as far-field events, as well as due to near-field earthquakes with epicenters close to Delhi. The historical records, along with recent archeoseismological studies, suggest that Qutab Minar, a UNESCO World Heritage Site, was damaged by the earthquake of 1803 CE. This event represents the only evidence of seismic damage from the region, as there has been no detailed study of other historical monuments in the area or earthquakes that have caused damage. In this context, the earthquake damage to other monuments might have been overlooked to some extent around the Qutab Minar due to the lack of proper earthquake damage surveys and documentation in historical times. The main goal of this study is to identify evidence of earthquake archeological effects around the Qutab Minar and to shed new light on the occurrence and characteristics of ancient earthquakes while providing data to inform seismic risk assessment programs. With this aim, we describe different earthquake-related damage (EAE, earthquake archeological effects) at the Isa Khan Tomb and Humayun’s Tomb, built between 1548 CE and 1570 CE, respectively, as well as the older Tomb of Iltutmish (built in 1235 CE) along with the Qutab Minar, which was built between 1199 CE and 1220 CE. The damage was probably caused by seismic events with intensities between VIII and IX on the European Macroseismic Scale (EMS). Based on the methodology of paleo ShakeMaps, it is most likely that the 1803 CE earthquake was the causative earthquake for the observed deformation in the Isa Khan Tomb, Tomb of Iltutmish, and Humayun’s Tomb. More detailed regional paleoseismological studies are required to identify the responsible fault. In conclusion, the impressive cultural heritage of Delhi city and the intraplate region is constantly under seismic threats from near-field earthquakes and far-field Himalayan earthquakes. Full article
(This article belongs to the Special Issue Active Faulting and Seismicity)
Show Figures

Figure 1

30 pages, 10249 KiB  
Review
A Review of the Contribution of Satellite Altimetry and Tide Gauge Data to Evaluate Sea Level Trends in the Adriatic Sea within a Mediterranean and Global Context
by Krešo Pandžić, Tanja Likso, Ranko Biondić and Božidar Biondić
GeoHazards 2024, 5(1), 112-141; https://doi.org/10.3390/geohazards5010006 - 04 Feb 2024
Viewed by 1212
Abstract
The relatively new sea level satellite altimetry and secular coastal tide gauge data made the reconstruction of sea levels on regional and global scales possible about one century back. Due to better estimations of the Earth’s crustal, glacial, tectonic, and other possible motion [...] Read more.
The relatively new sea level satellite altimetry and secular coastal tide gauge data made the reconstruction of sea levels on regional and global scales possible about one century back. Due to better estimations of the Earth’s crustal, glacial, tectonic, and other possible motion biases in tide gauge data, some additional improvements can be expected in sea level reconstructions, analysis, and predictions. A more detailed review of published sea level-related results was conducted for the Eastern Adriatic coast, including the operation of the tide gauge network and data processing, crustal movement estimations, and the establishment of a new reference height system in Croatia, based on five tide gauge sea level data. It was shown that sea level variation and trend-related indicators are spatially homogeneous, especially on a sub-Adriatic scale. The regional Adriatic Sea mean sea level rise rate of +2.6 mm/year for the satellite altimetry era (1993–2019) is less than the global mean sea level (GMSL) rise rate of +3.3 mm/year for the period of 1993–2022. Several empirical methods for GMSL projections and expected IPCC (Intergovernmental Panel on Climate Change) assessments until the end of the 21st century are considered. Full article
Show Figures

Figure 1

21 pages, 5134 KiB  
Article
ENSO Impacts on Jamaican Rainfall Patterns: Insights from CHIRPS High-Resolution Data for Disaster Risk Management
by Cheila Avalon-Cullen, Rafea Al Suhili, Nathaniel K. Newlands, Christy Caudill, Harvey Hill, Jaqueline Spence-Hemmings and Markus Enenkel
GeoHazards 2024, 5(1), 91-111; https://doi.org/10.3390/geohazards5010005 - 01 Feb 2024
Viewed by 1287
Abstract
This study examines the influence of the El Niño Southern Oscillation (ENSO) on Jamaica’s rainfall patterns, leveraging CHIRPS data from 1981 to 2021 in 370 locations. Our analysis reveals a distinct ENSO imprint on rainfall, with La Niña phases showing a consistently higher [...] Read more.
This study examines the influence of the El Niño Southern Oscillation (ENSO) on Jamaica’s rainfall patterns, leveraging CHIRPS data from 1981 to 2021 in 370 locations. Our analysis reveals a distinct ENSO imprint on rainfall, with La Niña phases showing a consistently higher probability of exceeding various rainfall thresholds compared to El Niño. Notably, La Niña increases the likelihood of heavier rainfall, particularly in the wet seasons, with probabilities of exceeding 200 mm reaching up to 50% during wet season II. Spatially, the probability of total monthly rainfall (TMR) during La Niña is elevated in the northeastern regions, suggesting regional vulnerability to excess rainfall. Additionally, during El Niño, the correlation between TMR and the maximum air temperature (Tmax) is significantly stronger, indicating a positive and more pronounced relationship between higher temperatures and rainfall, with correlation coefficients ranging from 0.39 to 0.80. Wind speed and evapotranspiration show a negligible influence on TMR during both ENSO phases, maintaining stable correlation patterns with only slight variations. The results of this study underscore the necessity for differentiated regional strategies in water resource management and disaster preparedness, tailored to the unique climatic characteristics imposed by ENSO variability. These insights contribute to a refined understanding of climate impacts, essential for enhancing resilience and adaptive capacity in Jamaica and other small island developing states. Full article
(This article belongs to the Collection Geohazard Characterization, Modeling, and Risk Assessment)
Show Figures

Figure 1

27 pages, 1570 KiB  
Article
Machine Learning-Based Flood Forecasting System for Window Cliffs State Natural Area, Tennessee
by George K. Darkwah, Alfred Kalyanapu and Collins Owusu
GeoHazards 2024, 5(1), 64-90; https://doi.org/10.3390/geohazards5010004 - 25 Jan 2024
Viewed by 1281
Abstract
The prevalence of unforeseen floods has heightened the need for more accurate flood simulation and forecasting models. Even though forecast stations are expanding across the United States, the coverage is usually limited to major rivers and urban areas. Most rural and sub-urban areas, [...] Read more.
The prevalence of unforeseen floods has heightened the need for more accurate flood simulation and forecasting models. Even though forecast stations are expanding across the United States, the coverage is usually limited to major rivers and urban areas. Most rural and sub-urban areas, including recreational areas such as the Window Cliffs State Natural Area, do not have such forecast stations and as such, are prone to the dire effects of unforeseen flooding. In this study, four machine learning model architectures were developed based on the long short-term memory, random forest, and support vector regression techniques to forecast water depths at the Window Cliffs State Natural Area, located within the Cane Creek watershed in Putnam County, Tennessee. Historic upstream and downstream water levels and absolute pressure were used to forecast the future water levels downstream of the Cane Creek watershed. The models were tested with lead times of 3, 4, 5, and 6 h, revealing that the model performances reduced with an increase in lead time. Even though the models yielded low errors of 0.063–0.368 ft MAE, there was an apparent delay in predicting the peak water depths. However, including rainfall data in the forecast showed a promising improvement in the models’ performance. Tests conducted on the Cumberland River in Tennessee showed a promising improvement in model performance when trained with larger data. Full article
Show Figures

Figure 1

26 pages, 9640 KiB  
Article
The Lac Fallère Area as an Example of the Interplay between Deep-Seated Gravitational Slope Deformation and Glacial Shaping (Aosta Valley, NW Italy)
by Stefano Dolce, Maria Gabriella Forno, Marco Gattiglio and Franco Gianotti
GeoHazards 2024, 5(1), 38-63; https://doi.org/10.3390/geohazards5010003 - 11 Jan 2024
Viewed by 1342
Abstract
The Lac Fallère area in the upper Clusellaz Valley (tributary of the middle Aosta Valley) is shaped in micaschist and gneiss (Mont Fort Unit, Middle Penninic) and in calcschist and marble (Aouilletta Unit, Combin Zone). Lac Fallère exhibits an elongated shape and is [...] Read more.
The Lac Fallère area in the upper Clusellaz Valley (tributary of the middle Aosta Valley) is shaped in micaschist and gneiss (Mont Fort Unit, Middle Penninic) and in calcschist and marble (Aouilletta Unit, Combin Zone). Lac Fallère exhibits an elongated shape and is hosted in a WSW–ENE-trending depression, according to the slope direction. This lake also shows a semi-submerged WSW–ENE rocky ridge that longitudinally divides the lake. This evidence, in addition to the extremely fractured rocks, indicates a wide, deep-seated gravitational slope deformation (DSGSD), even if this area is not yet included within the regional landslide inventory of the Aosta Valley Region. The Lac Fallère area also shows reliefs involved in glacial erosion (roches moutonnée), an extensive cover of subglacial sediments, and many moraines essentially referred to as Lateglacial. The DSGSD evolution in a glacial environment produced, as observed in other areas, effects on the facies of Quaternary sediments and the formation of a lot of wide moraines. Glacial slope sectors and lateral moraines displaced by minor scarps and counterscarps, and glaciers using trenches forming several arched moraines, suggest an interplay between glacial and gravitational processes, which share part of their evolution history. Full article
(This article belongs to the Special Issue Geomorphological Mapping Research for Landslide)
Show Figures

Figure 1

16 pages, 5386 KiB  
Article
Statistics on Typhoon Intensity and Rice Damage in Vietnam and the Philippines
by Kai Wan Yuen, Adam D. Switzer, Paul P. S. Teng and Janice Ser Huay Lee
GeoHazards 2024, 5(1), 22-37; https://doi.org/10.3390/geohazards5010002 - 11 Jan 2024
Viewed by 1559
Abstract
Typhoons are destructive multi-hazard events. To assess the relationship between typhoon intensity and agricultural loss, there is a need for accurate and standardized information on loss and damage, which is currently lacking. To address this, a database for Vietnam and the Philippines was [...] Read more.
Typhoons are destructive multi-hazard events. To assess the relationship between typhoon intensity and agricultural loss, there is a need for accurate and standardized information on loss and damage, which is currently lacking. To address this, a database for Vietnam and the Philippines was created to provide aggregated information on the magnitude of rice damage and to highlight the rice-growing areas which were prone to being damaged by typhoons. Our study period was from 1970 to 2018, and we focused on Vietnam and the Philippines as these two countries experience frequent and intense typhoons. As different crops respond differently to wind and rain, we limit our research to a single crop. In this study, we focused on rice as it is a major staple food in Southeast Asia, and rice fields were often damaged by typhoons in the two countries. Of the 829 typhoon events recorded, only 15% of the events resulted in rice damage. The average area of rice damaged per typhoon event ranged from 42,407 ha in Vietnam to 83,571 ha in the Philippines. Meanwhile, the average production loss per typhoon event ranged from 190,227 metric tonnes in the Philippines to 539,150 metric tonnes in Vietnam. The monetary value of rice crops lost was only reported in the Philippines, and this amounted to an average of US$ 42 million per typhoon event. There was a weak relationship between landfall wind speed and the three indicators of rice damage, which suggests that rice damage was not primarily due to strong winds. Our results showed that the rice fields in the coastal provinces of Vietnam and the northern parts of the Philippines were more vulnerable to being damaged by typhoons. Full article
Show Figures

Figure 1

21 pages, 8195 KiB  
Article
Assessment of Soil Loss from Land Cover Changes in the Nan River Basin, Thailand
by Kwanchai Pakoksung
GeoHazards 2024, 5(1), 1-21; https://doi.org/10.3390/geohazards5010001 - 04 Jan 2024
Viewed by 1660
Abstract
This study investigates soil loss erosion dynamics in the Nan River Basin, Thailand, focusing on the impact of land cover changes. Utilizing the Universal Soil Loss Equation (USLE) model, key factors, including rainfall erosivity, soil erodibility, topography, and land cover, are analyzed for [...] Read more.
This study investigates soil loss erosion dynamics in the Nan River Basin, Thailand, focusing on the impact of land cover changes. Utilizing the Universal Soil Loss Equation (USLE) model, key factors, including rainfall erosivity, soil erodibility, topography, and land cover, are analyzed for the years 2001 to 2019. The findings reveal a substantial increase in human-induced soil erosion, emphasizing the pressing need for effective mitigation measures. Severity classification demonstrates shifting patterns, prompting targeted conservation strategies. The examination of land cover changes indicates significant alterations in the satellite image (MODIS), particularly an increase in Deciduous forest (~13.21%), Agriculture (~0.18%), and Paddy (~0.43%), and decrease in Evergreen Forest (~13.73%) and Water (~0.12%) cover types. Deciduous forest and Agriculture, associated with the highest soil loss rates, underscore the environmental consequences of specific land use practices. Notably, the increase in Deciduous forest and Agriculture significantly contributes to changes in soil loss rates, revealing the interconnectedness of land cover changes and soil erosion in ~18.05% and ~8.67%, respectively. This study contributes valuable insights for informed land management decisions and lays a foundation for future research in soil erosion dynamics. Additionally, the percentage increase in Agriculture corresponds to a notable rise in soil loss rates, underscoring the urgency for sustainable land use practices. Full article
Show Figures

Figure 1

Previous Issue
Next Issue
Back to TopTop