
A GIS-Based Approach for Shallow Landslides Risk Assessment in the Giampilieri and Briga Catchments Areas (Sicily, Italy)

 , ,
, ,  ,
,  ,
,
Abstract
:1. Introduction
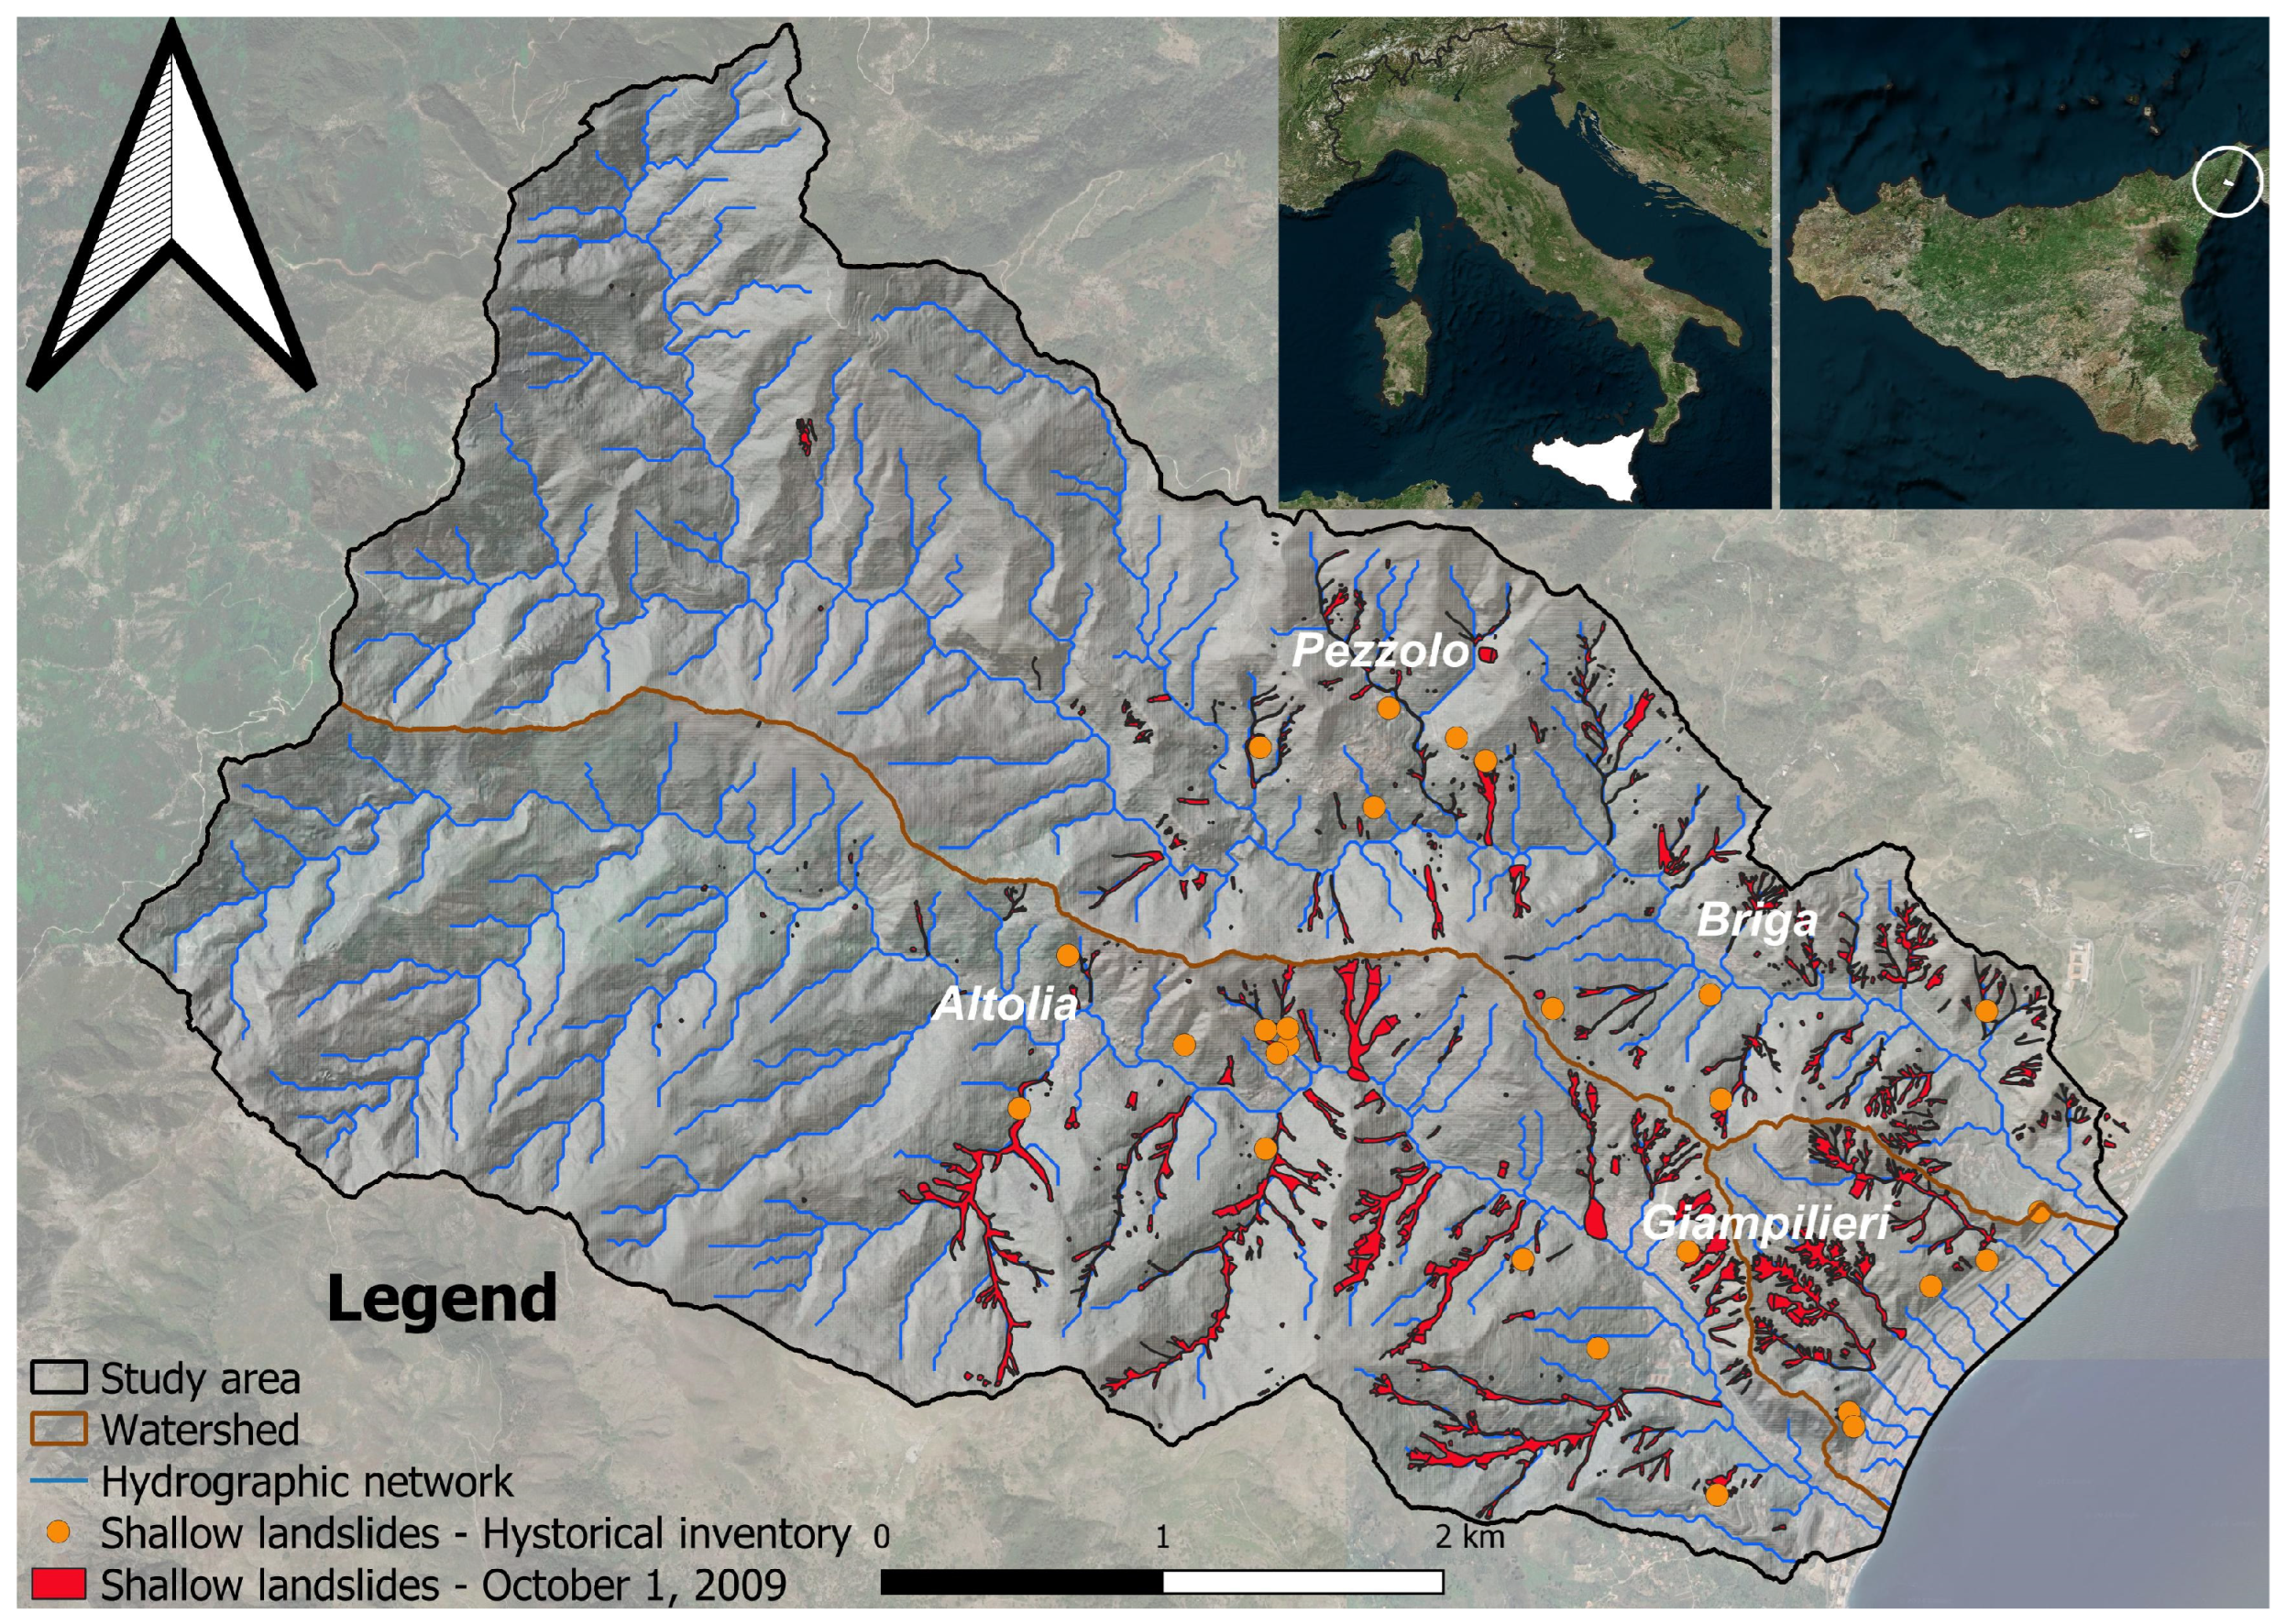
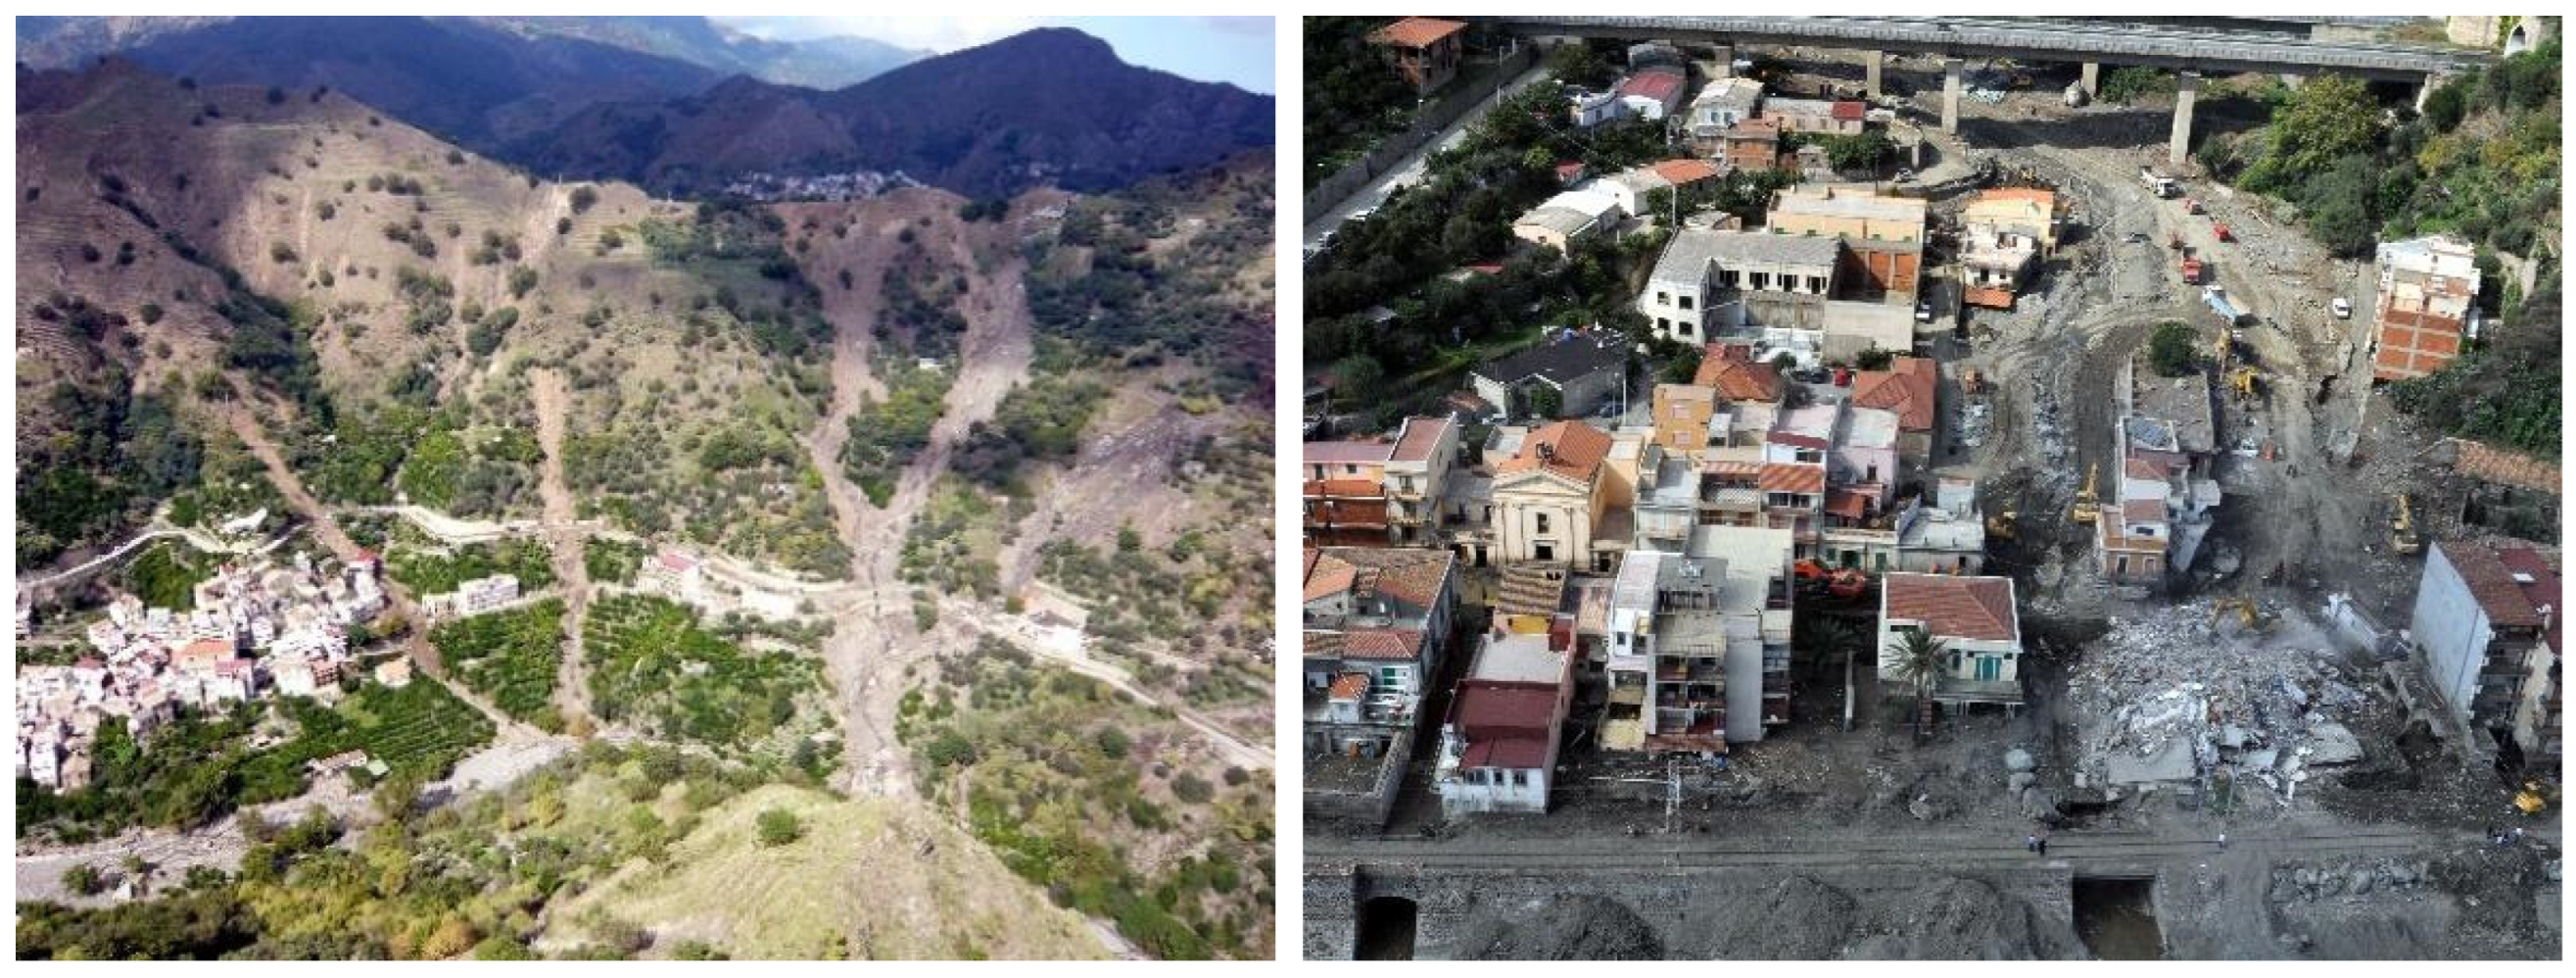
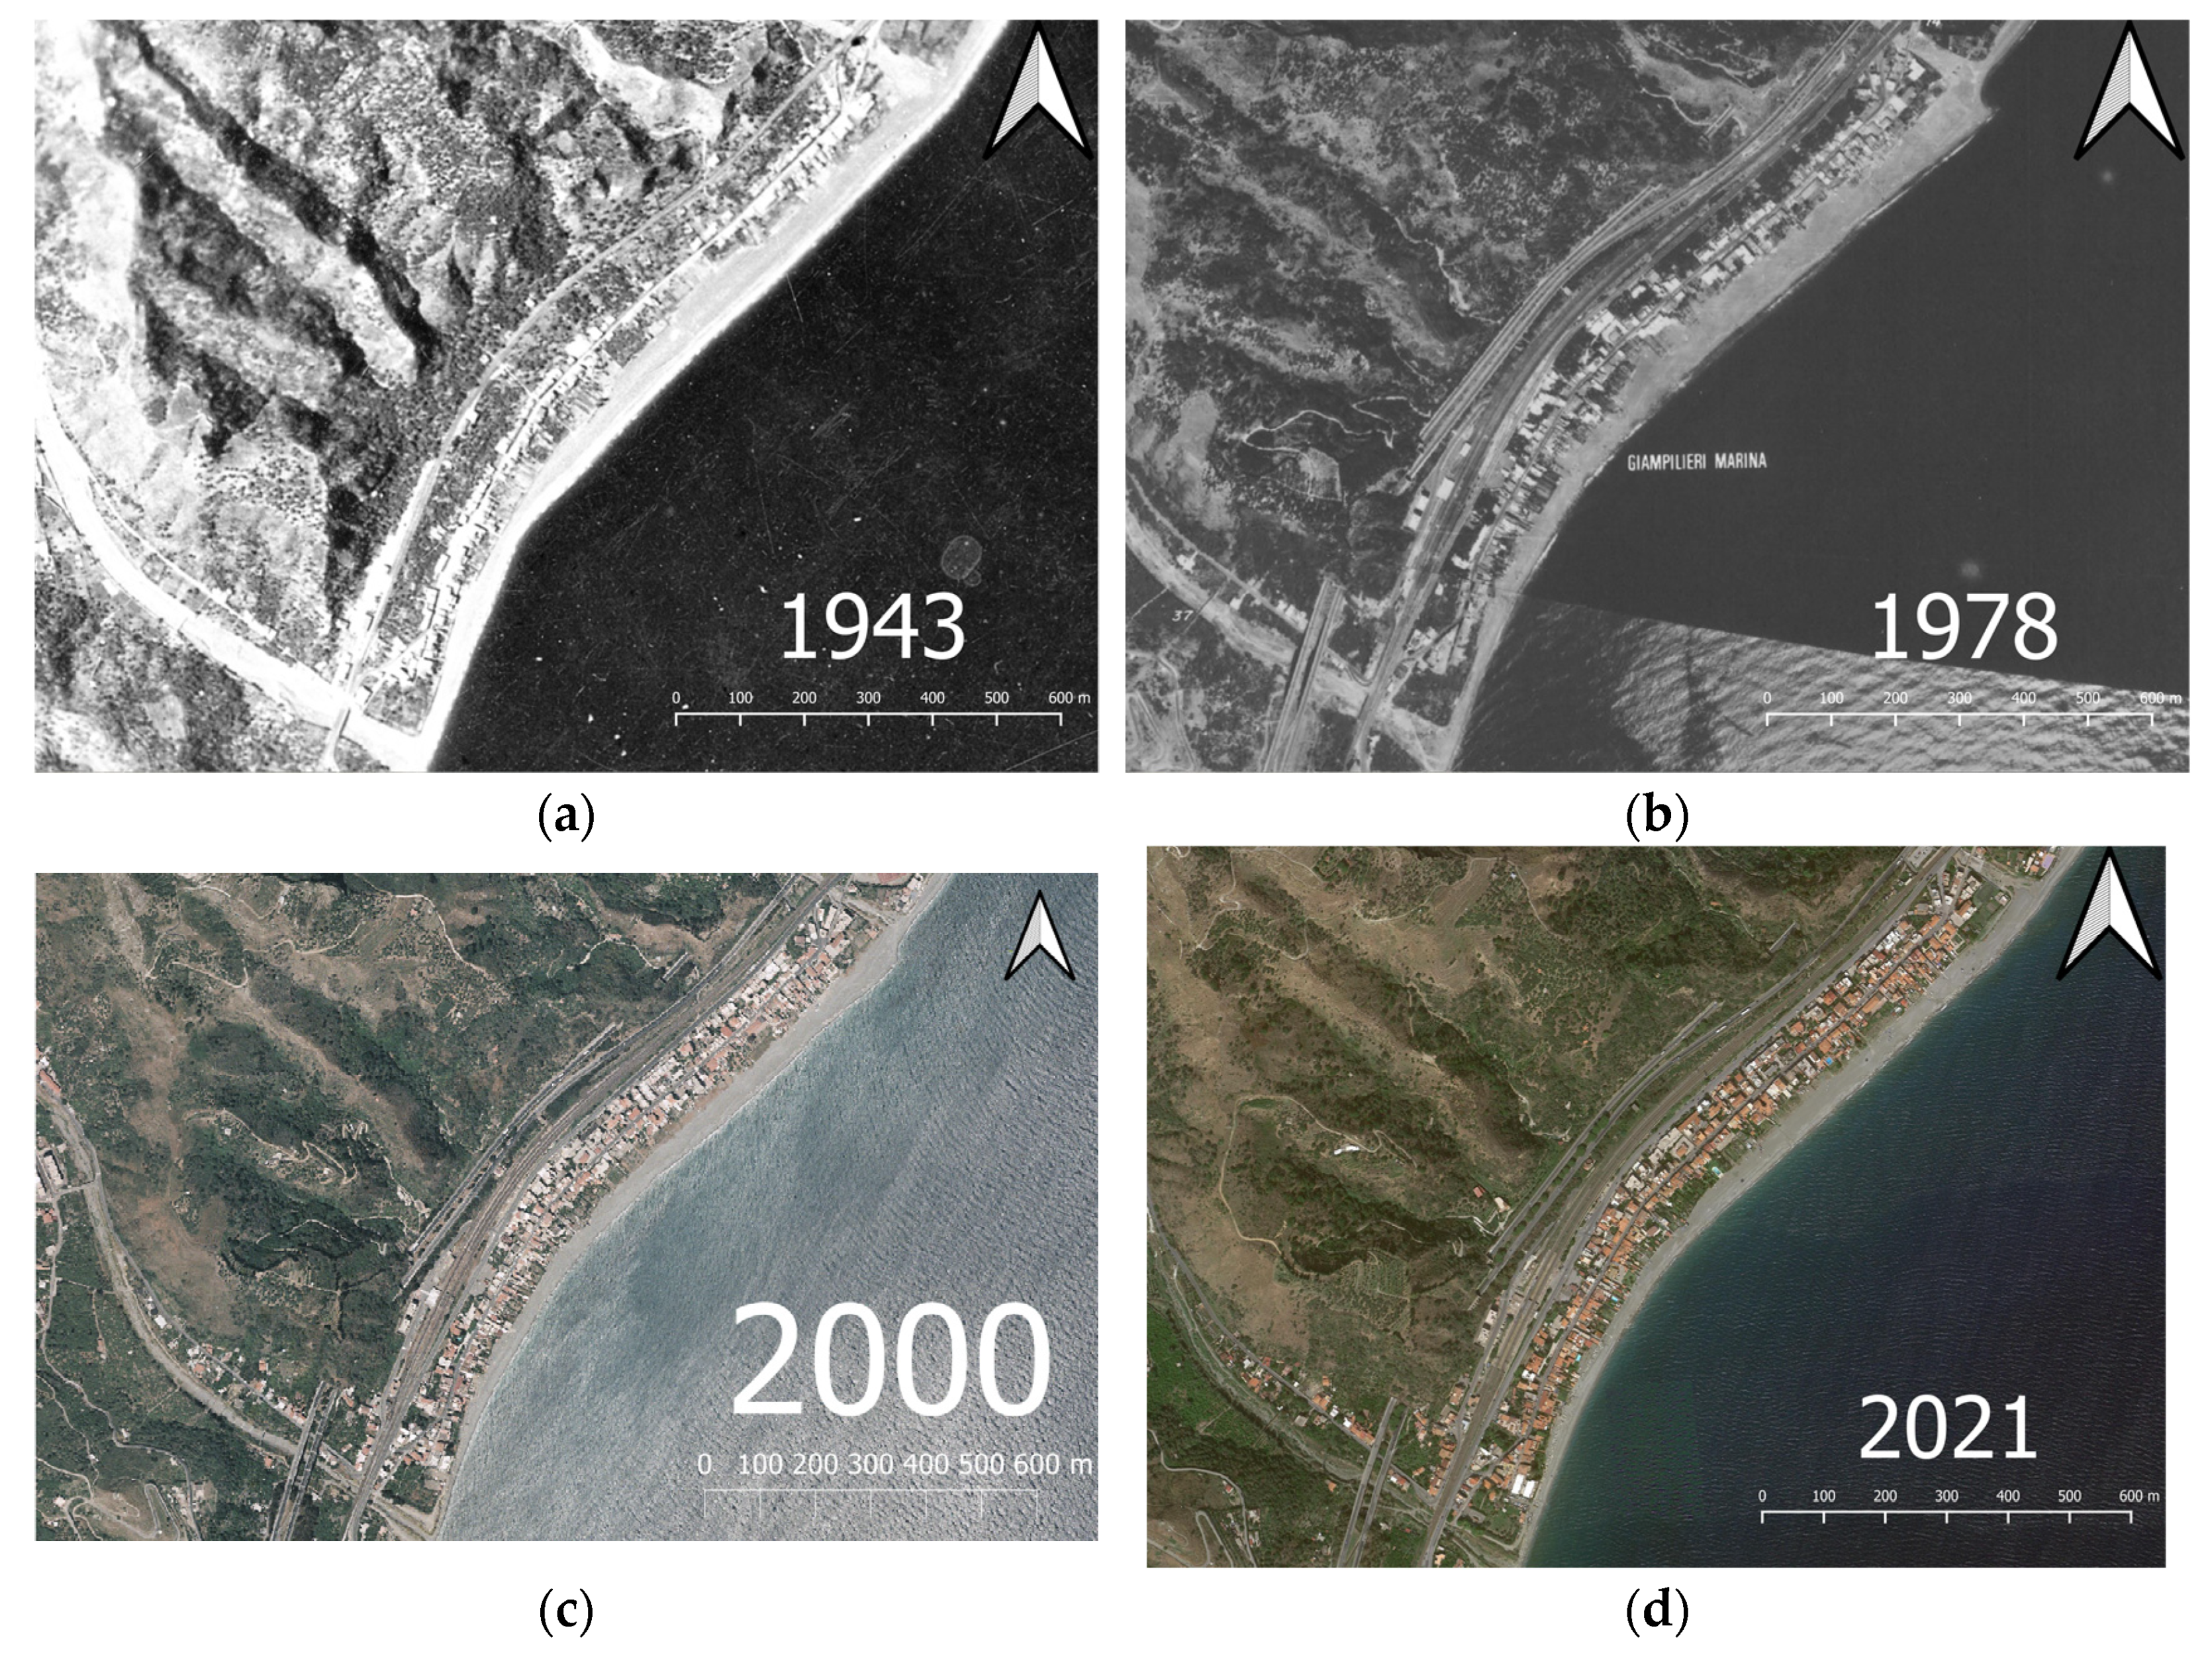
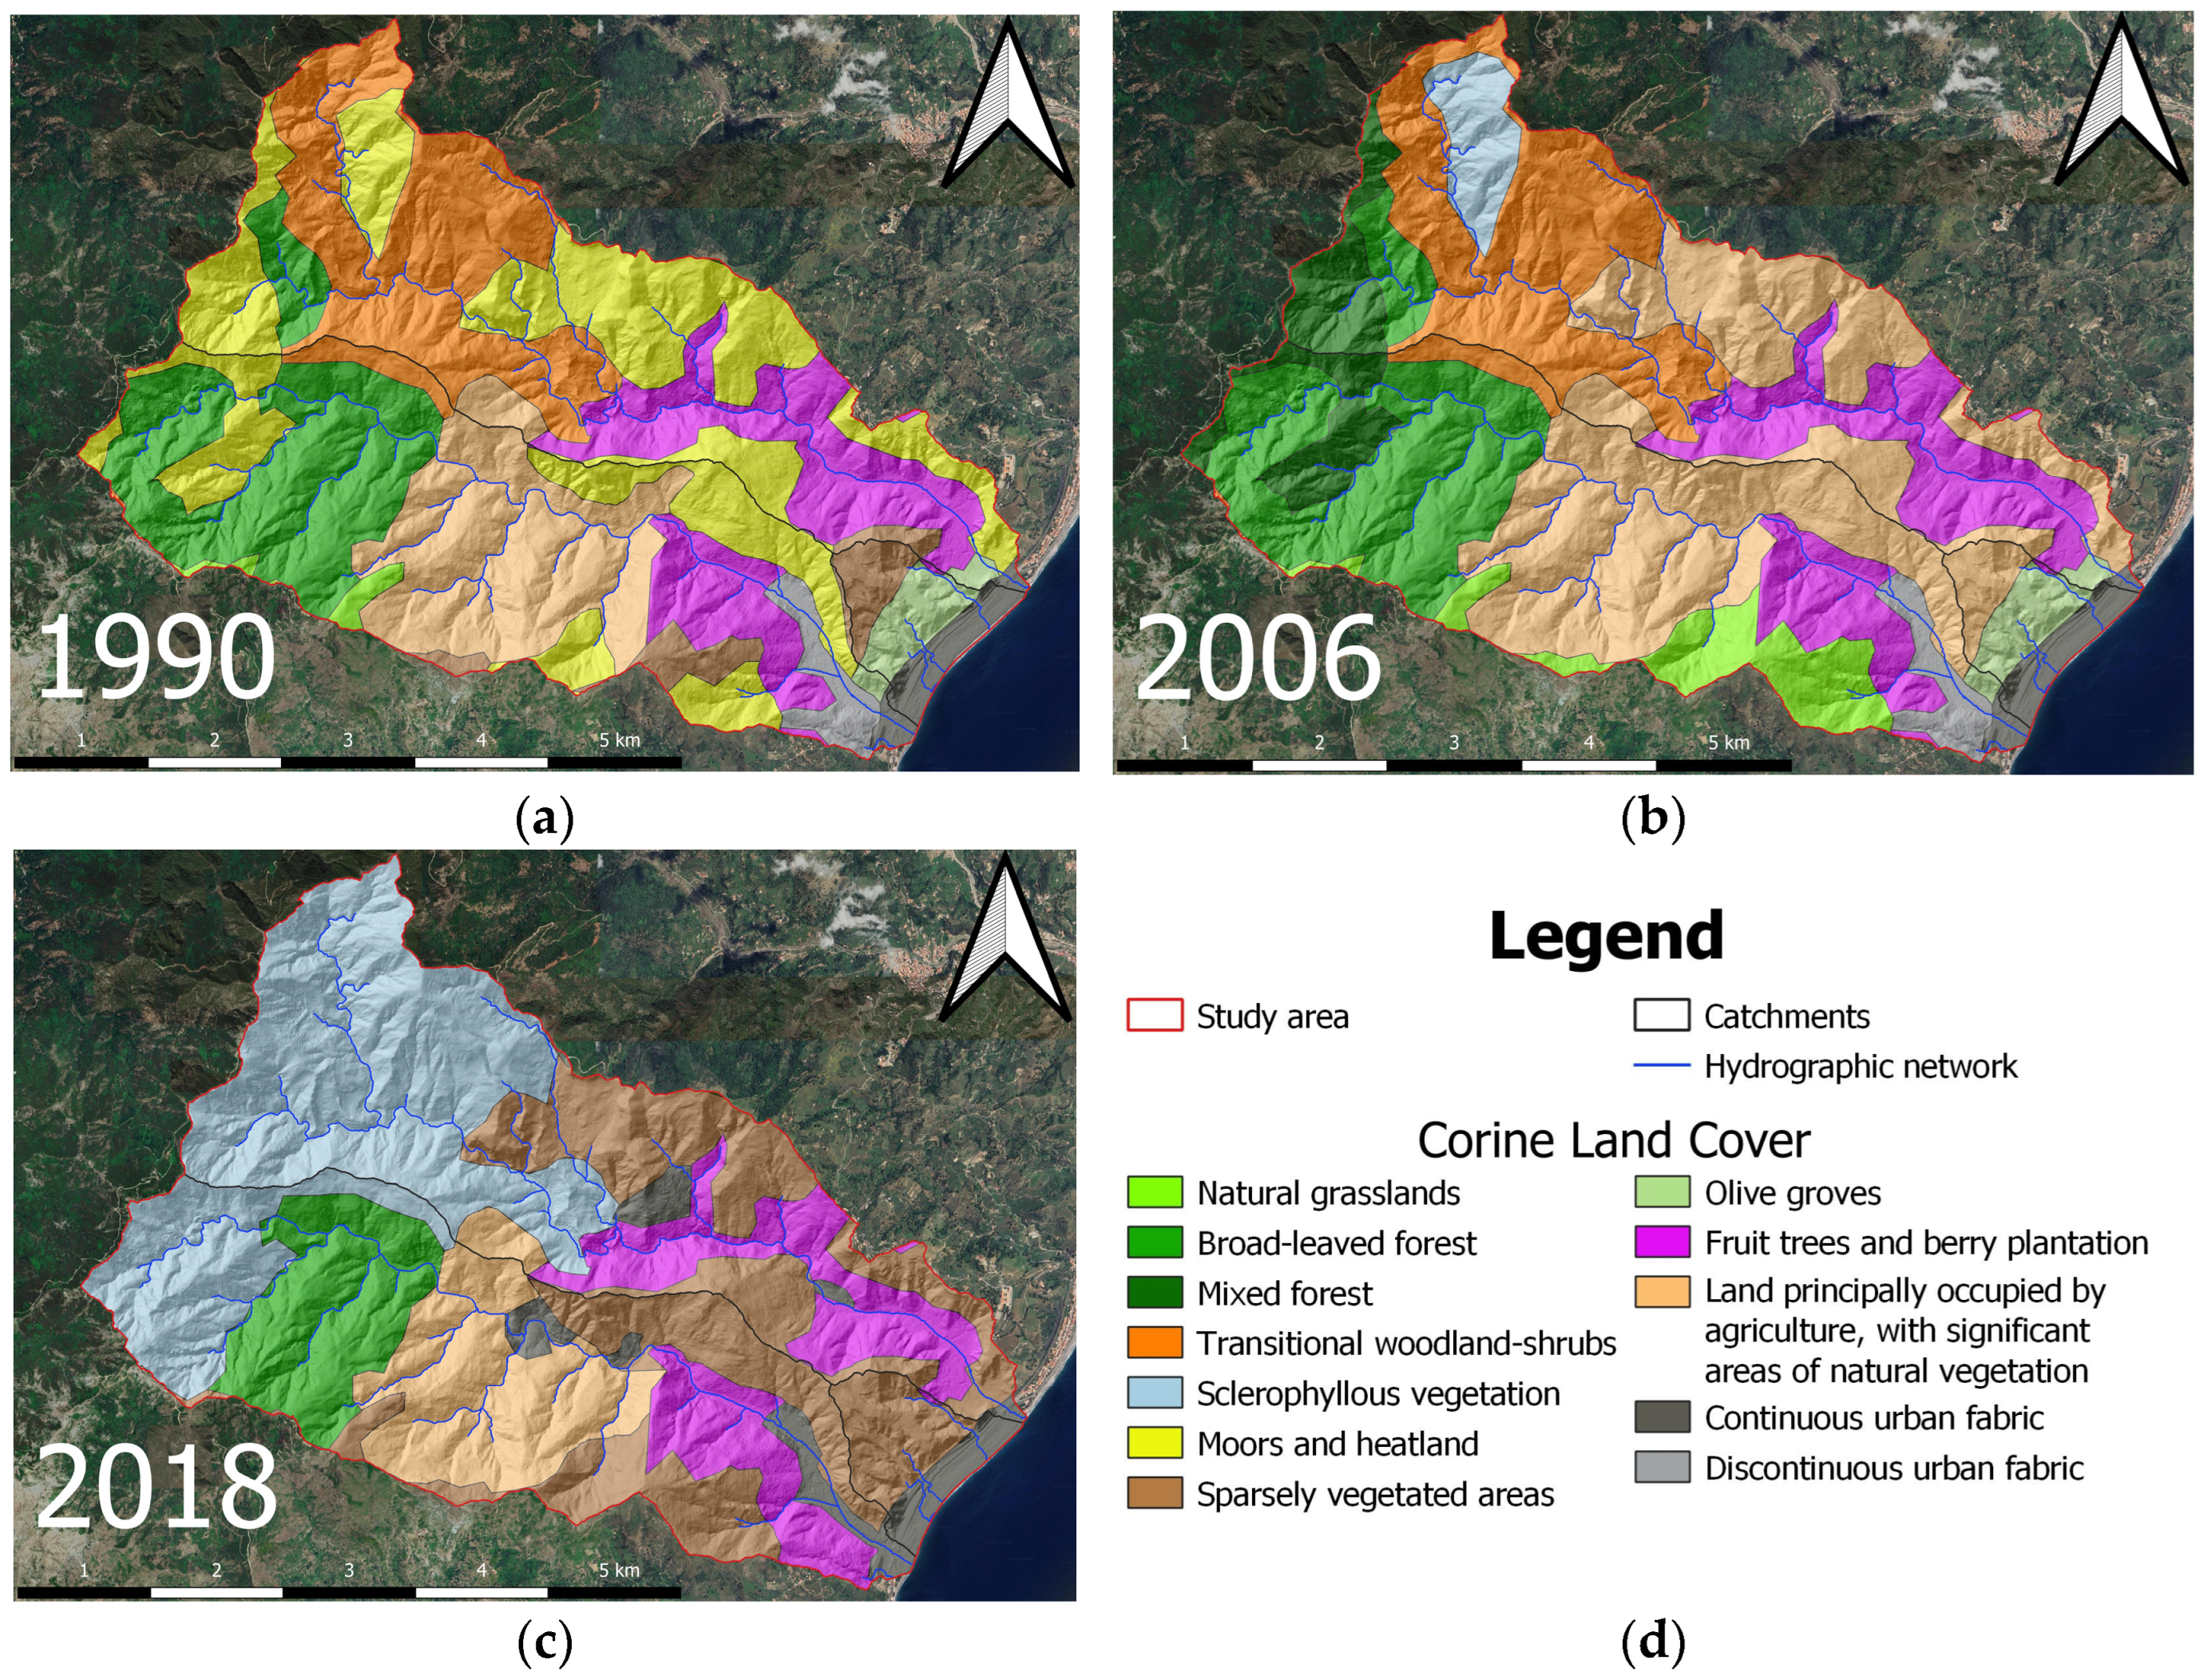
2. Study Area
- a defragmentation and homogenisation process of the territory through a reduction of categories from 11 in 1990 to 6 in 2018;
- an increase of continuous urban settlements (57%) and the disappearance of the discontinuous urban fabric;
- the overall stability of the areas with fruit trees and berry plantations; in contrast, a noticeable disappearance of olive groves, which were previously visible in the hills along the eastern coast;
- the reduction of the territories covered by broad-leaved forests (−40%) and occupied by agriculture (−12%);
- the disappearance of natural grasslands, moors, shrubs, and mixed forests and heaths and bushes in favour of sclerophyllous vegetation (919%) and areas with sparse vegetation (674%).
3. Materials and Methods
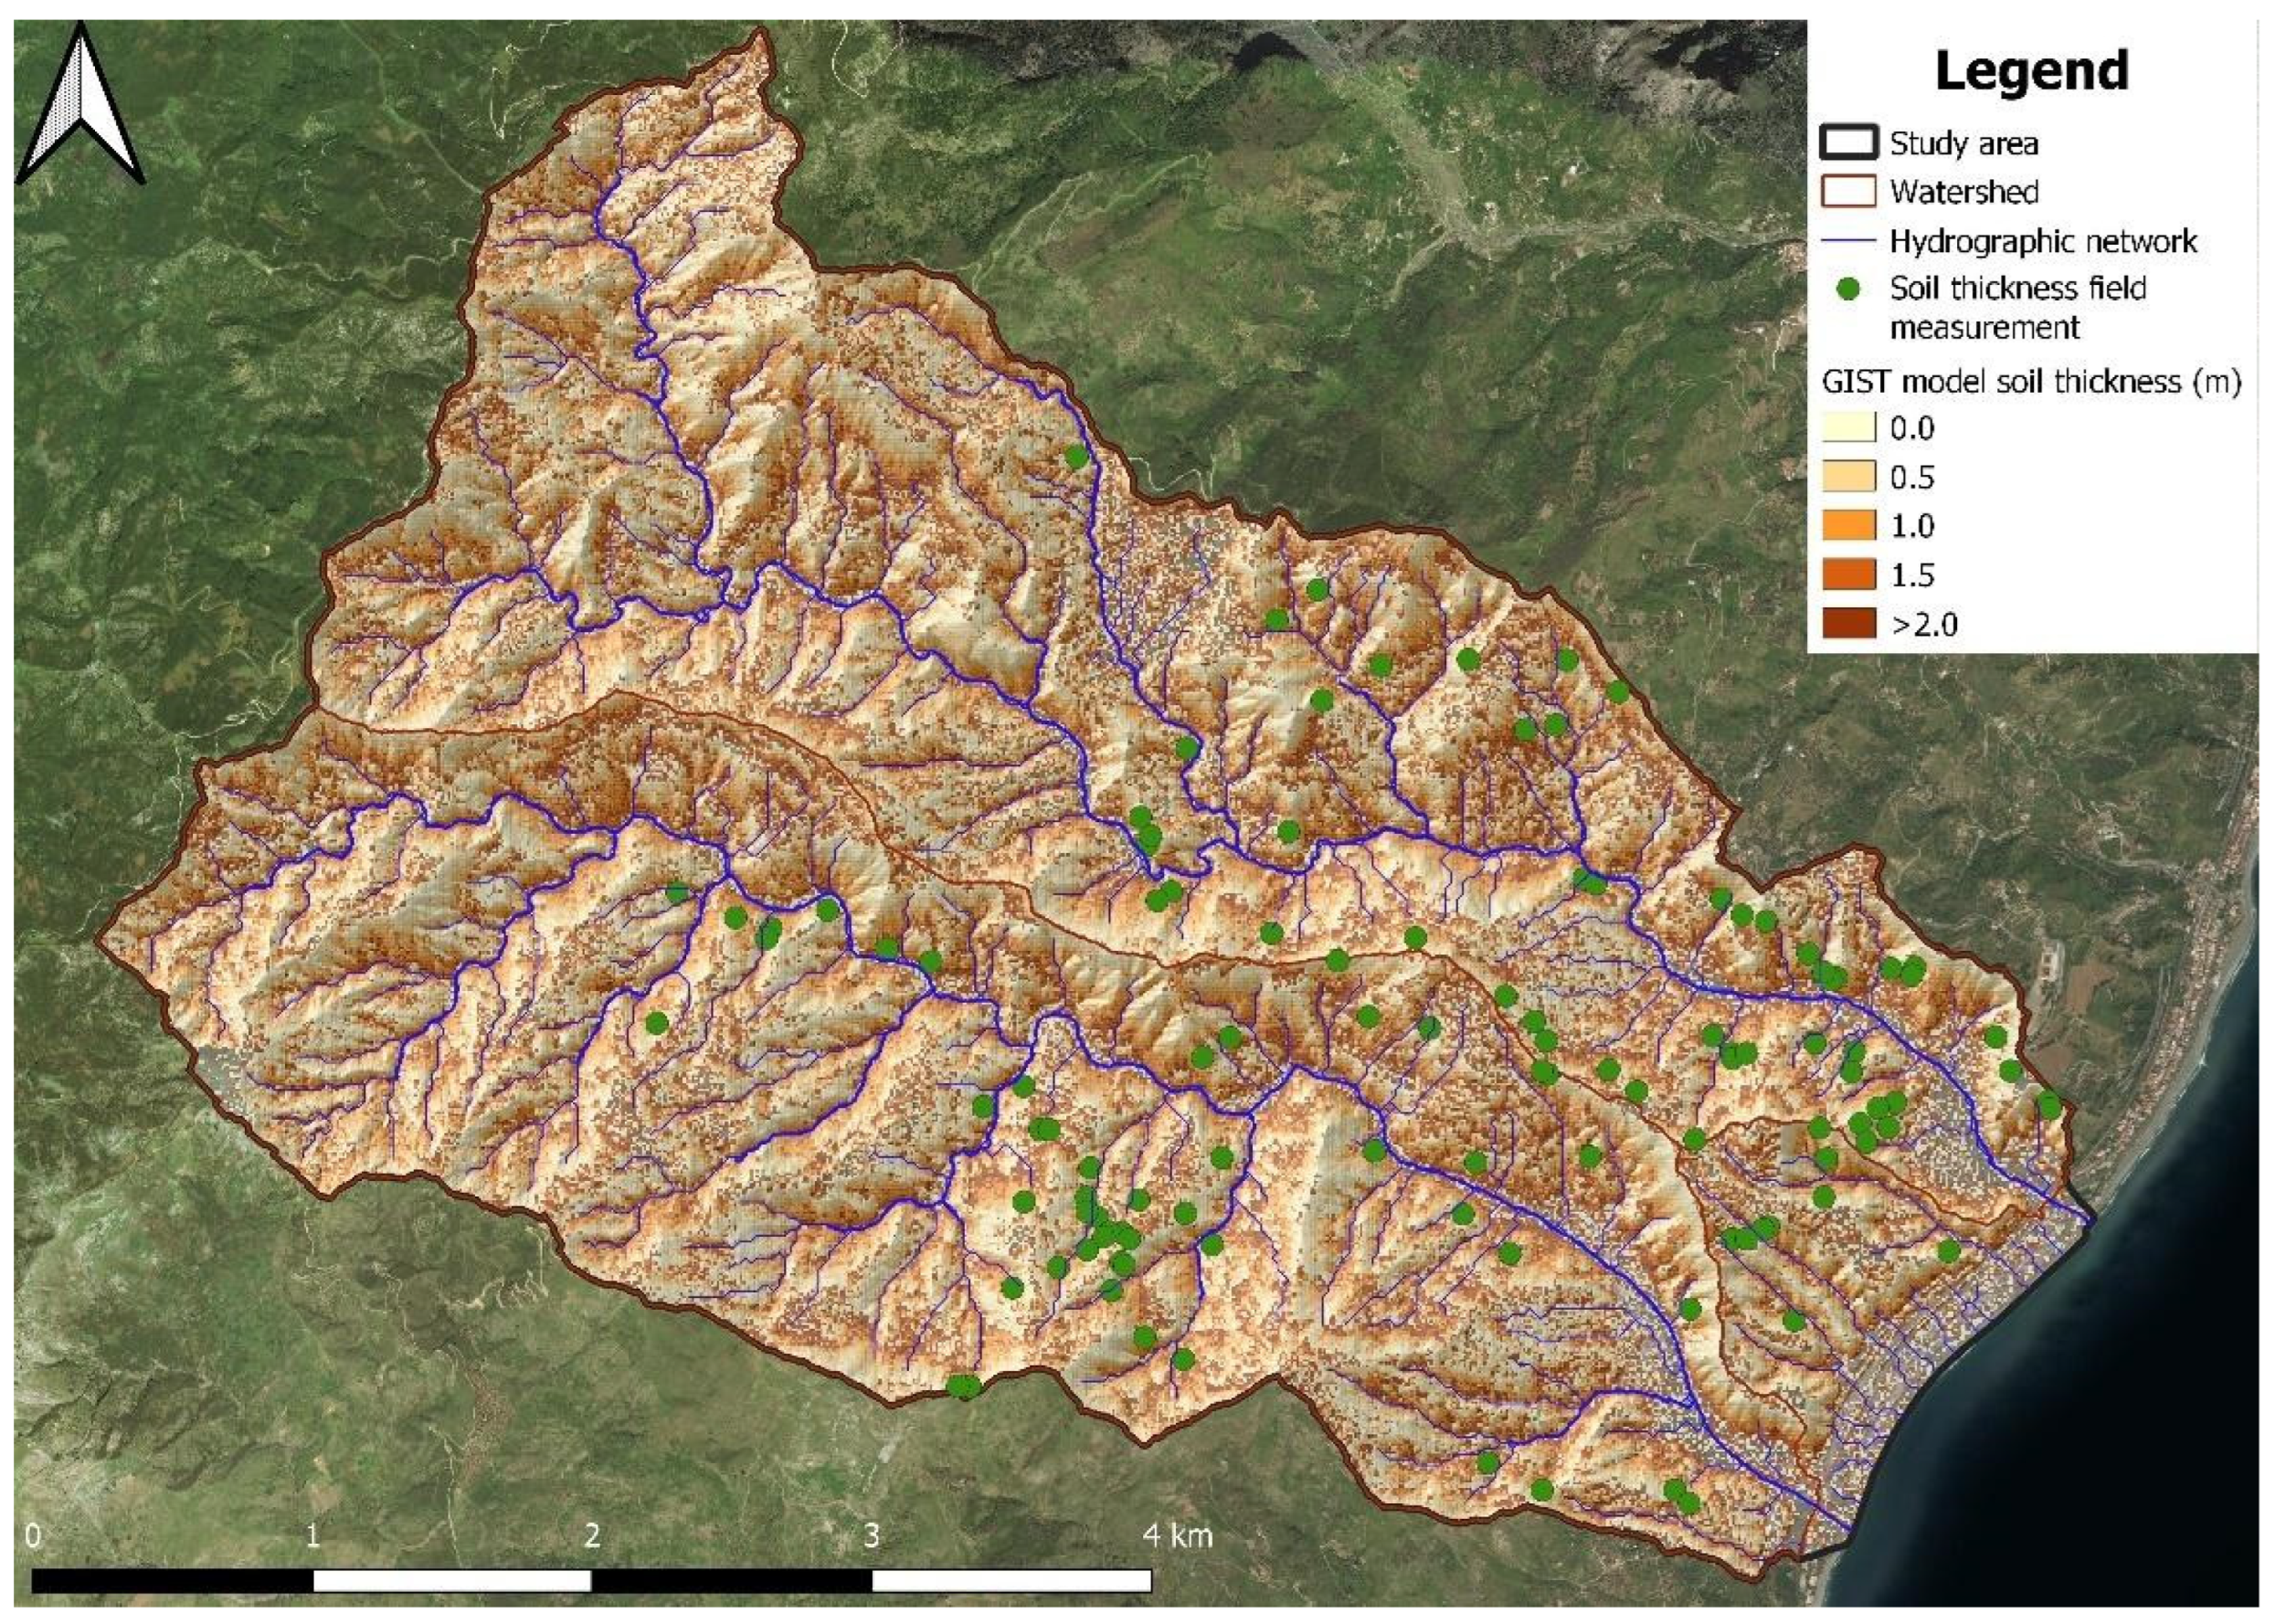
3.1. Dataset
- the DTM through the “r.slope.aspect” and “r.flow” tools, the GRASS algorithms available in the QGIS free open source suite;
- the slope values;
- the lithotechnical characteristics in correspondence with the inventoried debris flows.
3.2. Hazard Assessment
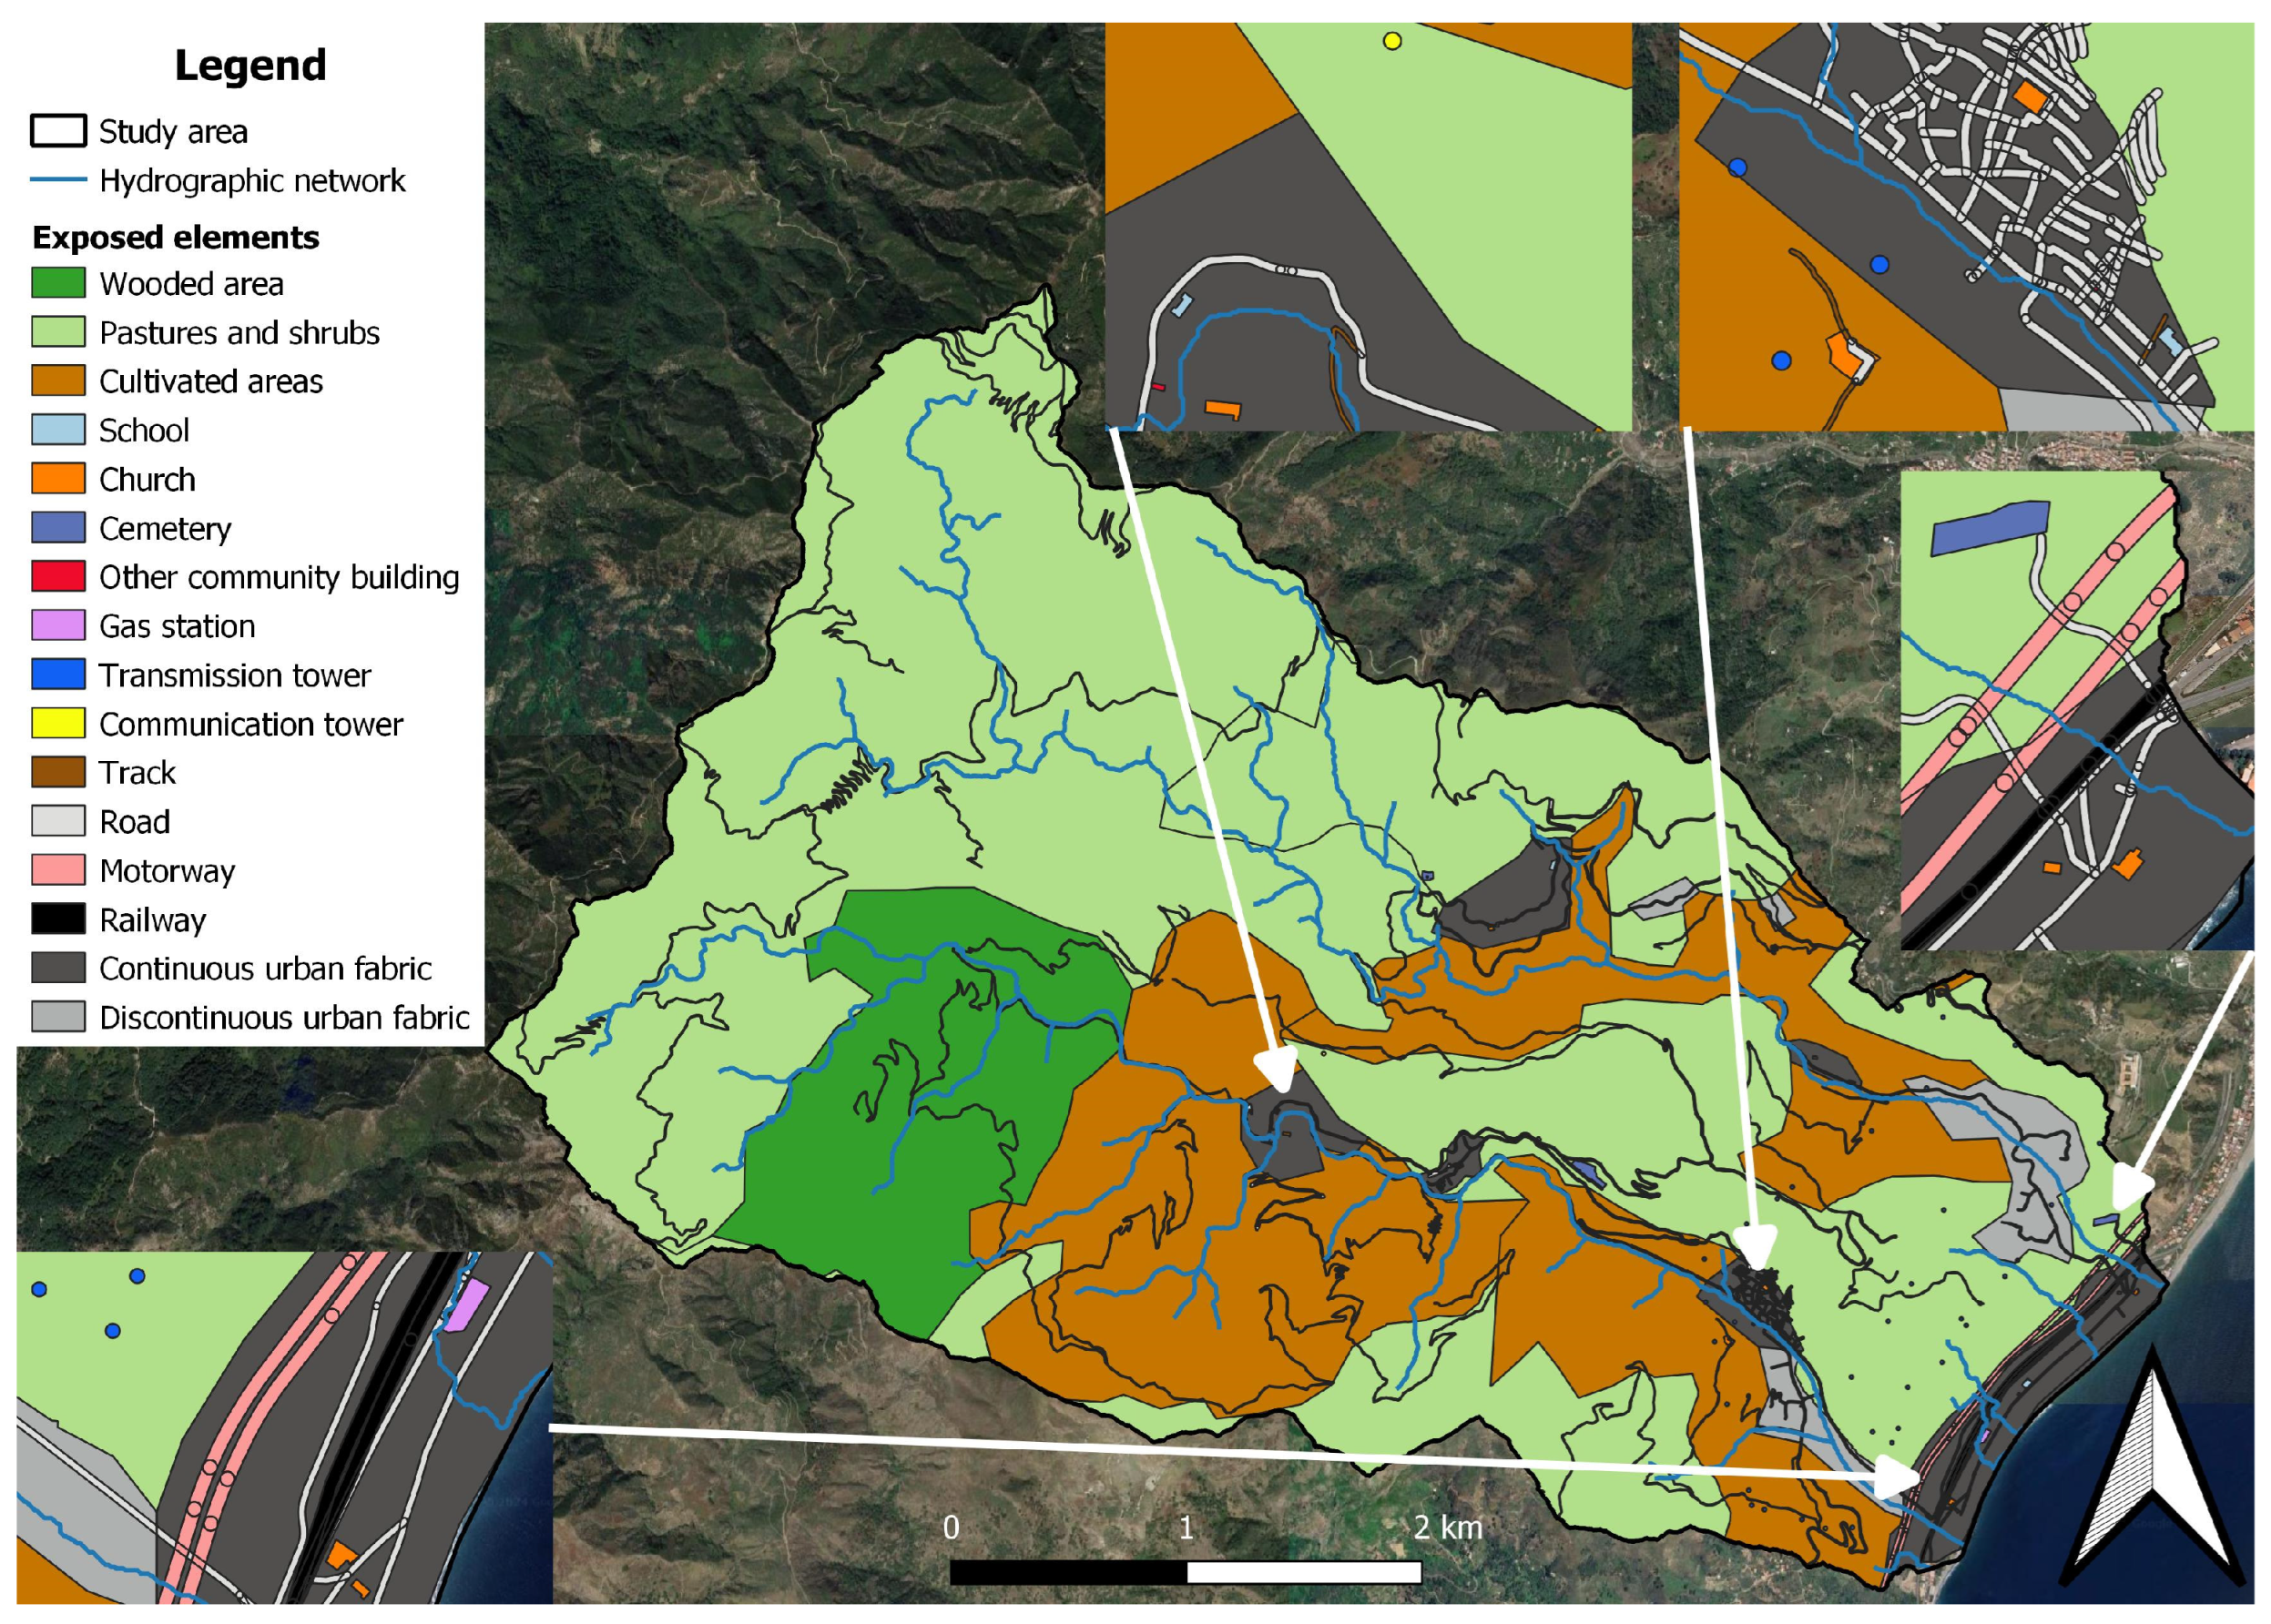
3.3. Exposure Assessment
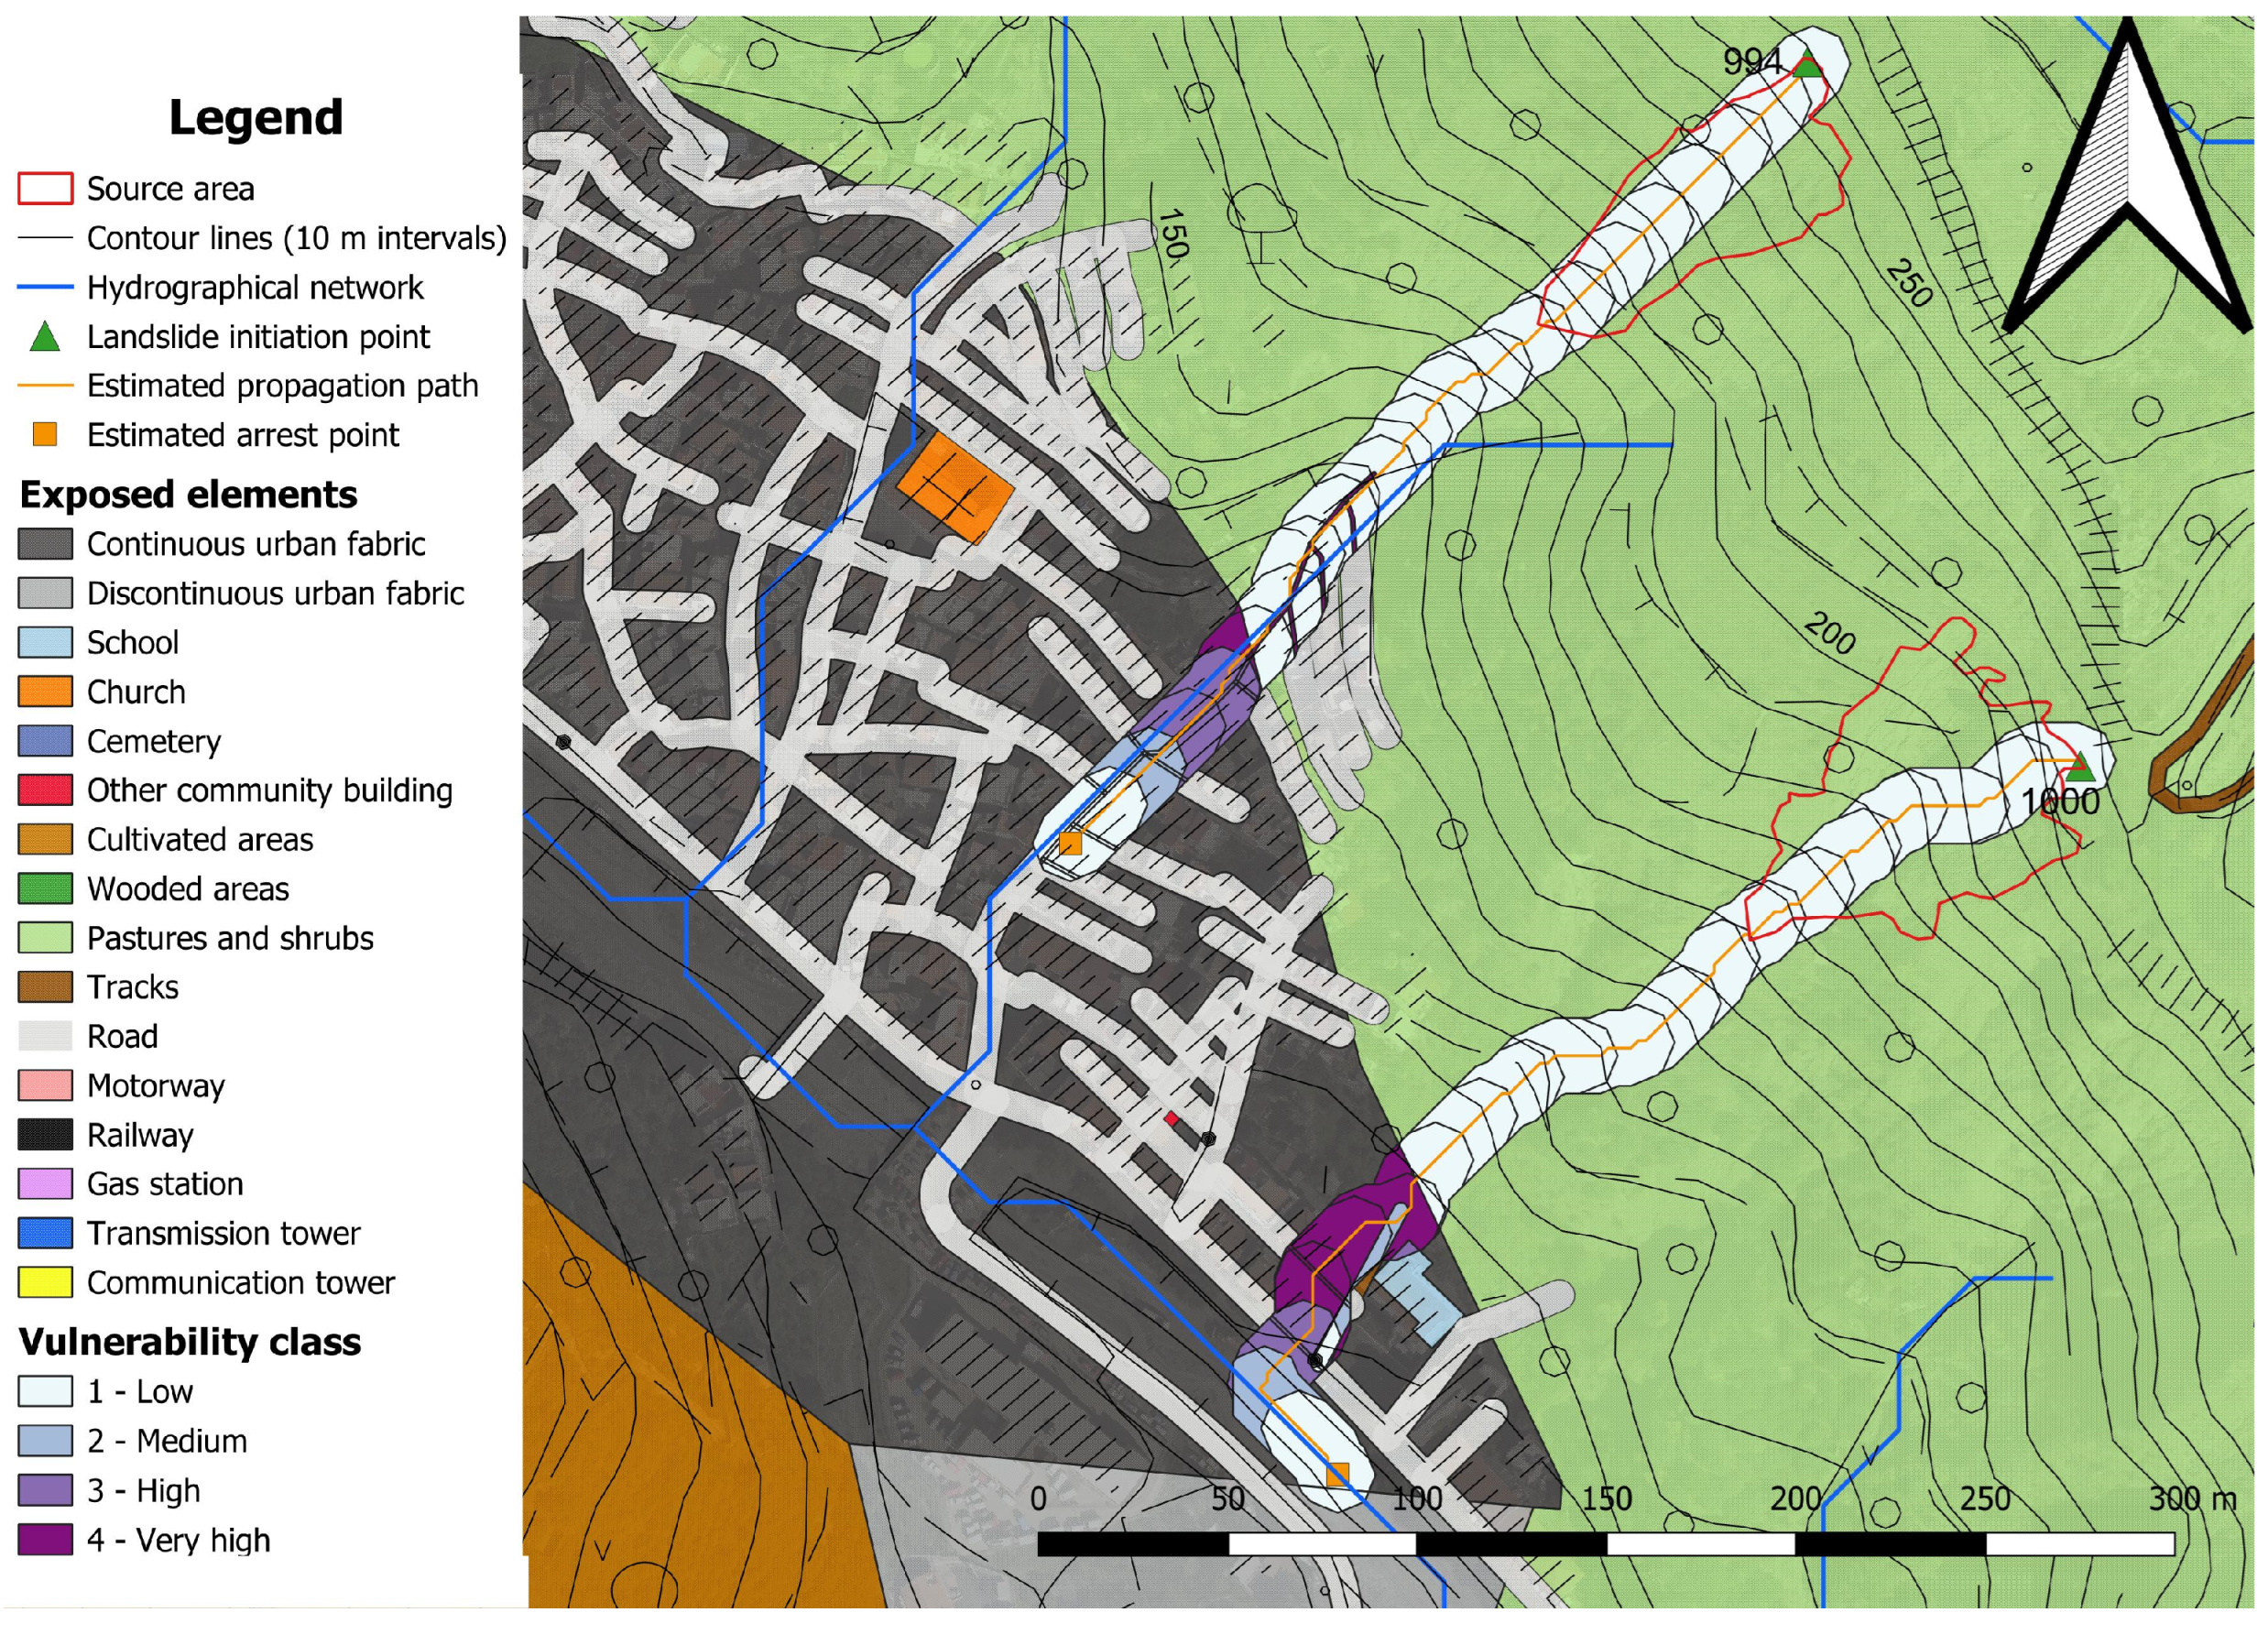
3.4. Vulnerability Assessment
- buildings of public importance (i.e., schools) and/or strategic buildings and discontinuous urban fabric are supposed to have better quality building characteristics (e.g., due to a more recent construction age, according to specific Technical Codes and Regulations) than buildings in historical centres and churches [71], as well as in the more ancient villages that constitute a continuous urban fabric;
- viaducts/bridges and tunnels make motorways less vulnerable than ordinary roads, because those artefacts are generally not impacted by mobilised materials in cases of shallow landslides;
- the fragility of train tracks makes railways more vulnerable than ordinary roads.
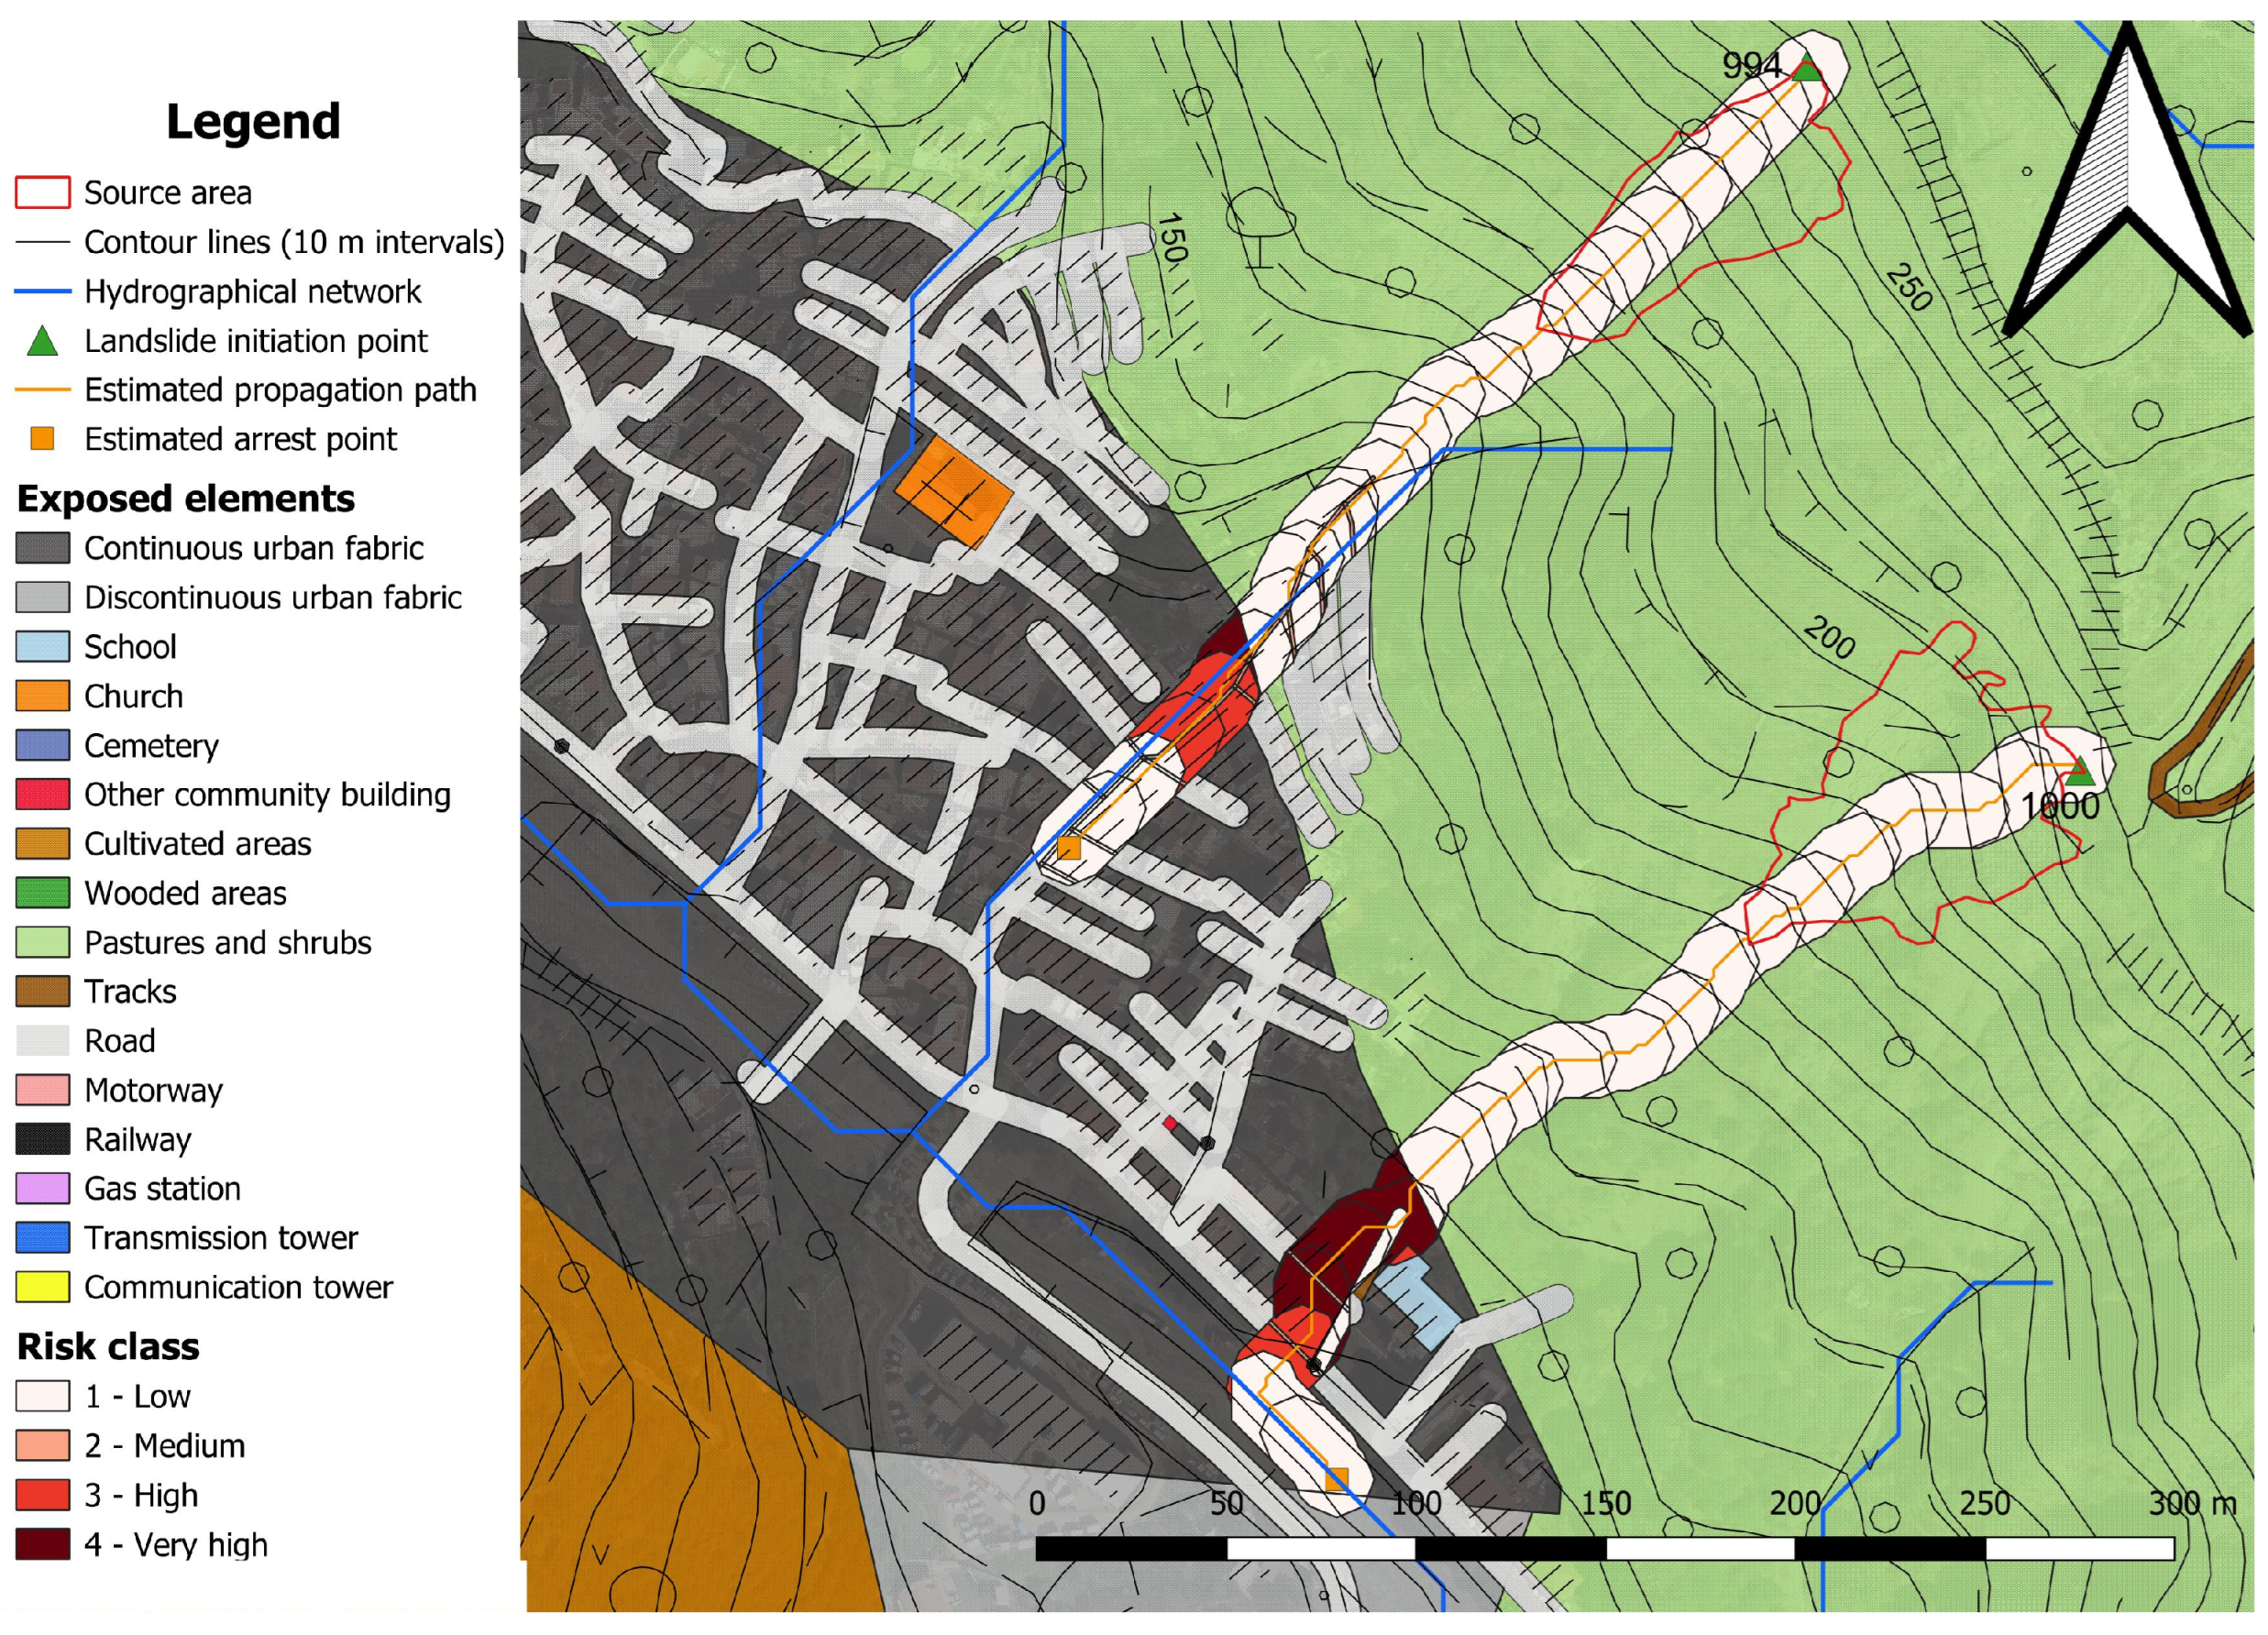
3.5. Risk Assessment
4. Results and Discussion
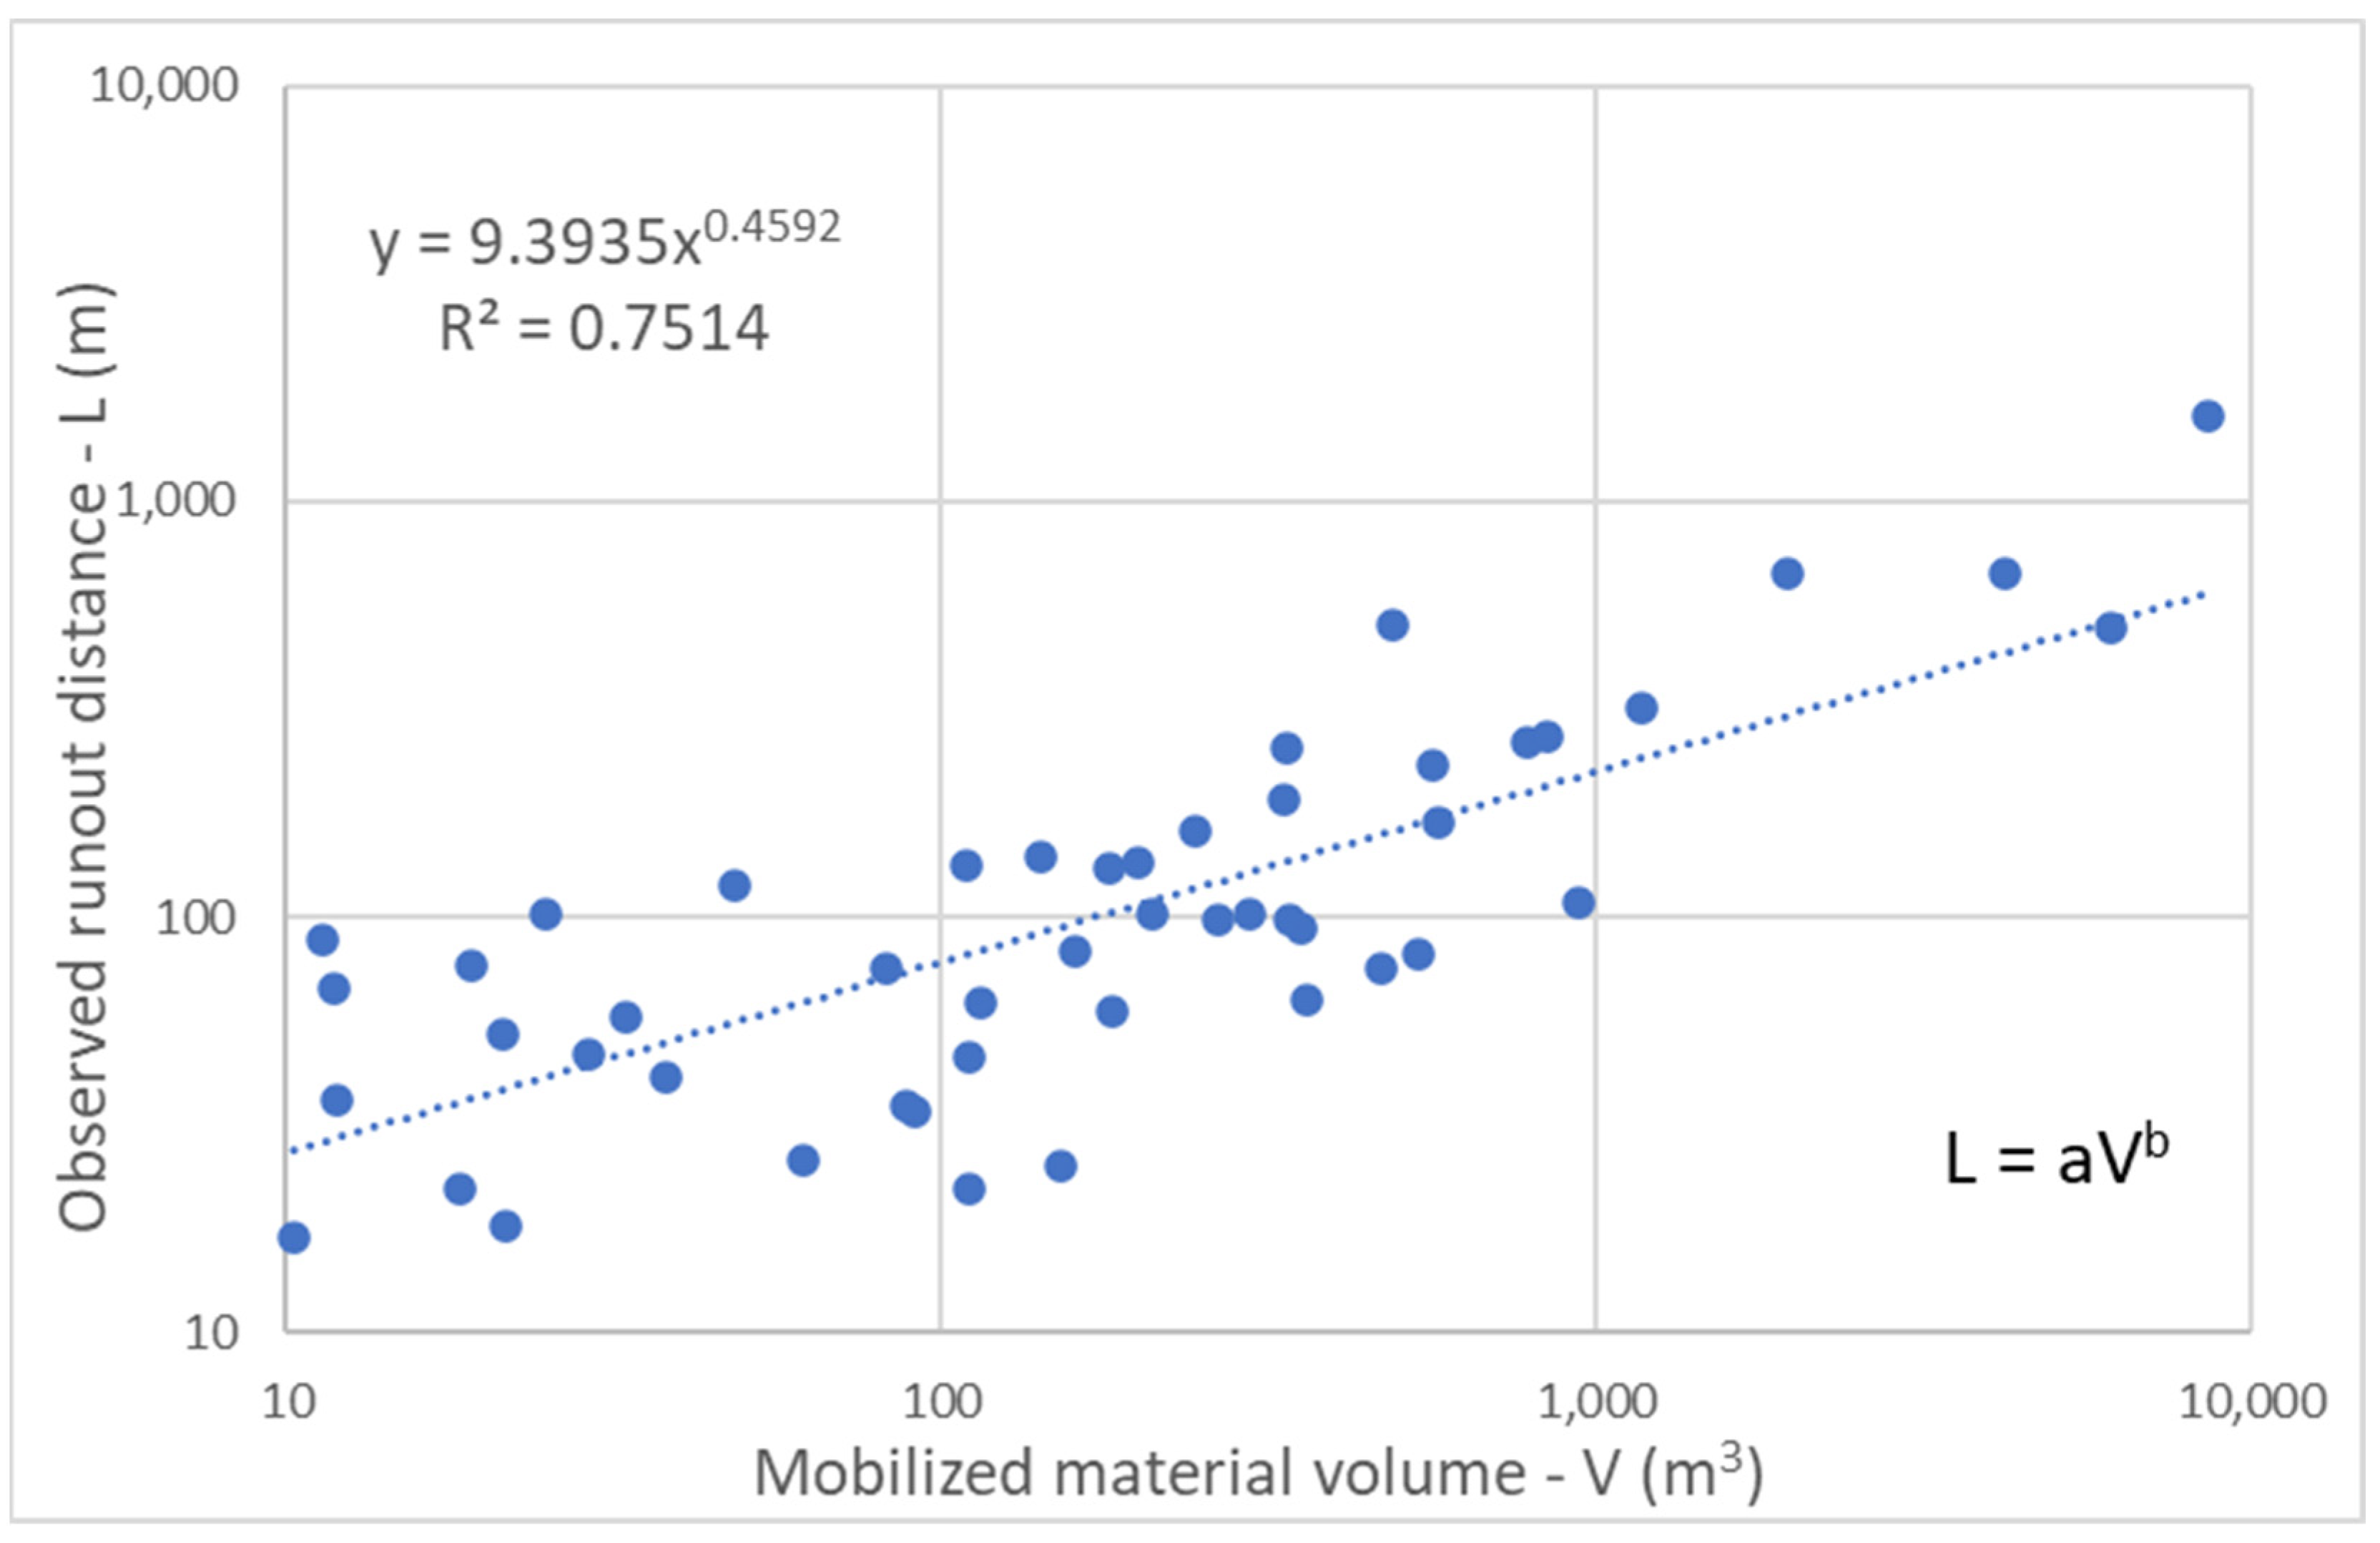
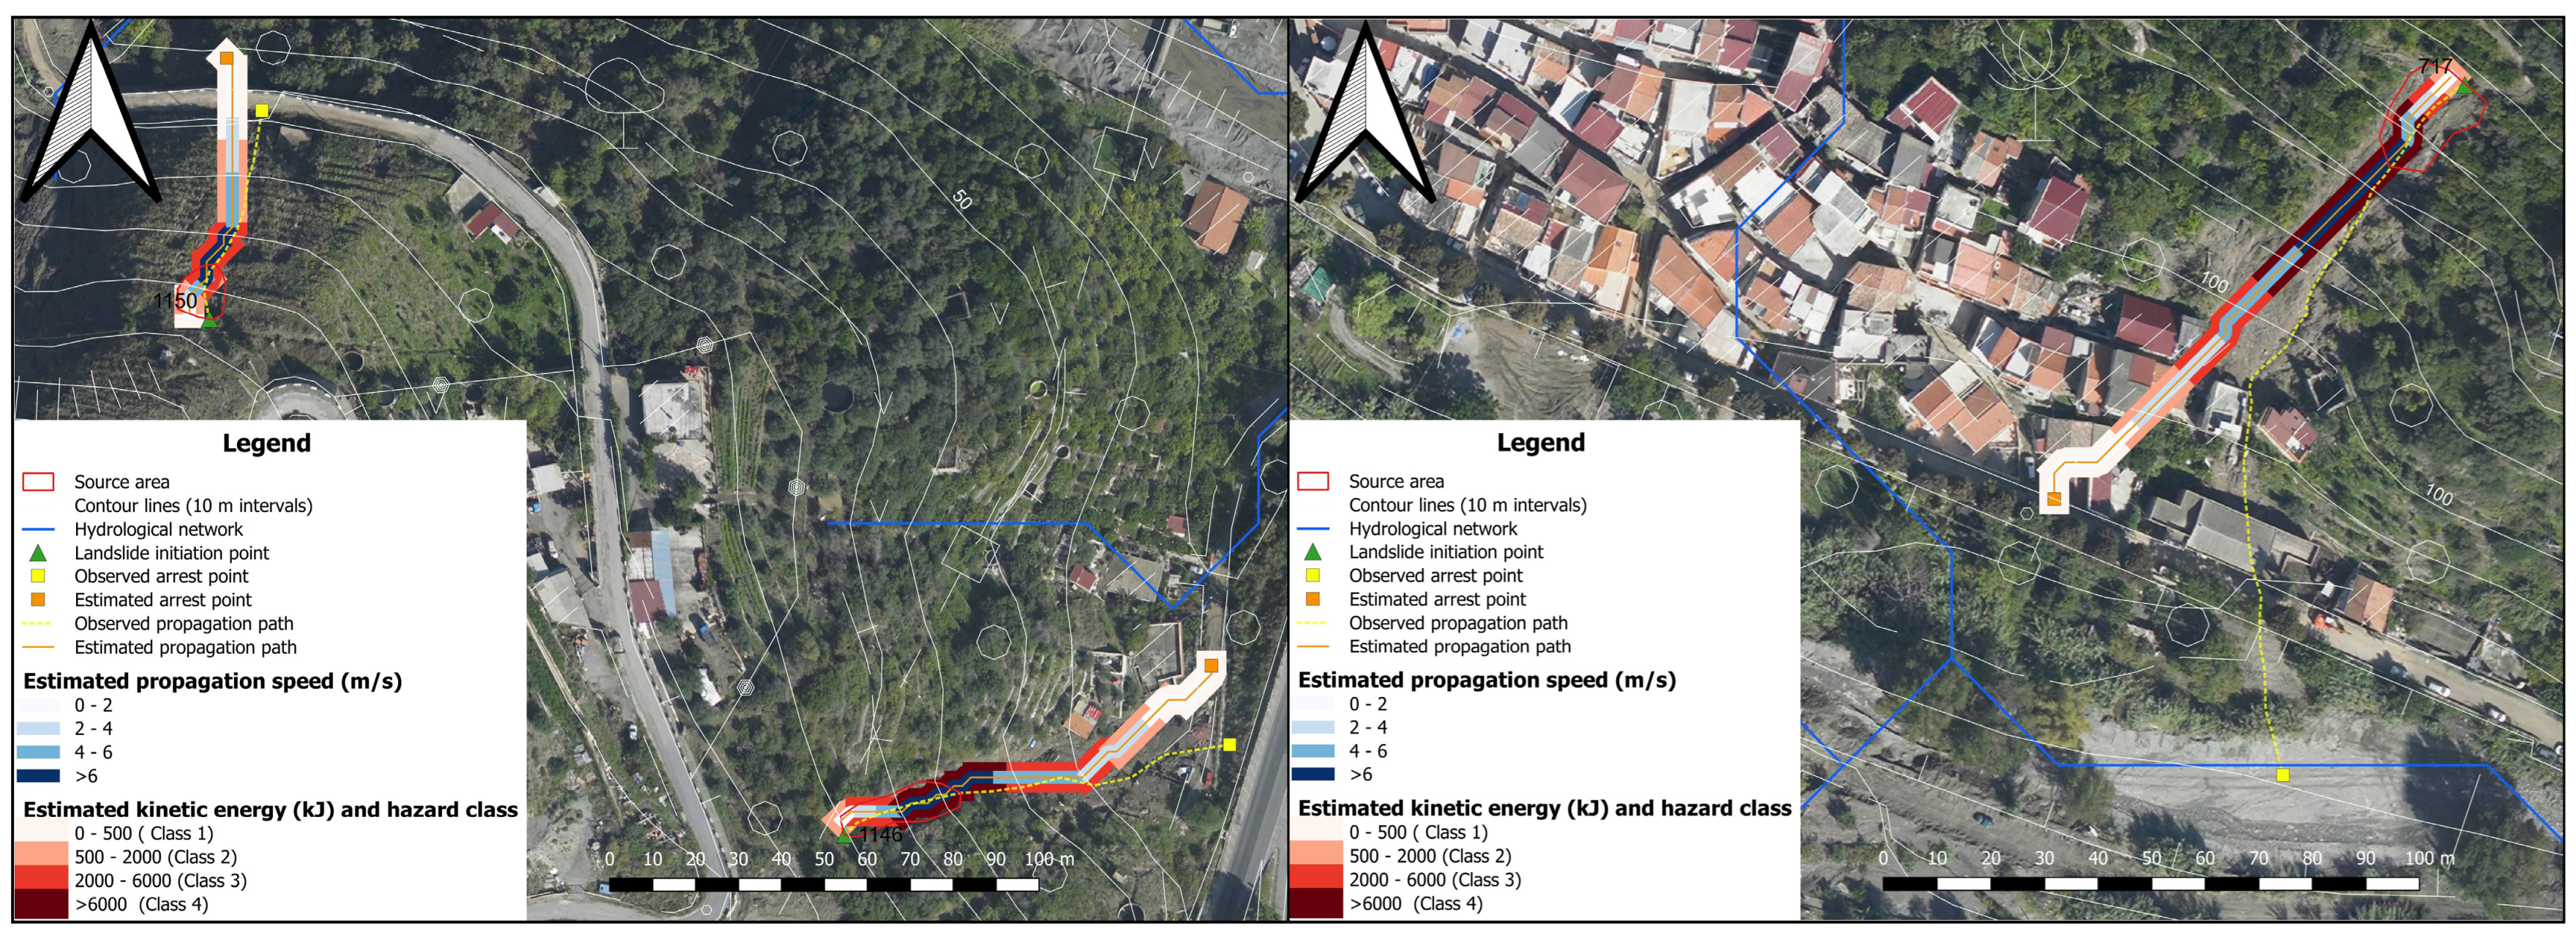
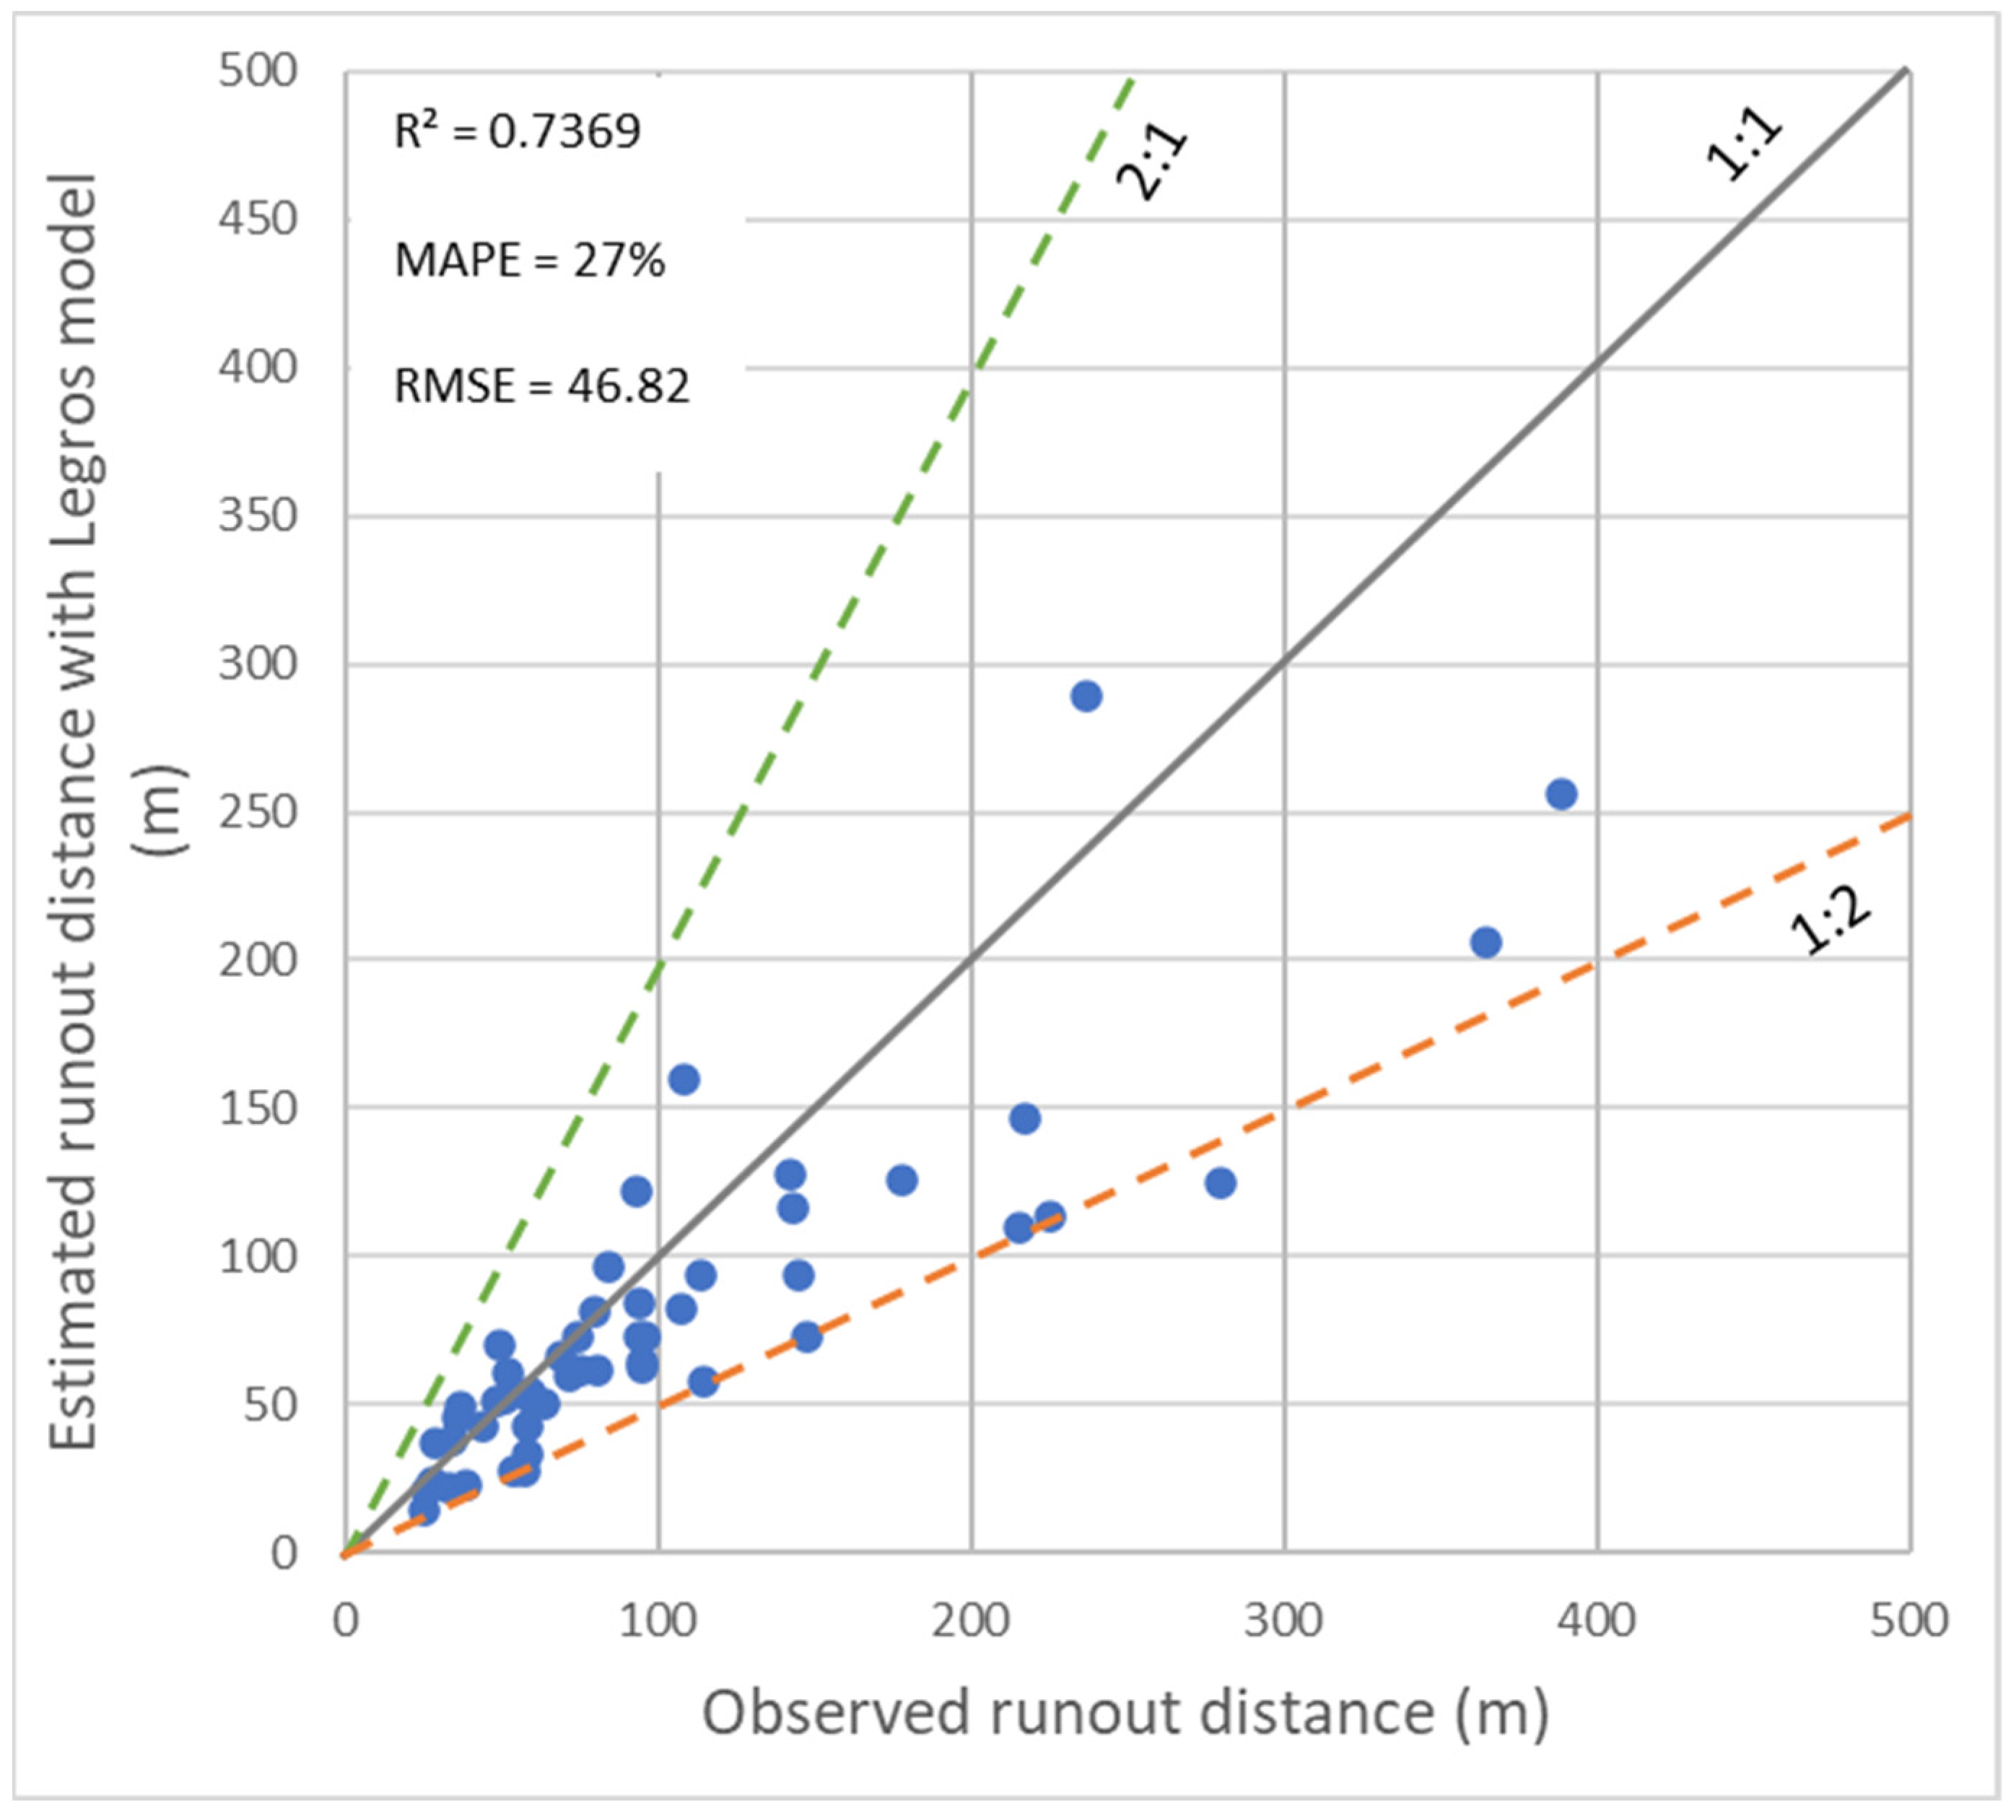
4.1. Runout Assessment Result
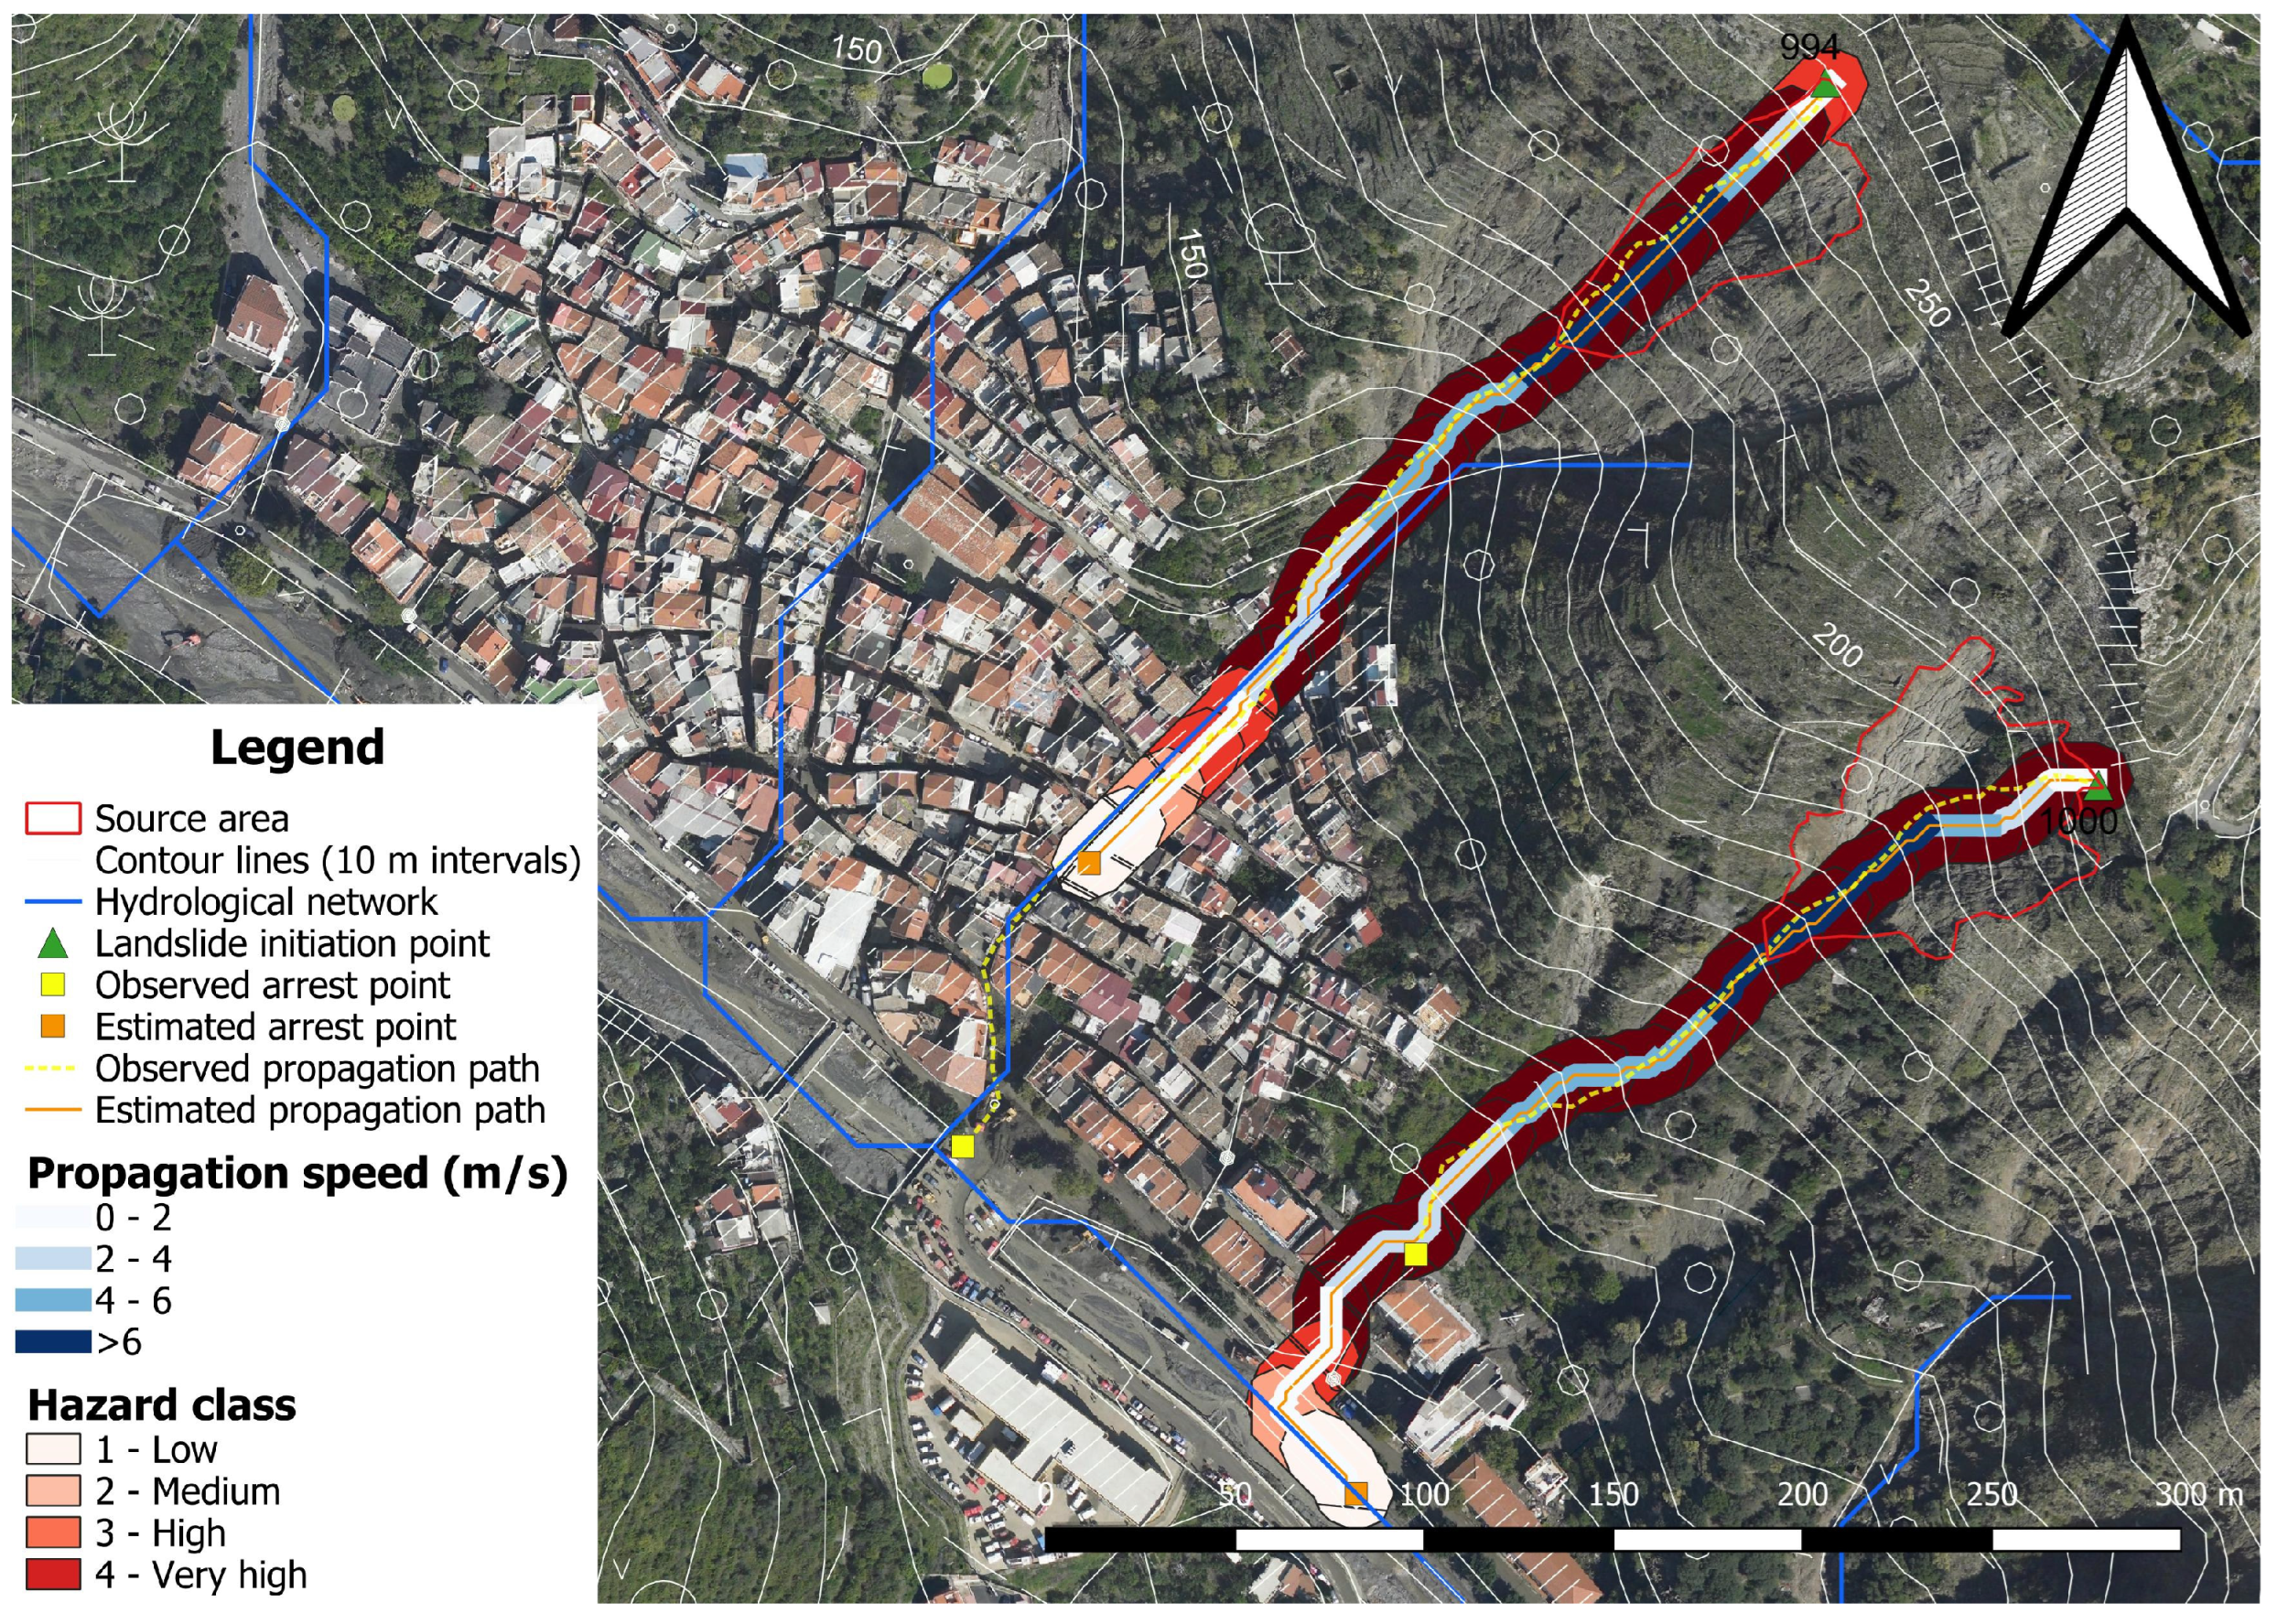
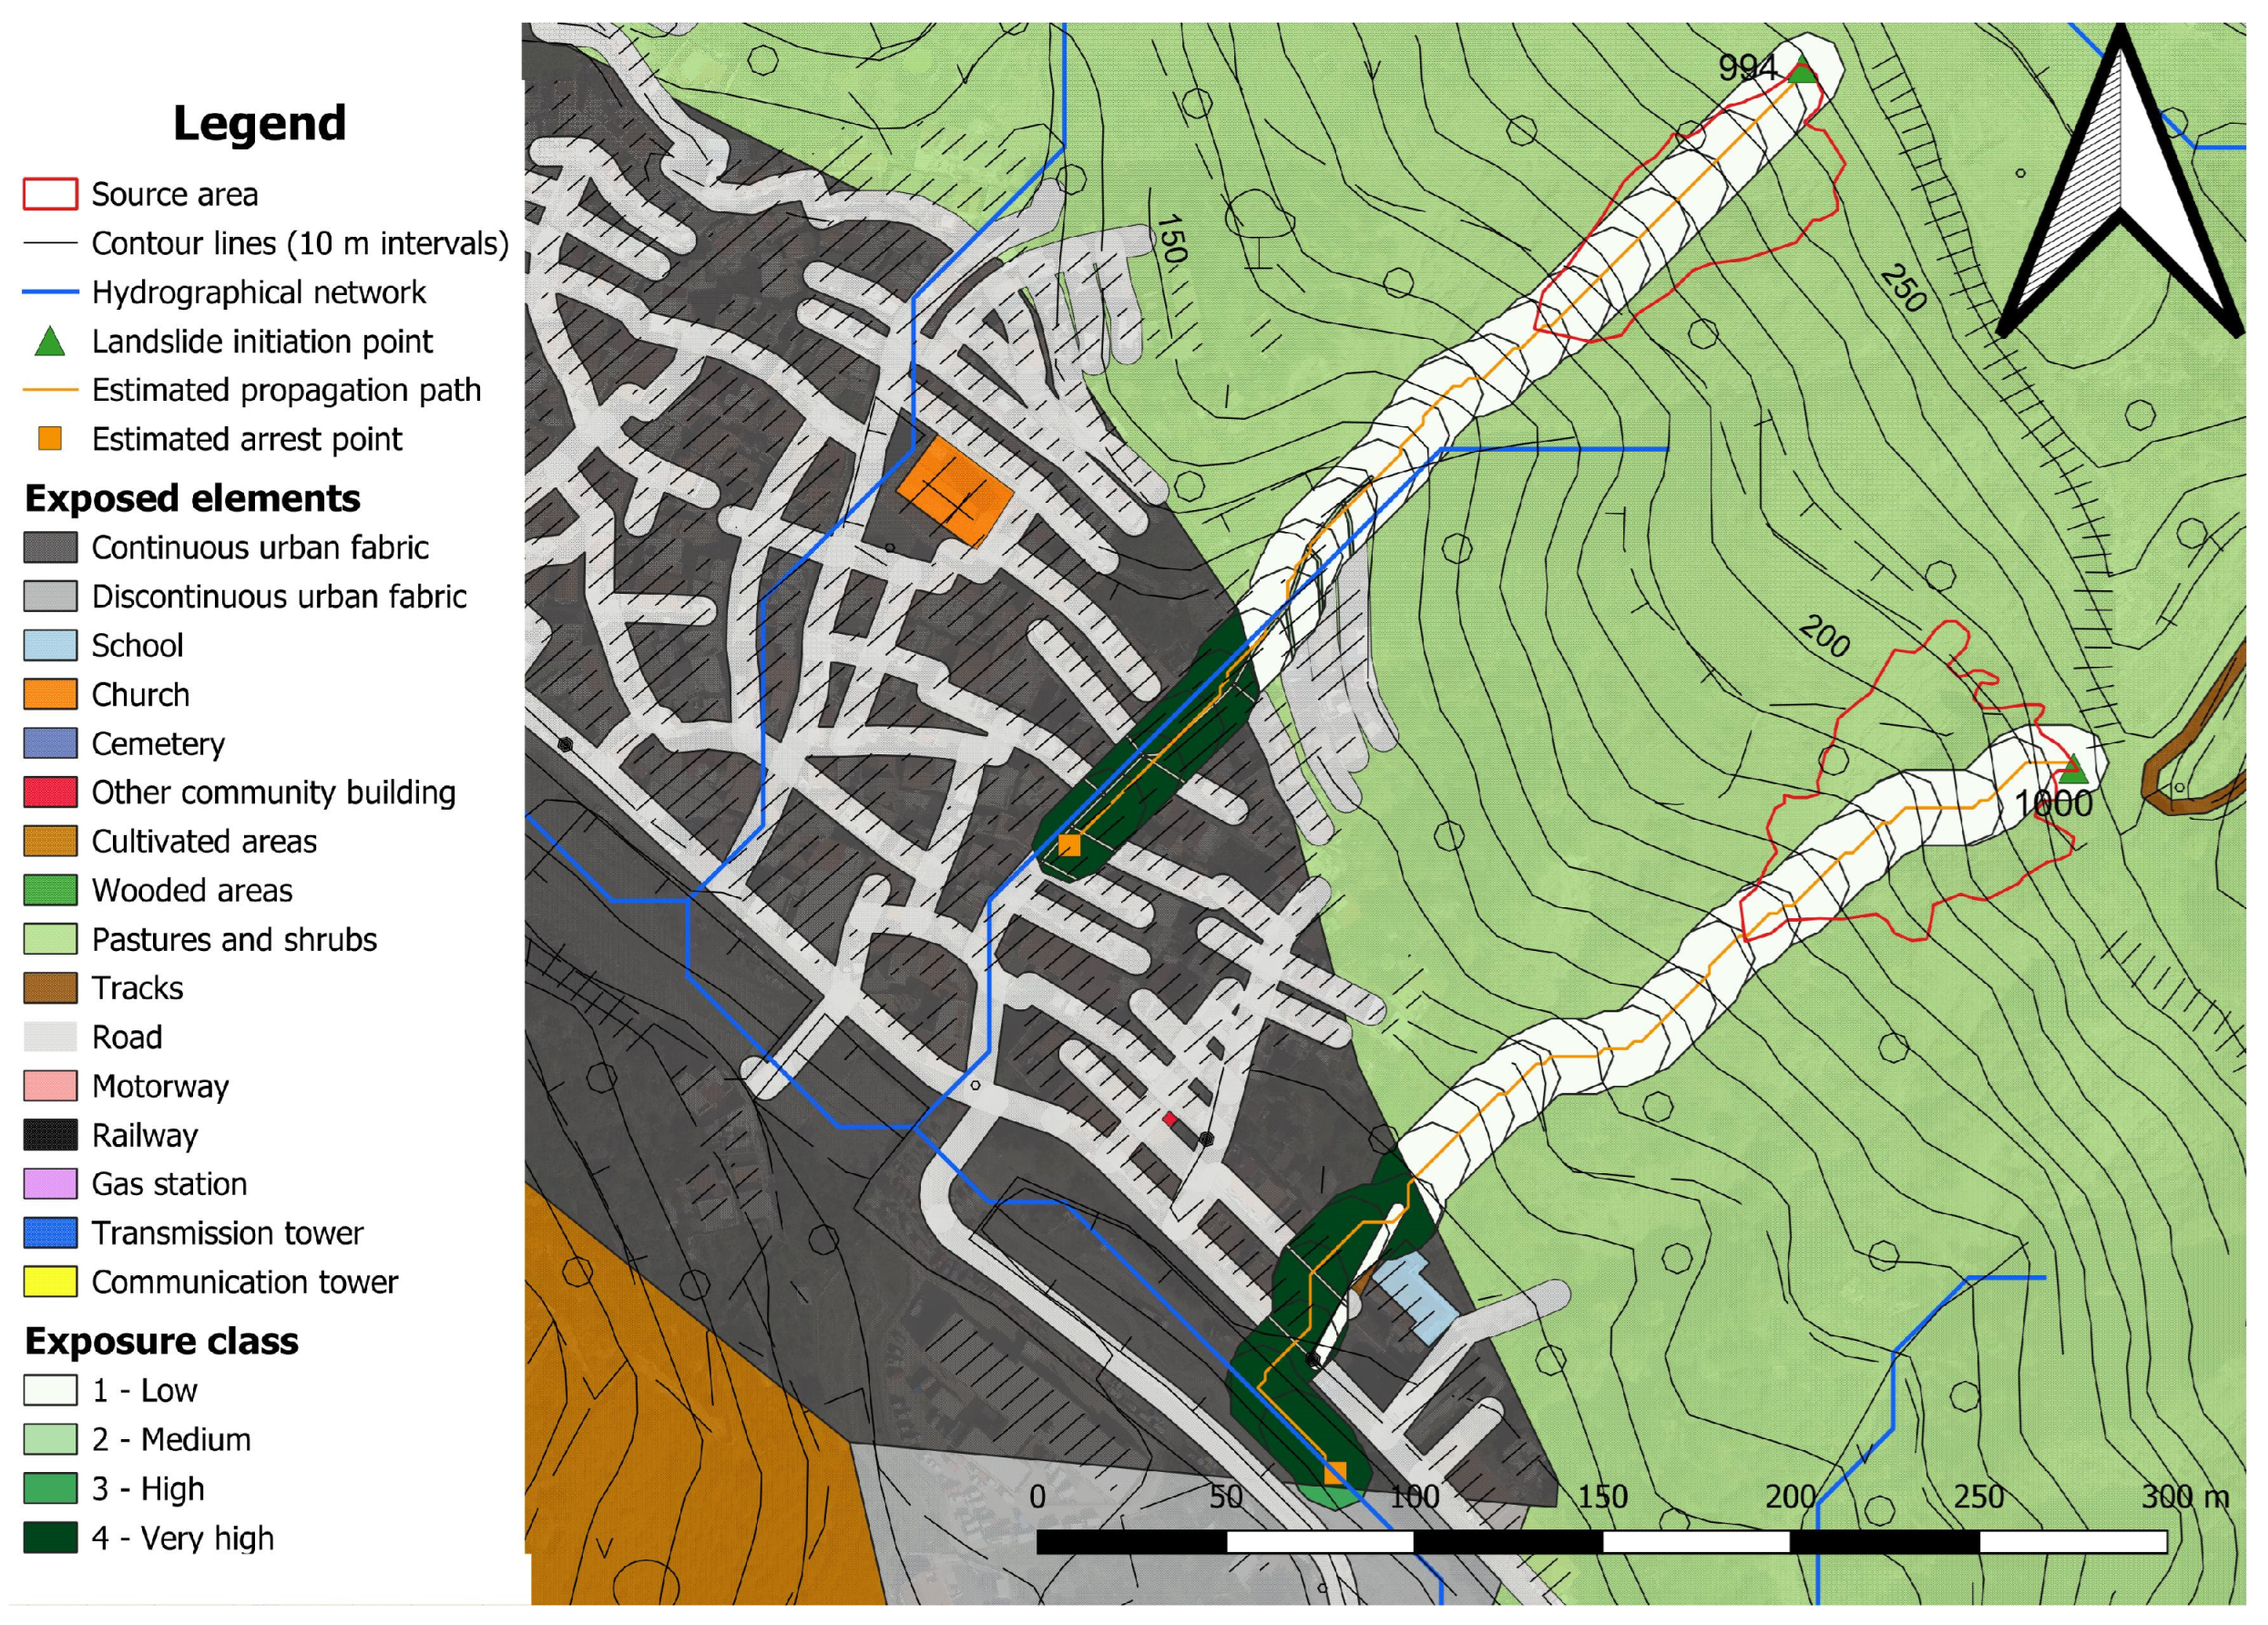
4.2. Hazard, Exposure, Vulnerability, and Risk Map Results
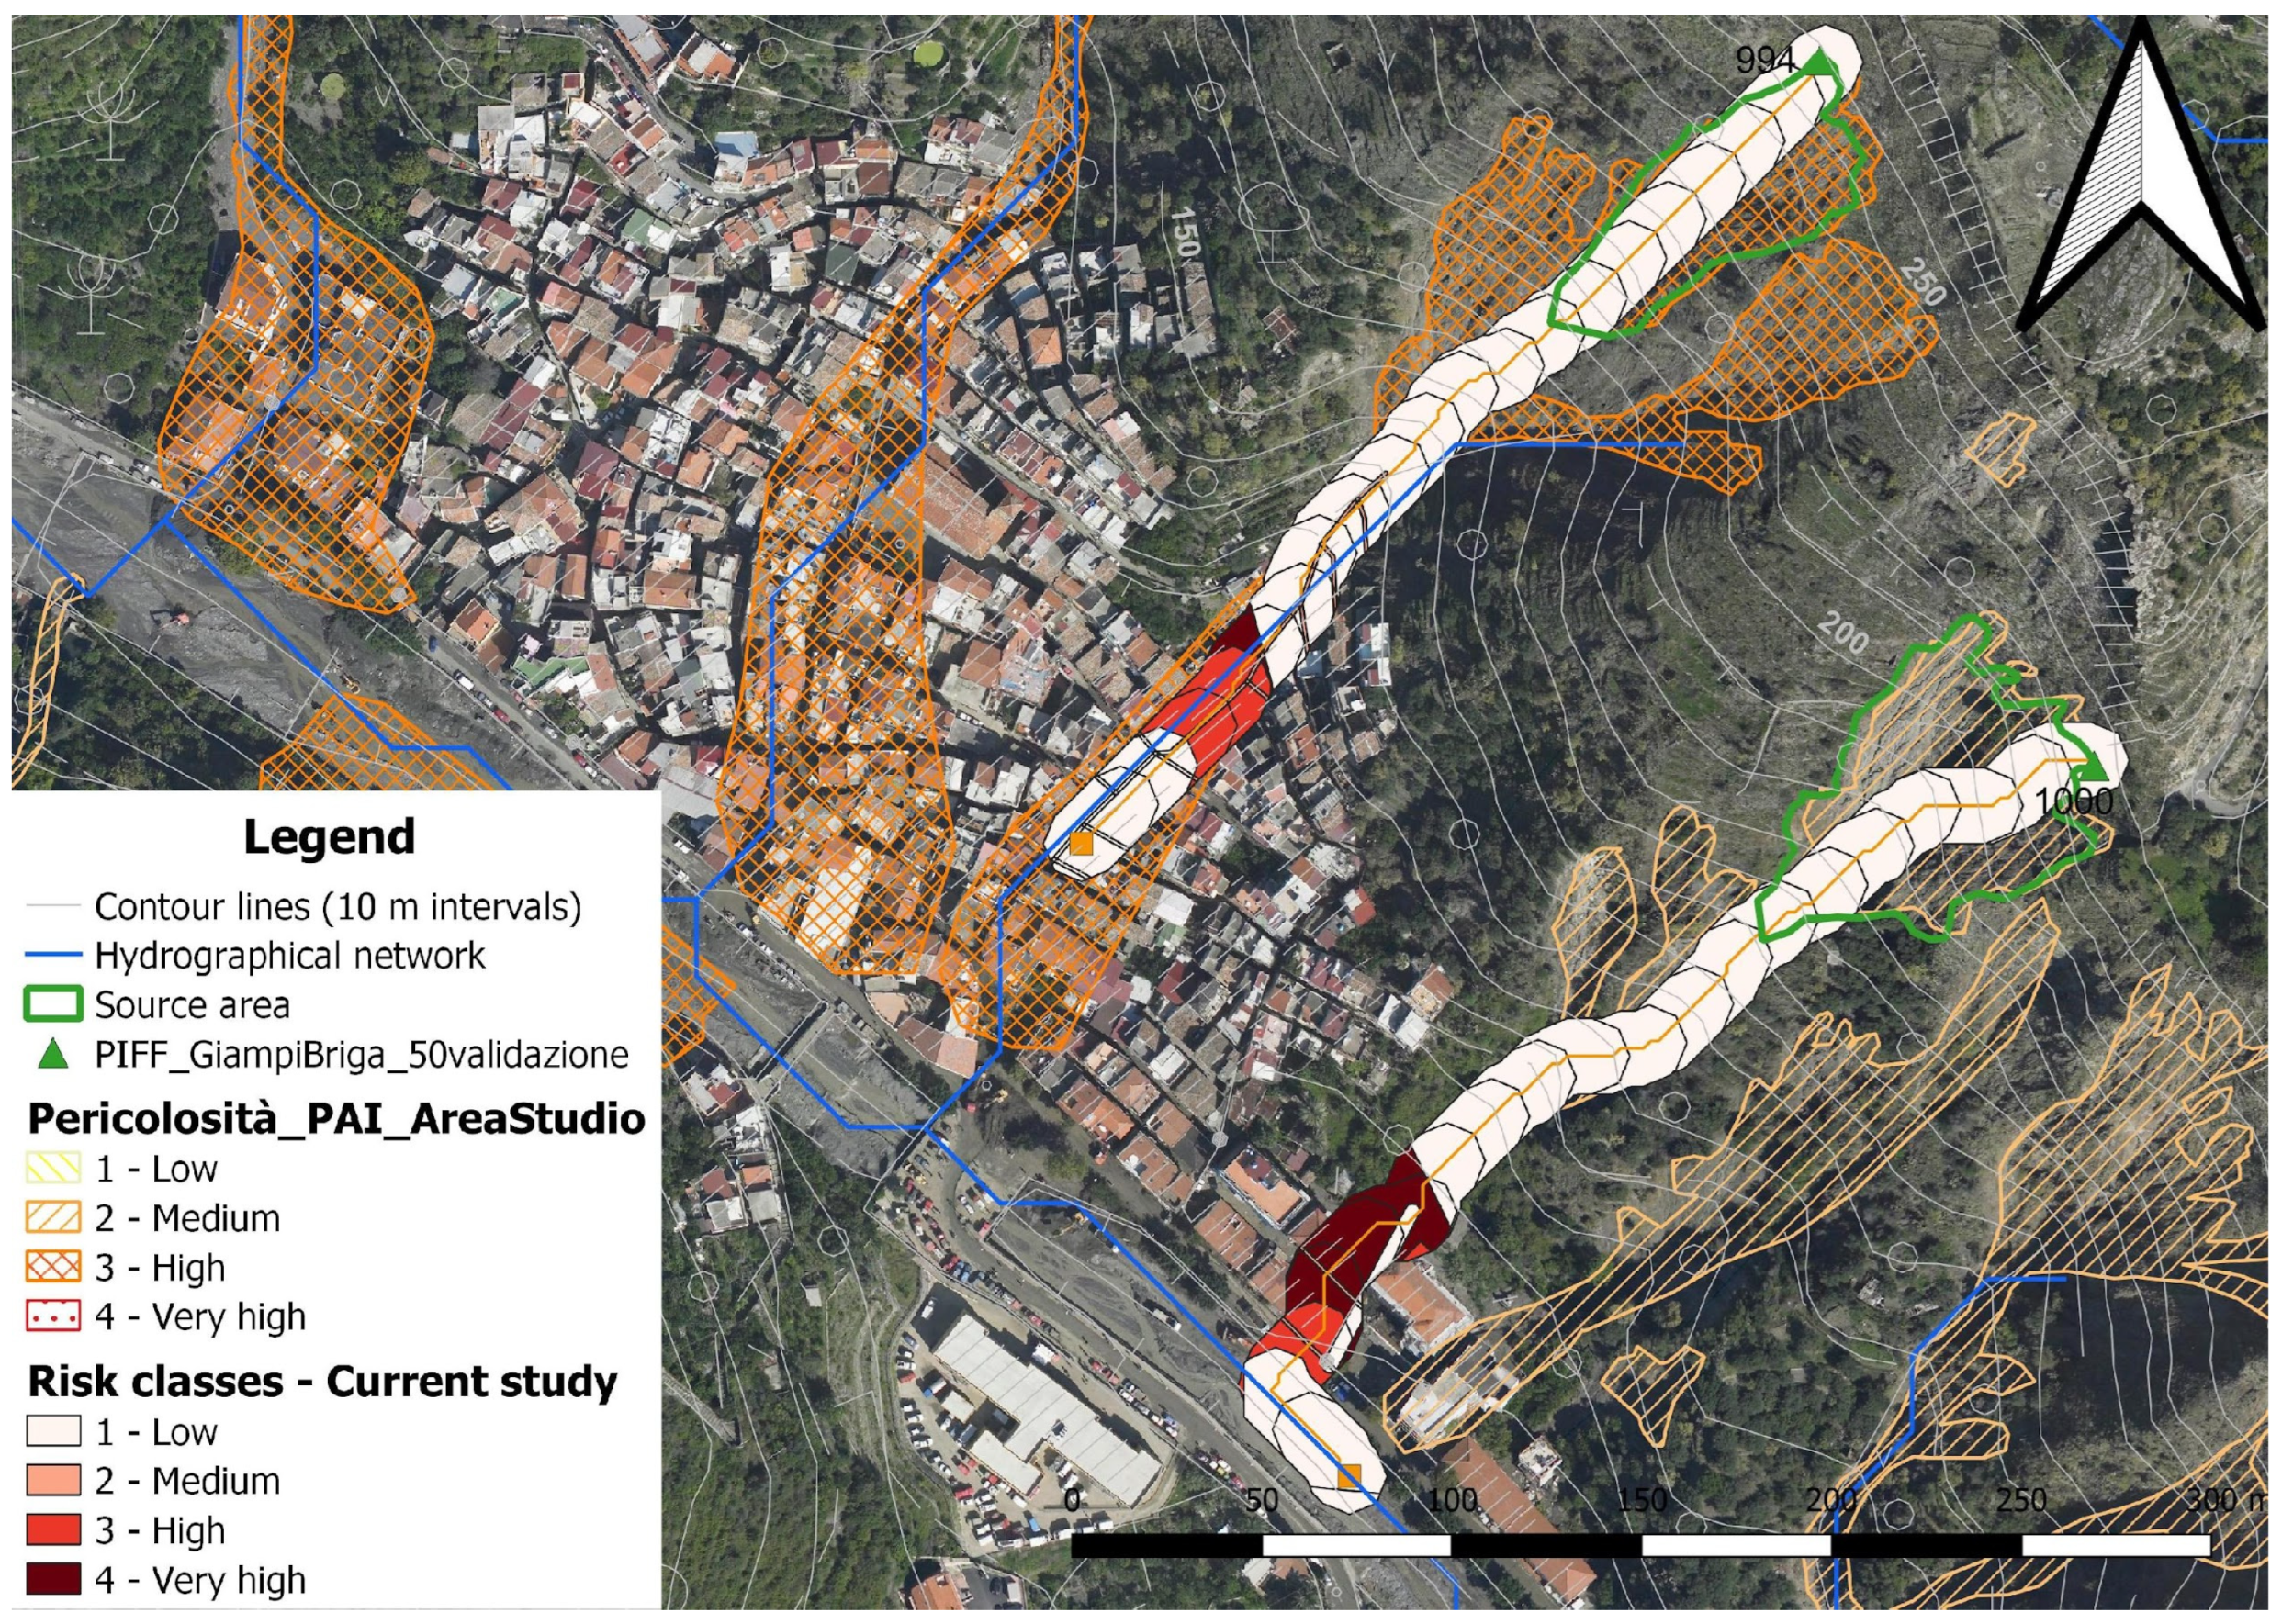
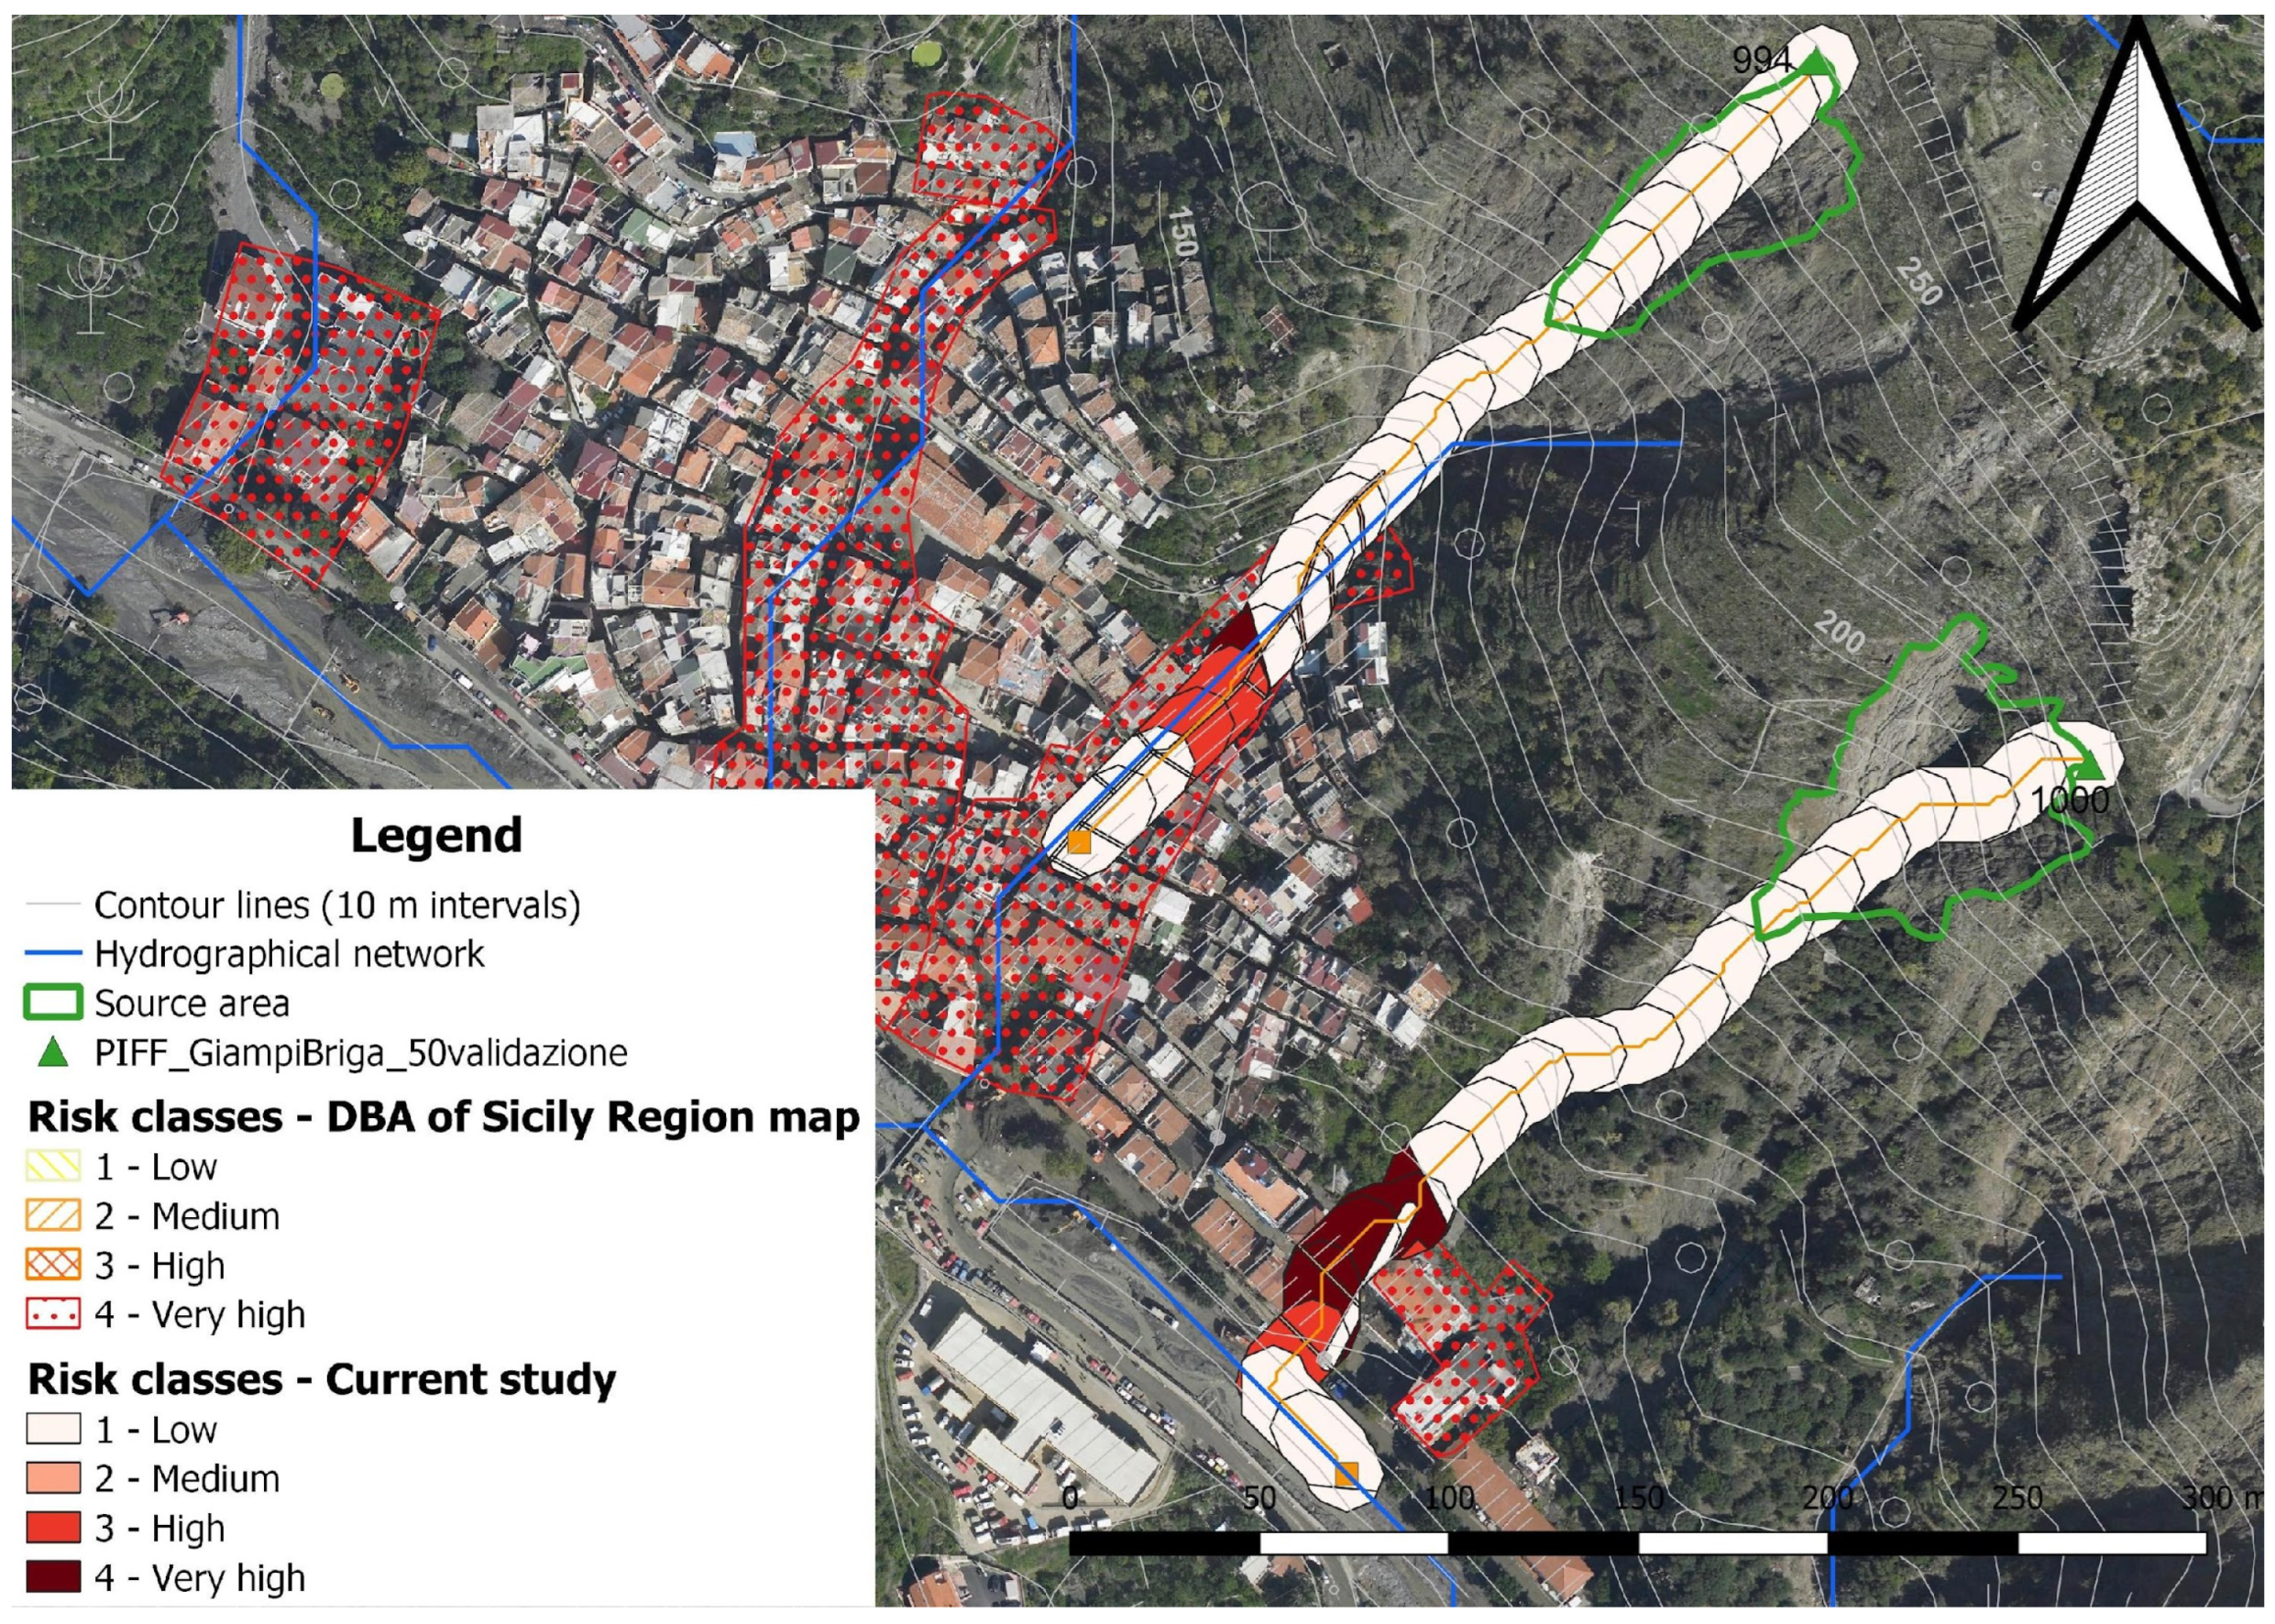
4.3. Comparison with the Current Hazard and Risk Maps
- the DBA hazard map is not properly a predictive instrument for this landslide typology, being only a photo of past occurred events;
- due the correspondence with the inventory of landslides already occurred, the detail level of the DBA hazard map is inversely proportional to its predictive capacity;
- the methodology proposed in this study is aimed at producing real hazard maps, i.e., predictive tools, starting from areas not (yet) affected by past phenomena, defined through the susceptibility analysis;
- the current study map is the result of a modelling process that inevitably provides an approximate output.
5. Conclusions
- the specific runout toolset, implemented with QGIS, significantly facilitated the runout analysis, involving the execution of numerous algorithms sequentially to identify the landslide path, the runout distance from several potential initiation areas, and the intensity assessment. The automatic execution of this chain of operations as a single process provides a time- and effort-saving advantage in GIS analysis. The quick execution time of the runout assessment process guarantees that the implemented tool is well suited for integration into land planning and landslide early warning systems;
- although the runout distances calculated with the Legros equation exhibit a certain level of approximation, linked to the extreme simplification of the process-conditioning factors, the estimate allows quantitative reasoning about the hazard level in the valley zones downstream of the initiation areas;
- through a qualitative risk evaluation matrix, the analysis allowed to discretise the territory into qualitative different classes. However, the introduced approximations in volume, speed, and, consequently, energy estimation and its distribution along the path make the process a preliminary approach;
- landslide hazard in the Messina area, which has experienced widespread fires in the past, often faces a generalised high risk due to specific urbanisation and the limited availability of hydro-geomorphologic risk reduction plans. The approach used in this study, considering the relative variability of the vulnerability level, provides results with greater detail than the more precautionary maps of the Sicily Region.
- to implement and integrate alternative formulas into the GIS tools;
- to improve the vulnerability assessment process;
- to collect multiple sets of landslide events triggered by different rainfall events of different intensities for a specific study area, with the aim of identifying different site-specific runout parameters for different rainfall scenarios.
Author Contributions
Funding
Data Availability Statement
Acknowledgments
Conflicts of Interest
References
- Cendrero, A.; Forte, L.M.; Remondo, J.; Cuesta-Albertos, J.A. Anthropocene geomorphic change. Climate or human activities? Earth’s Future 2020, 8, e2019EF001305. [Google Scholar] [CrossRef]
- Hungr, O.; Leroueil, S.; Picarelli, L. The Varnes classification of landslide types, an update. Landslides 2014, 11, 167–194. [Google Scholar] [CrossRef]
- Caine, N. The Rainfall Intensity: Duration Control of Shallow Landslides and Debris Flows. Geogr. Ann. Ser. A Phys. Geogr. 1980, 62, 23. [Google Scholar] [CrossRef]
- Wieczorek, G.F.; Glade, T. Climatic factors influencing occurrence of debris flows. In Debris-Flow Hazards and Related Phenomena; Jakob, M., Hungr, O., Eds.; Springer: Berlin/Heidelberg, Germany, 2005; pp. 325–362. [Google Scholar] [CrossRef]
- Guzzetti, F.; Peruccacci, S.; Rossi, M.; Stark, C.P. The rainfall intensity–duration control of shallow landslides and debris flows: An update. Landslides 2008, 5, 3–17. [Google Scholar] [CrossRef]
- Intergovernmental Panel On Climate Change. Climate Change 2021—The Physical Science Basis: Working Group I Contribution to the Sixth Assessment Report of the Intergovernmental Panel on Climate Change, 1st ed.; Cambridge University Press: Cambridge, UK, 2023. [Google Scholar] [CrossRef]
- Fowler, H.J.; Lenderink, G.; Prein, A.F.; Westra, S.; Allan, R.P.; Ban, N.; Barbero, R.; Berg, P.; Blenkinsop, S.; Do, H.X.; et al. Anthropogenic intensification of short-duration rainfall extremes. Nat. Rev. Earth Environ. 2021, 2, 107–122. [Google Scholar] [CrossRef]
- Gariano, S.L.; Guzzetti, F. Landslides in a changing climate. Earth-Sci. Rev. 2016, 162, 227–252. [Google Scholar] [CrossRef]
- Schlögel, R.; Kofler, C.; Gariano, S.L.; Van Campenhout, J.; Plummer, S. Changes in climate patterns and their association to natural hazard distribution in South Tyrol (Eastern Italian Alps). Sci. Rep. 2020, 10, 5022. [Google Scholar] [CrossRef]
- Lin, Q.; Steger, S.; Pittore, M.; Zhang, J.; Wang, L.; Jiang, T.; Wang, Y. Evaluation of potential changes in landslide susceptibility and landslide occurrence frequency in China under climate change. Sci. Total Environ. 2022, 850, 158049. [Google Scholar] [CrossRef]
- González-Alemán, J.J.; Pascale, S.; Gutierrez-Fernandez, J.; Murakami, H.; Gaertner, M.A.; Vecchi, G.A. Potential Increase in Hazard from Mediterranean Hurricane Activity with Global Warming. Geophys. Res. Lett. 2019, 46, 1754–1764. [Google Scholar] [CrossRef]
- Stoffel, M.; Mendlik, T.; Schneuwly-Bollschweiler, M.; Gobiet, A. Possible impacts of climate change on debris-flow activity in the Swiss Alps. Clim. Change 2014, 122, 141–155. [Google Scholar] [CrossRef]
- Hirschberg, J.; Fatichi, S.; Bennett, G.L.; McArdell, B.W.; Peleg, N.; Lane, S.N.; Schlunegger, F.; Molnar, P. Climate Change Impacts on Sediment Yield and Debris-Flow Activity in an Alpine Catchment. J. Geophys. Res. Earth Surf. 2021, 126, e2020JF005739. [Google Scholar] [CrossRef]
- Touma, D.; Stevenson, S.; Swain, D.L.; Singh, D.; Kalashnikov, D.A.; Huang, X. Climate change increases risk of extreme rainfall following wildfire in the western United States. Sci. Adv. 2022, 8, eabm0320. [Google Scholar] [CrossRef]
- Froude, M.J.; Petley, D.N. Global fatal landslide occurrence from 2004 to 2016. Nat. Hazards Earth Syst. Sci. 2018, 18, 2161–2181. [Google Scholar] [CrossRef]
- Sepúlveda, S.A.; Petley, D.N. Regional trends and controlling factors of fatal landslides in Latin America and the Caribbean. Nat. Hazards Earth Syst. Sci. 2015, 15, 1821–1833. [Google Scholar] [CrossRef]
- García-Ruiz, J.M.; Beguería, S.; Alatorre, L.C.; Puigdefábregas, J. Land cover changes and shallow landsliding in the flysch sector of the Spanish Pyrenees. Geomorphology 2010, 124, 250–259. [Google Scholar] [CrossRef]
- Gariano, S.L.; Petrucci, O.; Rianna, G.; Santini, M.; Guzzetti, F. Impacts of past and future land changes on landslides in southern Italy. Reg. Environ. Change 2018, 18, 437–449. [Google Scholar] [CrossRef]
- Chen, L.; Guo, Z.; Yin, K.; Shrestha, D.P.; Jin, S. The influence of land use and land cover change on landslide susceptibility: A case study in Zhushan Town, Xuan’en County (Hubei, China). Nat. Hazards Earth Syst. Sci. 2019, 19, 2207–2228. [Google Scholar] [CrossRef]
- Pepe, G.; Mandarino, A.; Raso, E.; Scarpellini, P.; Brandolini, P.; Cevasco, A. Investigation on Farmland Abandonment of Terraced Slopes Using Multitemporal Data Sources Comparison and Its Implication on Hydro-Geomorphological Processes. Water 2019, 11, 1552. [Google Scholar] [CrossRef]
- Mateos, R.M.; López-Vinielles, J.; Poyiadji, E.; Tsagkas, D.; Sheehy, M.; Hadjicharalambous, K.; Liscák, P.; Podolski, L.; Laskowicz, I.; Iadanza, C.; et al. Integration of landslide hazard into urban planning across Europe. Landsc. Urban Plan. 2020, 196, 103740. [Google Scholar] [CrossRef]
- Guinau, M.; Vilajosana, I.; Vilaplana, J.M. GIS-based debris flow source and runout susceptibility assessment from DEM data—A case study in NW Nicaragua. Nat. Hazards Earth Syst. Sci. 2007, 7, 703–716. [Google Scholar] [CrossRef]
- Soman, S.; Beukes, A.; Nederhood, C.; Marchio, N.; Bettencourt, L. Worldwide Detection of Informal Settlements via Topological Analysis of Crowdsourced Digital Maps. ISPRS Int. J. Geo-Inf. 2020, 9, 685. [Google Scholar] [CrossRef]
- Baiocchi, V.; Vatore, F.; Lombardi, M.; Monti, F.; Onori, R. The Contribution of Open-Source GIS Software and Open Spatial Data for the Re-Evaluation of Landslide Risk and Hazard in View of Climate Change. Geogr. Tech. 2021, 16, 153–162. [Google Scholar] [CrossRef]
- Guo, Z.; Ferrer, J.V.; Hürlimann, M.; Medina, V.; Puig-Polo, C.; Yin, K.; Huang, D. Shallow landslide susceptibility assessment under future climate and land cover changes: A case study from southwest China. Geosci. Front. 2023, 14, 101542. [Google Scholar] [CrossRef]
- Zhou, Y.; Yue, D.; Liang, G.; Li, S.; Zhao, Y.; Chao, Z.; Meng, X. Risk Assessment of Debris Flow in a Mountain-Basin Area, Western China. Remote Sens. 2022, 14, 2942. [Google Scholar] [CrossRef]
- Li, Y.; Shen, J.; Huang, M.; Peng, Z. Debris Flow Classification and Risk Assessment Based on Combination Weighting Method and Cluster Analysis: A Case Study of Debris Flow Clusters in Longmenshan Town, Pengzhou, China. Appl. Sci. 2023, 13, 7551. [Google Scholar] [CrossRef]
- Almeida, S.; Holcombe, E.A.; Pianosi, F.; Wagener, T. Dealing with deep uncertainties in landslide modelling for disaster risk reduction under climate change. Nat. Hazards Earth Syst. Sci. 2017, 17, 225–241. [Google Scholar] [CrossRef]
- Buffarini, G.; Clemente, P.; Giovinazzi, S.; Ormando, C.; Pollino, M.; Rosato, V. Preventing and Managing Risks Induced by Natural Hazards to Critical Infrastructures. Infrastructures 2022, 7, 76. [Google Scholar] [CrossRef]
- Melo, R.; Zêzere, J.L. Avaliação da suscetibilidade à rutura e propagação de fluxos de detritos na bacia hidrográfica do rio Zêzere (Serra da Estrela, Portugal). Rev. Bras. Geomorfol. 2017, 18, 81–106. [Google Scholar] [CrossRef]
- Jakob, M.; Hungr, O. Debris-Flow Hazards and Related Phenomena; Springer: Berlin/Heidelberg, Germany, 2005; Volume XLII, p. 739. ISBN 978-3-540-20726-9. [Google Scholar] [CrossRef]
- Hürlimann, M.; Rickenmann, D.; Medina, V.; Bateman, A. Evaluation of approaches to calculate debris-flow parameters for hazard assessment. Eng. Geol. 2008, 102, 152–163. [Google Scholar] [CrossRef]
- McDougall, S. Landslide runout analysis—Current practice and challenges. Can. Geotech. J. 2017, 54, 605–620. [Google Scholar] [CrossRef]
- Rickenmann, D. Runout prediction methods. In Debris-Flow Hazards and Related Phenomena; Jakob, M., Hungr, O., Eds.; Springer: Berlin/Heidelberg, Germany, 2005; Volume XLII, pp. 305–324, 739. ISBN 978-3-540-20726-9. [Google Scholar]
- Di Napoli, M.; Di Martire, D.; Bausilio, G.; Calcaterra, D.; Confuorto, P.; Firpo, M.; Pepe, G.; Cevasco, A. Rainfall-Induced Shallow Landslide Detachment, Transit and Runout Susceptibility Mapping by Integrating Machine Learning Techniques and GIS-Based Approaches. Water 2021, 13, 488. [Google Scholar] [CrossRef]
- Berti, M.; Simoni, A. Prediction of debris flow inundation areas using empirical mobility relationships. Geomorphology 2007, 90, 144–161. [Google Scholar] [CrossRef]
- Corominas, J.; Van Westen, C.; Frattini, P.; Cascini, L.; Malet, J.-P.; Fotopoulou, S.; Catani, F.; Van Den Eeckhaut, M.; Mavrouli, O.; Agliardi, F.; et al. Recommendations for the quantitative analysis of landslide risk. Bull. Eng. Geol. Environ. 2013, 73, 209–263. [Google Scholar] [CrossRef]
- Pellicani, R.; Van Westen, C.J.; Spilotro, G. Assessing landslide exposure in areas with limited landslide information. Landslides 2014, 11, 463–480. [Google Scholar] [CrossRef]
- Wang, H.B.; Wu, S.R.; Shi, J.S.; Li, B. Qualitative hazard and risk assessment of landslides: A practical framework for a case study in China. Nat. Hazards 2013, 69, 1281–1294. [Google Scholar] [CrossRef]
- Pisano, L.; Zumpano, V.; Dragone, V.; Parise, M. Built-Up Area Exposure to Landslides and Related Social Impacts in Molise (Italy). In Advancing Culture of Living with Landslides; Mikos, M., Tiwari, B., Yin, Y., Sassa, K., Eds.; Springer International Publishing: Berlin/Heidelberg, Germany, 2017; pp. 837–845. [Google Scholar] [CrossRef]
- Pollino, M.; Cappucci, S.; Pesaresi, C.; Farrace, M.G.; Morte, L.D.; Vegliante, G. Multi-hazard Analysis and Mapping of Infrastructure Systems at National Level Using GIS Techniques: Preliminary Results. In Computational Science and Its Applications—ICCSA 2022 Workshops; Gervasi, O., Murgante, B., Misra, S., Rocha, A.M.A.C., Garau, C., Eds.; Lecture Notes in Computer Science; Springer: Cham, Switzerland, 2022; Volume 13377. [Google Scholar] [CrossRef]
- Emberson, R.; Kirschbaum, D.; Stanley, T. New global characterisation of landslide exposure. Nat. Hazards Earth Syst. Sci. 2020, 20, 3413–3424. [Google Scholar] [CrossRef]
- Emberson, R.A.; Kirschbaum, D.B.; Stanley, T. Landslide Hazard and Exposure Modelling in Data-Poor Regions: The Example of the Rohingya Refugee Camps in Bangladesh. Earth’s Future 2021, 9, e2020EF001666. [Google Scholar] [CrossRef]
- Promper, C.; Gassner, C.; Glade, T. Spatiotemporal patterns of landslide exposure—A step within future landslide risk analysis on a regional scale applied in Waidhofen/Ybbs Austria. Int. J. Disaster Risk Reduct. 2015, 12, 25–33. [Google Scholar] [CrossRef]
- Fell, R. Landslide risk assessment and acceptable risk. Can. Geotech. J. 1994, 31, 261–272. [Google Scholar] [CrossRef]
- Liu, X.; Yue, Z.Q.; Tham, L.G.; Lee, C.F. Empirical Assessment of Debris Flow Risk on a Regional Scale in Yunnan Province, Southwestern China. Environ. Manag. 2002, 30, 249–264. [Google Scholar] [CrossRef] [PubMed]
- Fuchs, S.; Heiss, K.; Hübl, J. Towards an empirical vulnerability function for use in debris flow risk assessment. Nat. Hazards Earth Syst. Sci. 2007, 7, 495–506. [Google Scholar] [CrossRef]
- Cardinali, M.; Reichenbach, P.; Guzzetti, F.; Ardizzone, F.; Antonini, G.; Galli, M.; Cacciano, M.; Castellani, M.; Salvati, P. A geomorphological approach to the estimation of landslide hazards and risks in Umbria, Central Italy. Nat. Hazards Earth Syst. Sci. 2002, 2, 57–72. [Google Scholar] [CrossRef]
- Li, Z.; Nadim, F.; Huang, H.; Uzielli, M.; Lacasse, S. Quantitative vulnerability estimation for scenario-based landslide hazards. Landslides 2010, 7, 125–134. [Google Scholar] [CrossRef]
- Glade, T. Vulnerability assessment in landslide risk analysis. Erde 2003, 134, 123–146. [Google Scholar]
- Papathoma-Köhle, M.; Neuhäuser, B.; Ratzinger, K.; Wenzel, H.; Dominey-Howes, D. Elements at risk as a framework for assessing the vulnerability of communities to landslides. Nat. Hazards Earth Syst. Sci. 2007, 7, 765–779. [Google Scholar] [CrossRef]
- Hollenstein, K. Reconsidering the risk assessment concept: Standardizing the impact description as a building block for vulnerability assessment. Nat. Hazards Earth Syst. Sci. 2005, 5, 301–307. [Google Scholar] [CrossRef]
- Bell, R.; Glade, T. Quantitative risk analysis for landslides—Examples from B´ıldudalur, NW-Iceland. Nat. Hazards Earth Syst. Sci. 2004, 4, 117–131. [Google Scholar] [CrossRef]
- Michael-Leiba, M.; Baynes, F.; Scott, G.; Granger, K. Regional Landslide Risk to the Cairns Community. Nat. Hazards 2009, 30, 233–249. [Google Scholar] [CrossRef]
- Mavrouli, O.; Fotopoulou, S.; Pitilakis, K.; Zuccaro, G.; Corominas, J.; Santo, A.; Cacace, F.; De Gregorio, D.; Di Crescenzo, G.; Foerster, E.; et al. Vulnerability assessment for reinforced concrete buildings exposed to landslides. Bull. Eng. Geol. Environ. 2014, 73, 265–289. [Google Scholar] [CrossRef]
- Godfrey, A.; Ciurean, R.L.; Van Westen, C.J.; Kingma, N.C.; Glade, T. Assessing vulnerability of buildings to hydro-meteorological hazards using an expert based approach—An application in Nehoiu Valley, Romania. Int. J. Disaster Risk Reduct. 2015, 13, 229–241. [Google Scholar] [CrossRef]
- Papathoma-Köhle, M.; Zischg, A.; Fuchs, S.; Glade, T.; Keiler, M. Loss estimation for landslides in mountain areas—An integrated toolbox for vulnerability assessment and damage documentation. Environ. Model. Softw. 2015, 63, 156–169. [Google Scholar] [CrossRef]
- Ciurean, R.L.; Hussin, H.; Van Westen, C.J.; Jaboyedoff, M.; Nicolet, P.; Chen, L.; Frigerio, S.; Glade, T. Multi-scale debris flow vulnerability assessment and direct loss estimation of buildings in the Eastern Italian Alps. Nat. Hazards 2017, 85, 929–957. [Google Scholar] [CrossRef]
- Ardizzone, F.; Basile, G.; Cardinali, M.; Casagli, N.; Del Conte, S.; Del Ventisette, C.; Fiorucci, F.; Garfagnoli, F.; Gigli, G.; Guzzetti, F.; et al. Landslide inventory map for the Briga and the Giampilieri catchments, NE Sicily, Italy. J. Maps 2012, 8, 176–180. [Google Scholar] [CrossRef]
- Aronica, G.T.; Brigandí, G.; Morey, N. Flash floods and debris flow in the city area of Messina, north-east part of Sicily, Italy in October 2009: The case of the Giampilieri catchment. Nat. Hazards Earth Syst. Sci. 2012, 12, 1295–1309. [Google Scholar] [CrossRef]
- Carbone, S.; Messina, A.; Lentini, F. Note Illustrative della Carta Geologica d’Italia alla Scala 1:50.000, F. 601 Messina-Reggio di Calabria. ISPRA—Italian Geological Survey, Rome. 2022. Available online: https://www.isprambiente.gov.it/Media/carg/note_illustrative/601_Messina_Reggio_Calabria.pdf (accessed on 18 January 2024).
- Napoli, R.; Crovato, C.; Falconi, L.; Gioè, C. Soil Water Content and Triggering of Debris Flows in the Messina Area (Italy): Preliminary Remarks. In Engineering Geology for Society and Territory; Lollino, G., Giordan, D., Crosta, G.B., Corominas, J., Azzam, R., Wasowski, J., Sciarra, N., Eds.; Springer International Publishing: Cham, Switzerland, 2015; Volume 2, pp. 2113–2117. [Google Scholar] [CrossRef]
- Corine Land Cover (CLC) Maps. Available online: https://land.copernicus.eu/en/products?tab=explore (accessed on 15 December 2023).
- Büttner, G.; Kosztra, B.; Maucha, G.; Pataki, R.; Kleeschulte, S.; Hazeu, G.; Vittek, M.; Schröder, C.; Littkopf, A. Copernicus Land Monitoring Service. In User Manual; European Union, Copernicus Land Monitoring Service; European Environment Agency (EEA): Copenhagen, Denmark, 2021. [Google Scholar]
- Malerba, S.; Brustia, E.; Campolo, D.; Comerci, V.; Falconi, L.; Gioè, C.; Lucarini, M.; Lumaca, S.; Puglisi, C.; Torre, A. Landslides Inventory in the Messina Municipality Area: Integration of Historical and Field Survey Data. In Engineering Geology for Society and Territory; Lollino, G., Giordan, D., Crosta, G.B., Corominas, J., Azzam, R., Wasowski, J., Sciarra, N., Eds.; Springer International Publishing: Cham, Switzerland, 2015; Volume 2, pp. 967–970. [Google Scholar] [CrossRef]
- OpenStreetMap. Available online: https://www.openstreetmap.org/ (accessed on 15 December 2023).
- Catani, F.; Segoni, S.; Falorni, G. An empirical geomorphology-based approach to the spatial prediction of soil thickness at catchment scale: Catchment-scale soil depth prediction. Water Resour. Res. 2010, 46. [Google Scholar] [CrossRef]
- Legros, F. The mobility of long-runout landslides. Eng. Geol. 2002, 63, 301–331. [Google Scholar] [CrossRef]
- Falconi, L.M.; Moretti, L.; Puglisi, C.; Righini, G. Debris and mud flows runout assessment: A comparison among empirical geometric equations in the Giampilieri and Briga basins (east Sicily, Italy) affected by the event of October 1, 2009. Nat. Hazards 2023, 117, 2347–2373. [Google Scholar] [CrossRef]
- Kosztra, B.; Büttner, G.; Hazeu, G.; Arnold, S. Updated CLC Illustrated Nomenclature Guidelines; EAA—Environment Agency Austria: Vienna, Austria, 2017.
- Giovinazzi, S.; Marchili, C.; Di Pietro, A.; Giordano, L.; Costanzo, A.; La Porta, L.; Pollino, M.; Rosato, V.; Lückerath, D.; Milde, K.; et al. Assessing Earthquake Impacts and Monitoring Resilience of Historic Areas: Methods for GIS Tools. ISPRS Int. J. Geo-Inf. 2021, 10, 461. [Google Scholar] [CrossRef]
- Rickenmann, D. Empirical relationships for debris flows. Nat. Hazards 1999, 19, 47–77. [Google Scholar] [CrossRef]
- Guo, D.; Hamada, M.; He, C.; Wang, Y.; Zou, Y. An empirical model for landslide travel distance prediction in Wenchuan earthquake area. Landslides 2014, 11, 281–291. [Google Scholar] [CrossRef]
- Puglisi, C.; Falconi, L.; Gioè, C.; Leoni, G. Contribution to the runout evaluation of potential debris flows in Peloritani Mountains (Messina, Italy). In Engineering Geology for Society and Territory—Volume 2, Landslide Processes; Springer International Publishing: Cham, Switzerland, 2015; pp. 509–513. ISBN 978-3-319-09057-3. [Google Scholar]
- Sicilian Region Geoportal—S.I.T.R—Sistema Informativo Territoriale Regionale. Available online: https://www.sitr.regione.sicilia.it/ (accessed on 15 December 2023).
- Trigila, A.; Iadanza, C.; Lastoria, B.; Bussettini, M.; Barbano, A. Dissesto Idrogeologico in Italia: Pericolosità e Indicatori di Rischio, 2021th ed.; Rapporti 356/2021; ISPRA: Rome, Italy, 2021.
- Zhang, S.; Sun, P.; Zhang, Y.; Ren, J.; Wang, H. Hazard Zonation and Risk Assessment of a Debris Flow under Different Rainfall Condition in Wudu District, Gansu Province, Northwest China. Water 2022, 14, 2680. [Google Scholar] [CrossRef]
- Ding, W.; Wang, G.; Yang, Q.; Xu, Y.; Gao, Y.; Chen, X.; Xu, S.; Han, L.; Yang, X. Risk Assessment and Control of Geological Hazards in Towns of Complex Mountainous Areas Based on Remote Sensing and Geological Survey. Water 2023, 15, 3170. [Google Scholar] [CrossRef]
- Hagge-Kubat, T.; Fischer, P.; Süßer, P.; Rotter, P.; Wehinger, A.; Vött, A.; Enzmann, F. Multi-Methodological Investigation of the Biersdorf Hillslope Debris Flow (Rheinland-Pfalz, Germany) Associated to the Torrential Rainfall Event of 14 July 2021. Geosciences 2022, 12, 245. [Google Scholar] [CrossRef]
- Han, X.; Yin, Y.; Wu, Y.; Wu, S. Risk Assessment of Population Loss Posed by Earthquake-Landslide-Debris Flow Disaster Chain: A Case Study in Wenchuan, China. ISPRS Int. J. Geo-Inf. 2021, 10, 363. [Google Scholar] [CrossRef]


| Code | Description | 1990 | 2006 | 2018 | Δ 2018–1990 | |||
|---|---|---|---|---|---|---|---|---|
| Km2 | % | Km2 | % | Km2 | % | % | ||
| 111 | Continuous urban fabric | 0.43 | 2.08 | 0.41 | 1.97 | 0.68 | 3.29 | 57% |
| 112 | Discontinuous urban fabric | 0.42 | 2.03 | 0.42 | 2.04 | 0 | 0.00 | −100% |
| 222 | Fruit trees and berry plantations | 2.88 | 13.88 | 2.88 | 13.91 | 2.92 | 14.15 | 1.2% |
| 223 | Olive groves | 0.48 | 2.31 | 0.48 | 2.31 | 0 | 0.00 | −100% |
| 243 | Land principally occupied by agriculture | 3.09 | 14.87 | 6.75 | 32.56 | 2.71 | 13.16 | −12% |
| 311 | Broad-leaved forest | 3.24 | 15.62 | 3.24 | 15.65 | 1.95 | 9.47 | −40% |
| 313 | Mixed forest | 0 | 0.00 | 1.33 | 6.43 | 0 | 0.00 | −100% |
| 321 | Natural grasslands | 0.16 | 0.76 | 1.16 | 5.57 | 0 | 0.00 | −100% |
| 322 | Moors and heathland | 5.72 | 27.55 | 0 | 0.00 | 0 | 0.00 | −100% |
| 323 | Sclerophyllous vegetation | 0 | 0.00 | 0.65 | 3.14 | 6.63 | 32.14 | 919% |
| 324 | Transitional woodland-shrub | 3.58 | 17.24 | 3.41 | 16.43 | 0 | 0.00 | −100% |
| 333 | Sparsely vegetated areas | 0.74 | 3.56 | 0 | 0.00 | 5.73 | 27.79 | 674% |
| Lithotechnical Unit | Unit Weight Value |
|---|---|
| Granular A | 16.5 |
| Granular B | 19.1 |
| Stratified A | 20.5 |
| Stratified B | 20.0 |
| Massive | 21.0 |
| Crystalline | 22.0 |
| Kinetic Energy Value (kJ) | Potential Damage Level | Intensity Class |
|---|---|---|
| 0–500 | Low | 1 |
| 500–2000 | Medium | 2 |
| 2000–6000 | High | 3 |
| >6000 | Very high | 4 |
| Exposed Element Categories | Area (km2) | Area (%) |
|---|---|---|
| Continuous urban fabric | 0.7455 | 3.616 |
| Discontinuous urban fabric | 0.4301 | 2.086 |
| Schools | 0.0030 | 0.015 |
| Churches | 0.0040 | 0.019 |
| Cemeteries | 0.0105 | 0.051 |
| Other community buildings | 0.0005 | 0.002 |
| Cultivated areas | 4.9694 | 24.100 |
| Wooded areas | 1.9309 | 9.364 |
| Pastures and shrubs | 11.9026 | 57.724 |
| Tracks | 0.2364 | 1.146 |
| Roads | 0.2703 | 1.311 |
| Motorway | 0.0658 | 0.319 |
| Railway | 0.0424 | 0.206 |
| Gas station | 0.0015 | 0.007 |
| Transmission tower | 0.0067 | 0.033 |
| Communication tower | 0.0004 | 0.002 |
| Data Source | Former Category | Exposed Elements | Exposure Value |
|---|---|---|---|
| CLC 2018 | Continuous urban fabric | Continuous urban fabric | 4 |
| CLC 2018 | Discontinuous urban fabric | Discontinuous urban fabric | 3 |
| RTM 2012 | School complexes | Schools | 4 |
| RTM 2012 | Religious complex | Churches | 4 |
| RTM 2012 | Cemeterial complex | Cemeteries | 3 |
| RTM 2012 | Social complexes | Other community buildings | 4 |
| CLC 2018 | Fruit trees; land principally occupied by agriculture. | Cultivated areas | 2 |
| CLC 2018 | Broad-leaved forest | Wooded areas | 1 |
| CLC 2018 | Sparsely vegetated areas; sclerophyllous vegetation. | Pastures and shrubs | 1 |
| OSM | Track | Tracks | 1 |
| OSM | Unclassified; tertiary; residential; primary; pedestrian. | Roads | 2 |
| OSM | Motorway | Motorway | 3 |
| OSM | Railway | Railway | 3 |
| RTM 2012 | Fuel Distribution supply | Gas station | 3 |
| RTM 2012 | Electricity pylon | Transmission tower | 3 |
| RTM 2012 | Antenna for telecommunication and broadcasting structures | Communication tower | 3 |
| Damage Typology | Loss Degree | Vulnerability Class |
|---|---|---|
| Superficial | 0–0.25 | 1 |
| Functional | 0.25–0.5 | 2 |
| Structural | 0.5–0.75 | 3 |
| Total | 0.75–1 | 4 |
| Exposed Elements Categories | Building Structure | Resistance |
|---|---|---|
| Cemeteries and gas station | Mixed structure (timber masonry and/or similar) | Weak |
| Continuous urban fabric, churches | Masonry, mixed structure (masonry/reinforced concrete) | Medium |
| Discontinuous urban fabric, schools, other community buildings | Reinforced concrete | Strong |
| Towers | Steel, Reinforced concrete | Very strong |
| Exposed Elements Categories | Low Intensity | Medium Intensity | High Intensity | Very High Intensity |
|---|---|---|---|---|
| Continuous urban fabric, churches | 1 | 2 | 3 | 4 |
| Discontinuous urban fabric and schools | 1 | 1 | 2 | 3 |
| Cemeteries | 1 | 2 | 3 | 4 |
| Cultivated areas | 3 | 4 | 4 | 4 |
| Wooded areas | 1 | 2 | 2 | 3 |
| Pastures and shrubs | 1 | 1 | 1 | 1 |
| Tracks | 1 | 1 | 1 | 2 |
| Roads | 1 | 2 | 3 | 4 |
| Motorway | 1 | 1 | 2 | 3 |
| Railway | 2 | 3 | 4 | 4 |
| Gas station | 1 | 2 | 3 | 4 |
| Transmission and communication towers | 1 | 1 | 2 | 3 |
| Hazard Classes | Low Intensity | Medium Intensity | High Intensity | Very High Intensity |
|---|---|---|---|---|
| Km2 | 0.105 | 0.091 | 0.087 | 0.095 |
| % | 28 | 24 | 23 | 25 |
Disclaimer/Publisher’s Note: The statements, opinions and data contained in all publications are solely those of the individual author(s) and contributor(s) and not of MDPI and/or the editor(s). MDPI and/or the editor(s) disclaim responsibility for any injury to people or property resulting from any ideas, methods, instructions or products referred to in the content. |
© 2024 by the authors. Licensee MDPI, Basel, Switzerland. This article is an open access article distributed under the terms and conditions of the Creative Commons Attribution (CC BY) license (https://creativecommons.org/licenses/by/4.0/).
Share and Cite
Vegliante, G.; Baiocchi, V.; Falconi, L.M.; Moretti, L.; Pollino, M.; Puglisi, C.; Righini, G. A GIS-Based Approach for Shallow Landslides Risk Assessment in the Giampilieri and Briga Catchments Areas (Sicily, Italy). GeoHazards 2024, 5, 209-232. https://doi.org/10.3390/geohazards5010011
Vegliante G, Baiocchi V, Falconi LM, Moretti L, Pollino M, Puglisi C, Righini G. A GIS-Based Approach for Shallow Landslides Risk Assessment in the Giampilieri and Briga Catchments Areas (Sicily, Italy). GeoHazards. 2024; 5(1):209-232. https://doi.org/10.3390/geohazards5010011
Chicago/Turabian StyleVegliante, Giulio, Valerio Baiocchi, Luca Maria Falconi, Lorenzo Moretti, Maurizio Pollino, Claudio Puglisi, and Gaia Righini. 2024. "A GIS-Based Approach for Shallow Landslides Risk Assessment in the Giampilieri and Briga Catchments Areas (Sicily, Italy)" GeoHazards 5, no. 1: 209-232. https://doi.org/10.3390/geohazards5010011