Article

Statistics on Typhoon Intensity and Rice Damage in Vietnam and the Philippines

1
Earth Observatory of Singapore and Asian School of the Environment, Nanyang Technological University, Singapore 639798, Singapore
2
S. Rajaratnam School of International Studies, Nanyang Technological University, Singapore 639798, Singapore
*
Author to whom correspondence should be addressed.
GeoHazards 2024, 5(1), 22-37; https://doi.org/10.3390/geohazards5010002
Submission received: 10 January 2023 / Revised: 21 December 2023 / Accepted: 3 January 2024 / Published: 11 January 2024

Abstract

:
Typhoons are destructive multi-hazard events. To assess the relationship between typhoon intensity and agricultural loss, there is a need for accurate and standardized information on loss and damage, which is currently lacking. To address this, a database for Vietnam and the Philippines was created to provide aggregated information on the magnitude of rice damage and to highlight the rice-growing areas which were prone to being damaged by typhoons. Our study period was from 1970 to 2018, and we focused on Vietnam and the Philippines as these two countries experience frequent and intense typhoons. As different crops respond differently to wind and rain, we limit our research to a single crop. In this study, we focused on rice as it is a major staple food in Southeast Asia, and rice fields were often damaged by typhoons in the two countries. Of the 829 typhoon events recorded, only 15% of the events resulted in rice damage. The average area of rice damaged per typhoon event ranged from 42,407 ha in Vietnam to 83,571 ha in the Philippines. Meanwhile, the average production loss per typhoon event ranged from 190,227 metric tonnes in the Philippines to 539,150 metric tonnes in Vietnam. The monetary value of rice crops lost was only reported in the Philippines, and this amounted to an average of US$ 42 million per typhoon event. There was a weak relationship between landfall wind speed and the three indicators of rice damage, which suggests that rice damage was not primarily due to strong winds. Our results showed that the rice fields in the coastal provinces of Vietnam and the northern parts of the Philippines were more vulnerable to being damaged by typhoons.

1. Introduction

The strong winds, heavy rains, and storm surges that typically accompany a typhoon have the potential to damage crops, and a more intense event is often assumed to cause more damage [1,2,3]. The quantity of crop loss is influenced by the type of crops grown, as different crops have different resistances to wind and rain damage. Crops like bananas, pomelos, and papayas are vulnerable to strong winds as fruits and branches are easily blown off, while the roots and leaves of melon crops and leafy vegetables are easily damaged by flooding and storm surges [4]. The growth stage of the plant is also another critical factor that may affect the extent of crop damage [4,5,6]. Rice plants at the heading stage are particularly prone to lodging induced by excessive wind and the weight of water on the canopy from the rain associated with a typhoon. As a result, the upper part of the plant gets bent and the bent stem may lean against their neighbors creating a domino effect on other plants. Widespread lodging in the field may lead to a reduction in overall yields [6,7]. Meanwhile, rainfall during the ripening of rice might induce preharvest sprouting, while heavy rain during the flowering stage may increase the frequency of unfilled grains [8]. As crops may respond differently to typhoon wind and rain, it is important to investigate how the wind speed of a typhoon and the volume of rainfall have contributed to crop losses.
To determine if there was a relationship between typhoon intensity and agricultural damage, there is a need to have accurate information on agricultural losses first. There are several disaster databases that compile loss and damage data at the international, regional, and local scale but data on agricultural losses was not always available. DesInventar Sendai, Emergency Events Database (EM-DAT), NatCatSERVICE, and Sigma are four major international databases that provide damage data related to biological, geophysical, hydrological, meteorological, and climatological disasters [9] (Supplementary Table S1). On a regional level, the Asian Disaster Reduction Centre (ADRC) has provided disaster information in Asia since 1998. Data in the ADRC database were obtained from United Nations agencies, international news agencies, and non-governmental organizations. However, the inclusion criterion is not publicly available. Reported losses in the ADRC database include the number of dead, missing, affected, or displaced, as well as the amount of material damages [10,11]. While international databases such as DesInventar Sendai, EM-DAT, NatCat, Sigma, and the ADRC database provide information related to human impacts, infrastructure damage, and economic loss, only DesInventar Sendai and the ADRC database had information on agricultural-related damage. Even though the two databases compiled information on agricultural damage, information was not consistently available. For example, in the DesInventar Database, Vietnam was among the 82 countries that supposedly had data in the database but a search for information pertaining to cyclone induced crop damage from the year 2000–2018 did not yield any results.
In Southeast Asia, some countries have specific organizations that compile disaster data. The National Disaster Risk Reduction and Management Council (NDRRMC) in the Philippines and the Philippines Disaster Response Management Bureau (DRMB) publish information on natural disasters that affected the Philippines (Supplementary Table S2). In Indonesia, disaster information is collated and published in Data Dan Informasi Bencana Indonesia (DIBI) or the Disaster Data and Information database. In addition, disaster data was mapped and displayed in the Geoportal Data Bencana Indonesia or Indonesia Disaster Data Geoportal (Supplementary Table S3). Likewise, Malaysia has a publicly available national-level disaster database that is published in Malay (Supplementary Table S4). Vietnam has two disaster databases; the first database is maintained by the Vietnam Disaster Management Authority, and the information is published in Vietnamese. The second Vietnamese database is maintained by the General Statistics Office of Vietnam (Supplementary Table S5). No centralized depository for loss data was found for the other Southeast Asian countries. Among the national databases, only four databases reported agricultural losses: NDRRMC for the Philippines, DIDB for Indonesia, and the two Vietnamese databases. The NDRRMC database reported economic losses in Philippine peso (PHP), while DIDB and the two Vietnamese databases reported areal losses in hectares. The inconsistent reporting format made it difficult to make direct comparisons.
To address the unavailability and the non-standardization of agricultural loss data, we first compiled a list of typhoons that came within 500 km of Vietnam and the Philippines. Thereafter, we collated information on rice-related damage from typhoons from published databases and other online sources to create a database with information on (i) the size of rice area damaged, (ii) the volume of rice production lost, and (iii) the value of rice crop lost. We compiled data from 1970 to 2018, and we focused on Vietnam and the Philippines, as these two Southeast Asian countries are frequently affected by typhoons [12,13]. As different crops respond differently to wind and rain [4], we limit the scope of our research to rice as it is a major staple food in these two countries, and agricultural losses may affect local and regional food security [14]. In both countries, rice fields have been repeatedly damaged by typhoons [15,16,17], but the areas that are prone to agricultural damage remain unclear, while the overall magnitude of damage on a national level is uncertain. This is partly because research on crop losses tends to be event-specific and data from multiple events were rarely aggregated and analyzed as a whole [12,18]. By building a comprehensive database on rice damage in two countries, we hope that the information will allow vulnerable hotspots to be identified so that risk reduction efforts like the planting- of lodging-resistant varieties can be considered [6]. In addition, insurance and financial companies can use the loss data for risk analyses, developing risk transfer products, and determining compensation payouts [19]. Lastly, we used the data we have compiled to assess how typhoon intensity in terms of landfall wind speeds had influenced rice damage to provide insights on how typhoon characteristics may influence the extent of rice damage.

2. Data and Method

To obtain a list of typhoons that damaged rice plants in Vietnam and the Philippines, typhoons that passed through or passed close to each country (within 500 km from the coastline) from 1970 to 2018 were first identified from the Digital Typhoon database [20]. A 500 km buffer was chosen because rain within 500 km from the center of a typhoon can be considered typhoon rain [21], and we identified if the cyclone was within this 500 km limit by displaying the typhoon tracks on Google Earth and using the measurement tool to ensure the typhoon track was within the 500 km radius. Information such as the date of the event, the maximum wind speed, and the landfall wind speed were also noted. Landfall wind speed was determined by reviewing the typhoon track information on the Digital Typhoon database and finding the location at which the typhoon intersected with the coastline [22]. The recorded wind speed at the point nearest the coastline was taken to be the landfall wind speed. After this, we grouped the typhoons into six categories based on their landfall intensity to reflect each typhoon’s potential to cause damage. Typhoons that did not make landfall were also included as a separate category, as rice crops in coastal areas can be damaged by strong winds and heavy rain from a passing typhoon. The six categories were No landfall (LF), tropical storm (TS), Typhoon Categories 1, 2, 3, and 4. Except for the No LF category, classification for the rest were based on the Saffir–Simpson Hurricane Wind Scale [23]. We used landfall wind speed instead of the maximum wind speed to determine the intensity of the typhoon, as the typhoon may have weakened by the time it reached the coastline of Vietnam and the Philippines [22]. In addition, if a typhoon had multiple landfall locations, the higher landfall wind speed was used for analysis.
Next, information on damage locations and the amount of crop damage was compiled from newspaper reports, humanitarian relief reports, and other published online sources for each typhoon event. Non-English publications were translated with the help of Google Translate, and the information was included if relevant. These sources were obtained from a Google search with various permutations of the following keywords: “typhoon/typhoons”, “rice”, “damage”, and the country name. Individual typhoon name(s) and the year of occurrence were also used. Information was also obtained by searching the regional ADHRC database, the national-level NDRRMC database for the Philippines, and ReliefWeb, a website for humanitarian information. To reflect the diversity of information reported, rice damage was classified according to (i) the size of the rice area damaged, (ii) the volume of rice production lost, and (iii) the value of the rice crop lost. The rice damage indicators we chose complemented each other as the production loss should be equal to the land affected multiplied by the yield per hectare, while the value of crop lost should be the yield lost multiplied by the price of rice. To facilitate comparison, the units of measurement were standardized to hectares (ha) for areal damages, metric tonnes for production losses, and United States dollar (US$) for monetary losses. As the monetary value of rice lost may be reported in the domestic currency, we used the prevailing yearly US$ exchange rate at the time of the report to convert all values to US$ to facilitate comparison. Rice damage data were sometimes amalgamated with damage data for other crops. In addition, the locations of rice damage were also noted. As the data for rice damage for each province was often aggregated, we focused on highlighting the frequency with which a province was affected by a passing typhoon. We included all agricultural loss data in our database, but we only analyzed data on rice damage data. Our database is found in Supplementary Material S1.
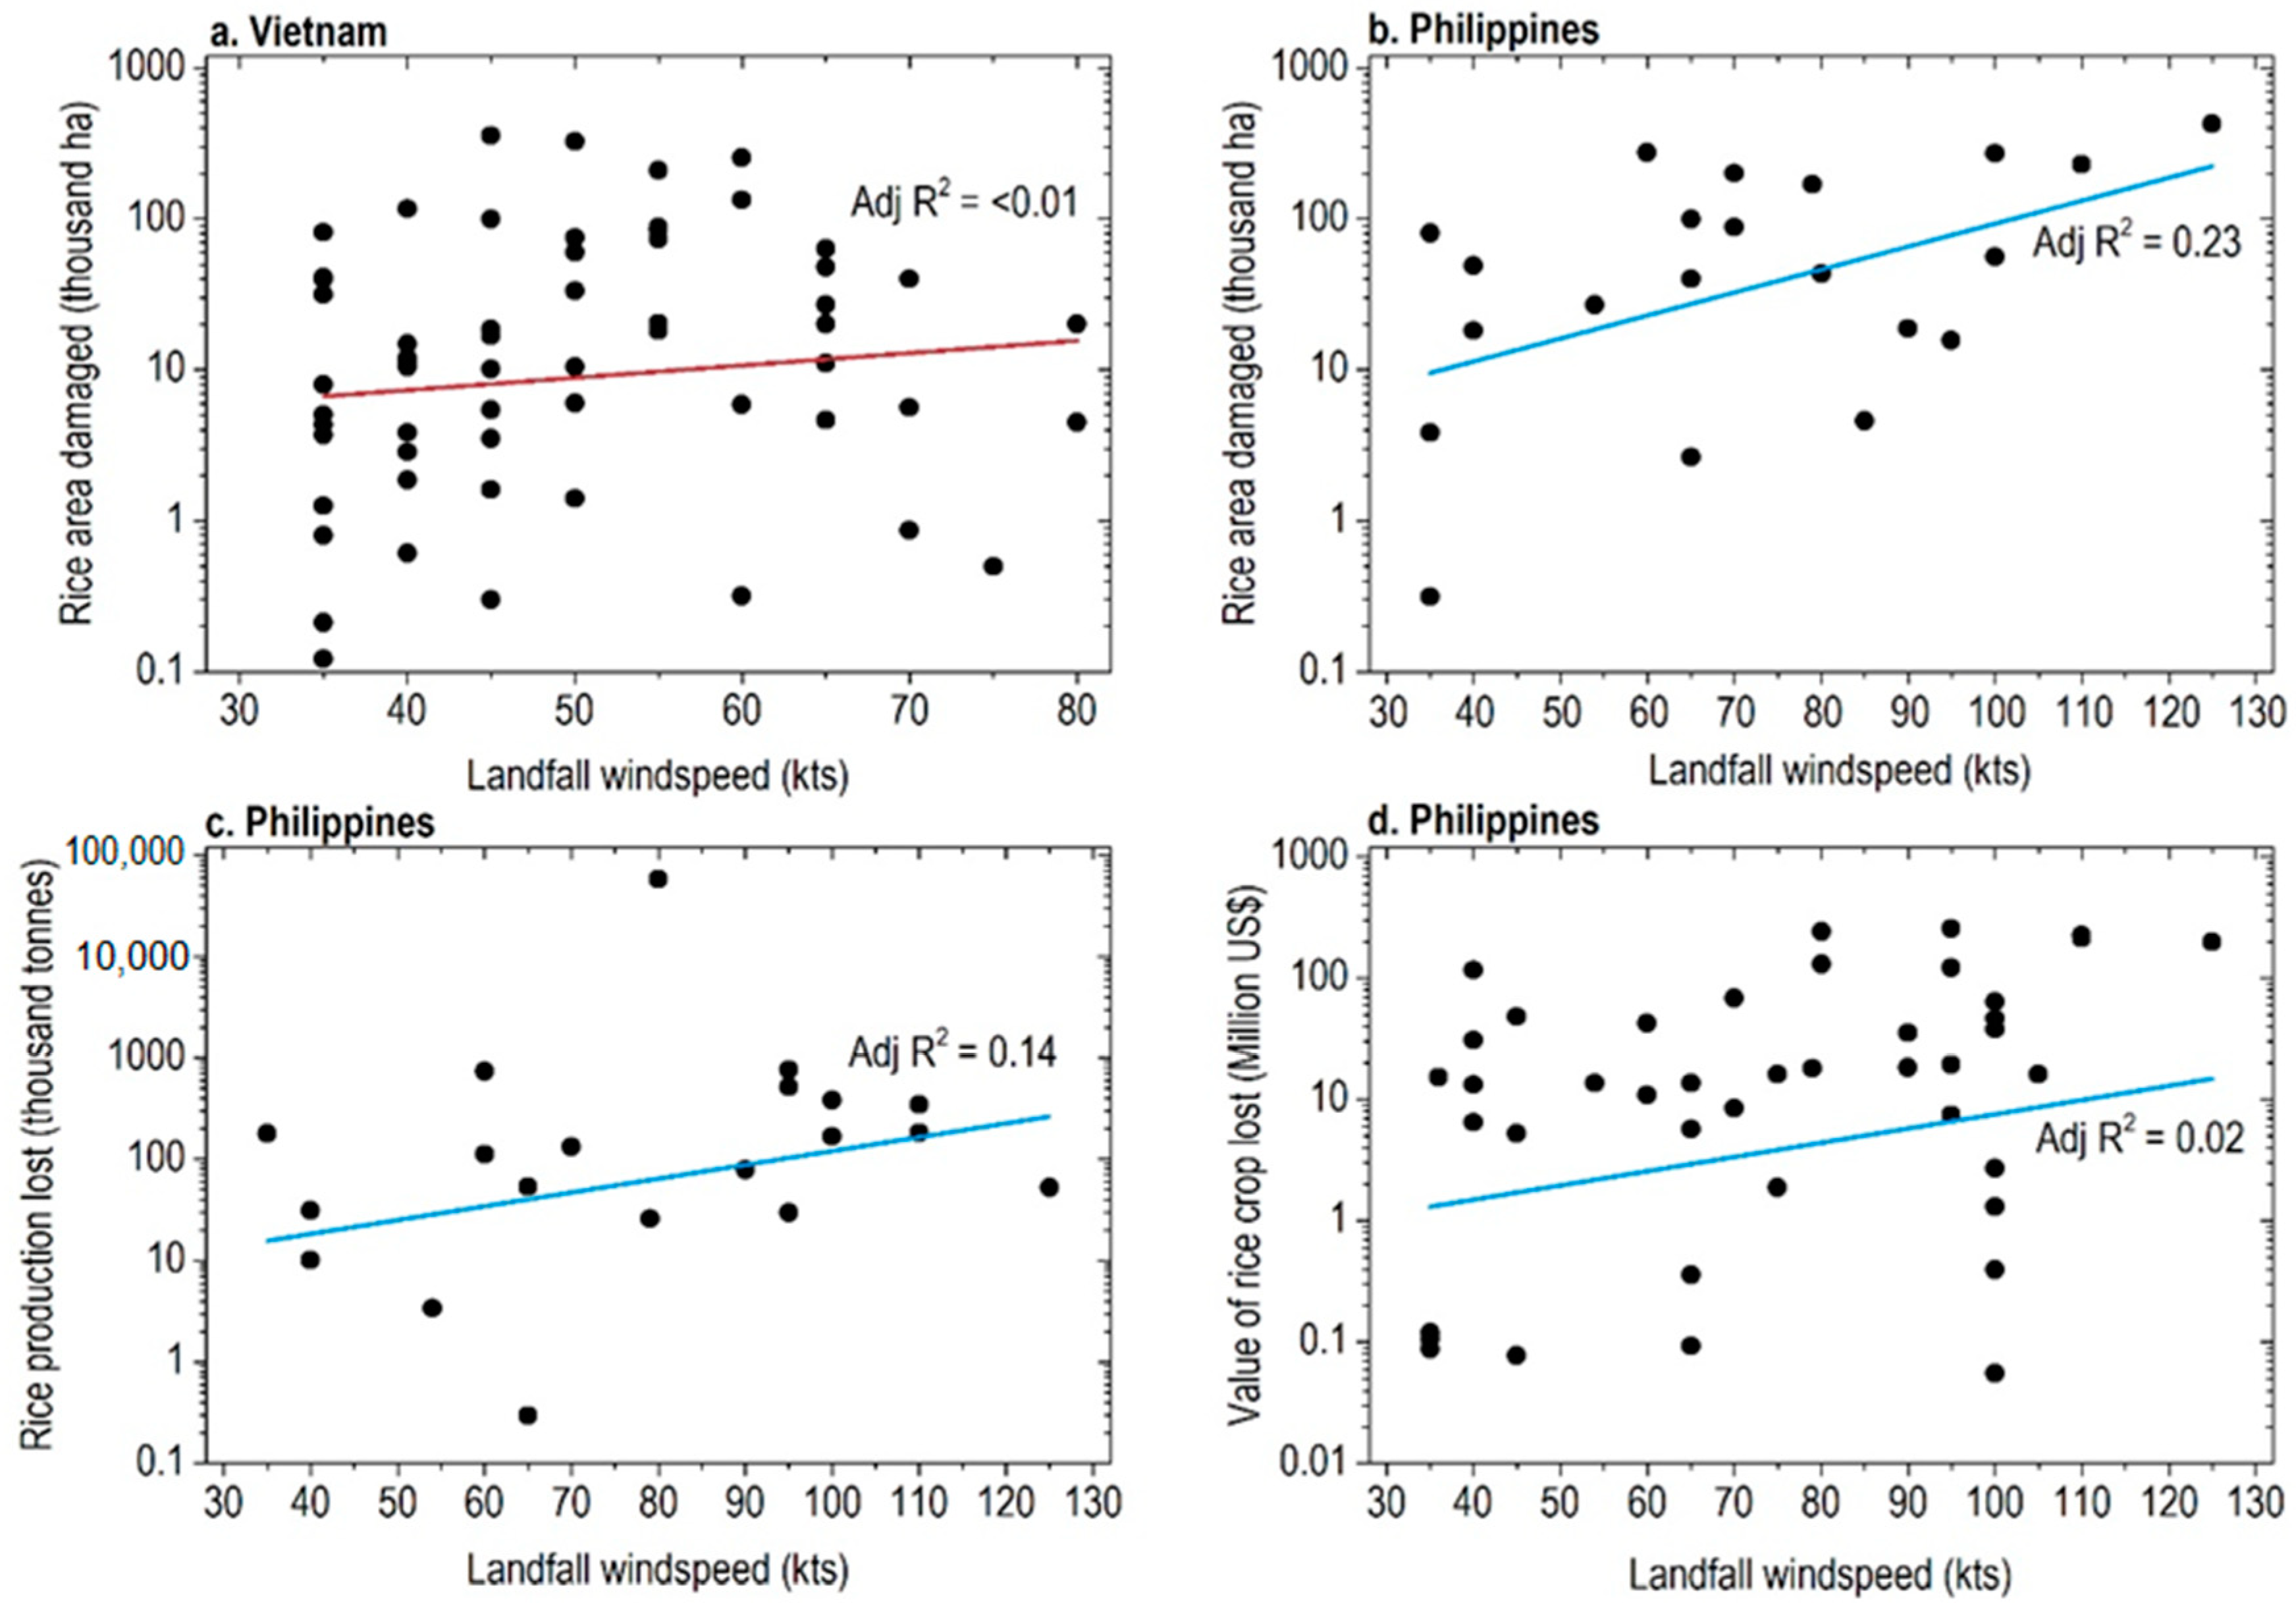
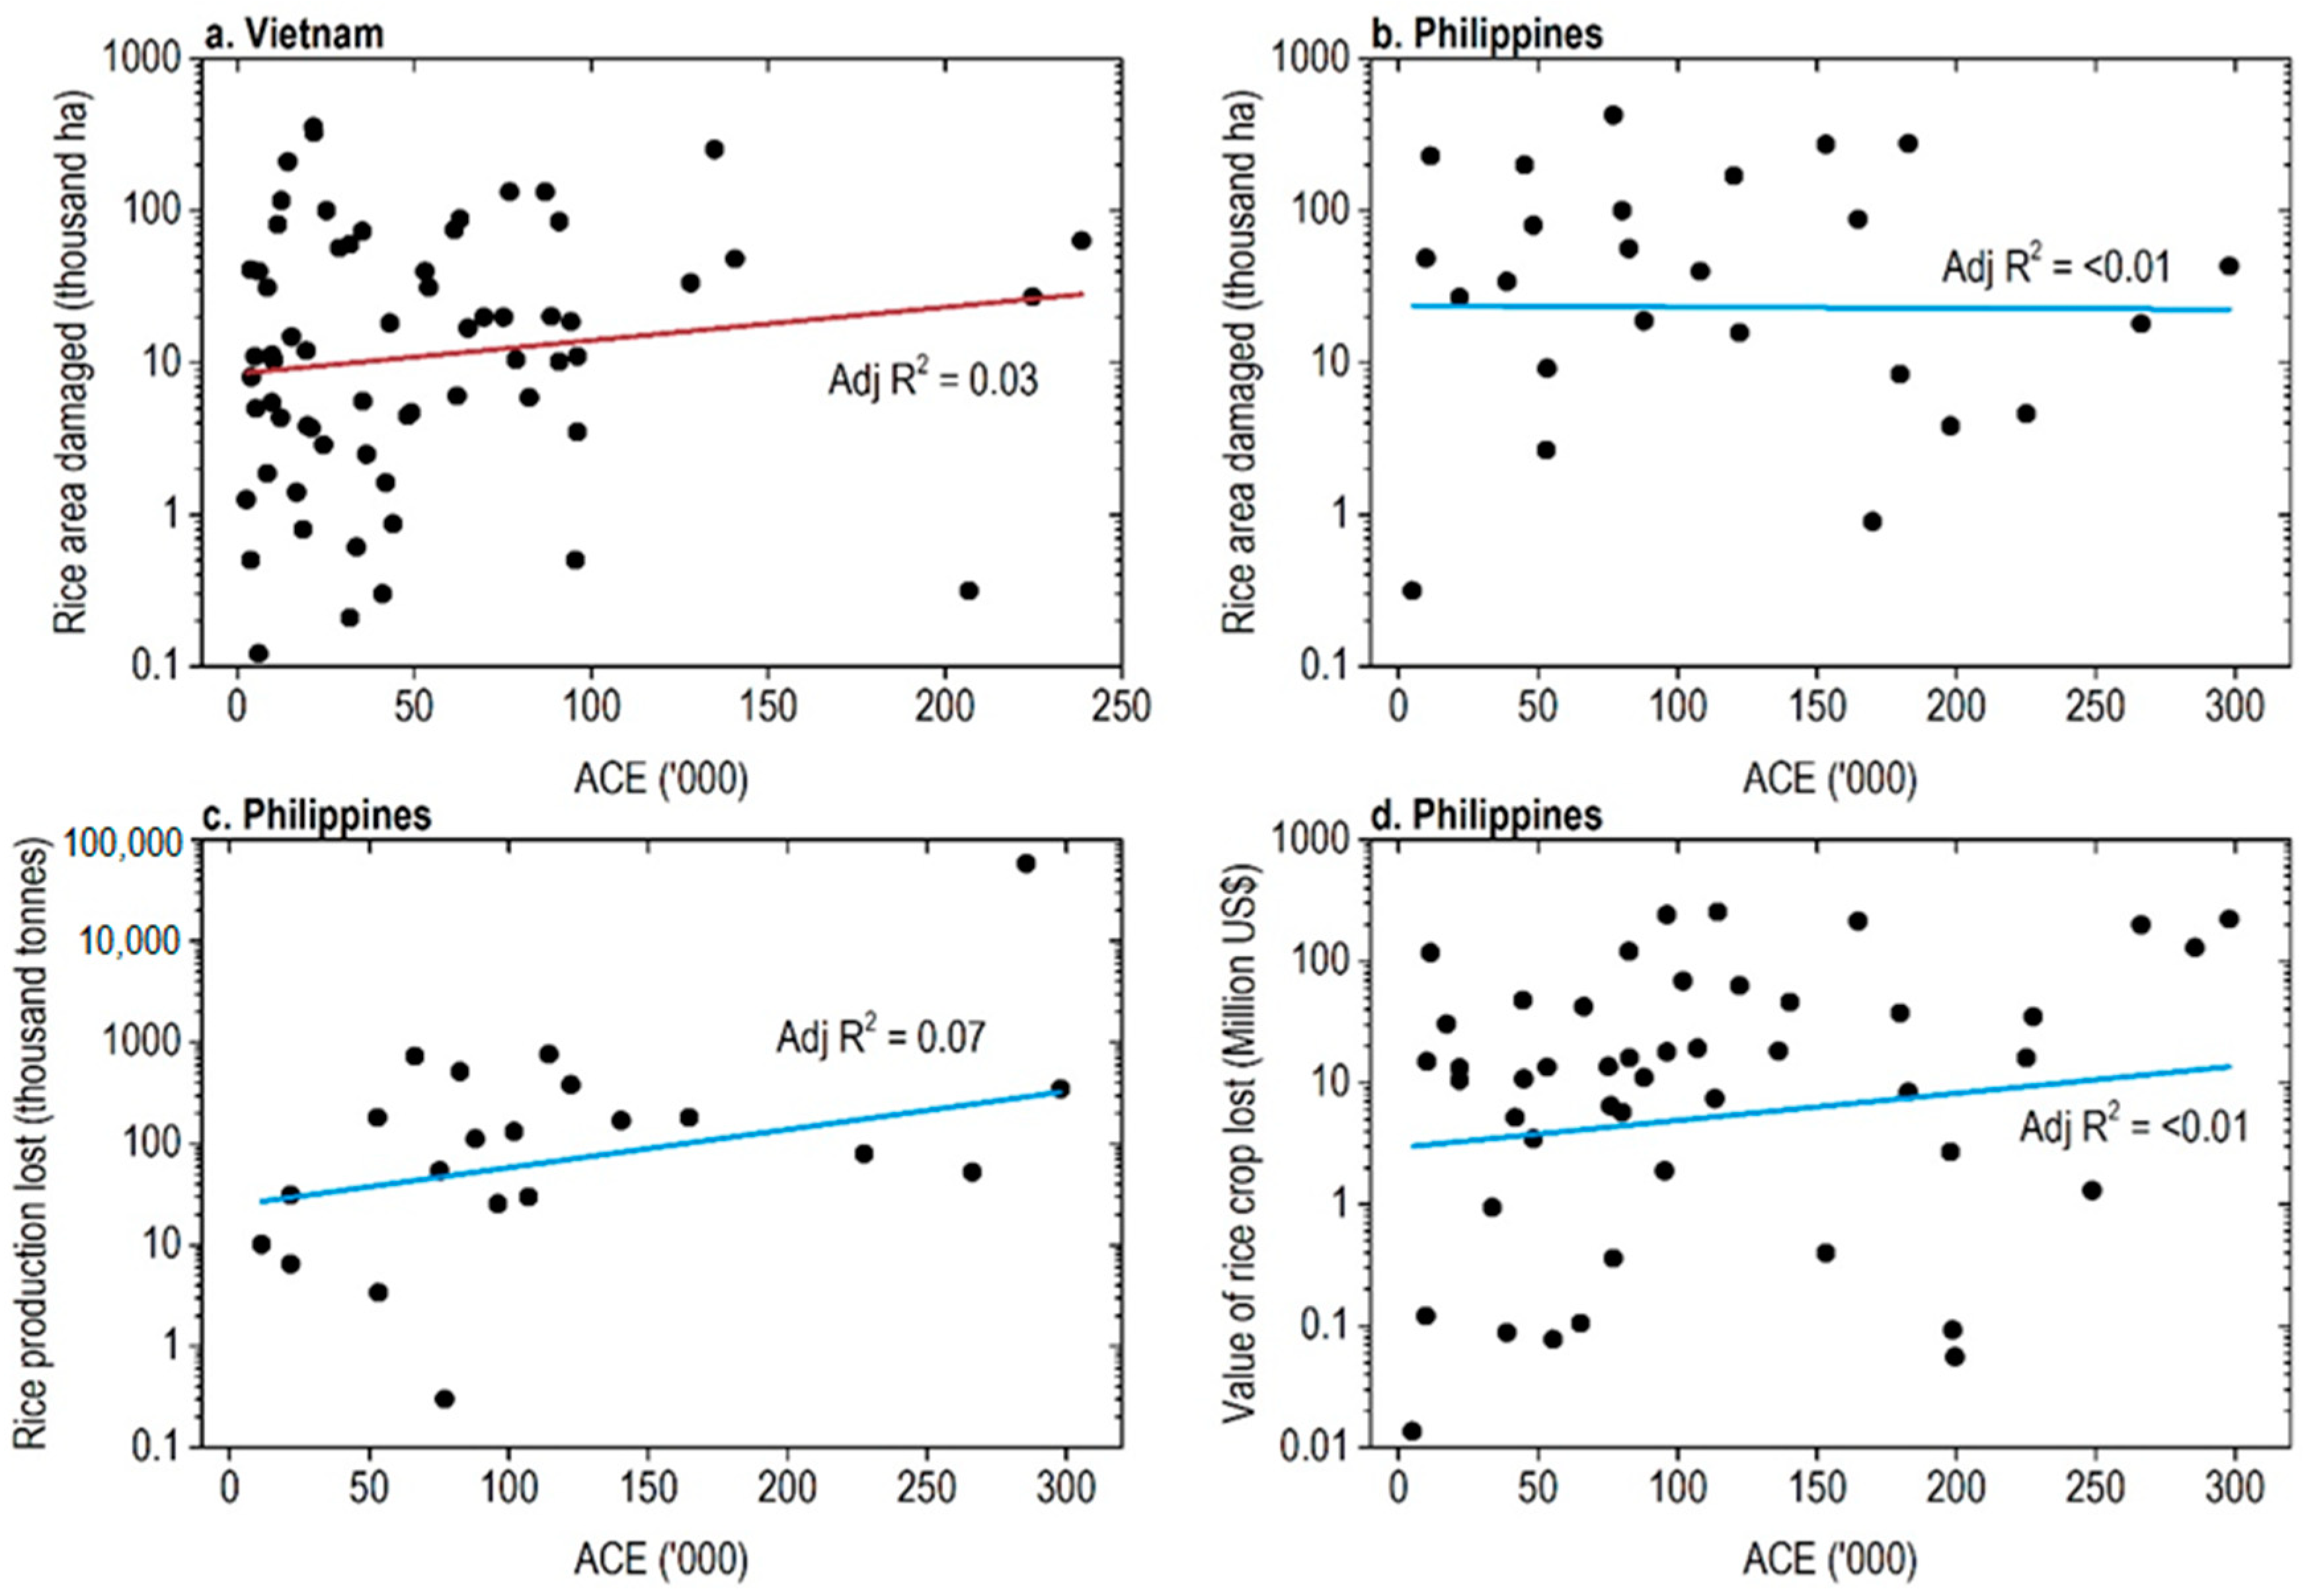
A single typhoon event may have multiple values for each indicator of loss as we compiled damage data from multiple sources. Some reports had a set of minimum and maximum values, while others reported a single value of loss. As such, we had to simplify the data for analysis. For cyclones with multiple reports of damage, we noted the minimum and maximum values reported and derived a midpoint (i.e., Minimum + Maximum divided by two). If only a single number was available, that number was used for analysis. To assess how typhoon intensity influences agricultural loss, the landfall wind speed of a typhoon was used as a proxy for typhoon intensity, and linear regression analysis was performed to determine the relationship between landfall wind speed and (i) the size of rice area damaged, (ii) the volume of rice production lost, and (iii) the value of rice crop lost. To complement our findings, we also correlate the three indicators of loss to Accumulated Cyclone Energy (ACE). ACE is a wind-based index to measure the strength and duration of a storm. The ACE index for each typhoon is calculated by summing the squares of the estimated six hourly maximum sustained wind speeds for all periods in which the system is at least tropical storm strength (winds ≥ 39 mph) [24,25]. We obtained the ACE index for each typhoon from the Digital Typhoon database, and the information, together with our analysis data, was presented in Supplementary Material S2.

3. Results

3.1. Typhoon Frequency and Landfall Intensity

A total of 829 typhoon events made landfall or passed within 500 km of Vietnam and the Philippines from 1970 to 2018. However, only 128 events (15%) were associated with reports of rice damage. For Vietnam, 303 typhoons occurred from 1970 to 2018, with 68 typhoons (22%) associated with reports of rice damage. For the 68 typhoons that damaged rice, the location of typhoon genesis was evenly split between the Pacific Ocean (52%) and the South China Sea (43%). A total of 27 out of these 68 typhoons (40%) happened between 2010 and 2018. The next time period with the highest number of typhoon-induced rice damage was from 1980 to 1989 (17 typhoons). There was no agricultural loss data reported from typhoons from 1970 to 1979 (Figure 1a; Table 1). Of the 303 typhoons that affected Vietnam during our study, the number of typhoons with information on rice damage ranged from 6% for typhoons with no landfall (6 out of 100) to 31% for Category 1 events (15 out of 49) to 32% for typhoons with the intensity of a tropical storm (47 out of 147; Figure 1c). Based on the landfall wind speeds of the typhoons that caused rice damage, 47 typhoons (69%) were tropical storms, while another 15 typhoons (22%) were Category 1 events. The remaining six typhoons caused rice damage without making landfall.
For the Philippines, a total of 526 typhoons made landfall or passed within 500 km of the Philippines from 1970 to 2018. Of these, 60 typhoons (11%) had reports of rice damage. Most of these typhoon events (97%) originated in the Pacific Ocean, and 42 events (70%) occurred between 2010 and 2018. In contrast, only nine typhoons had caused rice damaged in the preceding 10 years (i.e., 2000–2009). Like Vietnam, there was no data from 1970 to 1979 (Figure 1b; Table 1). Out of the 526 typhoons that affected the Philippines, the number of typhoons with information on rice damage was 5% for typhoons with no LF, 10% for TS, 15% for Category 1, 22% for Category 2, 42% for Category 3, and 50% for Category 4 (Figure 1d). The sole Category 4 event that damaged rice during our study period was Typhoon Megi in 2010, while rice damage from the other Category 4 typhoon, Typhoon Haiyan in 2013, was amalgamated with other crops, and we had to exclude this information as we focused solely on damage to rice crops in this paper. Of the 60 typhoons that damaged rice in the Philippines, 28% were tropical storms (n = 17), while 25% were Category 1 typhoons (n = 15). Our findings showed that eight Category 2 typhoons (13%), 10 Category 3 typhoons (17%), and 1 Category 4 typhoon (2%) had damaged rice during the study period. Lastly, 9 out of 60 typhoons (15%) did not make landfall, but the accompanying rains and strong winds damaged rice plants.

3.2. Spatial Frequency of Typhoon-Induced Rice Damage

In Vietnam, Nghe An (17 times), Khanh Hoa, Phu Yen, Quang Nam, Quang Tri, and Thanh Hoa (all 13 times) had the most reports of typhoon-induced rice damage (Figure 2). At a regional level, these provinces were evenly split between the North Central Coast (Nghe An, Quang Nam, and Quang Tri) and the South-Central Coast (Khanh Hoa, Phu Yen, and Quang Nam). In the Philippines, typhoon-induced rice damage was most frequently experienced in Cagayan, Tarlac (both 16 times), and Nueva Ecija (15). The provinces of Albay, Aurora, Bulacan, Isabela, Pangasinan, Zambales, Camarines Sur, Ifugao, and Pamapanga were affected 13 to 14 times (Figure 3). Rice fields in Cagayan Valley and Central Luzon in northern Philippines and Bicol Region in the east were predisposed to typhoon damage.

3.3. Area of Rice Crops Damaged

The average area of rice crops damaged per typhoon event from 1970 to 2018 was higher in the Philippines compared to Vietnam. Notably, Vietnam had more data on areal losses (66 data points) as compared to the Philippines (26 data points). The average area of rice damaged per typhoon event ranged from 42,407 ha in Vietnam (range: 122–357,815 ha) to 83,571 ha in the Philippines (range: 85–425,134 ha). In Vietnam, the least damage was from Typhoon Vamco (2015), while the most damage was from Typhoon Frankie (1996), and both were classed as tropical storms based on their landfall wind speed. Conversely, the typhoon that caused the least damage was Rammasun in 2008, while the sole Category 4 storm in the Philippines in 2010 (Typhoon Megi) caused the most damage to the rice area in the Philippines (Supplementary Material S2).
In Vietnam, tropical storms caused more damage than Category 1 events as the average area of rice damaged by typhoons in Vietnam follows the order: Category 1 (18,758 ha) > No LF (18,774 ha) > TS (52,687 ha) (Figure 4a; Table 2). Although Category 3 and 4 events caused the most areal damage in the Philippines, the relationship between typhoon intensity and areal losses was not linear at lower wind speeds. Stronger typhoons did not necessarily result in the highest area of rice damaged, and this was confirmed by a linear regression which showed that the area of rice damaged had a weak relationship with landfall wind speed in both countries (Figure 5a,b). There was also a weak relationship between ACE and the area of rice damaged (Figure 6a,b). Ultimately, we acknowledge that the extent of areal losses is dependent on the size of the rice growing area; however, we did not have information on the extent of rice growing areas during our study period to do further analysis.

3.4. Volume of Rice Production Lost

From 1970 to 2018, the average rice production that was lost per typhoon event was higher in Vietnam than in the Philippines (539,150 vs. 190,227 tonnes). The Philippines had 20 data points, while Vietnam had 4 (Table 2). Production losses ranged from 800 to 2,000,000 tonnes in Vietnam. The lowest production loss was due to Typhoon Cecil in 1985, while the greatest loss was due to Typhoon Ruth in 1980. Cecil was a Category 1 event, while Ruth was a tropical storm. In the Philippines, the lowest production loss of 299 tonnes was by Typhoon Conson in 2010, while Typhoon Nalgae in 2011 resulted in the highest volume of rice production lost (760,207 tonnes). Conson was a Category 1 event while Nalgae was a Category 2 event (Supplementary Material S2). Typhoon Rosita in 2018 was excluded from the calculation of the mean for the Philippines as the most recent report for Typhoon Rosita had a maximum value of 116,000,000 metric tons of rice lost [26], and there may be a reporting error as the next highest value of 800,000 metric tons was reported a day earlier by another press agency [27].
For Vietnam, although tropical storms (TS) are less intense events with weaker winds, the average quantity of loss associated with TS was 900 times higher than the production loss that resulted from stronger Category 1 events (718,600 tonnes vs. 800 tonnes). The limited data points for Vietnam may have skewed the results; there was only one data point for the Category 1 event and three data points for TS. More data were available for the Philippines, and the relationship between typhoon intensity and production loss was also not direct as well. The average quantity of rice produce lost was ordered as such: No LF (6402 tonnes) < Category 4 (52,303 tonnes) < Category 1 (53,203 tonnes) < TS (178,638 tonnes) < Category 3 (269,2019 tonnes) < Category 2 (346,080 tonnes) (Figure 4b; Table 2). Likewise, there was a weak relationship between landfall intensity and the volume of rice produce that was lost (Figure 5c). Similarly, the correlation between ACE and the volume of rice produce lost was equally poor (Figure 6c).

3.5. Value of Rice Crops Lost

Data on the monetary value of rice lost was limited to the Philippines (50 data points). From 1970 to 2018, the average value of rice lost was US$ 42 million per typhoon event, and the value of loss ranged from US$ 377 to US$ 254 million. The lowest value of loss was recorded after Typhoon Nesat in 2017, and the highest was from Typhoon Nalgae in 2011. Notably, Typhoon Nesat was a Category 1 typhoon, while Typhoon Nalgae was a Category 2 event (Supplementary Material S2). On average, the value of rice damaged based on landfall intensity was the highest for Category 4 (US$ 198 million), followed by Category 2 (US$ 76 million), Category 3 (US$ 60 million), and Category 1 typhoons (US$ 39 million). Tropical storms (US$ 22 million) and typhoons that did not make landfall (US$ 9 million) resulted in the least economic loss (Figure 4c; Table 2). Although Category 4 typhoons resulted in the highest value of rice lost, there was only one Category 4 typhoon with rice damage data. Overall, there was a weak relationship between landfall intensity and the value of rice lost (Figure 5d). The relationship between ACE and the value of rice lost was also weak (Figure 6d).

4. Discussion

4.1. Rice Damage Not Solely Due to Strong Winds

There was a weak relationship between landfall wind speed and the three indicators of rice damage, which suggests that rice damage was not primarily due to strong winds. The relationship between ACE and rice damage was also poor, which confirmed that typhoon wind speed was not the sole reason behind the amount of rice damage in the two countries. Ye et al. [3] used a regression model to quantify the relationship between tropical cyclone-induced direct economic loss and maximum wind speed in China. Their results from 2000 to 2015 showed that the log of the loss rate was linearly correlated with the log of TC intensity, and a doubling in maximum wind speed had increased TC-induced economic losses by 225%. In contrast, our findings showed that landfall wind speed was not a significant determinant of rice damage in Vietnam and the Philippines, even though strong winds may cause the rice plants to lodge. Rice grains may also be striped, and the plant is subjected to water stress [6,15]. In the case of Vietnam, principal component analysis (PCA) using landfall wind speed and central pressure revealed that Typhoon Doksuri was the strongest among all the typhoons that affected Vietnam from 1977 to 2001, and this was followed by Typhoon Cecil in 1985, Xangsane in 2006, and Damrey in 2017 [22]. Our review showed that Doksuri, Damrey, and Cecil only damaged a relatively modest area of rice that ranged from 4487 ha to 20,000 ha. For typhoon Xangsane, the information for rice damage was combined with other crops and, thus, was excluded from our analysis. The lack of a relationship between typhoon wind speed and rice is possibly due to the stronger cyclones missing the vulnerable growing and harvesting periods for rice. Rice plants were the most vulnerable to wind speeds of between 8 and 70 km/h at the heading stage and 14–30 days after heading [5], and it was possible that most typhoons may have occurred when the rice plants were less prone to wind damage.
Several studies have showed that typhoon-induced rainfall was a significant factor in agricultural losses, and this may be the case in our study. For example, Ishimaru et al. [6] exposed two different rice cultivars to a passing typhoon and found that the upper parts of the rice plant had been soaked by the rain. As a result, the weight of the canopy was 1.3 times higher than in normal conditions. This made one of the rice cultivars they studied more susceptible to bending over. Su and Kuo [8] highlighted that heavy rain during ripening induced preharvest sprouting, while during the flowering stage, heavy rain increased the frequency of unfilled grains. In both cases, overall yields would be reduced. Heavy rain can also cause plants to be submerged and lead to a reduction in biomass as light interception is reduced and leaf growth is hindered [28]. As we were not able to obtain rainfall data, further work is needed to evaluate the extent to which rice crops are affected by typhoon-induced heavy rain. Additionally, it is possible that a combination of heavy rain and strong winds had an adverse effect on rice production, and work can also be conducted to de-couple the separate effects of strong winds and heavy rains on rice damage. At the same time, information on the growth stage of the crop at the time of the typhoon can also be incorporated to improve the analysis, as the impact of the typhoon is dependent on the condition of the crop.
One metric that can be used to quantify the hazard posed by tropical cyclone rainfall is the Extreme Rain Multiplier (ERM). To determine the ERM, typhoon rainfall is expressed as a multiple of the climatologically derived two-year rainfall value. This index allowed researchers to identify damaging historically typhoon rainfall events that would have been classified as “weak” cyclones using wind-based metrics like the Saffir–Simpson scale [29]. The lack of rainfall data at a fine enough resolution would, however, limit the use of this rainfall metric. Besides ERM, the storm surge hazard potential index (SSHPI) has been proposed to estimate typhoon-induced peak surge levels along the coastline. To predict surge potential, regional bathymetry information is combined with 10 min maximum wind speed, a radius of 50 kt wind, translation speed, and coastal geometry. SSHPI can provide an instantaneous measure of a typhoon’s storm surge potential and measure the extent of a storm surge in a given location [30]. The magnitude and extent of the surge event can then be compared to the extent of rice damage or the volume of rice produce lost to obtain insights into the relationship between typhoon intensity and storm damage.

4.2. Data Limitations and Uncertainty

The data we compiled were fraught with uncertainties due to a lack of methodological standardization. For example, during data compilation, we found that damage locations were reported at a range of spatial scales ranging from region/division level (largest scale) to province/district level to municipalities/districts/sub-districts/townships (smallest scale). Non-standardization also meant that several indicators of rice damage were used. Some sources provided areal damages; others published production losses. For our database, units were standardized to hectares for areal damages, metric tonnes for production losses, and US dollars for monetary losses. Information on rice damage from multiple locations was sometimes amalgamated to give a single loss value, while location-specific figures were available in some sources. Ideally, a spatial analysis of rice damage for each typhoon event should be performed to give a more accurate overview of geographical vulnerability. However, this was not always possible when damage data from various locations were combined. In addition, the definition of “damage” also varied across news sources. Some news sources used the term “damage” to describe the impact on rice crops. Other news sources used terms such as “affected”, “ruined”, “destroyed”, and “submerged”. The terms “affected” and “submerged” may indicate that the crop was affected by the typhoon but not damaged. As a conservative measure, we considered all values as the amount of rice damaged by the typhoon.
Ambiguous descriptions were another problem. Some sources provided detailed locations of rice damage, while others provided non-specific geographical information like “Northern Vietnam” [31] or “South of Hai Phong” [32]. There were also spelling errors, different spellings for a similar place, and changes to the names of locations, which added uncertainties to the database. Next, online news sources did not always provide information on how their data were collected. In our analysis, for each typhoon, we shortlisted data based on the minimum and maximum values reported and derived a midpoint as we found it challenging to evaluate which source had the “most accurate” rice damage value. While the most recent source may have been published when the event had concluded and there was arguably more time to collect and verify information, without any detailed methodological information, attempting to make a value judgment was difficult. In addition, rice damage data were sometimes combined with other crops to provide an aggregated value for crop loss. Typhoon Haiyan in 2013 was one the strongest typhoon that was recorded in the Philippines [33]. However, no information on rice losses was available as the rice production loss was combined with corn, vegetables, and other high-value commercial crops [34]. If data on rice damage was combined with other crops, they were excluded from our analysis for consistency.
Lastly, we acknowledged that loss and damage figures may be deliberately revised downwards to cover up inadequate disaster preparedness and response. In the chaos of a disaster, double counting and false reporting were also possible [35]. For Typhoon Ketsana in 2009, a comparison of central government data with provincial-level data for Quang Nam province in Vietnam showed a large difference in the quantity of paddy inundated. Specifically, the Central government had reported that 3930 ha of paddy were inundated, while provincial data records showed 22,523 ha. Our findings suggest that potential errors were introduced in the process of data collection [36]. These issues have been previously highlighted by reviewers of disaster data [11,37,38], but the problems persist. Therefore, users of disaster data should be aware of the limitations associated with the use of disaster data.

4.3. Towards Better Data

One way to improve the quality of disaster data is to adopt a standardized method for reporting the data. In particular, the Food and Agricultural Organization (FAO) has partnered with the United Nations Office for Disaster Risk Reduction (UNDRR) to develop a standardized method for collecting, analyzing, reporting, and disseminating agriculture-related impacts. The method developed by FAO is called Damage and Loss Assessment in Agriculture [39], and it consists of five components that are aggregated to quantify the total effect of disasters on agriculture:
Impact to agriculture = DL (C) + DL (L) + DL (FO) + DL (AQ) + DL (FI)
where DL (C) is direct damage and loss to crops, DL (L) is direct damage and loss to livestock, DL (FO) is direct damage and loss to forestry, DL (AQ) is direct damage and loss to aquaculture, and DL (FI) is direct damage and loss to fisheries. This method defined the difference between damage (i.e., total or partial destruction of physical assets such as machinery, seeds, and crops) and loss (i.e., declines in the value of agricultural production resulting from the disaster). Each subsector is also further divided into two main components: production and assets. For crop loss, DL (C) = Annual crop production damage + Perennial crop production damage + annual crop production loss + perennial crop production loss + crop assets damage (complete and partial) [39]. However, information such as the number of hectares of crops damaged and/or destroyed (disaggregated by crop type), expected yield reduction of each crop in partially affected plot areas (t/ha), and baseline information on the original area of each type of crops cultivated (ha) are needed [39].
Arguably, data collection in the immediate aftermath of a disaster is challenging, and under emergency conditions, attempting to collect and disseminate detailed loss statistics is considered a low-priority task. To facilitate data collection, prior to a disaster, good baseline information on communities, infrastructure, and properties, including crop-growing areas, should be collected. In addition, place names, definitions, codes, categories, and units of measurement should be clearly defined and standardized. An appropriate geographical unit should be specified to ensure data are collected at an appropriate scale. For this, a template for data collection can be created. While collecting and consolidating baseline data, creating templates for data collection, and training end-users are time-consuming and resource-intensive, these challenges are easier to address in a non-emergency setting. If resources are limited, collecting baseline data for hazard-prone areas should be prioritized.
Finally, to facilitate the reporting and updating of information, a system that allows end-users to input data directly via cellular or satellite networks can be created [40,41]. When reporting information, the time of recording, the source of information and uncertainties, as well as information on the assessment methodology should be furnished to inform quality assessment [42]. Recognizing these challenges, the FAO has also created a National-level Damage and Loss Information System for agriculture, a tool kit that consists of sample survey forms, data collection tools, database templates, and guidance documents to facilitate data collection [39]. In short, the adoption of this FAO method can help standardize damage data and improve data quality so that management and mitigation plans can be formulated based on more accurate and consistent information.

5. Conclusions

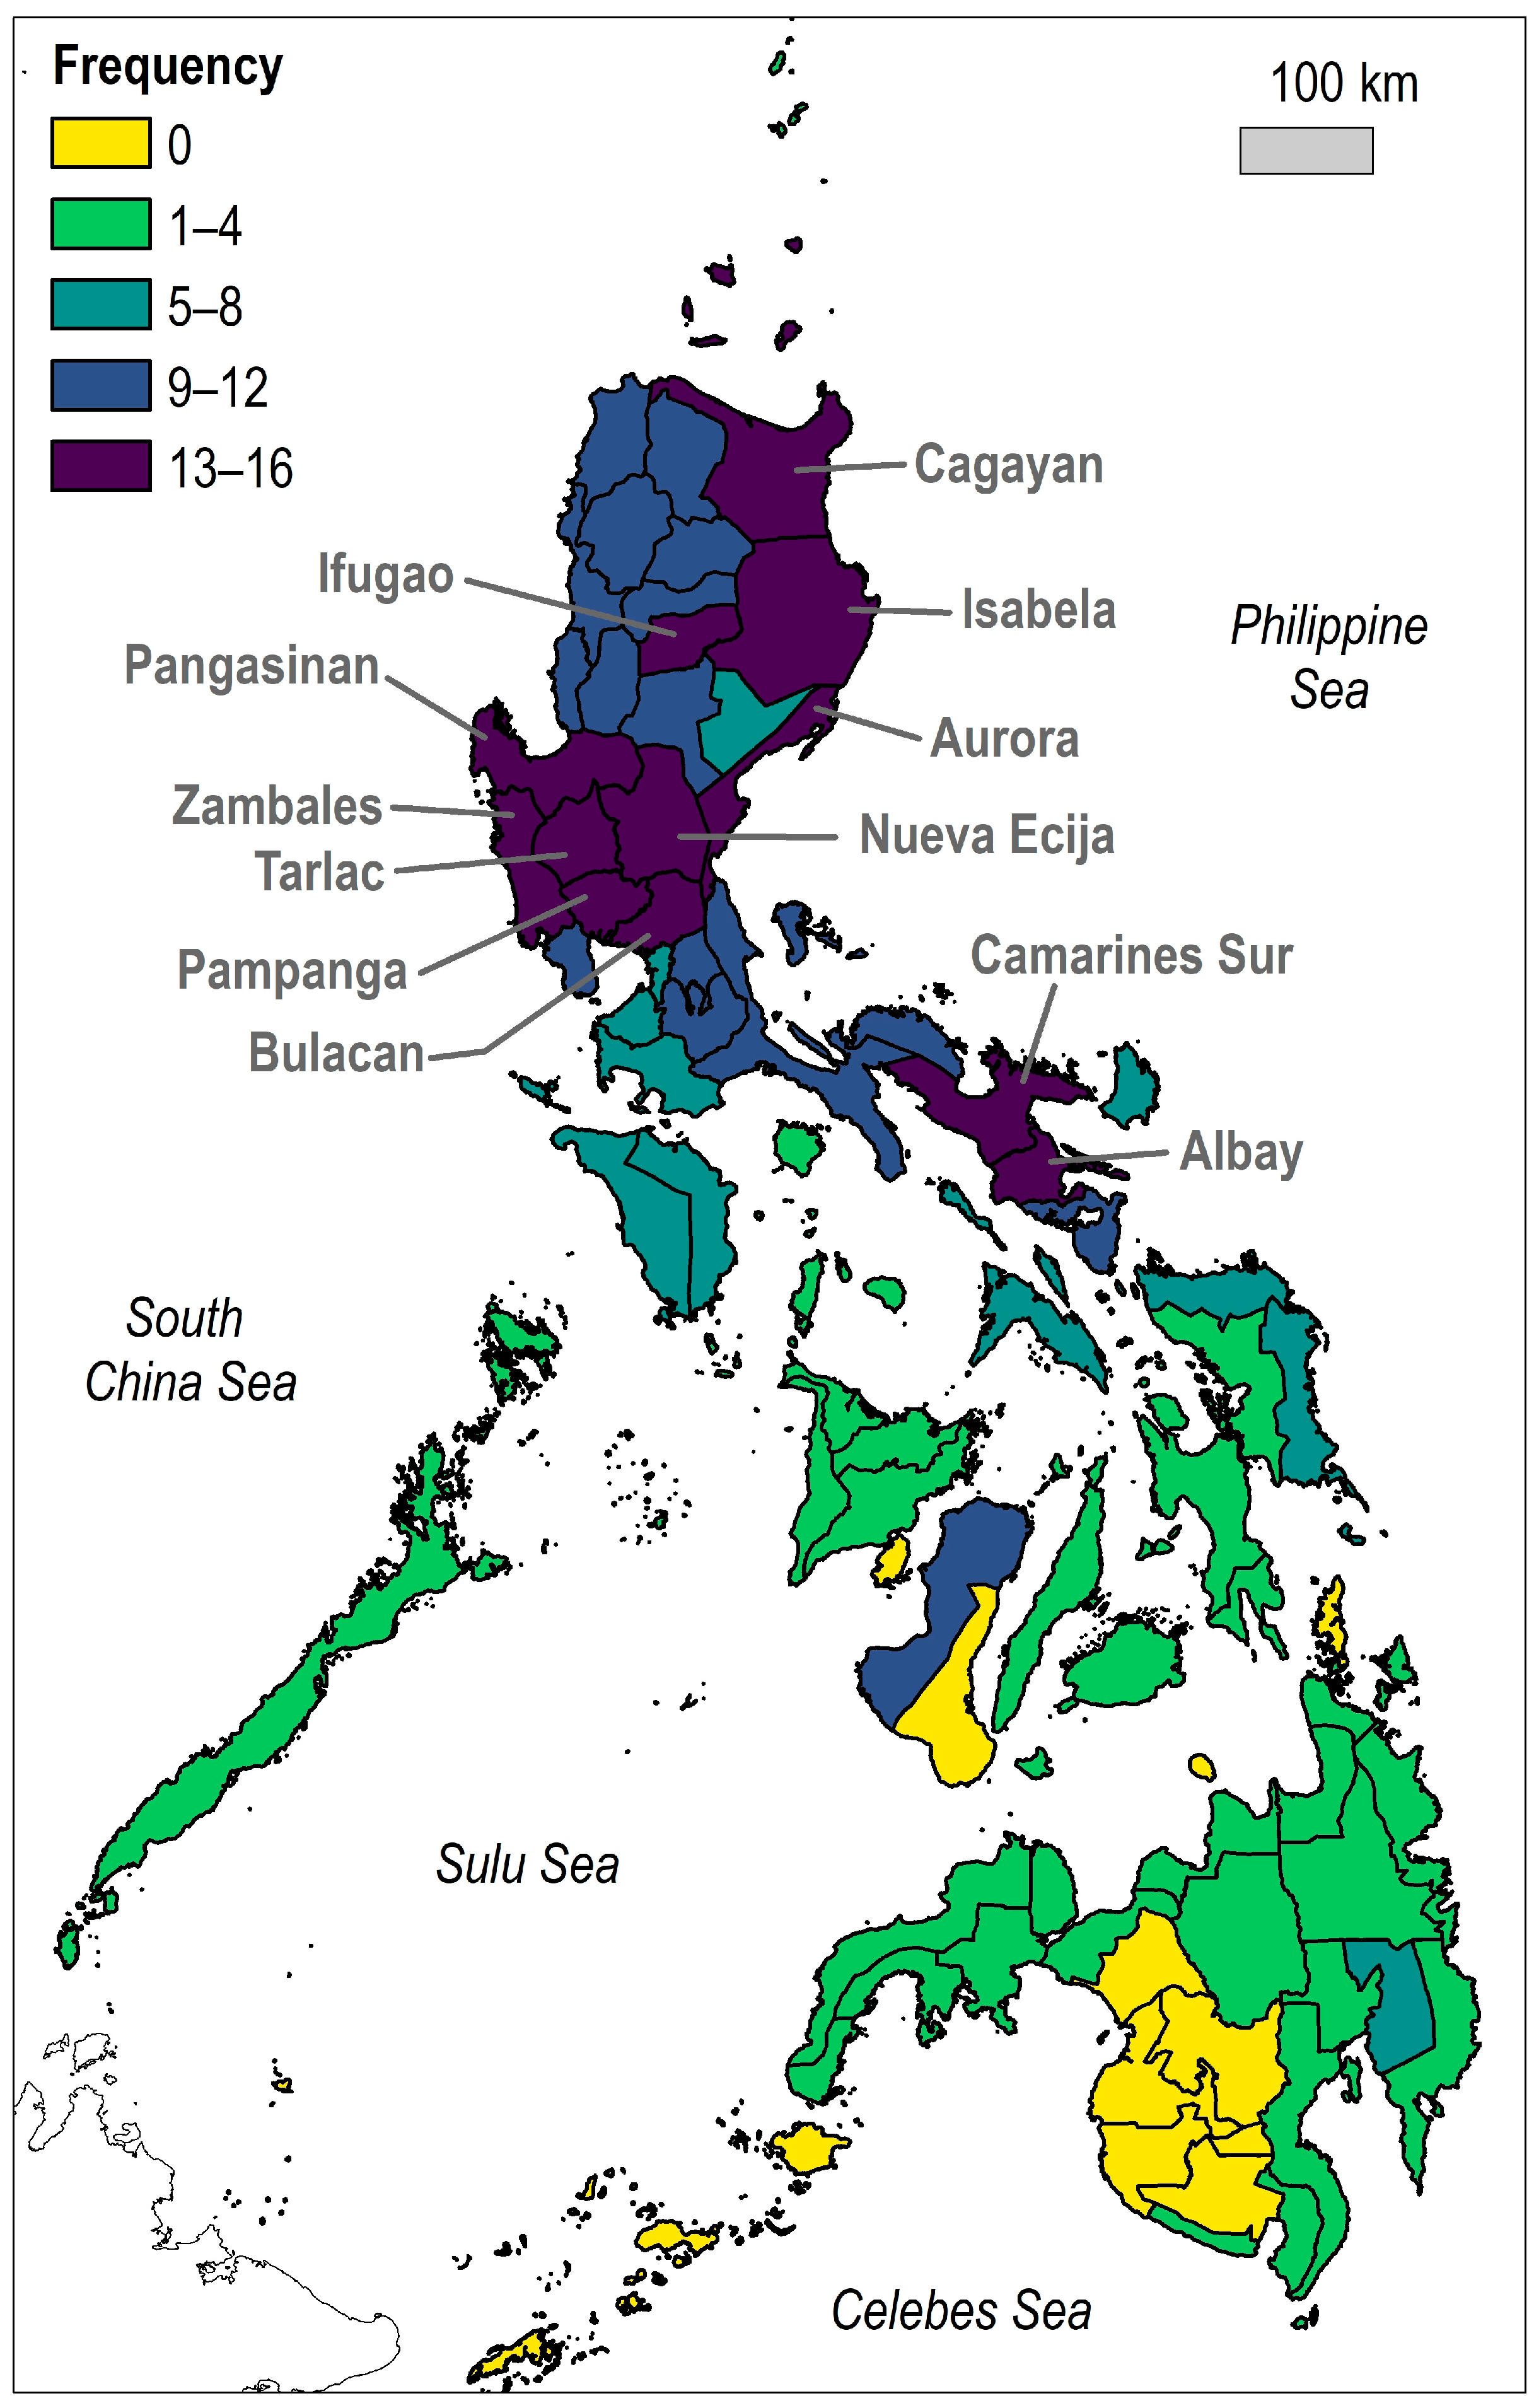
From 1970 to 2018, only 22% of the typhoons that affected Vietnam resulted in rice damage, while the corresponding figure for the Philippines was 11%. Based on landfall wind speeds, tropical storms and Category 1 typhoons often caused rice damage in both countries. In Vietnam, rice fields in Nghe An, Khanh Hoa, Phu Yen, Quang Nam, Quang Tri, and Thanh Hoa provinces were often affected by typhoons. Typhoon hotspots in the Philippines include Cagayan, Tarlac, Nueva Ecija, Albay, Aurora, Bulacan, Isabela, Pangasinan, Zambales, Camarines Sur, Ifugao, and Pampanga. Our findings suggest that rice damage was not primarily due to strong winds, as the typhoons with the highest wind speeds did not cause the most damage to rice crops. In addition, we complemented our analysis with Accumulated Cyclone Energy (ACE), another wind-based metric for assessing typhoon intensity, and the results confirmed that wind was not always the determining factor for rice damage. As heavy rain had influenced agricultural damage in previous studies, the role of typhoon-induced rainfall should be evaluated in future studies. In addition, the growth stage of the rice crop should also be considered in future research as rice plants were particularly prone to damage at the heading and flowering stage.
We are aware that the information we compiled had accounting, geographic, and systemic biases as the primary sources we draw upon have similar ambiguities [37]. Besides a lack of data from 1970 to 2000, we encountered problems related to a lack of disaggregated crop and locational data. To address uncertainties and provide high-quality data for researchers, policymakers, and other users, clear guidelines and standard procedures should be developed. Thereafter, these protocols should be implemented across the various agencies and stakeholders involved in collecting disaster data [37]. The FAO Damage and Loss methodology is one recent standardized approach for recording agriculture-related impacts under precise impact categories. Ultimately, end-users of disaster data must be cognizant of existing errors and uncertainties inherent in the impact values reported and acknowledge these limitations in their analyses.

Supplementary Materials

The following supporting information can be downloaded at: https://www.mdpi.com/article/10.3390/geohazards5010002/s1. Table S1. Summary table of DesInventar Sendai, EM-DAT, NatCatSERVICE and Sigma databases [9,11,38,41]. Supplementary Table S2. Descriptive summary for two national damage databases in the Philippines. Database 1 is maintained by the Natinal Disaster Risk Reduction and Management Council. Database 2 is the Disaster Response Operations Monitoring and Information Centre (DROMIC) by the Disaster Response Management Bureau. Supplementary Table S3. Descriptive summary of two national damage databases in Indonesia – Data Dan Informasi Bencana Indonesia and Geoportal Data Bencana Indonesia. The two databases are maintained by Badan Nasional Penanggulangan Bencana or the Indonesian National Board for Disaster Management. Supplementary Table S4. Descriptive summary of a national damage database in Malaysia - Portal Bencana Pusat Kawalan Bencana Negara. The database is maintained by the National Disaster Command Centre (NDCC). Supplementary Table S5. Descriptive summary of two national damage database in Vietnam. Database 1 is by The Office of Central Steering Committee for Natural Disaster Prevention and Control. The database is maintained by the Vietnam Disaster Management Authority under the Ministry of Agriculture and Rural Development. Database 2 is by the General Statistics Office. Supplementary Material S1 and S2.

Author Contributions

K.W.Y. and J.S.H.L. came up with the idea for this project. K.W.Y. wrote the manuscript with discussions and improvements from all co-authors. J.S.H.L., A.D.S. and P.P.S.T. provided feedback on the analysis of data and helped in the revisions. J.S.H.L. provided financial support for this work. All authors have read and agreed to the published version of the manuscript.

Funding

This research has been supported by the Earth Observatory of Singapore (grant no. M4430263.B50.706022) via its funding from the National Research Foundation Singapore and the Singapore Ministry of Education under the Research Centres of Excellence initiative. This work comprises EOS contribution number 568. Any opinions, findings and conclusions, or recommendations expressed in this material are those of the authors and do not reflect the views of the Ministry of Education, Singapore.

Data Availability Statement

The original contributions presented in the study are included in the article/Supplementary Materials, further inquiries can be directed to the corresponding author.

Acknowledgments

We thank Skye Lee, Nai Ze Ming, and Maye Woo for their help with compiling the rice damage data.

Conflicts of Interest

The authors declare no conflicts of interest.

References

  1. Rana, M.S.; Al Azad, M.A.S.; Islam, M.J. Vulnerability assessment of cyclonic hazards in coastal region of Bangladesh. Urban Reg. Plan. 2018, 3, 34. [Google Scholar] [CrossRef]
  2. Vink, K.; Ahsan, M.N. The benefits of cyclones: A valuation approach considering ecosystem services. Ecol. Indic. 2018, 95, 260–269. [Google Scholar] [CrossRef]
  3. Ye, M.; Wu, J.; Liu, W.; He, X.; Wang, C. Dependence of tropical cyclone damage on maximum wind speed and socioeconomic factors. Environ. Res. Lett. 2020, 15, 094061. [Google Scholar] [CrossRef]
  4. Lin, Y.-C.; Wang, W.-H.; Lai, C.-Y.; Lin, Y.-Q. Typhoon type index: A new Index for understanding the rain or wind characteristics of typhoons and Its application to agricultural losses and crop vulnerability. J. Appl. Meteorol. Climatol. 2020, 59, 973–989. [Google Scholar] [CrossRef]
  5. Agusta, H.; Santosa, E.; Dulbari, D.; Guntoro, D.; Zaman, S. Continuous heavy rainfall and wind velocity during flowering affect rice production. J. Agric. Sci. 2022, 44, 13. [Google Scholar] [CrossRef]
  6. Ishimaru, K.; Togawa, E.; Ookawa, T.; Kashiwagi, T.; Madoka, Y.; Hirotsu, N. New target for rice lodging resistance and its effect in a typhoon. Planta 2008, 227, 601–609. [Google Scholar] [CrossRef] [PubMed]
  7. Setter, T.L.; Laureles, E.V.; Mazaredo, A.M. Lodging reduces yield of rice by self-shading and reductions in canopy photosynthesis. Field Crops Res. 1997, 49, 95–106. [Google Scholar] [CrossRef]
  8. Su, Y.-C.; Kuo, B.-J. Risk assessment of rice damage due to heavy rain in Taiwan. Agriculture 2023, 13, 630. [Google Scholar] [CrossRef]
  9. Below, R.; Wirtz, A.; Guha-Sapir, D. Disaster Category Classification and Peril Terminology for Operational Purposes; Centre for Research on the Epidemiology of Disasters: Brussels, Belgium; MunichRe: Munich, Germany.
  10. Asian Disaster Reduction Centre. Disaster Information. Available online: https://www.adrc.asia/latest/ (accessed on 28 May 2021).
  11. Tschoegl, L.; Below, R.; Guha-Sapir, D. An analytical review of selected data sets on natural disasters and impacts. In Proceedings of the UNDP/CRED Workshop on Improving Compilation of Reliable Data on Disaster Occurrence and Impact, Bangkok, Thailand, 2–4 April 2006. [Google Scholar]
  12. Dio, R.V.; Miranda, A.M.D.; Dagñalan, J.R.B.; Almorfe, S.T. Farming profile and damages caused by super typhoon “Rolly” in selected coastal areas in Sorsogon City, Philippines. Sorsogon Multidiscip. Res. J. 2023, 1, 38–46. [Google Scholar]
  13. Nguyen, K.-A.; Liou, Y.-A.; Terry, J.P. Vulnerability of Vietnam to typhoons: A spatial assessment based on hazards, exposure and adaptive capacity. Sci. Total Environ. 2019, 682, 31–46. [Google Scholar] [CrossRef]
  14. GRSP. Rice Almanac, 4th ed.; International Rice Research Institute: Los Baños, Philippines, 2013. [Google Scholar]
  15. Blanc, E.; Strobl, E. Assessing the impact of typhoons on rice production in the Philippines. J. Appl. Meteorol. Climatol. 2016, 55, 993–1007. [Google Scholar] [CrossRef]
  16. ReliefWeb. Typhoon Damaged 40,000 ha of Vietnam Rice, Official Says. Available online: https://reliefweb.int/report/viet-nam/typhoon-damaged-40000-hectares-vietnam-rice-official-says (accessed on 1 November 2023).
  17. Tuoi Tre News. Farmers Rescue Rice Paddies Following Storm in Vietnam’s Mekong Delta. Available online: https://tuoitrenews.vn/news/business/20181128/farmers-rescue-rice-paddies-following-storm-in-vietnams-mekong-delta/47918.html (accessed on 3 November 2023).
  18. Peñaflor, B.L.; Almario, S.G.S.; Vinarao, J.C. Extent of Typhoon Ulysses flooding and flood risk management interventions of heavily affected households in Isabela Province, Philippines. Am. J. Agric. Sci. Eng. Technol. 2022, 6, 10–21. [Google Scholar] [CrossRef]
  19. Wirtz, A.; Kron, W.; Löw, P.; Steuer, M. The need for data: Natural disasters and the challenges of database management. Nat. Hazards 2014, 70, 135–157. [Google Scholar] [CrossRef]
  20. Digital Typhoon. Digital Typhoon: Typhoon Images and Information. Available online: http://agora.ex.nii.ac.jp/digital-typhoon/index.html.en (accessed on 29 May 2021).
  21. Hattori, M.; Tsuboki, K.; Mori, S. Contribution of tropical cyclones to the seasonal change patterns of precipitation in the Western North Pacific: Estimation based on JRA-25/JCDAS. SOLA 2010, 6, 101–104. [Google Scholar] [CrossRef]
  22. Takagi, H. Statistics on typhoon landfalls in Vietnam: Can recent increases in economic damage be attributed to storm trends? Urban Clim. 2019, 30, 100506. [Google Scholar] [CrossRef]
  23. Taylor, H.T.; Ward, B.; Willis, M.; Zaleski, W. The Saffir-Simpson Hurricane Wind Scale; Atmospheric Administration: Washington, DC, USA, 2010. [Google Scholar]
  24. Bell, G.D.; Halpert, M.S.; Schnell, R.C.; Higgins, R.W.; Lawrimore, J.; Kousky, V.E.; Tinker, R.; Thiaw, W.; Chelliah, M.; Artusa, A. Climate assessment for 1999. Bull. Am. Meteorol. Soc. 2000, 81, S1–S50. [Google Scholar] [CrossRef]
  25. Camp, J.; Roberts, M.; MacLachlan, C.; Wallace, E.; Hermanson, L.; Brookshaw, A.; Arribas, A.; Scaife, A.A. Seasonal forecasting of tropical storms using the Met Office GloSea5 seasonal forecast system. Q. J. R. Meteorol. Soc. 2015, 141, 2206–2219. [Google Scholar] [CrossRef]
  26. Ebreo, B.M.M. ‘Rosita’ Leaves over P114M Damage to NV Agri Sector. Available online: https://pia.gov.ph/news/articles/1014730 (accessed on 31 May 2020).
  27. UNTV News and Rescue. DA Assures Enough Rice Supply Despite Damages in Agriculture Due to TY Rosita. Available online: https://sg.news.yahoo.com/da-assures-enough-rice-supply-081039091.html (accessed on 31 May 2020).
  28. Kato, Y.; Collard, B.C.Y.; Septiningsih, E.M.; Ismail, A.M. Physiological Analyses of Traits Associated with Tolerance of Long-term Partial Submergence in Rice. AoB PLANTS 2014, 6, plu058. [Google Scholar] [CrossRef]
  29. Bosma, C.D.; Wright, D.B.; Nguyen, P.; Kossin, J.P.; Herndon, D.C.; Shepherd, J.M. An intuitive metric to quantify and communicate tropical cyclone rainfall hazard. Bull. Am. Meteorol. Soc. 2020, 101, E206–E220. [Google Scholar] [CrossRef]
  30. Islam, M.R.; Lee, C.-Y.; Mandli, K.T.; Takagi, H. A new tropical cyclone surge index incorporating the effects of coastal geometry, bathymetry and storm information. Sci. Rep. 2021, 11, 16747. [Google Scholar] [CrossRef]
  31. ReliefWeb. Typhoon Damrey Hits Vietnam, Kills 16 in China. Available online: https://reliefweb.int/report/viet-nam/typhoon-damrey-hits-vietnam-kills-16-china (accessed on 2 June 2020).
  32. ReliefWeb. Viet Nam Cyclone Cecil May 1989 UNDRO Situation Reports 1–3. Available online: https://reliefweb.int/report/viet-nam/viet-nam-cyclone-cecil-may-1989-undro-situation-reports-1-3 (accessed on 2 June 2020).
  33. Ayeb-Karlsson, S.; Kniveton, D.; Cannon, T.; van der Geest, K.; Ahmed, I.; Derrington, E.M.; Florano, E.; Opondo, D.O. I will not go, I cannot go: Cultural and Social Limitations of Disaster Preparedness in Asia, Africa, and Oceania. Disasters 2019, 43, 752–770. [Google Scholar] [CrossRef] [PubMed]
  34. NDRRMC. Final Report: Effects of Typhoon Yolanda/Haiyan. Available online: http://www.ndrrmc.gov.ph/attachments/article/1329/FINAL_REPORT_re_Effects_of_Typhoon_YOLANDA_HAIYAN_06-09NOV2013.pdf (accessed on 31 May 2020).
  35. Kron, W.; Steuer, M.; Löw, P.; Wirtz, A. How to deal properly with a natural catastrophe database—Analysis of flood losses. Nat. Hazards Earth Syst. Sci. 2012, 12, 535–550. [Google Scholar] [CrossRef]
  36. Hughey, E.; Bell, H.; Chatman, M. Who needs what? A case study of post-disaster damage and needs assessment (DANA) in Vietnam. Risk Hazards Crisis Public Policy 2011, 2, 1–24. [Google Scholar] [CrossRef]
  37. Gall, M.; Borden, K.A.; Cutter, S.L. When do losses count? Six fallacies of natural hazards loss data. Bull. Am. Meteorol. Soc. 2009, 90, 799–810. [Google Scholar] [CrossRef]
  38. Guha-Sapir, D.; Below, R. The Quality and Accuracy of Disaster Data: A Comparative Analyse of Three Global Data Sets; WHO Centre for Research on the Epidemiology of Diasasters, University of Louvain School of Medicine: Brussels, Belgium, 2002. [Google Scholar]
  39. Conforti, P.; Markova, M.; Tochkov, D. FAO’s methodology for damage and loss assessment in agriculture. In FAO Statistics Working Paper 19-17; FAO: Rome, Italy, 2020. [Google Scholar]
  40. Amin, S.; Cox, M.; Goldstein, M. Using Data against Disasters: Overview and Synthesis of Lessons Learned; World Bank: Washington, DC, USA, 2008; pp. 1–22. [Google Scholar]
  41. Soto, A. Deriving information on disasters caused by natural hazards from limited data: A Guatemalan case study. Nat. Hazards 2015, 75, 71–94. [Google Scholar] [CrossRef]
  42. European Commission. Guidance for recording and sharing disaster damage and loss data. In Towards the Development of Operational Indicators to Translate the Sendai Framework in Action; Publications Office of the European Union: Luxembourg, 2015. [Google Scholar]
Figure 1. (a) Number of tropical cyclones that came within 500 km of Vietnam from 1970 to 2018. Out of this, the number of tropical cyclones that caused rice damage was reported. (b) Number of tropical cyclones that came within 500 km of the Philippines from 1970 to 2018. Similarly, the number of tropical cyclones that damaged rice was shown. Data for rice damage were only available after 1979 for both countries. For the Philippines, information was generally sparse before 2006. For each landfall category, the number of typhoons with and without information on rice damage was shown for (c) Vietnam and (d) the Philippines.
Geohazards 05 00002 g001
Figure 2. Frequency of cyclone-induced rice damage in Vietnam from 1970 to 2018. Rice damage was often reported in Nghe An (17 times), Khanh Hoa, Phu Yen, Quang Nam, Quang Tri, and Thanh Hoa (all 13 times). At a regional level, Nghe An, Quang Tri, and Quang Tri are in the North Central Coast, while Khanh Hoa, Phu Yen, and Quang Nam are in the South-Central Coast.
Geohazards 05 00002 g002
Figure 3. Frequency of cyclone-induced rice damage in the Philippines from 1970 to 2018. Rice damage was often reported in Cagayan, Tarlac (both 16 times), and Nueva Ecija (15 times). Albay, Aurora, Bulacan, Isabela, Pangasinan, Zambales, Camarines Sur, Ifugao, and Pamapanga were affected 13 to 14 times. Tarlac, Nueva Ecija, Aurora, Bulacan, Zambales, and Pampanga are in Central Luzon; Cagayan and Isabela are in the Cagayan Valley of Northern Luzon; Albay and Camarines Sur are in the Bicol Region of Southern Luzon; Pangasinan belong to Ilocos Region; Ifugao is in Cordillera Administrative Region.
Geohazards 05 00002 g003
Figure 4. (a) Landfall intensity of cyclone and the area of rice damaged in Vietnam and the Philippines. (b) Volume of rice production lost in Vietnam and the Philippines based on landfall intensity of the cyclone. (c) Value of rice crop lost in the Philippines against landfall intensity. According to the Saffir–Simpson scale, landfall wind speeds were classified into five categories: Tropical Cyclone (TS, 34–63 kts), Cat 1 (64–82 kts), Cat 2 (83–95 kts), Cat 3 (96–112 kts), and Cat 4 (113–136 kts). No landfall (LF) referred to cyclones that came within 500 km from the coast of each country, but no landfall was recorded.
Geohazards 05 00002 g004
Figure 5. Relationship between landfall wind speed and the area of rice damaged in (a) Vietnam and (b) the Philippines. (c) Relationship between landfall wind speed and the volume of rice production that was lost in the Philippines. (d) Relationship between landfall wind speed and the value of rice crop lost in the Philippines.
Geohazards 05 00002 g005
Figure 6. Relationship between Accumulated Cyclone Energy (ACE) and the area of rice damaged in (a) Vietnam and (b) the Philippines. (c) Relationship between ACE and the volume of rice production that was lost in the Philippines. (d) Relationship between ACE and the value of rice crop lost in the Philippines. The ACE index of each storm is the sum of the square of the maximum sustained 1 min surface wind speed every 6 h whilst the storm is at least tropical storm strength (≥39 mph).
Geohazards 05 00002 g006
Table 1. Total number of cyclone events that made landfall or passed within 500 km of Vietnam and the Philippines from 1970 to 2018. Numbers in parentheses represent the number of cyclones with reports of rice damage associated with them.
PhilippinesVietnam
Total cyclone events investigated (with rice damage)526 (60)303 (68)
Total no. of cyclones from 1970 to 1979 (with rice damage)115 (0)73 (0)
Total no. of cyclones from 1980 to 1989 (with rice damage)111 (3)68 (17)
Total no. of cyclones from 1990 to 1999 (with rice damage)105 (6)61 (11)
Total no. of cyclones from 2000 to 2009 (with rice damage)100 (9)48 (13)
Total no. of cyclones from 2010 to 2018 (with rice damage)95 (42)53 (27)
Table 2. Average rice area, rice production, and rice value lost over the years from 1970 to 2018 according to landfall intensity. Cyclones that came within 500 km of each country but did not make landfall were considered cyclones with “no landfall”. Cyclone intensity was classified according to the Saffir–Simpson Hurricane Wind Scale. Numbers in parentheses refer to the number of data points.
PhilippinesVietnam
Areal losses (ha)
No landfall10,576 (5)18,774 (6)
Tropical storm64,839 (7)52,687 (46)
Category 191,999 (7)18,758 (14)
Category 213,032 (3)NA
Category 3185,953 (3)NA
Category 4425,134 (1)NA
Overall83,571 (26)42,407 (66)
Production lost (tonnes)
No landfall6402 (1)NA
Tropical storm178,638 (6)718,600 (3)
Category 153,203 (4)800 (1)
Category 2346,080 (4)NA
Category 3269,219 (4)NA
Category 452,303 (1)NA
Overall190,227 (20)539,150 (4)
Value lost (US$)
No landfall8,689,695 (6)NA
Tropical storm21,629,199 (14)NA
Category 138,852,791 (13)NA
Category 275,951,909 (6)NA
Category 360,474,973 (10)NA
Category 4198,221,629 (1)NA
Overall42,374,321 (50)NA
Disclaimer/Publisher’s Note: The statements, opinions and data contained in all publications are solely those of the individual author(s) and contributor(s) and not of MDPI and/or the editor(s). MDPI and/or the editor(s) disclaim responsibility for any injury to people or property resulting from any ideas, methods, instructions or products referred to in the content.

