Next Issue
Volume 8, March
Previous Issue
Volume 8, January


Climate, Volume 8, Issue 2 (February 2020) – 19 articles

Cover Story (view full-size image): 
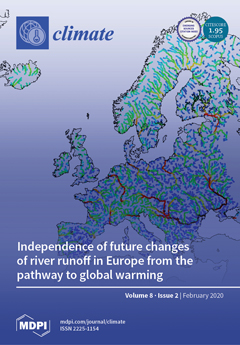
The outcome of the Paris agreement prompted the investigation of the impact of climate change at specific levels of global warming. Yet, the link between the timing of global warming, the atmospheric concentration of greenhouse gases, and the underlying earth-system dynamics are not yet entirely clear. To understand how the emission pathway affects changes of river discharge, a proxy for water availability, and flood and drought hazard, we examined its projections in different representative concentration pathways, in Europe, at 1.5 and 2.0 °C, finding differences between emission scenarios that are generally not statistically significant. These results suggest that in studies of climate change at global warming levels the projections of the two pathways can be merged into a single ensemble without major loss of information. View this paper.
  • Issues are regarded as officially published after their release is announced to the table of contents alert mailing list.
  • You may sign up for e-mail alerts to receive table of contents of newly released issues.
  • PDF is the official format for papers published in both, html and pdf forms. To view the papers in pdf format, click on the "PDF Full-text" link, and use the free Adobe Reader to open them.
Order results
Result details
Section
Select all
Export citation of selected articles as:
27 pages, 92104 KiB  
Article
Environmental Heat Stress on Indoor Environments in Shallow, Deep and Covered Atrium Plan Form Office Buildings in Tropics
by Upendra Rajapaksha
Climate 2020, 8(2), 36; https://doi.org/10.3390/cli8020036 - 22 Feb 2020
Cited by 4 | Viewed by 5204
Abstract
Environmental heat stress on buildings through façades contributes to indoor overheating and thus increases demand for energy consumption. The study analyzed the problem, heat gain risk, of modern air-conditioned multi-level office buildings in tropics, for example Colombo. Plan form, orientation, sectional form and [...] Read more.
Environmental heat stress on buildings through façades contributes to indoor overheating and thus increases demand for energy consumption. The study analyzed the problem, heat gain risk, of modern air-conditioned multi-level office buildings in tropics, for example Colombo. Plan form, orientation, sectional form and envelope were identified and theorized to understand design interventions to reduce the risk of getting heat stress on indoor environments. On-site thermal performance investigations in multi zones of identified three typical built forms, namely; shallow, deep and covered atrium plan forms, quantified the heat stress. Reaching the daytime indoor and surface temperature in peripheral zones of multi-story office buildings during air conditioning “off-mode” up to 38 °C–42 °C was seen as a critical heat stress situation to be addressed through building design. Shading or insulation on façades to control environmental heat gain and manipulation of building section for night ventilation to remove internal heat developed during the daytime are discussed. However, the significance of the plan form depth was found to be a main contributor in dealing with heat transfer to indoor space. Deep plan form was found to be more effective in controlling environmental heat transfer to indoor space across the plan depth. Full article
Show Figures

Figure 1

17 pages, 299 KiB  
Perspective
Trans-Disciplinary Responses to Climate Change: Lessons from Rice-Based Systems in Asia
by Jon Hellin, Jean Balié, Eleanor Fisher, Ajay Kohli, Melanie Connor, Sudhir Yadav, Virender Kumar, Timothy J. Krupnik, Bjoern Ole Sander, Joshua Cobb, Katherine Nelson, Tri Setiyono, Ranjitha Puskur, Pauline Chivenge and Martin Gummert
Climate 2020, 8(2), 35; https://doi.org/10.3390/cli8020035 - 20 Feb 2020
Cited by 16 | Viewed by 5229
Abstract
Climate change will continue to have a largely detrimental impact on the agricultural sector worldwide because of predicted rising temperatures, variable rainfall, and an increase in extreme weather events. Reduced crop yields will lead to higher food prices and increased hardship for low [...] Read more.
Climate change will continue to have a largely detrimental impact on the agricultural sector worldwide because of predicted rising temperatures, variable rainfall, and an increase in extreme weather events. Reduced crop yields will lead to higher food prices and increased hardship for low income populations, especially in urban areas. Action on climate change is one of the Sustainable Development Goals (SDG 13) and is linked to the Paris Climate Agreement. The research challenge posed by climate change is so complex that a trans-disciplinary response is required, one that brings together researchers, practitioners, and policy-makers in networks where the lines between “research” and “development” become deliberately blurred. Fostering such networks will require researchers, throughout the world, not only to work across disciplines but also to pursue new South–North and South–South partnerships incorporating policy-makers and practitioners. We use our diverse research experiences to describe the emergence of such networks, such as the Direct Seeded Rice Consortium (DSRC) in South and Southeast Asia, and to identify lessons on how to facilitate and strengthen the development of trans-disciplinary responses to climate change. Full article
18 pages, 4179 KiB  
Article
On Tanzania’s Precipitation Climatology, Variability, and Future Projection
by Krishna Borhara, Binod Pokharel, Brennan Bean, Liping Deng and S.-Y. Simon Wang
Climate 2020, 8(2), 34; https://doi.org/10.3390/cli8020034 - 20 Feb 2020
Cited by 24 | Viewed by 9451
Abstract
We investigate historical and projected precipitation in Tanzania using observational and climate model data. Precipitation in Tanzania is highly variable in both space and time due to topographical variations, coastal influences, and the presence of lakes. Annual and seasonal precipitation trend analyses from [...] Read more.
We investigate historical and projected precipitation in Tanzania using observational and climate model data. Precipitation in Tanzania is highly variable in both space and time due to topographical variations, coastal influences, and the presence of lakes. Annual and seasonal precipitation trend analyses from 1961 to 2016 show maximum rainfall decline in Tanzania during the long rainy season in the fall (March–May), and an increasing precipitation trend in northwestern Tanzania during the short rainy season in the spring (September–November). Empirical orthogonal function (EOF) analysis applied to Tanzania’s precipitation patterns shows a stronger correlation with warmer temperatures in the western Indian Ocean than with the eastern-central Pacific Ocean. Years with decreasing precipitation in Tanzania appear to correspond with increasing sea surface temperatures (SST) in the Indian Ocean, suggesting that the Indian Ocean Dipole (IOD) may have a greater effect on rainfall variability in Tanzania than the El Niño-Southern Oscillation (ENSO) does. Overall, the climate model ensemble projects increasing precipitation trend in Tanzania that is opposite with the historical decrease in precipitation. This observed drying trend also contradicts a slightly increasing precipitation trend from climate models for the same historical time period, reflecting challenges faced by modern climate models in representing Tanzania’s precipitation. Full article
Show Figures

Figure 1

19 pages, 7436 KiB  
Article
Preservation of Distemper Painting: Indoor Monitoring Tools for Risk Assessment and Decision Making in Kvernes Stave Church
by Tone Marie Olstad, Anne Apalnes Ørnhøi, Nina Kjølsen Jernæs, Lavinia de Ferri, Ashley Freeman and Chiara Bertolin
Climate 2020, 8(2), 33; https://doi.org/10.3390/cli8020033 - 14 Feb 2020
Cited by 8 | Viewed by 4168
Abstract
During the Medieval period, over 1000 stave churches were thought to have been constructed in Norway. However, currently, only 28 of these churches remain and only 19 still have distemper wall paintings. The cultural significance of these structures, and more specifically their elaborate [...] Read more.
During the Medieval period, over 1000 stave churches were thought to have been constructed in Norway. However, currently, only 28 of these churches remain and only 19 still have distemper wall paintings. The cultural significance of these structures, and more specifically their elaborate distemper wall paintings, has changed over time, as have the means and methods for preserving these monuments. Deeper knowledge of the current state of these structures, along with environmental monitoring and modeling will open the way to a better understanding of preservation. This paper presents a case study for unheated Norwegian wooden churches based on data collected from Kvernes stave church. There are three aims for this paper: (i) to describe the typical indoor conditions similar to the historic climate of stave churches; (ii) determine the common characteristics of distemper paint found within stave churches; (iii) and develop a risk assessment tool to evaluate the climate-induced risk factors in stave churches. The outcome of this work will contribute to research performed within the Sustainable Management of Heritage Buildings in a Long-term Perspective (SyMBoL) project which aims to develop a better understanding of climate induced risks for stave churches, and ultimately to better manage environmental risk. Full article
(This article belongs to the Special Issue World Heritage and Climate Change: Impacts and Adaptation)
Show Figures

Graphical abstract

1 pages, 185 KiB  
Correction
Correction: Péres, W. E., et al. The Association between Air Temperature and Mortality in Two Brazilian Health Regions. Climate, 2020, 8, 1
by Wolmir Ercides Péres, Andreia F. S. Ribeiro, Ana Russo and Baltazar Nunes
Climate 2020, 8(2), 32; https://doi.org/10.3390/cli8020032 - 12 Feb 2020
Cited by 1 | Viewed by 1745
Abstract
The authors wish to make the following correction to this paper [...] Full article
16 pages, 2496 KiB  
Article
Creating a Consistent Multi-Decadal Oceanic TRMM-GPM Brightness Temperature Record with Estimated Calibration Uncertainty
by Ruiyao Chen and W. Linwood Jones
Climate 2020, 8(2), 31; https://doi.org/10.3390/cli8020031 - 10 Feb 2020
Cited by 2 | Viewed by 2502
Abstract
The National Aeronautics and Space Administration’s (NASA) Precipitation Measurement Missions (PMMs) include two earth satellite missions, namely, the Tropical Rainfall Measuring Mission (TRMM, 1997–2015) and the Global Precipitation Measurement (GPM, 2014-present). To generate a consistent multi-decadal brightness temperature (Tb) record that spans the [...] Read more.
The National Aeronautics and Space Administration’s (NASA) Precipitation Measurement Missions (PMMs) include two earth satellite missions, namely, the Tropical Rainfall Measuring Mission (TRMM, 1997–2015) and the Global Precipitation Measurement (GPM, 2014-present). To generate a consistent multi-decadal brightness temperature (Tb) record that spans the TRMM and GPM eras, it is highly desirable to perform a comprehensive intercalibration of the TRMM Microwave Imager (TMI) and the GPM Microwave Imager (GMI) Tb measurements. Unfortunately, GMI and TMI share a limited common operational period of only 13 months. Fortunately, the WindSat polarimetric radiometer (2003-present) has been shown to be well calibrated and radiometrically stable relative to TMI for a period of over 5 years. Therefore, this paper describes the use of overlapping WindSat Tb measurements as the calibration bridge to achieve a seamless transfer joining the TMI and GMI Tb time series. Also, the development of the Tb measurement uncertainty estimation model is presented, which incorporates all relevant sources of uncertainty. Afterwards, this model was applied to three intercalibration processes: TMI to GMI, TMI to WindSat, and WindSat to GMI, and results are presented that quantify the corresponding Tb channel measurements biases and associated uncertainties associated with the merged TMI-GMI Tb record. This is an important accomplishment because this study can enable improved future Earth Science and global climate change investigations by making a long-term Tb record with estimated uncertainty available. Full article
Show Figures

Figure 1

22 pages, 8803 KiB  
Article
Water Balance and Soil Moisture Deficit of Different Vegetation Units under Semiarid Conditions in the Andes of Southern Ecuador
by Andreas Fries, Karen Silva, Franz Pucha-Cofrep, Fernando Oñate-Valdivieso and Pablo Ochoa-Cueva
Climate 2020, 8(2), 30; https://doi.org/10.3390/cli8020030 - 08 Feb 2020
Cited by 25 | Viewed by 5178
Abstract
Water availability in semiarid regions is endangered, which is not only due to changing climate conditions, but also to anthropogenic land use changes. The present study analyzed the annual and monthly water balance (WBc) and the soil moisture deficit (Ds [...] Read more.
Water availability in semiarid regions is endangered, which is not only due to changing climate conditions, but also to anthropogenic land use changes. The present study analyzed the annual and monthly water balance (WBc) and the soil moisture deficit (Ds) for different vegetation units under semiarid conditions in the Andes of southern Ecuador, based on limited meteorological station data and field measurements (soil samples). To calculate crop evapotranspiration (ETc) the Blaney–Criddle method was applied, and the specific crop factor (Kc) included, because only temperature (T) and precipitation (P) data were available. By means of the soil samples the water retention capacity (RC) of the different soil types present in the study area were estimated, which, in combination with WBc, provided reliable results respective to water surpluses or deficits for the different vegetation units. The results indicated highest Ds for cultivated areas, particularly for corn and sugarcane plantations, where annual deficits up to −1377.5 mm ha−1 and monthly deficits up to −181.1 mm ha−1 were calculated. Natural vegetation cover (scrubland, forest and paramo), especially at higher elevations, did not show any deficit throughout the year (annual surpluses up to 1279.6 mm ha−1; monthly surpluses up to 280.1 mm ha−1). Hence, it could be concluded that the prevailing climate conditions in semiarid regions cannot provide the necessary water for agricultural practices, for which reason irrigation is required. The necessary water can be supplied by areas coved by natural vegetation, but these areas are endangered due to population growth and the associated land use changes. Full article
(This article belongs to the Special Issue Landscape and Climate Change)
Show Figures

Graphical abstract

21 pages, 2643 KiB  
Article
The Role of Individual and Small-Area Social and Environmental Factors on Heat Vulnerability to Mortality Within and Outside of the Home in Boston, MA
by Augusta A. Williams, Joseph G. Allen, Paul J. Catalano and John D. Spengler
Climate 2020, 8(2), 29; https://doi.org/10.3390/cli8020029 - 07 Feb 2020
Cited by 12 | Viewed by 3600
Abstract
Climate change is resulting in heatwaves that are more frequent, severe, and longer lasting, which is projected to double-to-triple the heat-related mortality in Boston, MA if adequate climate change mitigation and adaptation strategies are not implemented. A case-only analysis was used to examine [...] Read more.
Climate change is resulting in heatwaves that are more frequent, severe, and longer lasting, which is projected to double-to-triple the heat-related mortality in Boston, MA if adequate climate change mitigation and adaptation strategies are not implemented. A case-only analysis was used to examine subject and small-area neighborhood characteristics that modified the association between hot days and mortality. Deaths of Boston, Massachusetts residents that occurred from 2000–2015 were analyzed in relation to the daily temperature and heat index during the warm season as part of the case-only analysis. The modification by small-area (census tract, CT) social, and environmental (natural and built) factors was assessed. At-home mortality on hot days was driven by both social and environmental factors, differentially across the City of Boston census tracts, with a greater proportion of low-to-no income individuals or those with limited English proficiency being more highly represented among those who died during the study period; but small-area built environment features, like street trees and enhanced energy efficiency, were able to reduce the relative odds of death within and outside the home. At temperatures below current local thresholds used for heat warnings and advisories, there was increased relative odds of death from substance abuse and assault-related altercations. Geographic weighted regression analyses were used to examine these relationships spatially within a subset of at-home deaths with high-resolution temperature and humidity data. This revealed spatially heterogeneous associations between at-home mortality and social and environmental vulnerability factors. Full article
Show Figures

Figure 1

31 pages, 9843 KiB  
Article
Future Scenarios of Soil Erosion in the Alps under Climate Change and Land Cover Transformations Simulated with Automatic Machine Learning
by Marco Gianinetto, Martina Aiello, Renata Vezzoli, Francesco Niccolò Polinelli, Maria Cristina Rulli, Davide Danilo Chiarelli, Daniele Bocchiola, Giovanni Ravazzani and Andrea Soncini
Climate 2020, 8(2), 28; https://doi.org/10.3390/cli8020028 - 07 Feb 2020
Cited by 20 | Viewed by 5856
Abstract
Erosion is one of the major threats listed in the Soil Thematic Strategy of the European Commission and the Alps are one of the most vulnerable ecosystems, with one of the highest erosion rates of the whole European Union. This is the first [...] Read more.
Erosion is one of the major threats listed in the Soil Thematic Strategy of the European Commission and the Alps are one of the most vulnerable ecosystems, with one of the highest erosion rates of the whole European Union. This is the first study investigating the future scenarios of soil erosion in Val Camonica and Lake Iseo, which is one of the largest valleys of the central Italian Alps, considering both climate change and land cover transformations. Simulations were done with the Dynamic Revised Universal Soil Loss Equation (D-RUSLE) model, which is able to account also for snow cover and land cover dynamics simulated with automatic machine learning. Results confirm that land cover projections, usually ignored in these studies, might have a significant impact on the estimates of future soil erosion. Our scenario analysis for 2100 shows that if the mean annual precipitation does not change significantly and temperature increases no more than 1.5–2.0 °C, then the erosion rate will decrease by 67% for about half of the study area. At the other extreme, if the mean annual precipitation increases by more than 8% and the temperature increases by more than 4.0 °C, then about three-quarters of the study area increases the erosion rate by 92%. What clearly emerges from the study is that regions with higher erosion anomalies (positive and negative) are expected to expand in the future, and their patterns will be modulated by future land transformations. Full article
Show Figures

Figure 1

12 pages, 3023 KiB  
Article
Perceptions of Climate Change and Drivers of Insect Pest Outbreaks in Vegetable Crops in Limpopo Province of South Africa
by Mutondwa Masindi Phophi, Paramu Mafongoya and Shenelle Lottering
Climate 2020, 8(2), 27; https://doi.org/10.3390/cli8020027 - 06 Feb 2020
Cited by 21 | Viewed by 4534
Abstract
Vegetable production is a source of income for smallholder farmers in Limpopo Province, South Africa. Vegetable production is constrained by the negative impacts of climate change and pests. This study assessed farmers’ awareness of climate change, farmers’ knowledge of insect pests and factors [...] Read more.
Vegetable production is a source of income for smallholder farmers in Limpopo Province, South Africa. Vegetable production is constrained by the negative impacts of climate change and pests. This study assessed farmers’ awareness of climate change, farmers’ knowledge of insect pests and factors that influence insect pests’ prevalence. The data were collected using quantitative and qualitative methods. The data were subjected to descriptive and bivariate analysis. About 84.5% of smallholder farmers were aware of climate change. Late rainfall (24.4%), long dry spells (15%) and increased drought frequency (19.4%) were highlighted as dominant indicators of climate change by farmers. Aphids (22.2%), Bagrada hilaris (12.5%) and Spodoptera frugiperda (10.2%) were the most prevalent insect pests within the Vhembe District. Warmer winters, dry spells and high temperatures were perceived by farmers to influence insect pests’ prevalence within the district. It can be concluded that farmers are aware of climate change and climatic factors influencing pest prevalence within the district. Pest risk maps are needed to improve the preparedness of the government and farmers in controlling insect pests under changing climates. Full article
Show Figures

Figure 1

14 pages, 1466 KiB  
Article
Climate Change and Sustaining Heritage Resources: A Framework for Boosting Cultural and Natural Heritage Conservation in Central Italy
by Ahmadreza Shirvani Dastgerdi, Massimo Sargolini, Shorna Broussard Allred, Allison Chatrchyan and Giuseppe De Luca
Climate 2020, 8(2), 26; https://doi.org/10.3390/cli8020026 - 05 Feb 2020
Cited by 37 | Viewed by 9270
Abstract
Climate change has dramatically affected the rainfall patterns and water systems in Central Italy. The vulnerability of this area to climate change and natural hazards necessitates that appropriate adaptation policies be put in place to protect heritage sites. This study aims to develop [...] Read more.
Climate change has dramatically affected the rainfall patterns and water systems in Central Italy. The vulnerability of this area to climate change and natural hazards necessitates that appropriate adaptation policies be put in place to protect heritage sites. This study aims to develop a cultural and natural heritage conservation framework for Central Italy that enhances the capacity of climate change adaptation for heritage resources. For this purpose, a comparison was made between the UNESCO (United National Educational, Scientific and Cultural Organization) Convention of 1972 and the European Landscape Convention of the Council of Europe to achieve a coherent vision for the protection of heritage resources in Europe. After describing the impacts of climate change on heritage resources in Central Italy, we analyze and suggest improvements to the conservation framework for wisely protecting heritage resources in a changing climate. The findings reveal that conservation sectors require assessments of the value of heritage resources at the territorial scale to effectively define conservation priorities, assess the vulnerabilities, and more precisely direct funding. In this respect, the integration of the European Landscape Convention with territorial planning may boost the unity of a conservation framework in terms of climate change while providing new opportunities for conservation authorities to develop adaptation policies. Full article
(This article belongs to the Special Issue World Heritage and Climate Change: Impacts and Adaptation)
Show Figures

Figure 1

1 pages, 143 KiB  
Erratum
Erratum: Richard Wadsworth et al. Changes in Rainfall in Sierra Leone: 1981–2018. Climate 2019, 7, 144
by Climate Editorial Office
Climate 2020, 8(2), 25; https://doi.org/10.3390/cli8020025 - 04 Feb 2020
Viewed by 2061
Abstract
The authors would like to correct the funding part of this article [...] Full article
18 pages, 1180 KiB  
Article
Prospects for Erratic and Intensifying Madden-Julian Oscillations
by Patrick Haertel
Climate 2020, 8(2), 24; https://doi.org/10.3390/cli8020024 - 02 Feb 2020
Cited by 7 | Viewed by 2467
Abstract
The Madden–Julian Oscillation (MJO) is a planetary-scale convective disturbance that typically forms in the equatorial Indian Ocean, propagates slowly eastward, and dissipates near the date line. This study examines how the MJO changes in response to a changing radiative forcing in a fully-Lagrangian [...] Read more.
The Madden–Julian Oscillation (MJO) is a planetary-scale convective disturbance that typically forms in the equatorial Indian Ocean, propagates slowly eastward, and dissipates near the date line. This study examines how the MJO changes in response to a changing radiative forcing in a fully-Lagrangian coupled model (LCM) that is shown to simulate robust and realistic MJOs. After the LCM is spun up for 160 years to reproduce the late 20th century climate, non-water-vapor longwave optical depth is increased over 70 years to model the effects of increasing concentrations of greenhouse gases. The model is then run for another 30 years without additional changes to the radiative forcing. After the radiative forcing is modified, the MJO generally becomes more frequent and intense, but it is also more variable from one year to the next. Not only do composite MJO rainfall perturbations increase, but wind, temperature, and moisture perturbations also become stronger. The aspect of the MJO’s structure that changes the most is the largely dry equatorial Kelvin wave circulation that circumnavigates the globe between moist phases of the MJO. Potential impacts of these changes included alterations to the way in which the MJO modulates tropical cyclones, monsoon disturbances, and El Niño. Full article
Show Figures

Figure 1

22 pages, 6674 KiB  
Article
Change of the Rainfall Seasonality Over Central Peruvian Andes: Onset, End, Duration and Its Relationship With Large-Scale Atmospheric Circulation
by Lucy Giráldez, Yamina Silva, Ricardo Zubieta and Juan Sulca
Climate 2020, 8(2), 23; https://doi.org/10.3390/cli8020023 - 28 Jan 2020
Cited by 19 | Viewed by 6354
Abstract
Changes of the onset dates, end dates, and duration of the rainy season over central Peruvian Andes (Mantaro river basin, MRB) could severely affect water resources management and the main economic activities (e.g., rainfed agriculture, raising cattle, among others). Nonetheless, these changes have [...] Read more.
Changes of the onset dates, end dates, and duration of the rainy season over central Peruvian Andes (Mantaro river basin, MRB) could severely affect water resources management and the main economic activities (e.g., rainfed agriculture, raising cattle, among others). Nonetheless, these changes have not been documented for the Tropical Andes. To asses that, we used daily datasets of observed rainfall during the 1965–2013 period. For this period, the average onset (end) date of the rainy season over the MRB occurs in the pentad 17 (19–23 September) [pentad 57 (7–11 April)]. The duration of the rainy season mainly is modulated by the onset dates due to it has higher variability than end dates. There is a reduction of 3 days/decade in the duration of wet season over the MRB for the last four decades due to the delay of the onset days. Furthermore, El Niño favors late-onset and early end of the rainy season, while La Niña favors early onset and late end of the rainy season in the MRB. Onset dates are related to the propagation of the convective region of the South American Monsoon System (SAMS), from the Caribbean region toward the central Amazon basin. Early (late)-onset days are associated with a southward (northward) shift of the South Atlantic Convergence Zone (SACZ) and weak (strong) convection over equatorial Atlantic that induces the southernmost propagation (eastward shift) of the SAMS. Full article
(This article belongs to the Special Issue From Local to Global Precipitation Dynamics and Climate Interaction)
Show Figures

Figure 1

15 pages, 4644 KiB  
Article
Independence of Future Changes of River Runoff in Europe from the Pathway to Global Warming
by Lorenzo Mentaschi, Lorenzo Alfieri, Francesco Dottori, Carmelo Cammalleri, Berny Bisselink, Ad De Roo and Luc Feyen
Climate 2020, 8(2), 22; https://doi.org/10.3390/cli8020022 - 27 Jan 2020
Cited by 13 | Viewed by 4450
Abstract
The outcomes of the 2015 Paris Agreement triggered a number of climate impact assessments, such as for floods and droughts, to focus on future time frames corresponding to the years of reaching specific levels of global warming. Yet, the links between the timing [...] Read more.
The outcomes of the 2015 Paris Agreement triggered a number of climate impact assessments, such as for floods and droughts, to focus on future time frames corresponding to the years of reaching specific levels of global warming. Yet, the links between the timing of the warming levels and the corresponding greenhouse gas concentration pathways to reach them remain poorly understood. To address this gap, we compared projected changes of annual mean, extreme high, and extreme low river discharges in Europe at 1.5 °C and 2 °C under Representative Concentration Pathways RCP8.5 and RCP4.5 from an ensemble of regional climate model (RCM) simulations. The statistical significance of the difference between the two scenarios for both warming levels was then evaluated. The results show that in the majority of Europe (>95% of the surface area for the annual mean discharge, >98% for high and low extremes), the changes projected in the two pathways were statistically indistinguishable. These results suggest that in studies of changes at global warming levels, the projections of the two pathways can be merged into a single ensemble without major loss of information. With regard to the uncertainty of the unified ensemble, the findings show that the projected changes of annual mean, extreme high, and extreme low river discharge were statistically significant in large portions of Europe. Full article
Show Figures

Figure 1

20 pages, 8499 KiB  
Review
Forest Contribution to Climate Change Mitigation: Management Oriented to Carbon Capture and Storage
by Leonel J.R. Nunes, Catarina I.R. Meireles, Carlos J. Pinto Gomes and Nuno M.C. Almeida Ribeiro
Climate 2020, 8(2), 21; https://doi.org/10.3390/cli8020021 - 27 Jan 2020
Cited by 78 | Viewed by 17311
Abstract
Today, climate change is assumed by many researchers and scholars as a certainty and is presented as the biggest challenge humanity has ever faced. It is commonly accepted that anthropogenic greenhouse gas emissions are the main cause that is accelerating the process. Therefore, [...] Read more.
Today, climate change is assumed by many researchers and scholars as a certainty and is presented as the biggest challenge humanity has ever faced. It is commonly accepted that anthropogenic greenhouse gas emissions are the main cause that is accelerating the process. Therefore, it is urgent to find solutions to mitigate climate change, mainly because the intense effects have already been felt, in many cases in the form of the occurrence of extremely violent weather events. Forests are undoubtedly one of the most effective and easiest ways to provide the function of carbon sinks. However, it is essential and convenient to analyze the permanence time of this carbon in forests, because this permanence time depends directly on the forest management model used. This article aims to analyze forest management models from the perspective of carbon residence time in temperate forests, dividing the models into three types, namely carbon conservation models, carbon storage models, and carbon substitution models, according to their ability to contribute to functioning as carbon sinks, thereby contributing to the mitigation of climate change. Full article
Show Figures

Figure 1

16 pages, 6729 KiB  
Article
Scale-Dependent Reliability of Projected Rainfalls over Bangladesh with the PRECIS Model
by M. Shahjahan Mondal, Sara Nowreen and Mostofa Najmus Sakib
Climate 2020, 8(2), 20; https://doi.org/10.3390/cli8020020 - 27 Jan 2020
Cited by 6 | Viewed by 3908
Abstract
The regional climate model, Providing REgional Climates for Impact Studies (PRECIS), has been widely used throughout the world to generate climate change projections for impact studies and adaptations. Its recent application in South Asia also includes the projection of rainfall extremes. In spite [...] Read more.
The regional climate model, Providing REgional Climates for Impact Studies (PRECIS), has been widely used throughout the world to generate climate change projections for impact studies and adaptations. Its recent application in South Asia also includes the projection of rainfall extremes. In spite of its wide application, a stringent validation of the model is yet to be reported. In this study, we assessed the performance of the model in simulating annual, monthly and extreme rainfalls over Bangladesh by using a number of statistical techniques, e.g., pattern (both spatial and temporal) correlation, root mean square difference (RMSD), mean absolute difference (MAD), Student’s t-test for significance, probability density functions, etc. The results indicated that the PRECIS model could capture the overall spatial pattern of mean annual and monthly rainfalls very well. However, the inter-annual variability was poorly simulated by the model. In addition, the model could not capture the rainfall extremes. A spatial aggregation of rainfall data did not improve the reliability of the model as far as variability and extremes are concerned. Therefore, further improvements of the model and/or its driving global climate model are warranted for its practical use in the generation of rainfall scenarios. Full article
Show Figures

Figure 1

19 pages, 2881 KiB  
Article
Monitoring Hydrometeorological Droughts Using a Simplified Precipitation Index
by Abdullah A. Alsumaiei
Climate 2020, 8(2), 19; https://doi.org/10.3390/cli8020019 - 23 Jan 2020
Cited by 10 | Viewed by 3354
Abstract
Efficient water management plans should rely on quantitative metrics for assessing water resource shortage scenarios. This study develops a simplified precipitation index (PI) requiring precipitation data only in order to assess hydrometeorological droughts affecting various hydrological systems. The PI index is [...] Read more.
Efficient water management plans should rely on quantitative metrics for assessing water resource shortage scenarios. This study develops a simplified precipitation index (PI) requiring precipitation data only in order to assess hydrometeorological droughts affecting various hydrological systems. The PI index is inspired by the famous Standardized Precipitation Index (SPI), and it aims to provide the same indication for drought severity and duration while overcoming the disadvantage of needing hydrological data normalization. Avoiding hydrological data normalization overcomes the non-satisfactory results of this procedure that were reported in previous studies. Analysis of groundwater drought drivers in the arid region of Kuwait is presented to test the index applicability at timescales 12 and 24 months using available historical precipitation data from 1958 to 2017. A bivariate joint probability analysis was conducted by Clayton copula to assess the occurrence of certain drought severities and durations. The results showed that PI is comparable to the original SPI and provides drought severity linearly propagating with respect to time. This index constitutes a simple means to help water managers assess and describe the impact of droughts in precipitation-controlled systems and establish appropriate water management plans. Full article
(This article belongs to the Special Issue Long-Term Climate Modeling and Hydrological Projection)
Show Figures

Figure 1

23 pages, 4675 KiB  
Article
Effects of Climate Change on Precipitation and the Maximum Daily Temperature (Tmax) at Two US Military Bases with Different Present-Day Climates
by Jovan M. Tadić and Sébastien C. Biraud
Climate 2020, 8(2), 18; https://doi.org/10.3390/cli8020018 - 22 Jan 2020
Cited by 3 | Viewed by 3395
Abstract
In this study, the effects of climate change on precipitation and the maximum daily temperature (Tmax) at two USA locations that have different climates—the Travis Airforce Base (AFB) in California [38.27° N, 121.93° W] and Fort Bragg (FBR) in North Carolina [...] Read more.
In this study, the effects of climate change on precipitation and the maximum daily temperature (Tmax) at two USA locations that have different climates—the Travis Airforce Base (AFB) in California [38.27° N, 121.93° W] and Fort Bragg (FBR) in North Carolina [35.14 N, 79.00 W]—are analyzed. The effects of climate change on central tendency, tail distributions, and both auto- and cross-covariance structures in precipitation and Tmax fields for three time periods in the 21st century centered on the years 2020, 2050, and 2100 were analyzed. It was found that, on average, Tmax under the Representative Concentration Pathway (RCP) 4.5 emission scenario is projected to increase for the years 2020, 2050, and 2100 by 1.1, 2.0, and 2.2 °C, respectively, for AFB, and 0.9, 1.2, and 1.6 °C, respectively, for FBR, while under the RCP8.5 emission scenario Tmax will increase by 1.1, 1.9, and 2.7 °C, respectively, for AFB, and 0.1, 1.5, and 2.2 °C, respectively, for FBR. The climate change signal in precipitation is weak. The results show that, under different emission scenarios, events considered to be within 1% of the most extreme events in the past will become ~13–30 times more frequent for Tmax, ~and 0.05–3 times more frequent for precipitation in both locations. Several analytical methods were deployed in a sequence, creating an easily scalable framework for similar analyses in the future. Full article
(This article belongs to the Special Issue Precipitation: Forecasting and Climate Projections)
Show Figures

Figure 1

Previous Issue
Next Issue
Back to TopTop