1. Introduction
Classical economic theory suggests that the development of industry with a comparative advantage in a region will create economies of scale and thus promote economic growth [
1]. The impact of tourism on the economy has always been deeply studied by scholars, especially in areas with few industrial structures and lagging economic development. Tourism is seen as a panacea for providing employment, increasing taxes, and attracting capital inflows to achieve economic revitalization [
2]. However, the contribution of tourism to economic growth often does not fully meet people’s expectations [
3]. In some economically underdeveloped regions in the European Union, the economic growth brought by tourism has attracted an inflow from the surrounding population and capital, and it has spawned many small and medium-sized enterprises that rely on tourism for their livelihood. This clearly hinders the process of European integration and drags down the economic growth of the surrounding, more developed regions [
4]. For countries with weak economic foundations, such as Southeast Asia and Africa, the tourism industry has played a role in boosting employment and increasing exchange, but it has also increased external dependence on regional economic development, resulting in inflation and rising prices [
5,
6]. At the same time, foreign scholars also attach great importance to the social and cultural conflicts, ecological disturbance, environmental pollution, and other issues brought about by the development of the tourism economy. They hold that the development of tourism must clearly consider all aspects of society and the environment [
7]. Guided by the policy of poverty alleviation, domestic research is more focused on the effect of tourism on economic poverty alleviation in poverty-stricken areas and counties. It is assumed that poverty-stricken areas should develop tourism on the basis of unique tourism resources and, with the help of external driving forces, embark on the road to sustainable economic and social development and achieve poverty alleviation and prosperity through the linkage of tourism [
8]. The research focus has gradually shifted from the impact of tourism on the regional economy, the promotion of population and economic development [
9], and the realization of poverty alleviation in poverty-stricken areas, to the sustainability and fairness in tourism development, the impact of tourism on culture and resources, the destruction of the environment, and the maintenance of power. Domestic research has shifted from a single economic indicator to a focus on local residents in an effort to achieve sustainable development in all aspects of the region [
10].
The development of the tourism economy has resulted in diverse social impacts. However, for economically underdeveloped areas, the main constraint on tourism economic development is the background of local tourism resources [
11]. Most of the relevant research studies stay in the listing of resource categories, overviews of tourism basis, the guidance of development ideas, and design of tourism routes, which lack the quantitative evaluation of tourism resources, making it difficult to measure the degree of impact on economic development [
12]. It is difficult to measure the impact on economic development due to the lack of quantitative evaluation of tourism resources. In 1999, domestic scholars began to use absolute abundance, relative abundance, total abundance, combination index, and overall dominance of tourism resources as indicators to roughly describe the occurrence of tourism resources in five dominant positions, including domestic key scenic spots, national nature reserves, national forest parks, national historical and cultural cities, and national key cultural relics protection units [
13].
Tourism resources are classified and ranked according to the Classification, Survey, and Evaluation of Tourism Resources (GB/T18972-2003), but their measurement is always limited to the quantity, type, or quality of resources. With the introduction of mathematical measures such as hierarchical analysis [
14], Han Chunxian et al. combined the type, quantity, and quality advantages of tourism resources and proposed the concept of tourism resource dominance, which refers to the abundance of tourism resource types and quality advantages and disadvantages, and is assessed by the abundance of regional tourism resource types and tourism resource quality [
15]. The tourism resource concentration area and high-quality tourism resource area will be more attractive than the general tourism resource area, and the evaluation system of the superiority degree of tourism resources can be obtained by the comprehensive use of the richness and grade of tourism resources. The concept of agglomeration was then absorbed, arguing that the more obvious the agglomeration of tourism resources in a region, the more conducive it is to the spatial organization of tourism activities [
16]. Tourism resource agglomeration also enhances the attractiveness to long-distance sources, but the above studies only reflect the nature and spatial proximity of tourism resources and do not take transportation elements into account. Lhasa is the most important tourist distribution center for tourists visiting Tibet, with its mainly humanistic architecture concentrated in the urban area, particularly in Chengguan District. However, the surrounding towns lack core tourist attractions. In recent years, the function of tourism destinations in Lhasa has gradually weakened, and the status of tourism transit reception has been strengthened. More and more tourists are choosing Lhasa as the starting point for their trips to popular tourist destinations such as Nyingchi and Ngari. Therefore, whether the tourism resources of most townships in Lhasa have development potential is largely related to the accessibility of transportation. The closer the traffic nodes leading to the surrounding tourism resource advantage areas, the easier it is to be included in the route planning. Tourism resources are heavily blocked by deep mountain valleys away from major transportation nodes. Accessibility is a characteristic of a tourism system where tourists travel from their place of residence to a tourist destination. Accessibility to an attraction is affected by transport systems [
17]. There are many factors influencing the accessibility of scenic spots, including the spatial distribution of tourism resources, regional differences in road network structure, natural environment, human environment, etc. Eastern and central cities are connected by air to high-speed rail, while western cities are still connected by air. Road networks are part of the infrastructure used by tourists to reach an attraction. The quality of the road networks positively or negatively affects accessibility, which in turn affects the choice of tourists. The travel modes normally used by tourists to visit attractions within a certain area are cars, buses, bicycling, walking, trains, taxis, ferries, and motorbikes [
18]. There are four main ways to travel in Tibet: self-driving, traveling with a group, bicycles and motorcycles, and public transportation. Tibet tourism travel is different from the mainland due to road network restrictions and the lack of transportation infrastructure because accessibility and convenience are poor. Even with relatively unique tourism resources, they are mostly known in a few small circles of tourists. As a regional comprehensive transportation hub, it is possible to develop new modes of transportation services such as “on-demand door-to-door”, “Internet+”, and “sharing economy” in Lhasa. Promoting the development of new transportation modes, such as online vehicles and shared transportation, and encouraging the development of complementary transportation modes [
19]. Ordinary tourists are easily discouraged by traffic conditions. Based on these factors, this paper uses four indicators of tourism resource grade, richness, agglomeration, and accessibility to optimize the index system of tourism resource superiority.
After the concept of the superiority degree of tourism resources was proposed, the relationship between tourism resource background and economic development has had a scientific measurement index. The entropy value method can be used to measure the misalignment between tourism resource endowment and economic development (“resource curse”). SPSS software can also be used to make a comprehensive evaluation of tourism resources and the economy and to guide the classification of tourist places with different degrees of tourism resource dominance, economic level, and development type. With the deep promotion of China’s poverty alleviation, the superiority degree of tourism resources is more often utilized in the discussion about the strength of the tourism economy against poverty [
20]. In essence, they are all analyzing the tourism resource advantage to the regional economy, the type of tourism resources and economic coupling, the different types of coupling regional development differences, the “resource curse”, and other phenomena [
21]. Tourism development has a significant impact on the industry, society, culture, and environment in economically backward areas, enriching the market of domestic tourism products while increasing the income of people in the poor areas and promoting common prosperity.
Tourism development has a significant impact on the industry, society, culture, and environment of relatively economically backward regions, enriching the domestic tourism product market while increasing the income of people in economically backward regions and promoting common prosperity.
According to the Report on the Observations of Poverty Alleviation in National Rural Tourism released by the former National Tourism Administration in 2016, tourism is becoming the main way to absorb employment for low-income people, an important force in lifting low-income rural people out of poverty
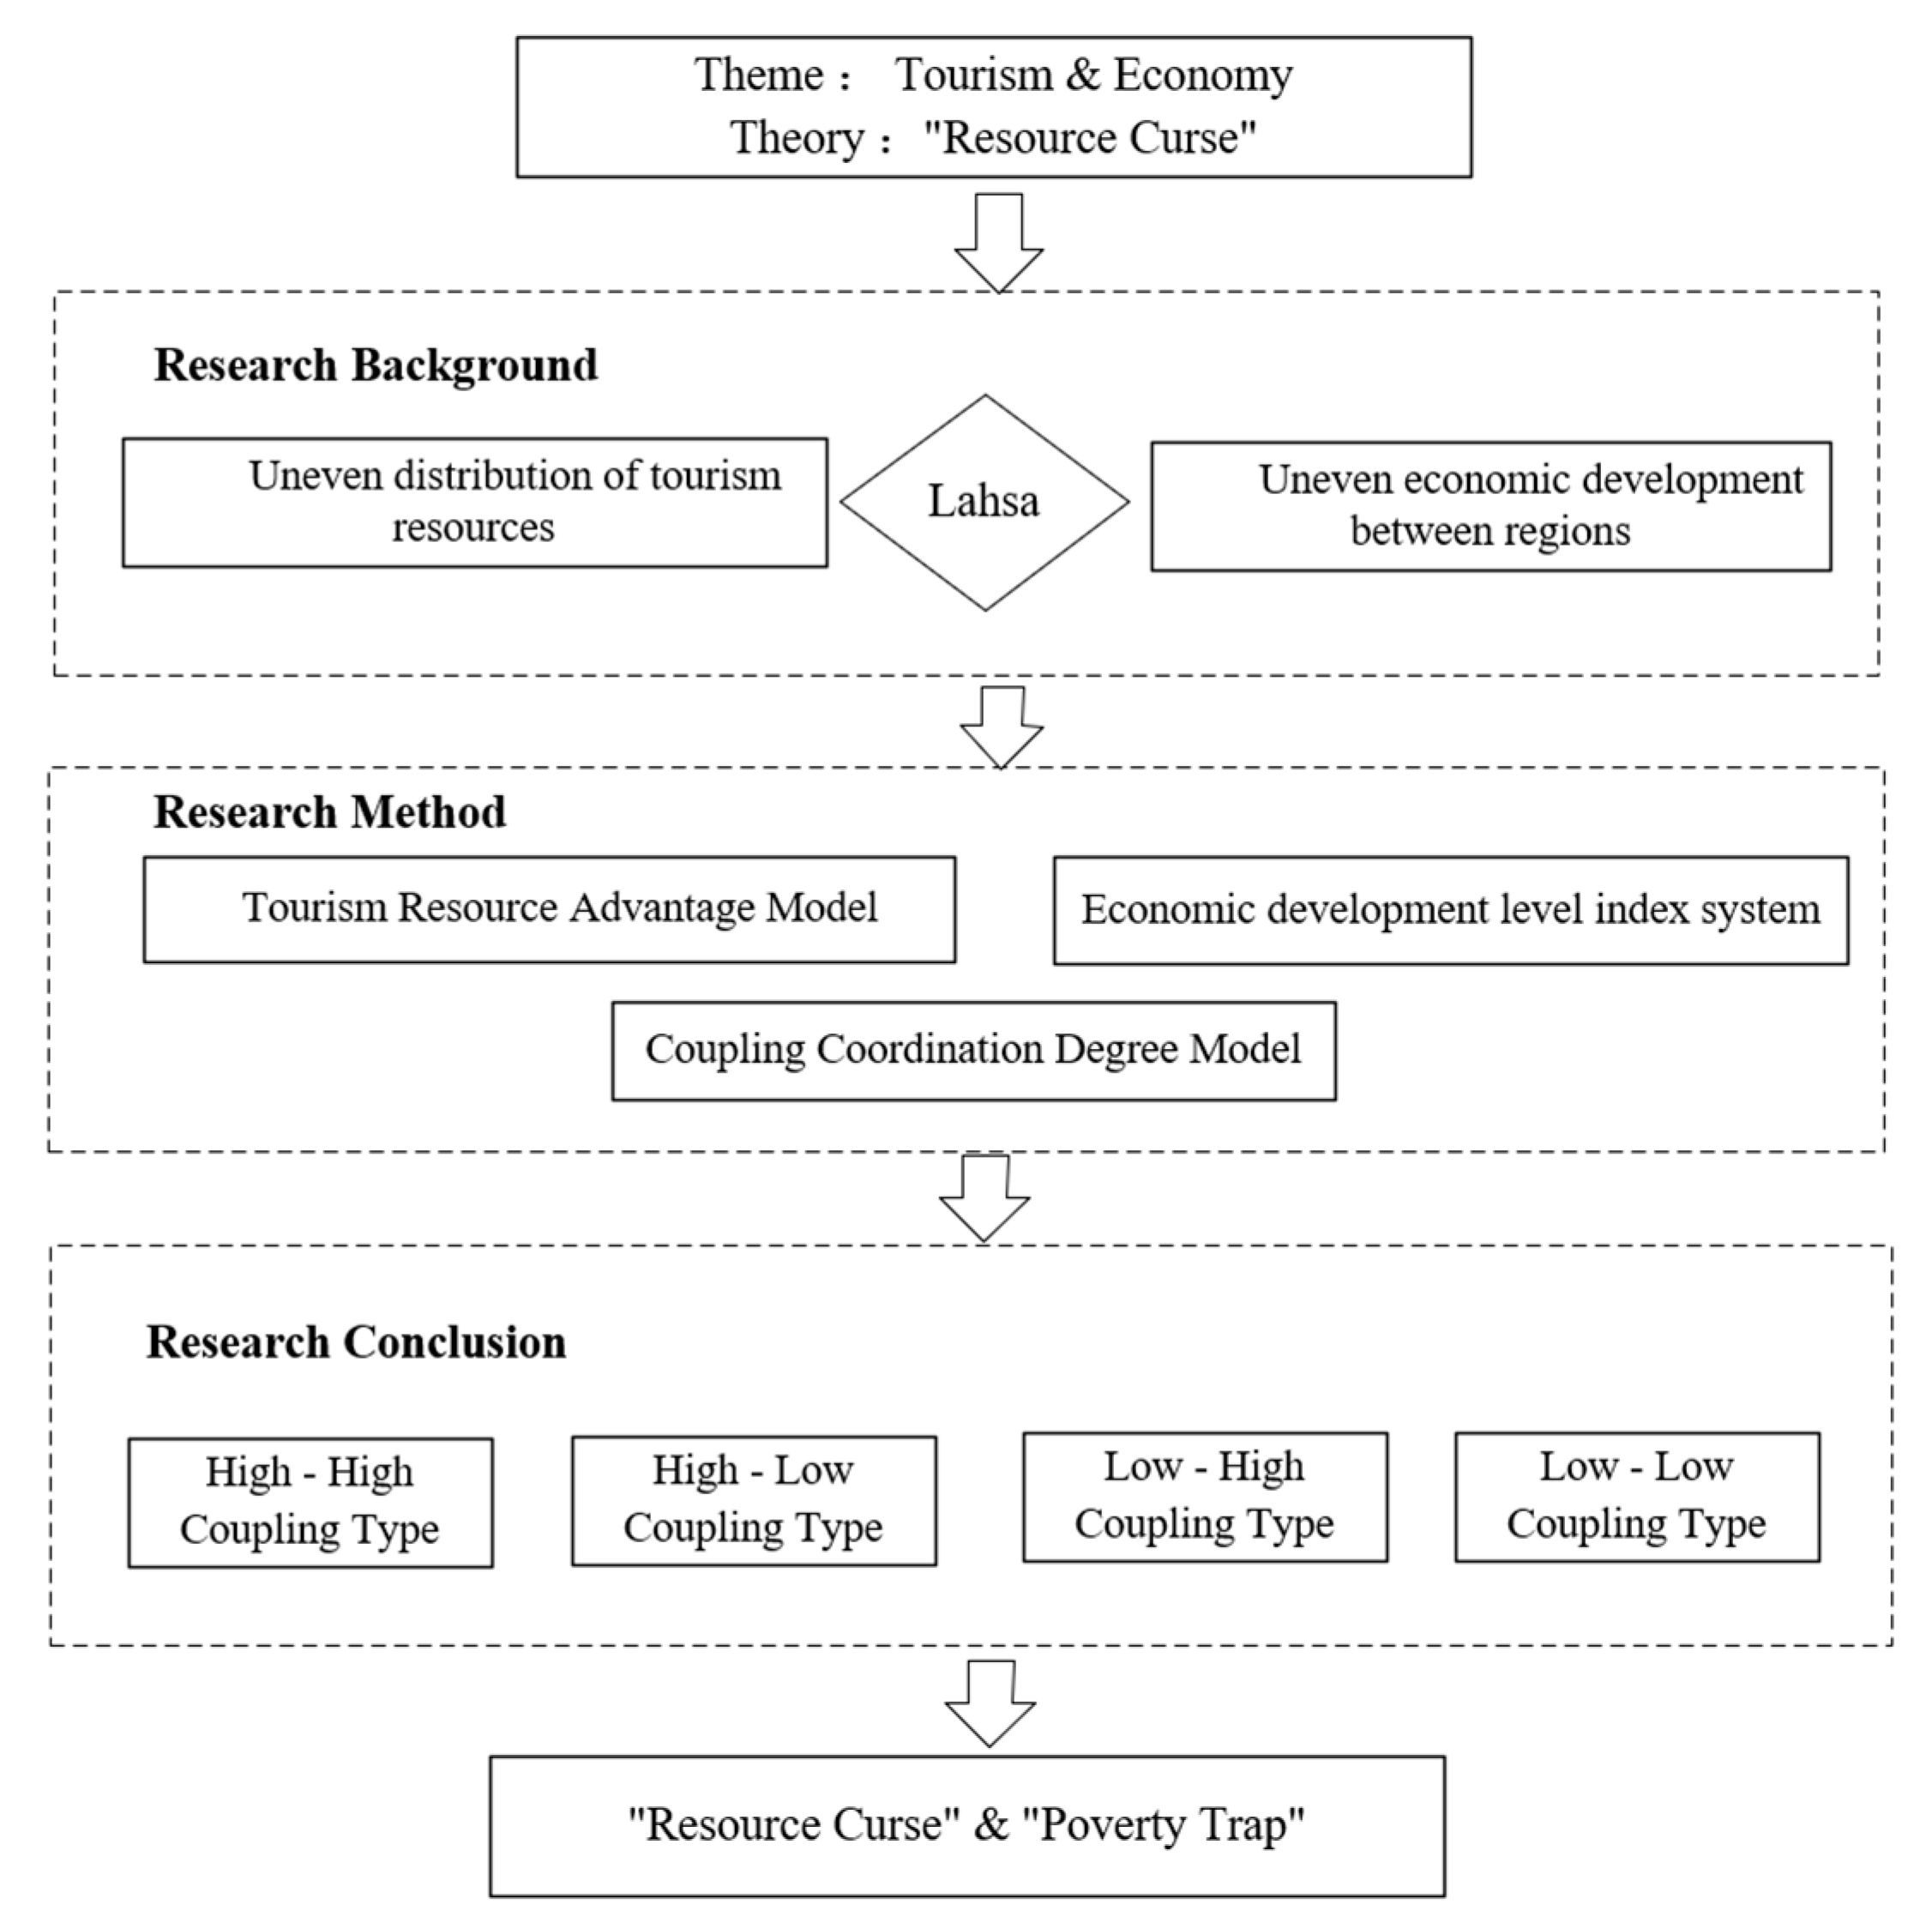
There are two main problems with tourism traffic in Lhasa. First, it is difficult to access Tibet. At present, there are few air routes and trains into Tibet, and it is often difficult to get a ticket during the tourism season. Second, it is inconvenient to travel within Lhasa. Some attractions can only be reached by chartering a bus or joining a tour. The development of the tourism economy in ethnic areas requires continuous optimization of regional road network construction, improving the construction of tourism infrastructure and service facilities, enhancing tourism service capacity, and increasing the publicity of tourist attractions, etc. As the economic, cultural, and political center of the Tibet Autonomous Region, Lhasa has a long history and rich tourism resources. However, for a long time, the uneven distribution of tourism resources, unbalanced development, relatively lagging development of rural industries, and large differences in economic development between regions have always existed. Considering the special ecological barrier value of the Qinghai–Tibet Plateau, tourism is the cleanest and most efficient path for industrial development. On this basis, this study constructs a coupled coordination model between tourism resource superiority and regional economic development index and analyzes the coupled coordination of tourism and economic development in 65 townships and streets of 8 counties and cities in Lhasa. With this model, the coupling types of counties and cities are classified, and the degree of coordination between tourism resources and the industrial economy in the development process is explored. The study of the reasons and solutions for the imbalance between economic development and tourism resources in Lhasa City can provide useful references for the development of the regional tourism industry in similar tourism cities.
3. Study Area and Data Sources
3.1. Study Area and the Type and Distribution of Tourism Resources
Lhasa boasts a unique plateau valley landscape and a profound historical and cultural accumulation. Situated in the middle of the Qinghai–Tibet Plateau, the Lhasa River basin is a tributary of the Yarlung Tsangpo River, which has given rise to rich and diverse tourism resources. The city’s tourism economy has been steadily growing, with tourism revenue accounting for a steadily increasing percentage of GDP, rising from 23.54% in 2010 to 56.43% in 2019. However, the outbreak of the COVID-19 pandemic in 2020 dealt a severe blow to Lhasa’s tourism industry. The total number of domestic and foreign tourists received that year was 20.08 million, marking a 14.1% decrease from the previous year. Similarly, total tourism revenue fell by 13.4% from the prior year, amounting to 30.184 billion yuan. The greatest impact was on inbound tourism, with the number of inbound tourists falling by 99.0% and foreign exchange earnings from tourism decreasing by 98.3%. Despite the serious epidemic, Lhasa’s tourism revenue still accounted for 44.5% of GDP in 2020, highlighting the significance of tourism as an important pillar of the city’s economic development.
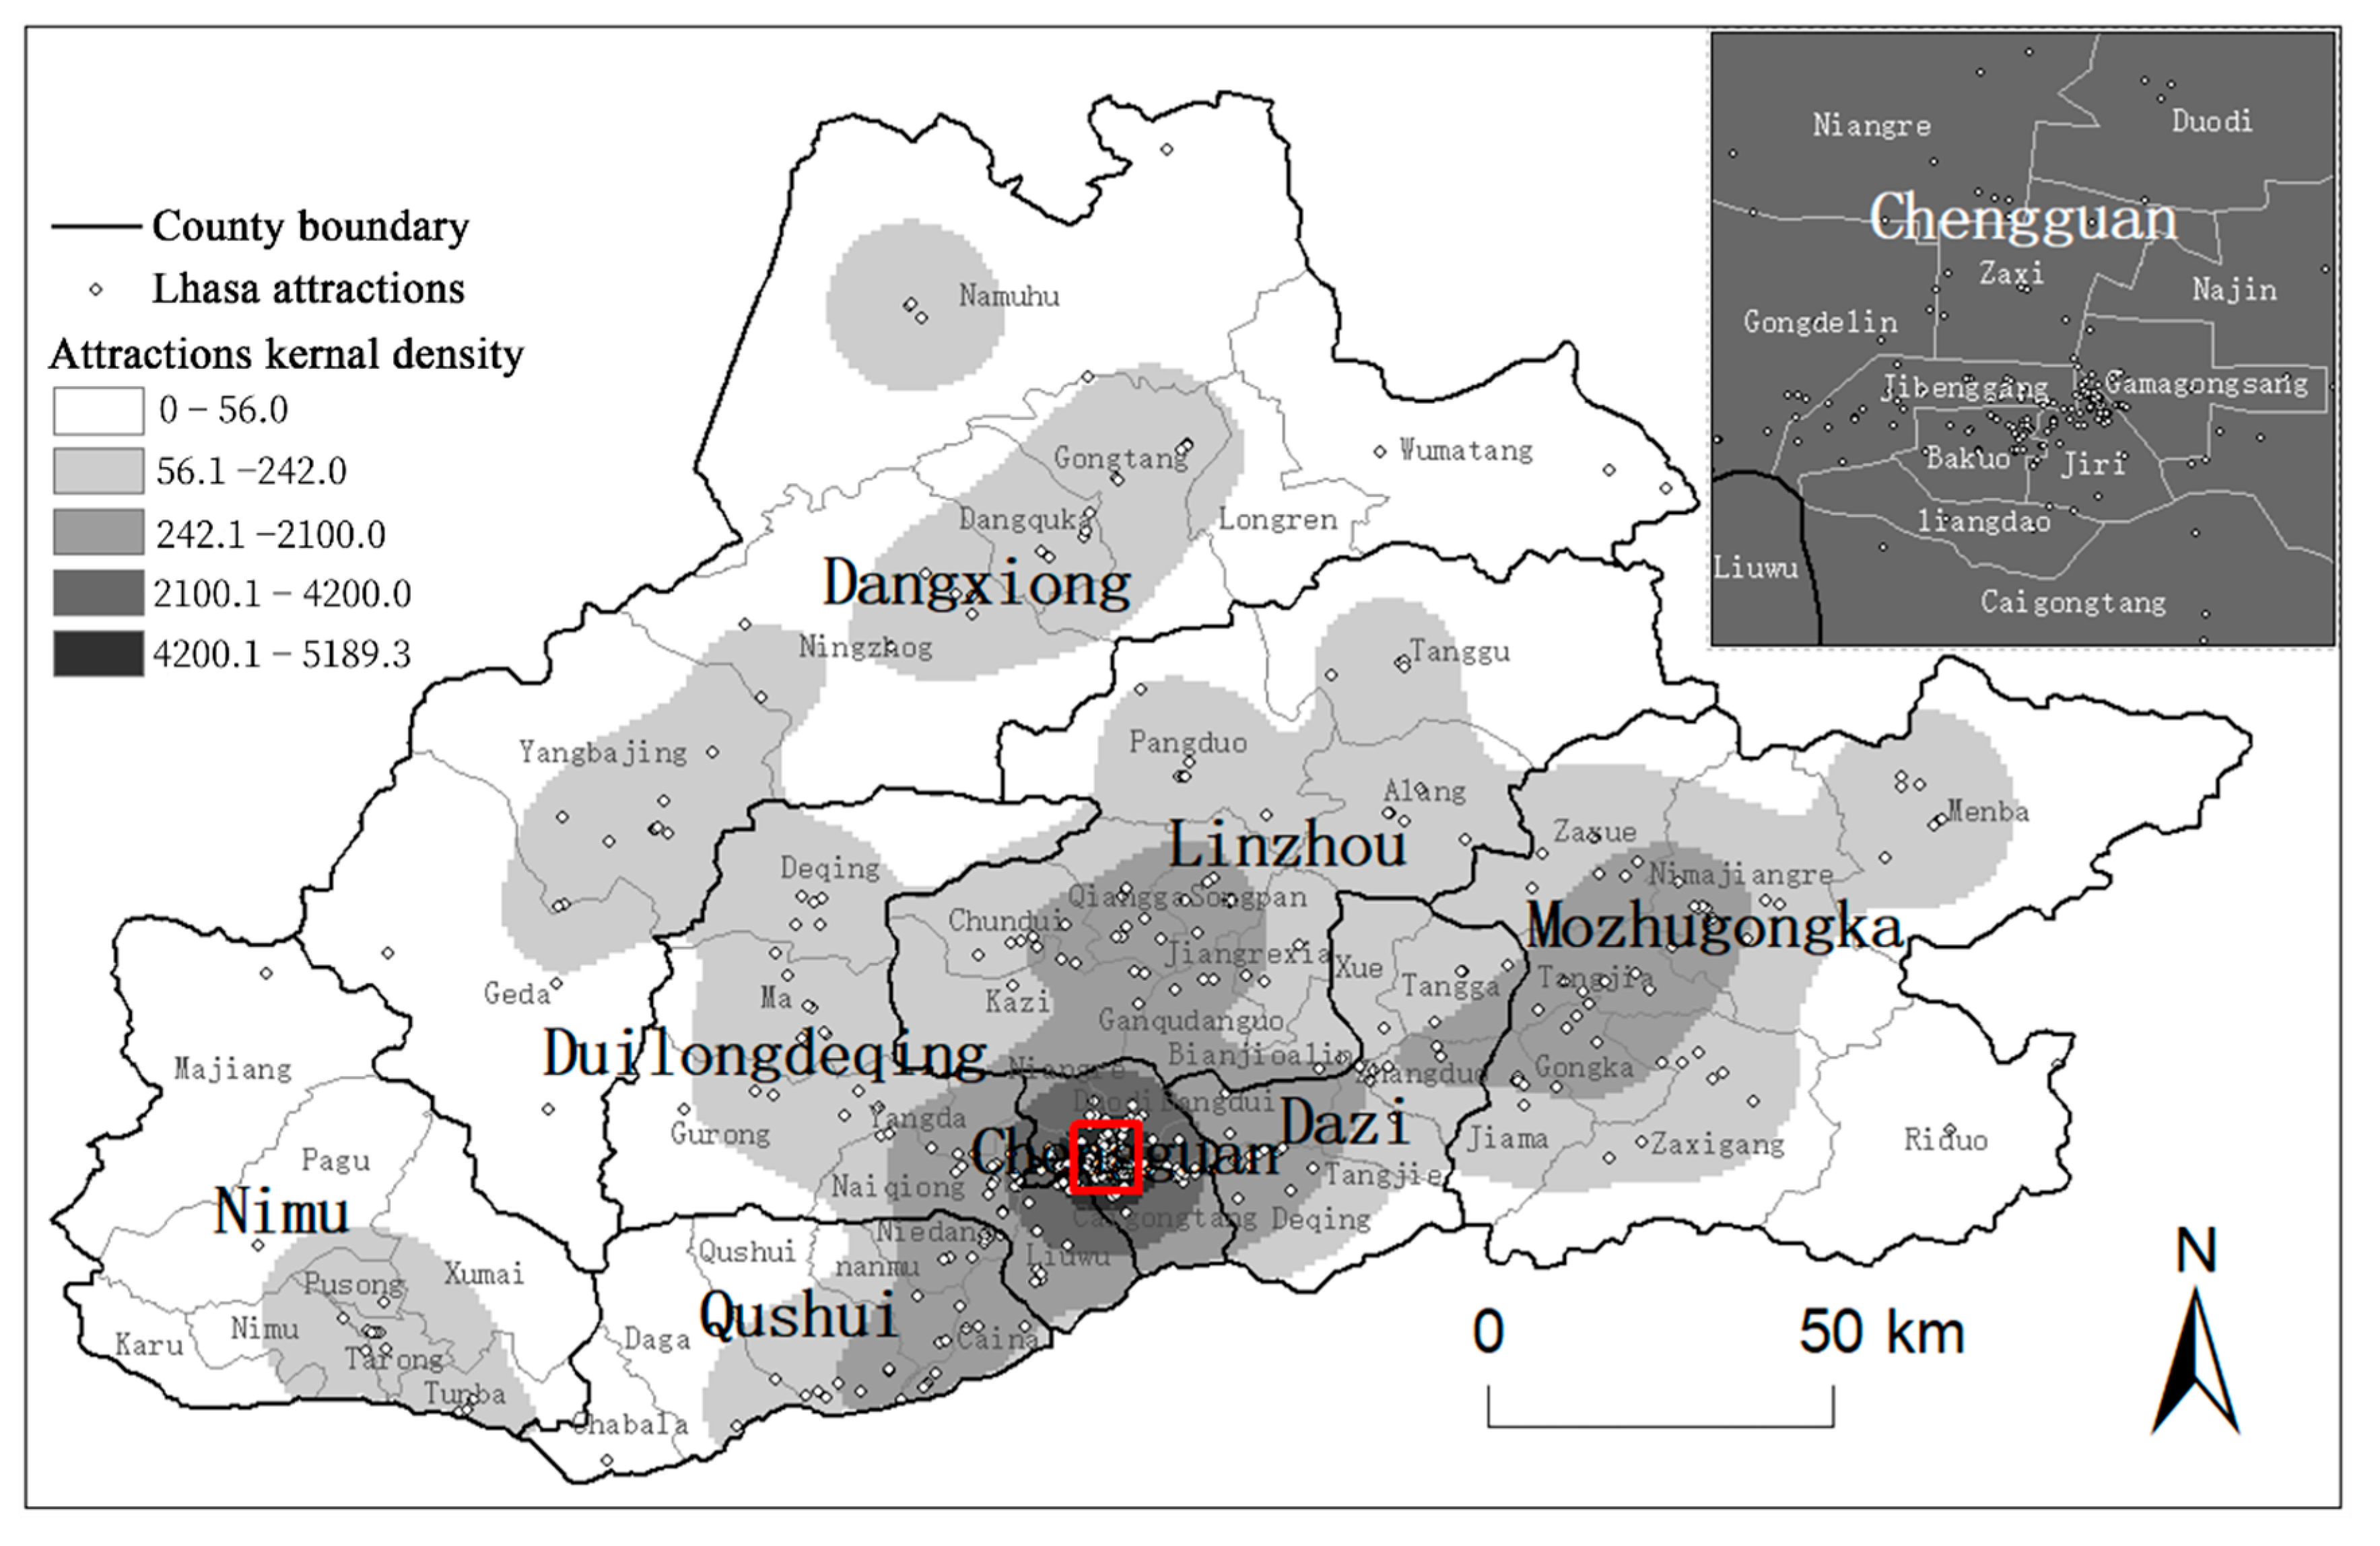
As the economic, cultural, and political center of the Tibet Autonomous Region, Lhasa has a long history and rich tourism resources. As of January 2022, Lhasa has 29 A-level tourist attractions and 300 cultural protection units. Through the web crawler, data on Lhasa tourism resources mentioned in the network travelogues and reviews were captured. Then, the coordinates of 488 tourism resource points were obtained by screening and comparison to attain the kernel density of the spatial distribution of tourism resources in Lhasa (
Figure 1). The tourism resources of Lhasa are highly concentrated in the urban area, with Chengguan District as the core. The problems of excessive agglomeration of tourism resources, uneven distribution of regional tourism resources, and large gaps in accessibility have always limited the sustainable development of global tourism in Lhasa. The main modes of tourist transportation between scenic spots within cities are self-driving, public transportation, and tourist buses. Lhasa, Xining, Yinchuan, and other cities do not have subways, so the highway network is very important for the provincial capitals. The layout of the provincial connected highway network is basically formed.
In order to effectively distinguish the types of tourism resources and the richness of regional tourism resources, the 488 tourism resource points in Lhasa can be categorized into 6 major categories and 29 sub-categories according to the tourism resource classification method announced in Tourism Resource Classification, Investigation and Evaluation (GB/T 18972-2017). The six types of landscapes include: A physiographic landscape, B water landscape, C natural landscape, E buildings and facilities, F historical sites, and G tourist shopping. Among them, A, B, and C are natural landscapes, mostly distributed in the suburbs, scenic spots, nature reserves, and mountainous areas. The whole area of the Tibetan Plateau is unique in its natural landscape and rich in quality tourism resources. Nevertheless, Lhasa City is relatively weak in quality natural tourism resources compared to the surrounding areas. However, in the three types of cultural landscapes of E, F, and G, Lhasa has gained an extremely high relative resource advantage due to its profound cultural heritage that brings together a large number of ancient temples, ancient buildings, ancient stone carvings, and ancient murals. For example, the Jokhang Temple and the Potala Palace have become the cultural business cards of Lhasa.
3.2. Data Sources
Data on tourism resource points were obtained by crawling the names of Lhasa tourism resource points mentioned in the online travelogues and reviews of Ctrip.com, Tuniu, Donkey Mama, and other websites, and a total of 350 names of tourism resource points were obtained. These data on A-level attractions and cultural relics protection units were obtained from the Lhasa Tourism Development Bureau, Tourism Development Department of Tibet Autonomous Region, Lhasa Tourism Development 14th Five-Year Plan, and Lhasa Cultural Relics Protection Units List. A total of 29 A-class tourist attractions and 300 cultural preservation units were obtained. After merging data and selecting and eliminating the renaming items, 516 valid tourism resource point names were obtained. These data on 516 tourism resource points were transformed into geographical coordinates through Baidu coordinate pickup. The tourism resource points with different names in the same location and the different names of small attractions in the same tourism resource point were combined to attain a total of 488 valid tourism resource points.
Road network data for 2010 and 2015 come from OpenStreetMap, and data for 2020 come from Sky Map. Terrain, administrative division, and lake water system data are from the National Qinghai-Tibet Plateau Scientific Data Center. The elevation, slope, topographic relief, and surface roughness of five counties in three districts of Lhasa were measured by the ArcGIS terrain analysis tool. The economic and social data were obtained from the Lhasa Statistical Yearbook 2010–2020, Lhasa National Economic and Social Development Statistical Bulletin 2010–2020, Chengguan District Statistical Yearbook 2010–2019, Dangxiong County Statistical Yearbook 2019, Duilongdeqing District Statistical Yearbook 2016–2020, Linzhou County Statistical Yearbook 2018, and other relevant statistical yearbook texts of Lhasa collected during the second Qinghai–Tibet scientific research mission and published on the Internet, as well as the China County Statistical Yearbook 2010–2020 from CNKI. Population data were compiled by the team of Beijing Normal University from the Population and Urbanization Data Set of Lhasa, based on the census information and demographic yearbooks by township and year.
5. Results
5.1. Superiority Degree of Tourism Resources
Tourism resource dominance degree is an important indicator of regional tourism development potential. Academics explore the measurement around grade degree, richness, and agglomeration degree to reflect the grade difference, type abundance, and agglomeration of tourism resources. In this study, the transportation accessibility index is added on this basis to reflect the external accessibility of tourism resources, and the top ten townships and streets with the highest ranking of each index during 2010–2020 are obtained by calculating the average value. Traffic accessibility will highlight the location advantages of some tourist attractions, and these tourist attractions can be prioritized for development under the premise of similar tourist attractions [
61].
The top six township streets in Lhasa are located in Chengguan District, among which the core three streets (Jiri Street, Jibengang Street, Bakuo Street) in Chengguan District with core tourism resources such as Bakuo Street and Potala Palace have absolute advantages. In addition to Chengguan District, the areas with the highest richness are Yangbajing Town and Ningzhong Township in Dangxiong County, and the diversified tourism resources based on the combination of nature (mountains and hot springs) and humanities (temples and sites) are ranked higher, with more than eight kinds of resources. The area with the highest agglomeration degree appeared in Gandanquguo Town, Linzhou County. The tourism resources in the area are only three ancient temples (Ganqu Temple, Langtang Temple, and Jiare Temple), which are very close to each other, so they achieve a higher ranking. The top-ranked township streets are also fewer in number but close to each other; the area with the highest accessibility appears in the central township streets of each district and county, the town center with relatively gentle terrain, and the location of important traffic nodes. Gurong Town in Duilongdeqing District is the only way to Beijing–Tibet Expressway and Qinghai–Tibet Highway. Its tourism resources are also very close to the main traffic arteries, so it has achieved high accessibility.
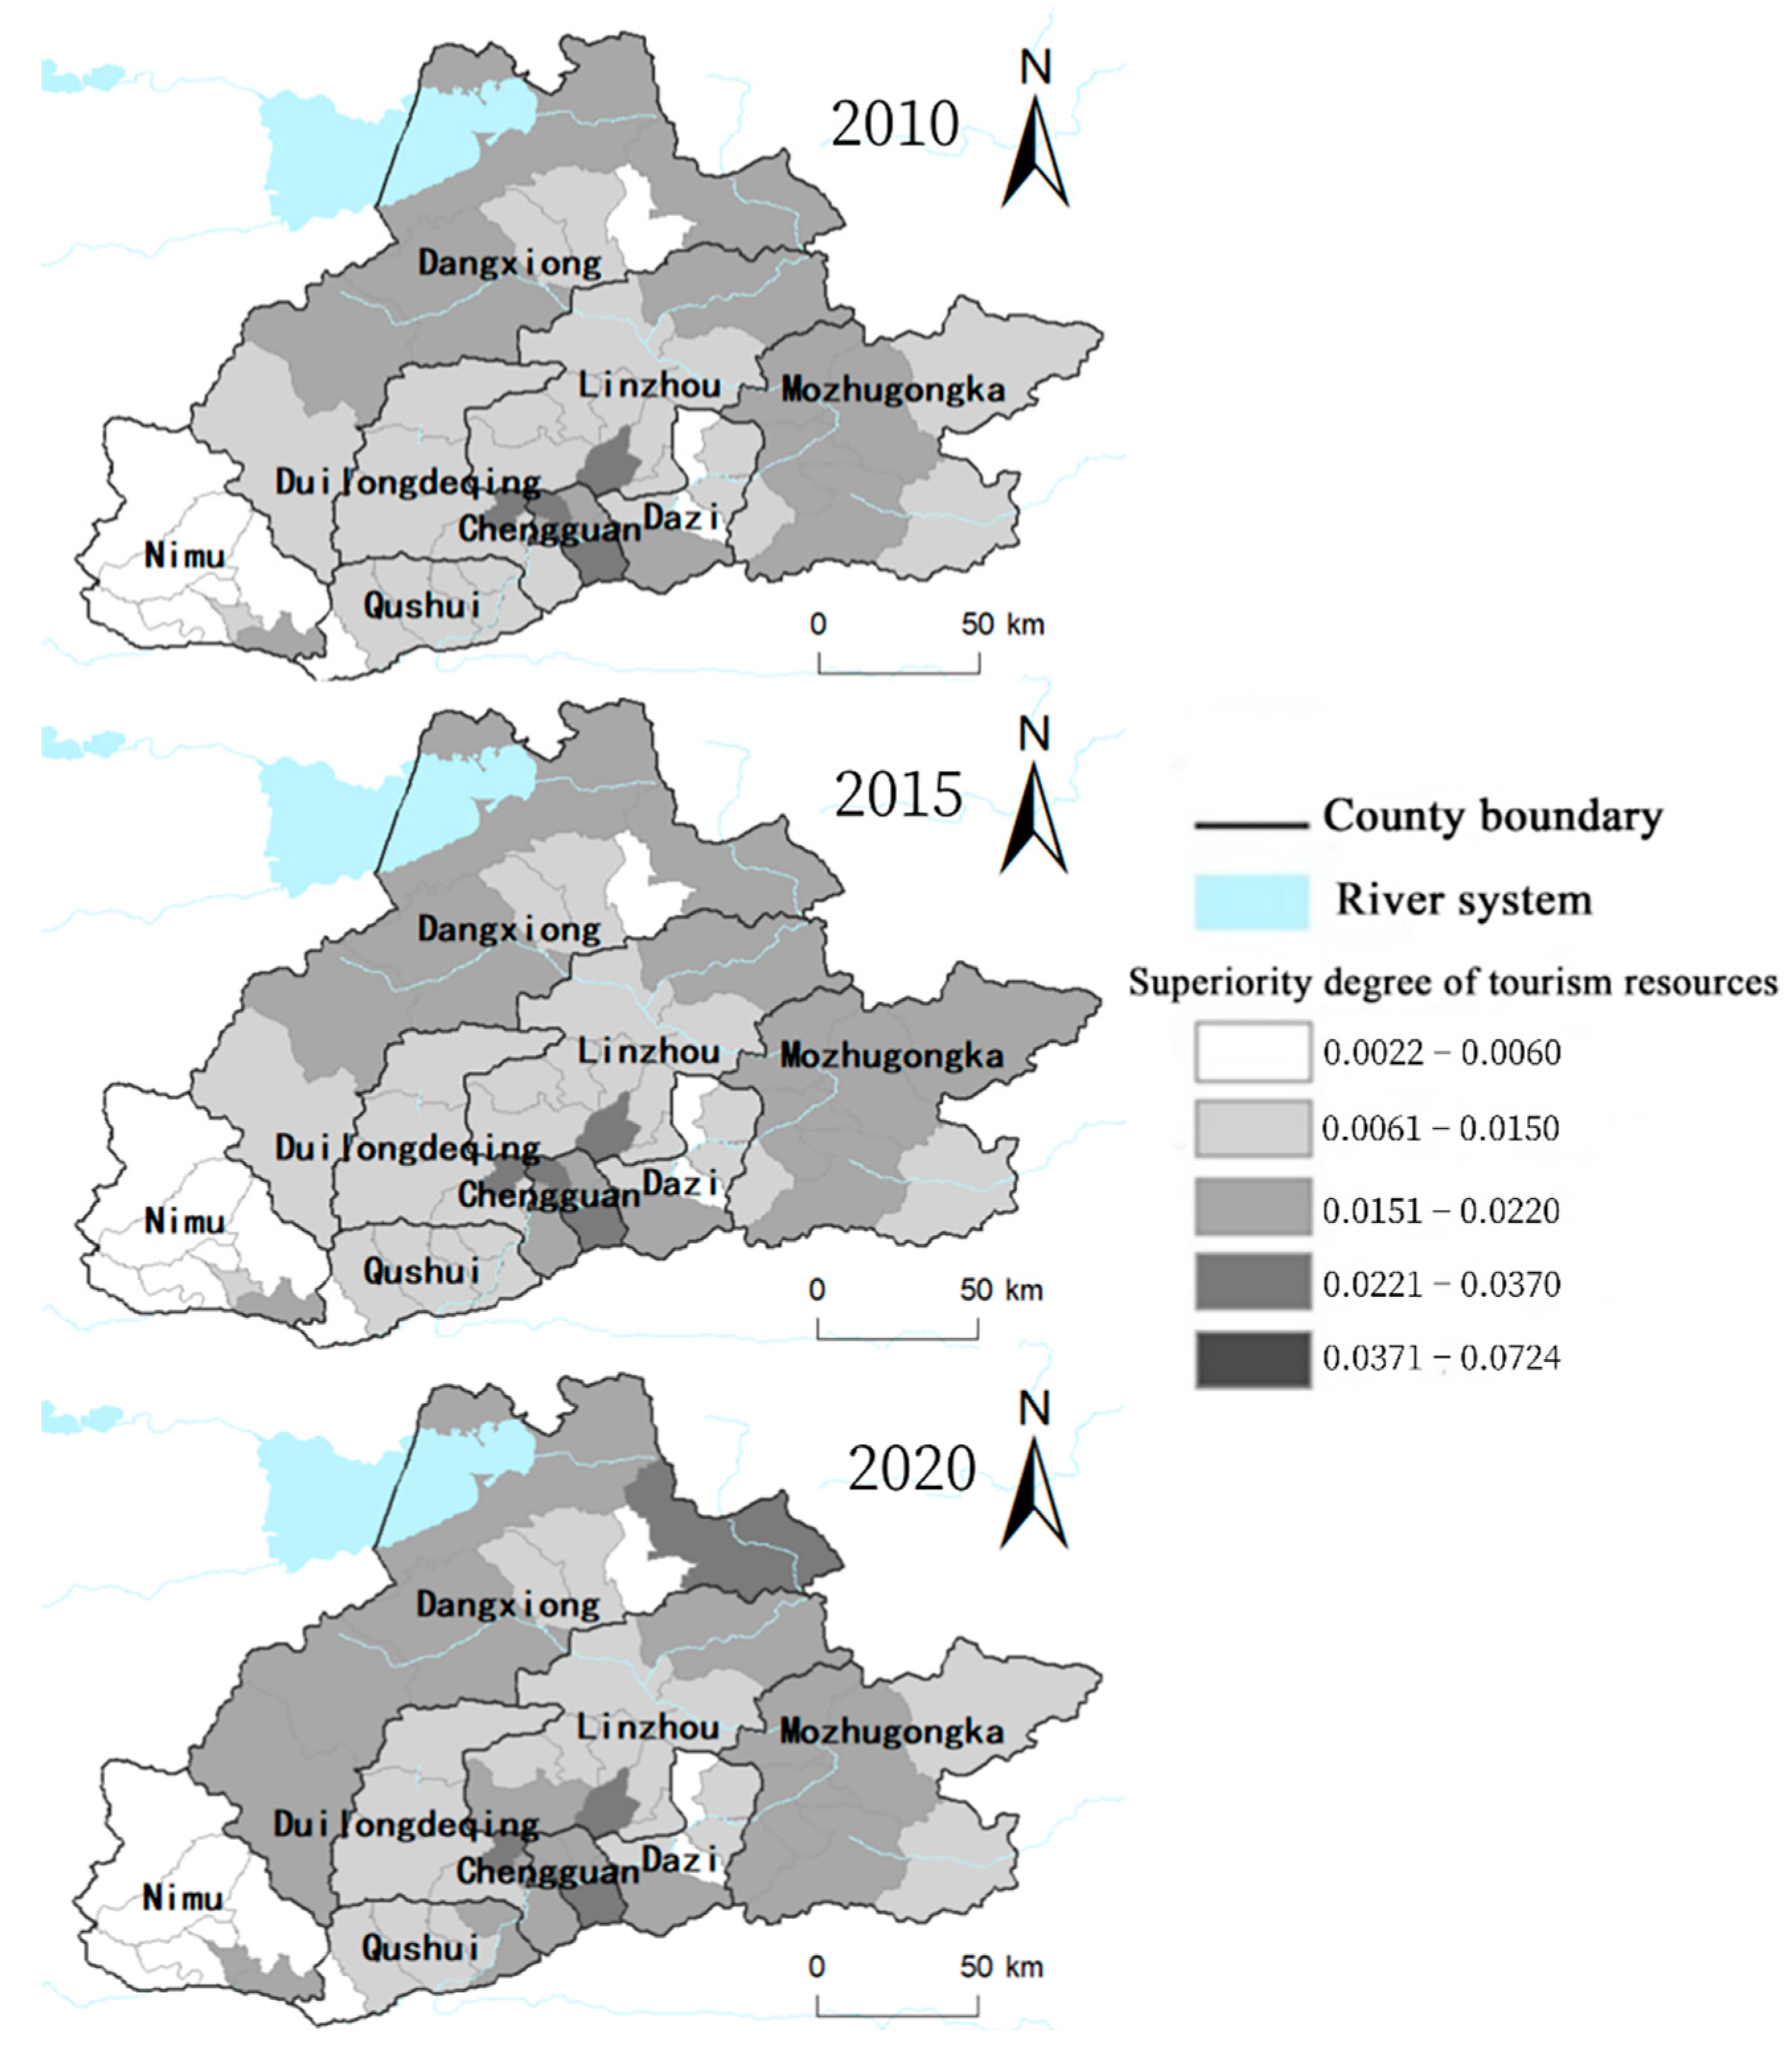
Lhasa is rich in tourism resources, especially humanities tourism resources such as buildings and temples, which have a certain scarcity and uniqueness. Still, there needs to be a more significant gap in the degree of superiority of tourism resources in various towns (
Figure 3). From the perspective of the county scale, Chengguan District has the most abundant tourism resources, among which Jiri Street, Jibenggang Street, and Bakuo Street account for 13.5% of Lhasa’s tourism resources. Chengguan District has intensive tourism resources and superior transportation conditions and is the most attractive area in Lhasa. The number and types of tourism resource points in Nimu County are small, and the traffic conditions around Majiang Township within the county are poor, and other tourism resource points cannot form a string, forming a large-scale tourism resource disadvantage area. The southern river valley area of Linzhou County has relatively rich tourism resources, but the region’s interior is widely mountainous and rugged terrain. After weighing the traffic and terrain elements, the degree of advantage in tourism resources in Linzhou County is not high. In terms of districts and counties, this data set can visually explain the development process and regional differences in the superiority degree of tourism resources in Lhasa [
62].
From the perspective of the city scale—the Lhasa tourism resource advantage degree basically presents a “one core and two rings” pattern. Chengguan District is the core area with the highest tourism resource superiority degree; the advantages of tourism resources in Qushui County, Nimu County, Duilongdeqing District, Linzhou County, and Dazi District around Chengguan District are relatively low. On the one hand, the quantity and quality of tourism resources are not enough. On the other hand, it is also inconvenient for traffic conditions, and it is not on the important traffic node connecting Lhasa urban area with surrounding towns, which further reduces it as a local tourism attraction. The outermost ring of Dangxiong County and Mozhugongka County are relatively rich in tourism resources, especially the Nam Saltwater Lake and the Tanggula Range in Dangxiong County and Sijinla Tso in Mozhugongka County, which have a certain scarcity of tourism resources. At the same time, the layout of important traffic arteries has also enhanced the local tourist attraction.
During the ten years from 2010 to 2020, Lhasa’s overall tourism resource superiority has increased, but the increase is slight. The areas with the highest tourism resource superiority are always Jiri Street, Jibenggang Street, and Bakuo Street within Chengguan District. Since 2010, Lhasa City has promulgated and implemented regulations such as Lhasa City Urban Master Plan (2009–2020), Lhasa City Historical and Cultural City Protection Plan, Lhasa City Old Town Protection Regulations, and Lhasa City Bakuo Street Historical and Cultural District Protection Plan, so that the protection of historical and cultural heritage in Lhasa City has a scientific basis. In order to enhance the tourism attractiveness in the surrounding townships of Chengguan District, Lhasa has begun to focus on the creation of high-grade tourism resources. In 2015, the Tibetan Yak Museum was established in Dulong Deqing District, the Qunjue Ancient Weapons Museum in Mozhugongka County, and the Rubbing Culture Exhibition Hall in Chengguan District. Lhasa City also focused on creating industrial parks such as Zhizhao and Ganlu Tibetan Medicine. By cultivating new tourism attraction points, tourists will be diverted from Chengguan District to the surrounding area, extending the stay of transit tourists and gaining more tourism revenue.
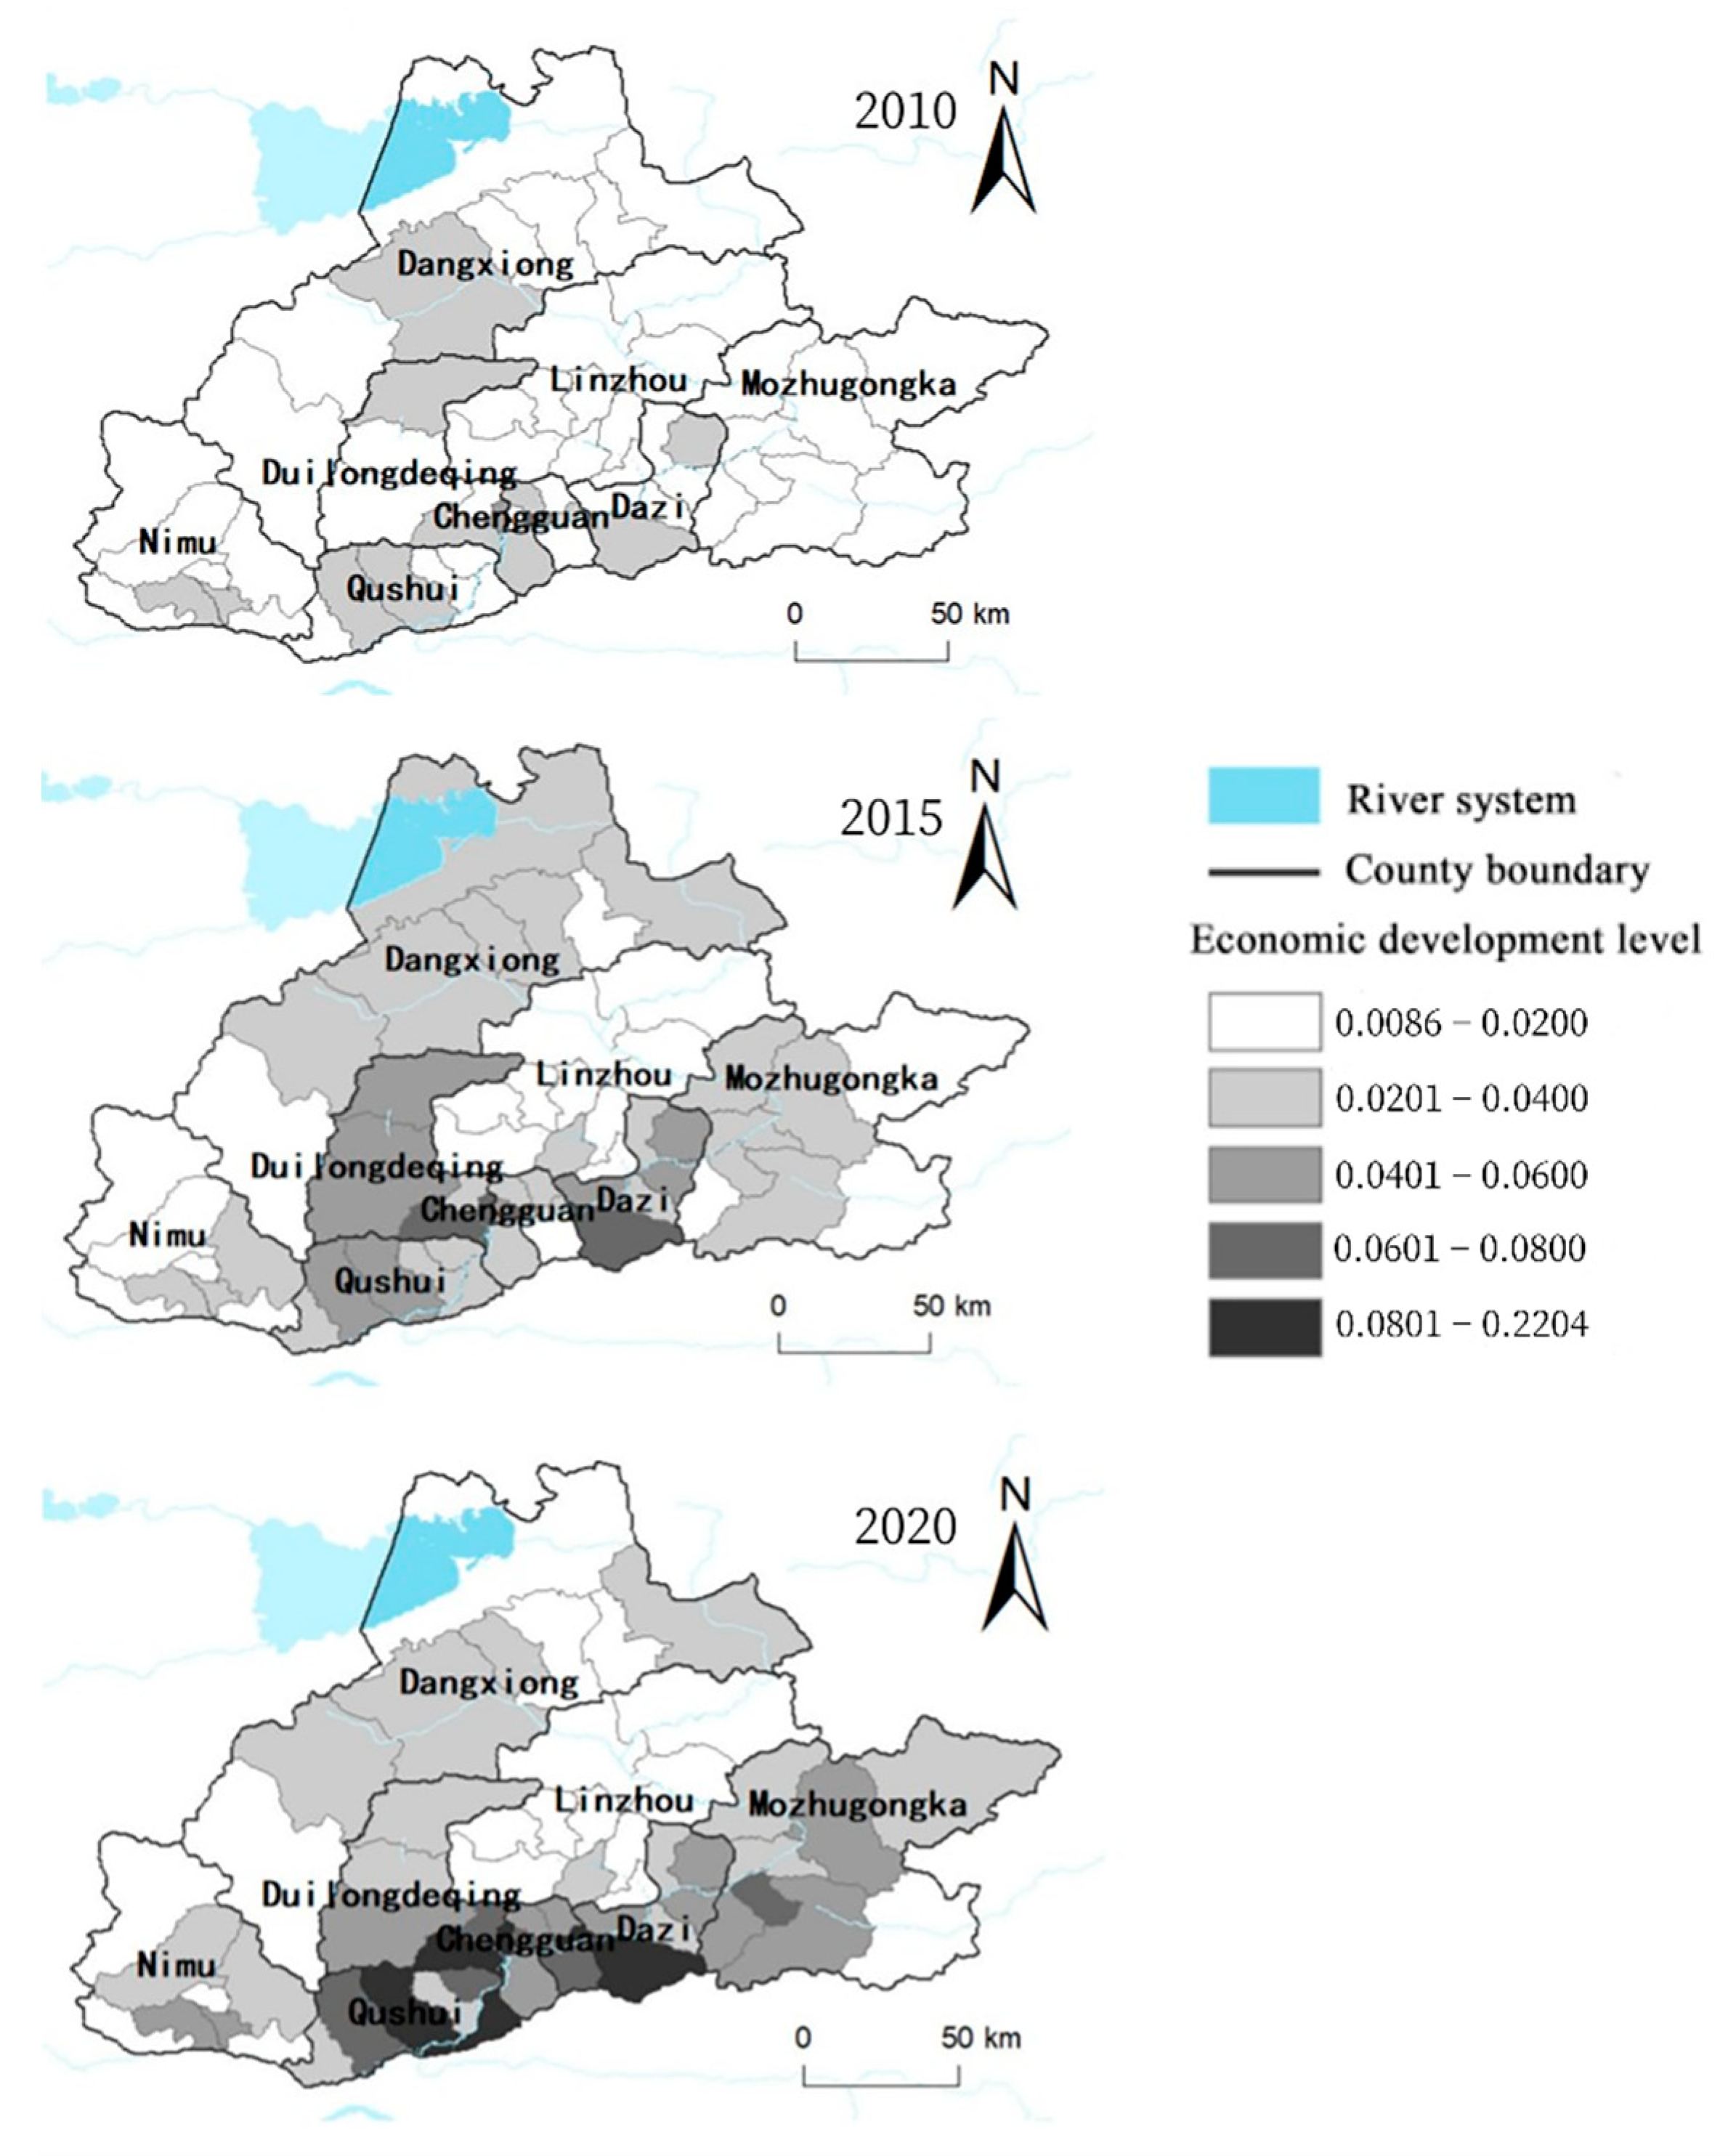
5.2. Economic Development Level
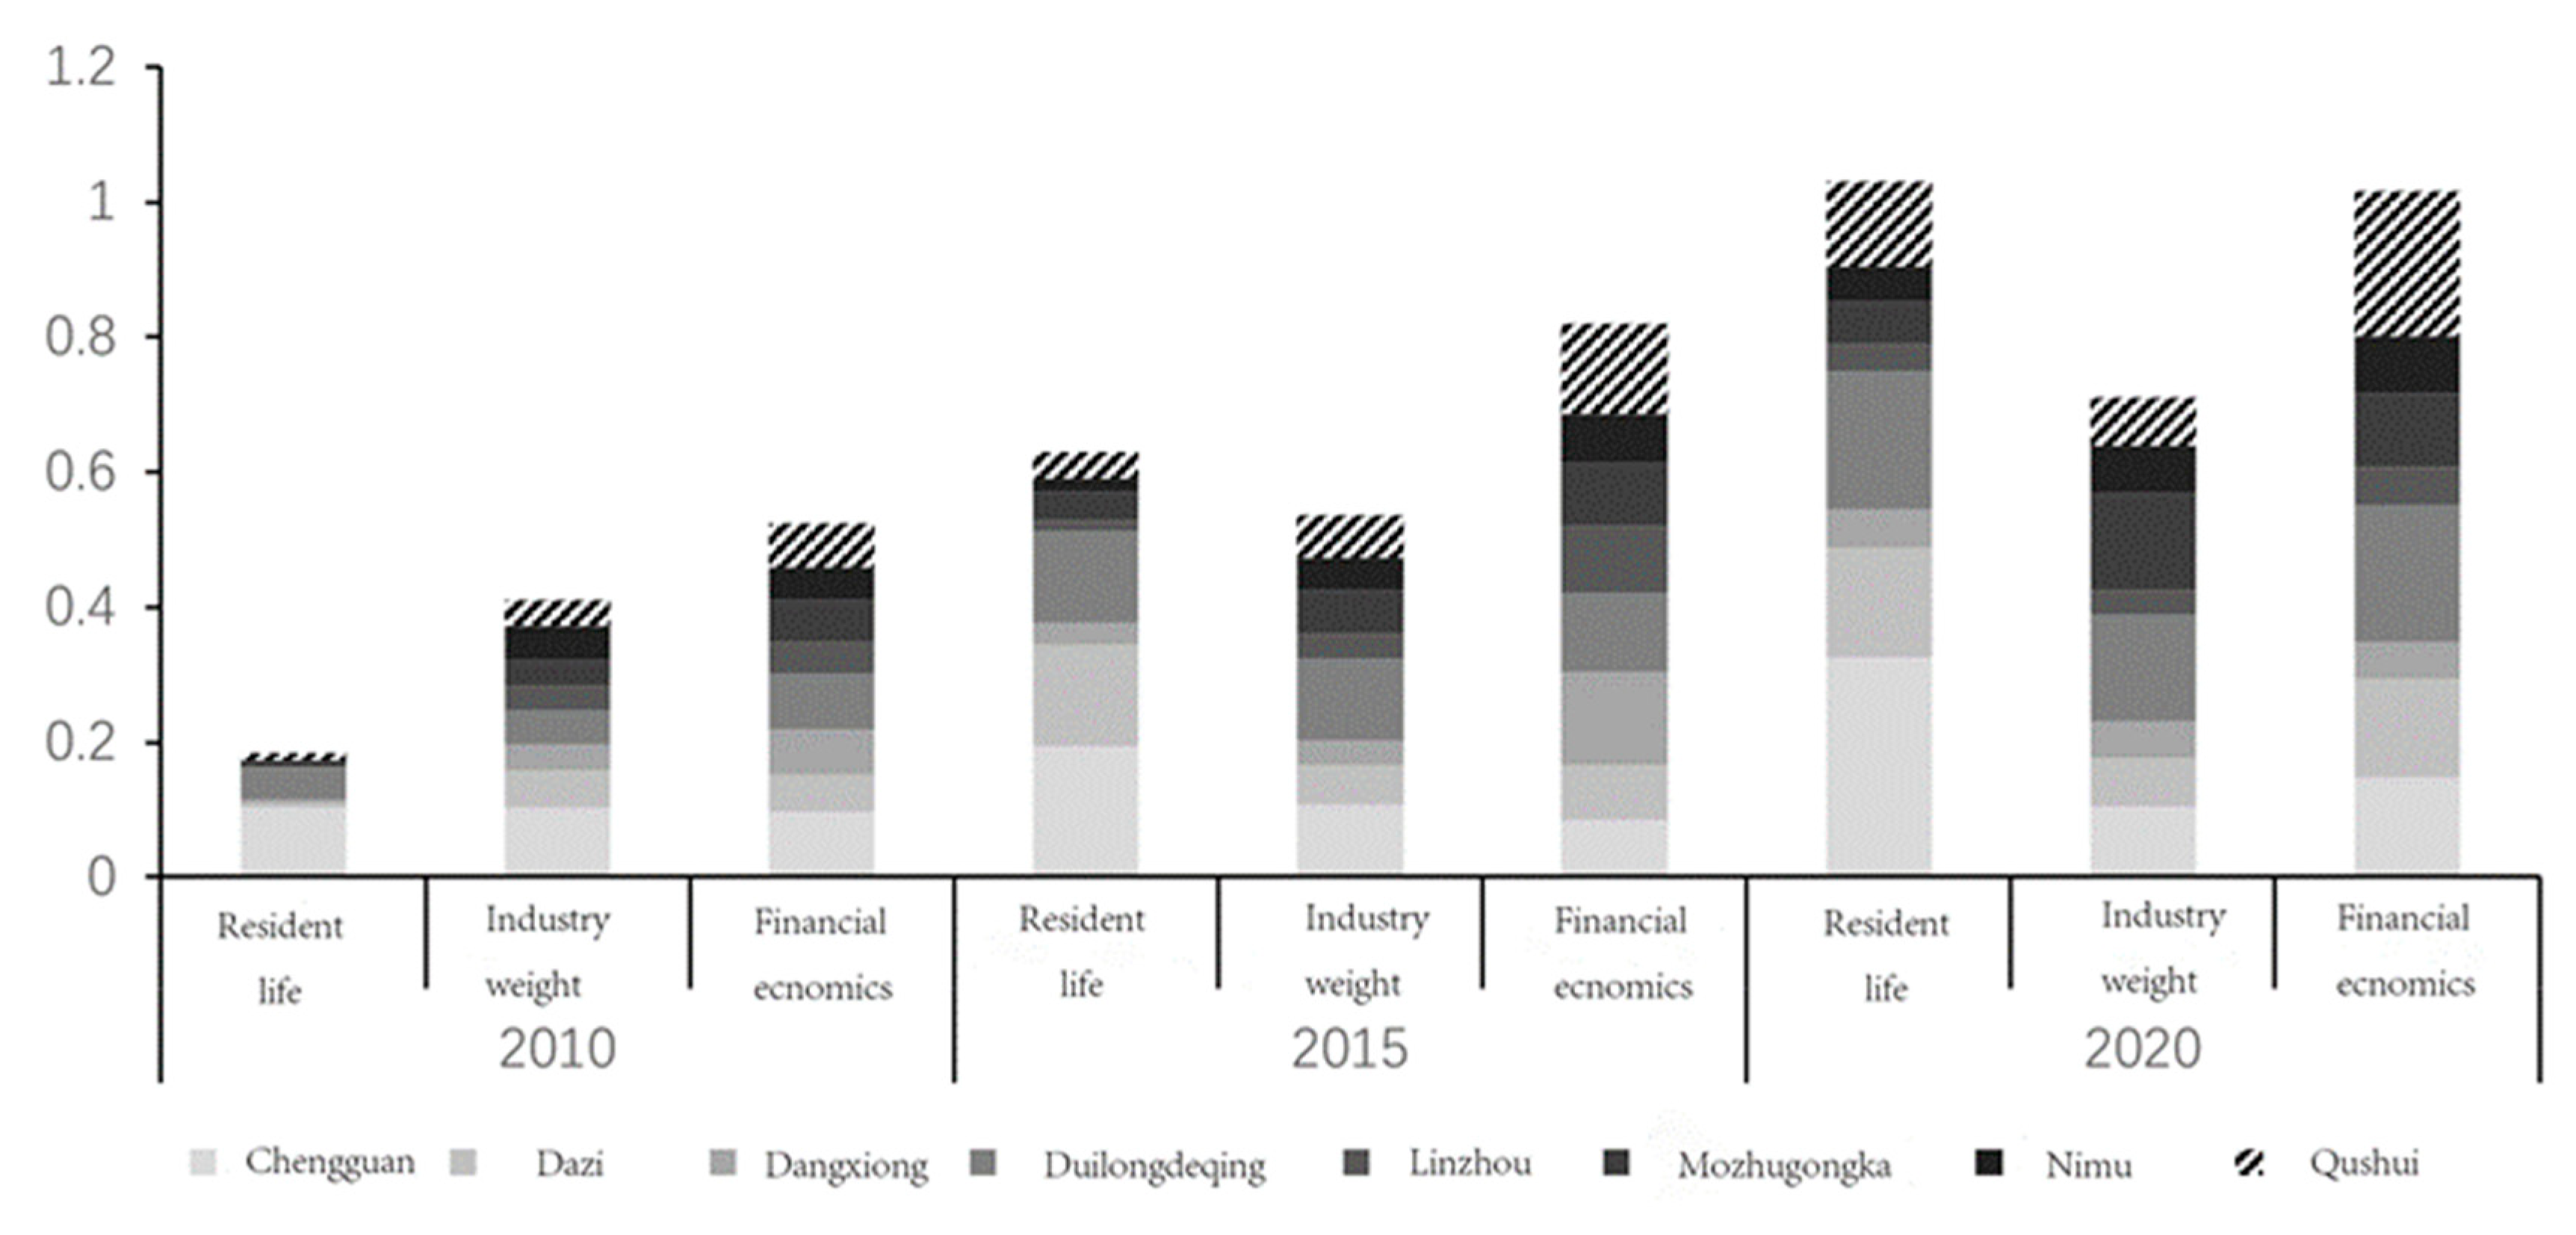
From the classification of economic development-driven factors, the three major categories of factors have shown a positive growth trend in the past 10 years, with the fastest increase in the impact of residential life factors on the economy, followed by the fiscal economy, and the proportion of industries has the smallest change. In 2010, the living elements of residents accounted for only 16.3% of the total elements of economic development, among which the contribution value of Chengguan District accounted for 56.6% of the city’s total. Therefore, the driving effect of residents’ living consumption on economic development was small at that time. The main residents’ living consumption market was concentrated in Chengguan District. For Lhasa, the most important way of economic development at that time was brought about by government investment, central financial transfers, and counterpart aid provinces. From the classification of economic development driving factors, all three major categories of factors have shown positive growth in the last 10 years. Among them, the residential life factor has shown the improvement in economic impact, followed by the financial economy, with the smallest change in the industry share. In 2015, influenced by the policy guidance, industrial park development, and population flow, the living indicators of residents in Dazi District and Duilongdeqing District increased rapidly, especially the growth of retail sales of social consumer goods, which made the overall living indicators close to the level of Chengguan District, but the financial and economic input still occupied the leading edge and was always the leading force driving economic development. In 2020, the resident life category will improve by 63.5% compared to five years ago, which is basically the same as the financial indicators, and become the two major drivers for local economic development. Chengguan District still maintains fast growth, while Dazi District and Dulongdeqing District’s growth rates have slowed down. Except for Chengguan District, the development gap between districts and counties is slowly narrowing (
Figure 4).
In 2010, the overall strength of Lhasa’s regional economy was weak. The areas with higher levels of economic development overlapped with major transportation routes and formed certain agglomeration areas along Qinghai–Tibet Railway, Lhasa River basin, and Yarlung Tsangpo River basin, but the degree of agglomeration was weak. The areas with the highest comprehensive economic strength are Gongdeling Street in Chengguan District, Dongga Street, and Naiqiong Street in Dulong Deqing District, located in the valley outside the core urban area of Lhasa, with convenient rail and road access. The areas with weak economic strength are concentrated in Linzhou County, which is widely distributed in the mountains, and around Riduo Township of Mozhugongka County and Karu Township of Nimu County, which are located on the edge of Lhasa. The core urban area’s rough terrain, inconvenient transportation, and weak driving role are the main reasons for the lagging economic development.
In 2015, the economic development zone along the Yajiang River and the surrounding economic development zone with Lhasa as the core became the core driving force of Lhasa’s economic development. The Dongga and Naiqiong streets in Dulong Deqing District and the town of Deqing in Dazi County have surpassed the districts and counties in the Chengguan District regarding economic development level index, initially forming two core circles of economic growth located in the west and southeast of Lhasa City. In the past five years, the overall strength of Lhasa City has improved. Among them, the fastest development is Dazi County, with the average economic development level of the county index growth rate of 165%. The ten economically least developed districts and counties also have more than a 35% growth rate, and the battle against poverty is beginning to see results. However, the economic development level of Gongdelin Street, Zhaxi Street, Najin Street, Liangdao Street, and Gamagongsang Street in Chengguan District has decreased slightly. Population, resources, and other factors flow to the surrounding areas, and an economic siphon effect has begun to take shape.
In 2020, the economic development gap in Lhasa widened, and Brahmaputra became the core economic zone, thanks to the industrial transfer and the construction of industrial parks. The core towns of Duilongdeqing District, Dazi County, and Qushui County occupied the absolute strength in the level of economic development, forming a “strong periphery and weak core” economic development pattern with Chengguan District as the core. With the emergence of the Brahmaputra urban belt, the siphoning effect on the surrounding towns and villages is becoming more and more obvious, and Dangxiong County and Linzhou County, north of Chengguan District, are driven by the weakest economic development of urban areas, becoming the main population and resource outflow areas, injecting vitality into the development of towns and industries around Lhasa River (
Figure 5).
5.3. Coupling Coordination Relationship Variance Analysis
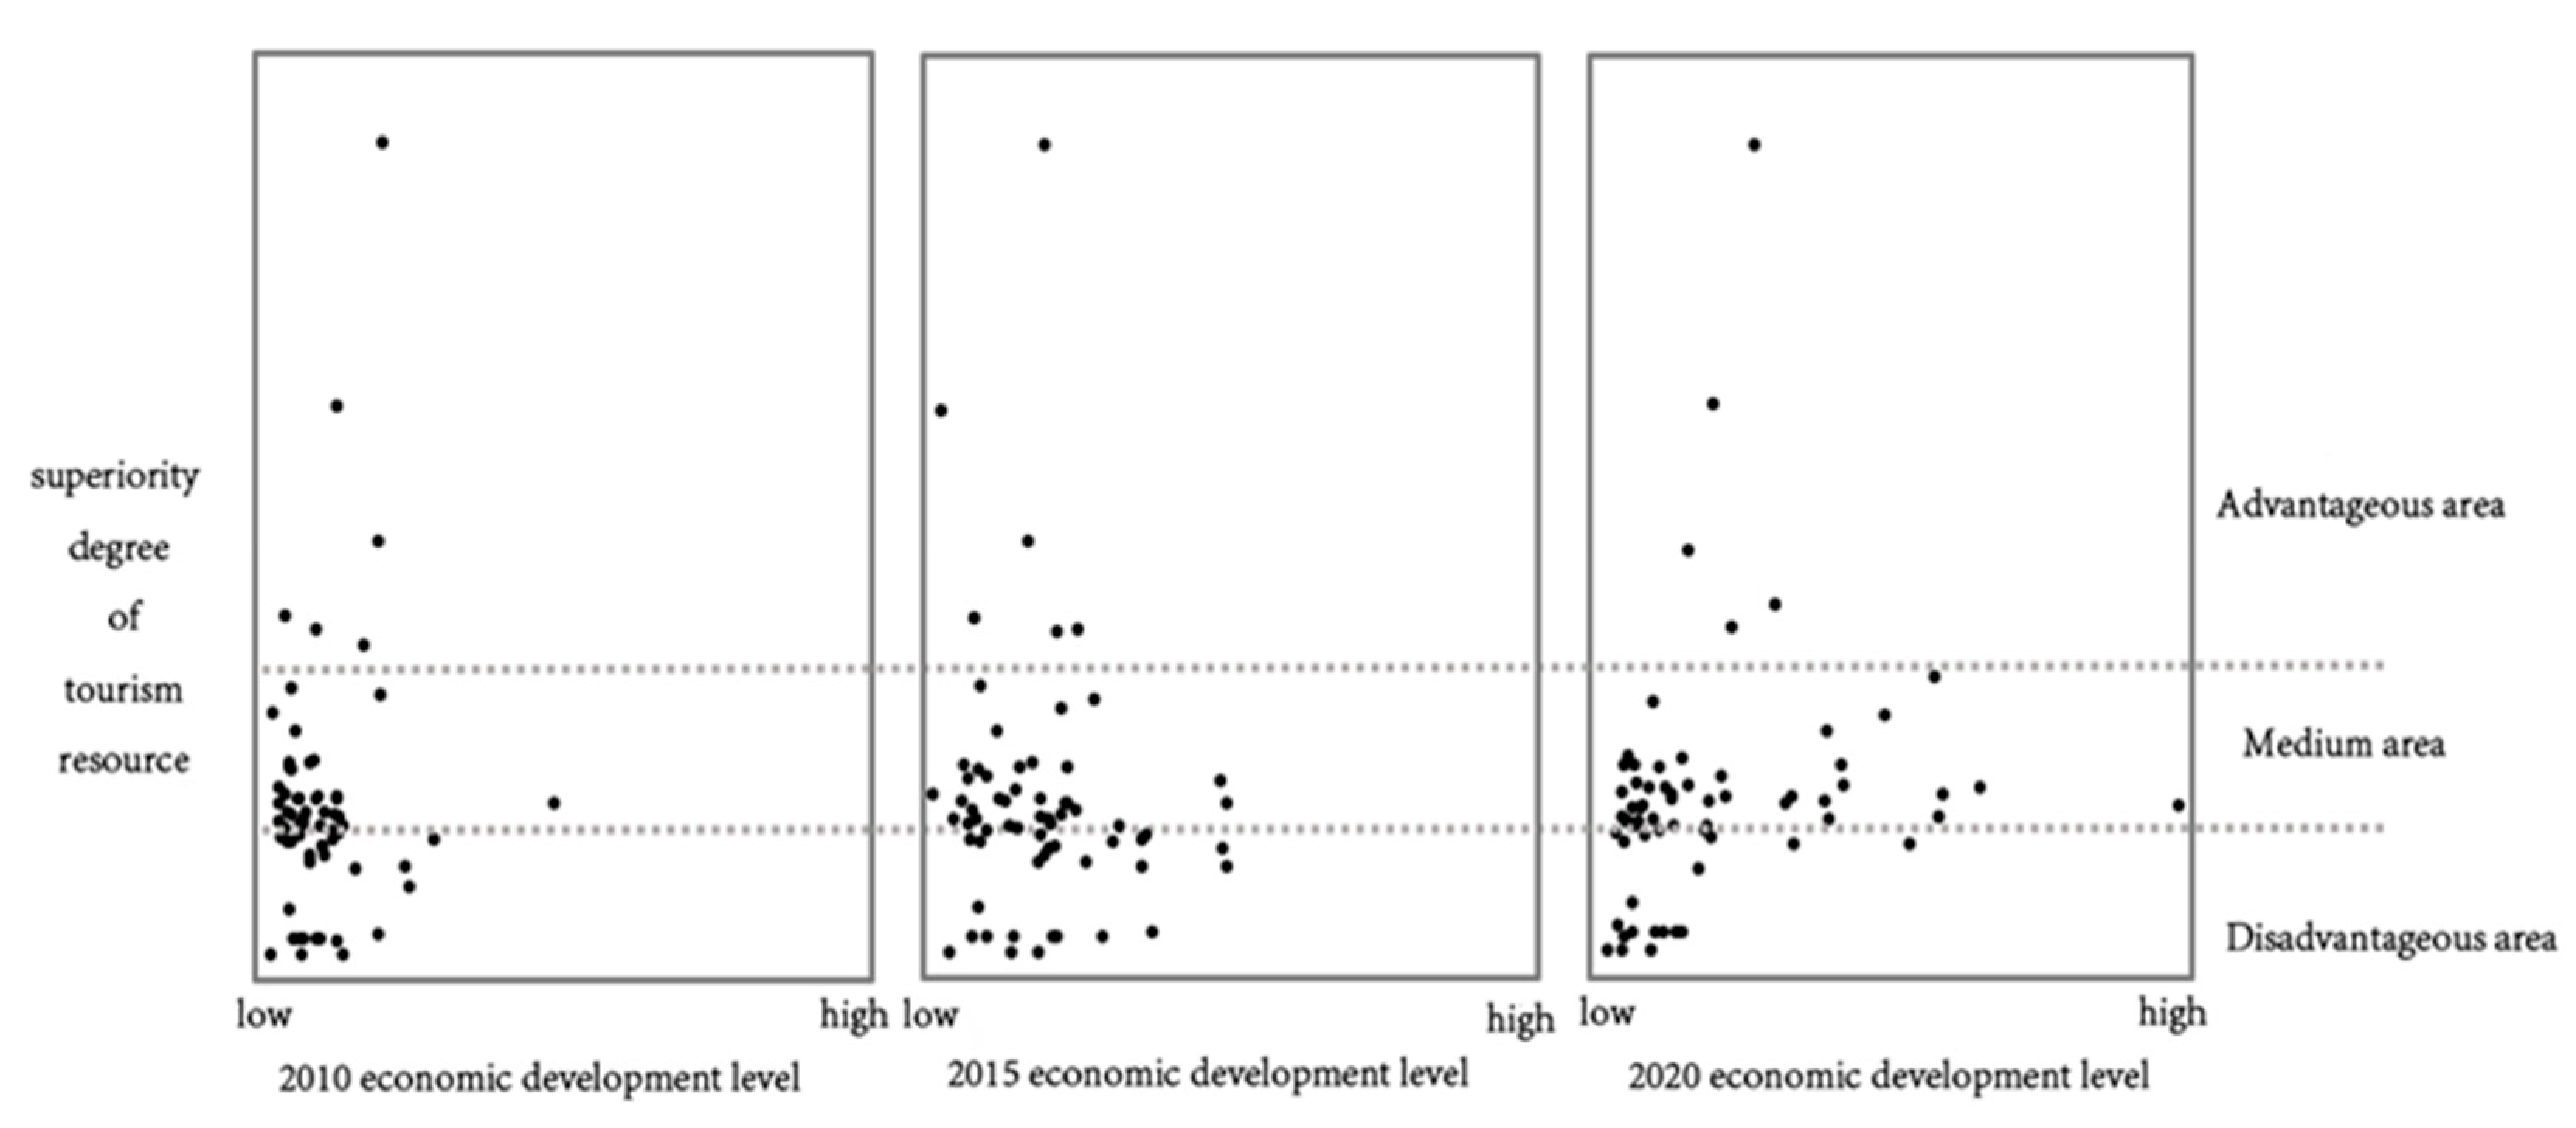
5.3.1. Analysis of Spatial Differences in Tourism Economic Levels
Spatial differences in economic growth often lead to changes in the spatial pattern of tourism development levels. The scatter plot is obtained by using the advantages of tourism resources and data on the economic development level in each of the three years studied (
Figure 6).
From 2010 to 2015, the economic development level of the streets in Chengguan District with rich tourism resources has not significantly improved, but the economic development of the middle and inferior areas of tourism resources has grown faster.
In the past five years, the overall strength of Lhasa City has improved. Among them, the fastest development is Dazi County, with the average economic development level of the county index growth rate of 165%. The ten economically least developed districts and counties also have more than a 35% growth rate, and the battle against poverty is beginning to see results.
From 2015 to 2020, the economic development of the relevant towns in the medium-sized tourism resources area has taken advantage and the lead, especially Dongga Street in the Duilongdeqing District. The economic development growth rate is far greater than that of other areas. Meanwhile, the attraction of the core towns to the surrounding towns has been continuously amplified, and there has been a one-way flow of population and resources. The level of economic development has further widened; the strongest and the weakest are becoming weaker. The role of resources in economic development during these five years has begun to emerge. Tourism resources advantageous areas, and the economic siphon effect always maintain an economic growth trend, showing that tourism resources play a role in the economic development of more stable and lasting vitality. On the contrary, the tourism resource disadvantaged areas, after experiencing the first five years of economic growth under the influence of industrial investment, the last five years of financial resources by the core town blood, coupled with the absence of quality tourism resources to support itself, gradually fell into the “poverty trap”.
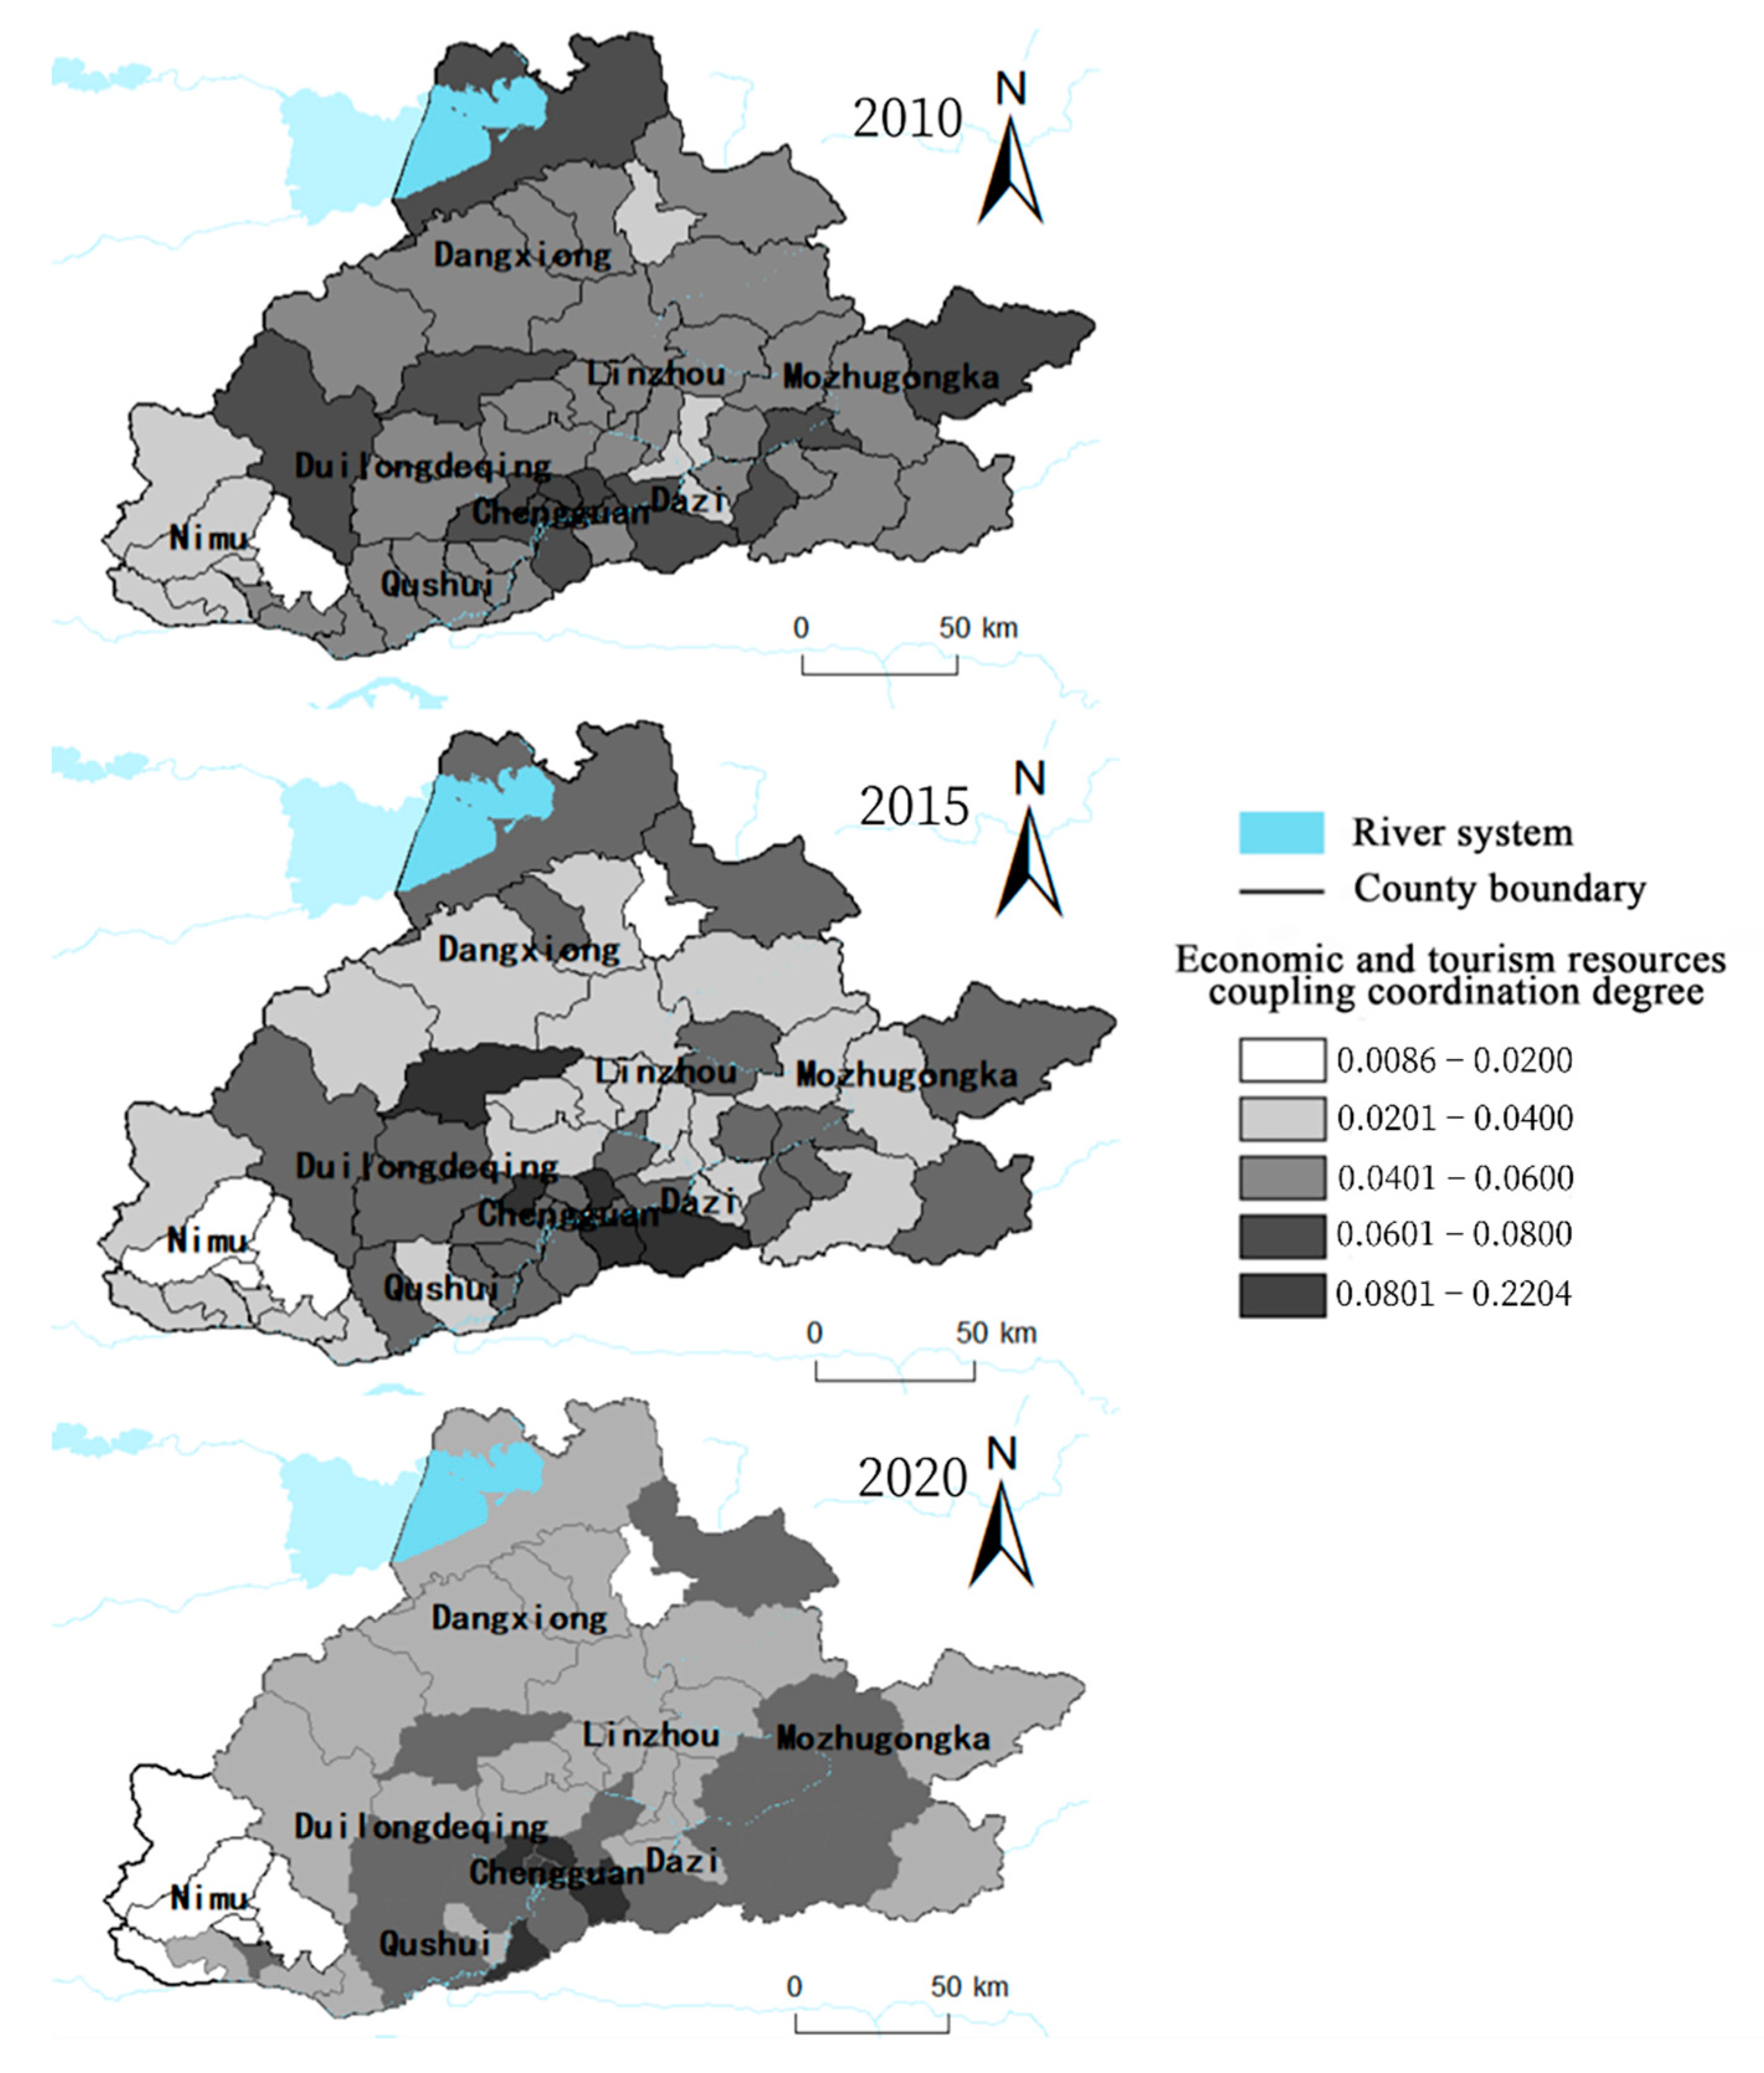
5.3.2. Evolution of Coupled Coordination Relationships
From the region’s perspective, the coupling coordination relationship between economic development and the superiority degree of tourism resources is low, mainly at the medium-low coupling coordination. The coupling coordination degree gradually deteriorates with time (
Figure 7).
In 2010, among the 65 township streets in Lhasa, six streets in the urban area of Chengguan District (Jiri Street, Bakuo Street, Duodi Street, Jibengang Street, Gongdelin Street, and Niangre Street) were in the highly coupled coordination area. In Qushui County, Duilongdeqing District is a representative of the 49 township streets for moderate coupling coordination area. Only 10 townships and streets, mainly in Nimu County, are in the low coupling coordination stage. In 2015, only Jiri Street in Chengguan District remained in the highly coupled coordination area, and there were 35 township streets in the moderately coupled coordination area and 29 township streets in the low coupled coordination area, represented by Nimu County and Linzhou County. In 2020, the highly coupled coordination area is still only Jiri Street in Chengguan District, a total of 32 township streets in the moderately coupled coordination area, and an increase in the number of low coupled coordination township streets to 32, which is the same as the number of moderately coupled coordination areas.
The most important reason for the decrease in coupling coordination is the change in the economic development level. Due to the economic development of tourism, the tourism industry in other neighboring cities is gradually rising and becoming more attractive to tourists. The industrial economic development of Lhasa City relies more on the service industry, such as secondary industry and finance. The tourism industry’s positioning has gradually changed from a tourist destination to a tourist transit reception. Most of the out-of-town tourists to Tibet are to gather in Lhasa and then go to Nyingchi, Shigatse, Ngari, and other places. The attractiveness of the surrounding districts and counties in Lhasa to tourists gradually decreases, forming an obvious trend of higher coupling with the center of Chengguan District.
7. Conclusions
There is a correlation between tourism resources and economic development in Lhasa, but there is an obvious spatial mismatch between promoting tourism resources and improving economic development strength. Among them, the core street of Chengguan District, which belongs to the tourism resource-rich area, is under the pressure of urban planning and cultural relics protection, and it is difficult to rely on investment to drive economic growth. There is a “resource curse” phenomenon that is rich in resources but hinders economic development. However, with the further development of the economy, the investment-driven situation has gradually weakened, and the advantages of tourism resources have gradually exerted their advantages in promoting economic growth. In contrast, in the disadvantaged areas of tourism resources, the economy continues to send population and resources to the core towns, and the tourism resources lack sufficient advantages to attract talent and capital return and gradually fall into the “poverty trap”. Therefore, according to the coupling of economic development level and tourism resource superiority degree, it can be divided into the following four types:
(1) High-high coupling coordination type: Chengguan District, as the center of Lhasa City, has a fast economic growth rate, with the output value of the three industries accounting for more than 70% of the total output value of the district in 2020. However, the potential of tourism resources is basically explored, and there is less space for traffic optimization and quality enhancement. Jiri Street, by exploring the development potential of a large number of high-quality cultural preservation units in Bakuo Street, improving the level of cultural preservation, renovating traditional buildings, developing special restaurants, building high-quality hotels, and focusing on promoting the development of commerce and shopping driven by tourism. It is always in a highly coupled and coordinated state, the only truly high-coupled type, and the area within Lhasa where tourism development and economic growth promote each other most prominently. However, the economic development speed of Bakuo Street, Duodi Street, Jibenggang Street, Gongdelin Street, Niangre Street, and other streets in Chengguan District far exceeds the speed of upgrading the level of tourism resources, and its coupling coordination degree is decreasing year by year.
(2) Low-high coupling coordination type: Duilongdeqing District, Dazi District, and Qushui County are close to Chengguan District. In recent years, through undertaking industrial transfer and developing industrial parks to realize industrial clusters, economic development has achieved breakthroughs. However, the lack of tourism resources leads to a low level of regional coupling coordination. In order to make up for the shortcomings, Dongga Street in Duilongdeqing District relies on the industrial park to build characteristic industrial sightseeing parks such as Tibet Zangcaoyisheng biotechnology park, Tibet Ganlu Tibetan medicine industrial park, and Tibet Wahaha food industrial park scenic spot. Naiqiong Street in Duilongdeqing District builds folk parks and resorts through investment promotion and capital introduction. Deqing Town in Dazi District and Caina Township in Qushui County also use the investment driven by economic development to compensate for the lack of resources by constructing parks, industrial parks, and resorts. In the short term, the gap between economic and tourism resources in these regions is indeed widening, but in the long term, if these emerging tourism resource sites can continue to develop, thereby attracting enough out-of-town tourists or becoming a peripheral tour destination for local tourists, there is a certain potential to grow into a highly coupled coordination area. However, the economic growth of these regions does not directly depend on the ticket income brought by tourists, and to a large extent, it is indirectly involved in the tourism link through product sales. It is difficult for the tourism resources of industrial parks to attract the attention of foreign tourists, so it is worthwhile to focus on the advantages of product production and carefully consider the investment in tourism resource sites.
(3) High-low coupling coordination type: Mozhugongka County and Dangxiong County have unique advantages in tourism resources, while important transportation hubs pass through (Dangxiong County has the Beijing–Tibet Expressway, Qinghai–Tibet Highway, and Qinghai–Tibet Railway running through it, which is an important hub connecting Lhasa City with Qinghai, and other surrounding areas. Mozhugongka County has the Lalin Highway passing through and is the central traffic node from Lhasa to Nyingchi, which allows the advantages of local tourism resources to be maintained at a high level. However, the development of the local tourism economy has not absorbed enough population employment, even because of the need for ecological protection. Since 2015, a large number of buildings located in the ecological protection zone for scenic reception, catering, and other tasks have been demolished. The return of tourism resources points to the natural ecology and also makes villagers lose the opportunity to make a living through tourism, which further leads to the loss of population, which leads to the mismatch between the level of economic development and the degree of tourism resource superiority. At the same time, the supporting facilities of the main towns outside the protected areas of tourism resource sites are backward, and the experience of catering and accommodation lacks characteristics to attract tourists for further consumption. The main urban areas of Dangxiong County and Mozhugongka County lack attractive characteristic tourism resource sites, resulting in tourists heading straight to the main tourism destination. The time of spending in the city is short, and the tourist attraction and the quality of service in the city should be increased.
(4) Low-low coupling coordination type: The coupling coordination degree of Nimu County and Linzhou County is relatively low. Both are located at the end of traffic nodes, without the series of traffic trunk lines, lacking the advantages of tourism resources, and are the main outflow areas of population resources, but their situations are different. The types and quantities of tourism resources in Nimu County are relatively small, lacking core tourism attractions. The surrounding counties have solid economic strength, making Nimu County a blank area of tourism resources and an export area with population and resources. Linzhou County is relatively rich in tourism resources, especially in the southern river valley area. A total of 37 Tibetan Buddhist ancient temple clusters have formed a strong religious atmosphere, but still a lack of core tourist attractions, and many famous temples in Chengguan District cannot compete. At this stage, Linzhou County is relying on the natural environment advantages of Rezhen National Forest Park and Black-necked Crane Nature Reserve to build ecological resorts, attract health care and vacation tourists, and play the advantages of rural tourism resources through the construction of ancient villages. However, the resource level and brand advantages are insignificant, and there is still a long way to go to promote economic growth through tourism development.
In view of the four coupling coordination relationships between tourism resources and economic development in Lhasa, suggestions for improvement are put forward respectively:
(1) For the high-high coupling coordination of the Chengguan District, the potential of tourism resources obtained by relying on upgrading the level of tourism resource sites and the level of cultural relic protection units has been basically developed. Therefore, the most important thing is to use the existing resources, explore distinctive cultures, cultivate diversified emerging types of tourism, and revitalize a large number of ancient buildings on Bakuo Street. Based on cultural relics protection, characteristic tourism resources such as cultural space, distinctive museums, and tourism shooting bases are derived from injecting new vitality into cultural relics protection.
(2) For the low-high coupling coordination of Duilongdeqing District, Qushui County, and Dazi County, the regional tourism resources are relatively scarce. However, with the development of industrial parks, the economic strength has been fully enhanced. At this stage, relying on industrial parks to create industrial tourism is a feasible idea. However, relying on the product lines of enterprises (especially those lacking plateau characteristics such as Wahaha) and the graphic introduction collage of the exhibition hall is hardly attractive to foreign visitors coming from far away, and the multi-point approach is difficult to form a unique brand influence. It is better to use the advantages of regional transportation to attract the transit passengers brought by the Lalin Expressway and the G318, focusing on building a Tibetan special industrial and craft tourism products exhibition and sales park near the transportation artery, inviting national crafts masters to settle in. The construction of official sales channels integrating handicraft experience, cultural inculcation, and merchandise sales so that Tibetan carpets, serge, Tibetan knives, and other handicrafts with excellent quality and affordable prices become the souvenirs that tourists have to buy when they travel to Tibet.
(3) For the high-low coupling coordination of Mozhugongka County and Dangxiong County, as an important traffic transit node, there are Namtso, Sijinla Tso, and other high-quality tourism resources for attraction, its tourism resources superiority degree in the upper middle level. However, due to the requirements of ecological protection, it is difficult for local residents to carry out tourism economic services around scenic spots. Although sitting on the green mountains, they have not been able to convert into gold and silver mountains in the hands of ordinary people. The income from high tickets not only fails to provide sufficient economic support for regional development but also reduces the travel experience of tourists. Therefore, the local tourism resource sites should focus on the development of tourism-supporting services, encouraging local residents to participate in tourism services, cultivating local tourism elites, and making tourism income from a “one-time sale” into a long-term benefit.
(4) For the low-low coupling coordination of Linzhou County and Nimu County, the two are different. Among them, the tourism resources of Linzhou County, especially the cultural temple tourism resources and forest and nature reserve resources, are obviously abundant, but there is a lack of main traffic lines in the region. The rugged mountainous terrain makes Linzhou County located in the central part of Lhasa, but it is a traffic terminal, which further leads to the reduction in the advantages of tourism resources. Therefore, by opening up the traffic of key nodes, the Chengguan District and the Namtso Township of Dangxiong County are connected in series, focusing on natural wild interests and building high-quality health resorts. The future development of the tourism industry in Linzhou County has great development potential. Nimu County is dominated by mountains, forests, and valleys, with inconvenient transportation, scarce resources, a lack of tourist attractions, and weak environmental carrying capacity. It will be an effective development direction to divide it into a nature reserve or set up a national park with the Tanggula Range in Dangxiong County.


 ,
, 


