Article

Land Use Structure Optimization and Ecological Benefit Evaluation in Chengdu-Chongqing Urban Agglomeration Based on Carbon Neutrality

1
Institute of Mountain Hazards and Environment, Chinese Academy of Sciences and Ministry of Water Resources, Chengdu 610041, China
2
University of Chinese Academy of Sciences, Beijing 100049, China
3
College of Management, Sichuan Agricultural University, Chengdu 611130, China
4
Sichuan Center for Rural Development Research, College of Management, Sichuan Agricultural University, Chengdu 611130, China
*
Authors to whom correspondence should be addressed.
Land 2023, 12(5), 1016; https://doi.org/10.3390/land12051016
Submission received: 3 April 2023 / Revised: 2 May 2023 / Accepted: 3 May 2023 / Published: 5 May 2023

Abstract

:
Optimizing land use structure in urban agglomerations is essential to mitigating climate change and achieving carbon neutrality. However, the studies on low-carbon (LC) land use in the urban agglomeration based on carbon neutrality are still limited and lack the consideration of the optimized land ecological benefits. To reduce land use carbon emissions (LUCEs) and improve the ecological benefits of urban agglomerations, we constructed the framework of land use structure optimization (LUSO) under carbon neutrality. Then, in view of land use quantity structure and spatial distribution, we compared the results of LUCEs and the ecological benefits of the Chengdu–Chongqing urban agglomeration (the CCUA) in 2030 under different scenarios. The results showed that in 2030, the LUCEs of the CCUA is 3481.6632 × 104 t under the carbon neutral scenario (CN_Scenario), which is significantly lower than the baseline scenario (BL_Scenario) and 2020. In the CN_Scenario, the land use/cover change (LUCC) in the CCUA is more moderate, the aggregation degree of the forestland (FL), grassland (GL), wetland (WL), and water (WTR) patch area deepens, and the overall landscape spreading degree is increased, which is more conducive to play the ecological benefit of carbon sink land. The results can provide a reference for the more efficient use of land resource areas and the formulation of land use and spatial planning.

1. Introduction

Human activity is the leading cause of the increase in atmospheric carbon dioxide concentration and global warming [1,2]. The 2016 Paris Agreement calls for the world to reach a peak in greenhouse gas emissions as soon as possible, keep the global average temperature rise below 2 °C over pre-industrial times, and pursue efforts to limit the temperature increase to 1.5 °C [3,4]. Therefore, the international community has been actively discussing scientific measures to reduce emissions and control temperature. More than 130 countries or regions have put forward the target of carbon peaking and carbon neutrality. Promoting cities to achieve carbon peaking and carbon neutrality has become the key to mitigating climate change [5]. Achieving the target of urban carbon neutrality is inseparable from adjusting human activities such as economic construction, industrial distribution, urban expansion, and energy consumption. However, these activities are closely related to land use and will ultimately be implemented in different land use modes [6,7]. In 2006, the IPCC made it clear in its assessment report that regional carbon emissions could be effectively reduced by adjusting the structure of land use types [8]. In 2021, China also clearly proposed to continuously improve the land carbon sink capacity through territorial space planning, which indicates that achieving the urban carbon neutrality development goal from the land use perspective has become a hot topic of study. Meanwhile, an urban agglomeration, as a cluster organization formed in the mature stage of urban development [9], is of great significance to the country’s economic growth and carbon emission reduction. If urban agglomeration continues in the traditional development mode as in the past, it will bring many environmental risks [10]. For instance, the disorderly expansion of urban agglomerations has caused a large amount of energy consumption and carbon emissions, aggravated the greenhouse effect, and then caused glacier melting, sea level rise, frequent drought and flood disasters, and other serious problems, threatening the sustainable development of mankind [11]. How to solve the contradictions caused by the unreasonable land use structure of urban agglomeration and achieving the target of carbon neutrality is a problem that every country must face in development.
Previous studies have shown that scholars from different countries have used different terms to describe “urban agglomeration” at different stages of socioeconomic and human development. For instance, in the United Kingdom, “conurbation” is used. In the United States, it is called a “megalopolis” or “metropolitan area”. Similarly, in Australia, “urban centre” or “urban area” are used, and in Canada, terms such as “census metropolitan area” or “metropolitan region” are used [12]. “Urban agglomeration” is the official expression of China, and the United Nations Statistical Manual defines the term “urban agglomeration” in dense urban areas as follows: as comprising the city or town proper and also the suburban fringe or thickly settled territory lying outside, but adjacent to, its boundaries [13]. It is especially pointed out that urban agglomerations are different from administrative districts. Urban agglomerations may include several cities or towns and their peripheral areas. The expression clearly states that this area should include the central urban area of a city or town, the suburban fringe, or the immediate periphery. To sum up, despite the differences in terms of “urban agglomeration”, “conurbation”, “megalopolis”, “urban centre”, or “metropolitan region”, they all mean the same thing. In China, an urban agglomeration is the primary responsibility of the carbon neutrality goal. At present, there are a total of 19 urban agglomerations planned in China. Among these, the Yangtze River Delta (YRD), Pearl River Delta (PRD), Beijing–Tianjin–Hebei (BTH), the middle reaches of the Yangtze River (MRYR), and Chengdu–Chongqing urban agglomerations (the CCUA) are the five with the most vital comprehensive strength [14]. The five major urban agglomerations cover eastern China (YRD, PRD, and BTH), central China (MRYR), and western China (the CCUA), which are typical of China’s urban agglomerations. However, there are huge differences between the CCUA and other urban agglomerations: (1) The e urbanization level is low, and the internal development of the city is unbalanced. In 2020, the urbanization rate of the CCUA was only 62.4%, which was significantly lower than the other four urban agglomerations (81.1% in the PRD, 76.2% in the YRD, 68.2% in the BTH, and 63.6% in MRYR). In addition, the GDP of Chengdu and Chongqing, which only account for 31.30% of the area of the CCUA, accounts for 62.61% of the total GDP of the CCUA, showing unbalanced development within cities. (2) The intensity of territorial space development is low, and the ecological environment is complex and fragile. In 2016, the land development intensity of the YRD, PRD, and BTH was about 25%, the MRYR was about 11%, while the CCUA was only 9%, and the overall development intensity was low. In addition, the CCUA is located in an essential ecological security-guaranteed region of the upper reaches of the Yangtze River (URYR), which is greatly affected by human activities. Natural disasters such as earthquakes, debris flow, and soil erosion occur frequently, and the ecological environment carrying capacity is fragile. (3) There is a low level of economic development but rapid growth. In terms of total GDP, the total GDP of the CCUA was 6.64 trillion Yuan in 2020, which was 32.38%, 65.16%, 76.97%, and 70.69% that of the YRD, PRD, BTH, and the MRYR, respectively, ranking the last among the five major urban agglomerations. However, in terms of economic development speed, the CCUA had the second-highest annual GDP growth among the five urban agglomerations in the past two years (second to the MRYR), which is at the stage of rapid development. In conclusion, compared with the other four agglomerations, the CCUA still has some problems, such as a lower level of urbanization development, unbalanced internal urban development, lower intensity of territorial space development, complex and fragile ecological environment, and weak economic development strength. However, at the same time, the CCUA is also the most densely populated region with the most robust industrial foundation in the west of China. In 2021, the Chinese government promulgated the Planning Outline for the Construction of Chengdu–Chongqing Twin City Economic Circle (2021–2035), which further clarified that the CCUA would be built into an important economic center with national influence. In this context, in the next 15 years, the CCUA will experience a round of rapid urban expansion and land use structure change, often accompanied by the high-intensity use of land resources and the destruction of the environment. For one thing, traditional resource-based industries and heavy and chemical industries such as thermal power, iron and steel, chemical industry, and building materials account for a large proportion of the CCUA, which is facing significant challenges in achieving carbon neutrality. For another, the CCUA is also an important region for the ecological security of the URYR, and its land use structure change is closely related to the resource consumption and ecological environment of the URYR. Therefore, selecting the CCUA as the study area can provide suggestions for the urban regions with weak innate economic foundations and high sensitivity to the ecological environment but with excellent development speed and potential.
Although the study of land use structure optimization (LUSO) under low-carbon (LC) scenarios has become a hot topic [15,16], there are still shortcomings. From the theoretical perspective, the previous study of LUSO in the LC scenarios was mainly focused on reducing regional land use carbon emissions (LUCEs) and improving carbon sink and carbon sequestration efficiency, but lacked consideration of the economic and social benefits of land use. Or economic, social, and ecological benefits are comprehensively considered but lack theoretical explanation [17]. Additionally, with carbon neutrality, a single LC target must also be improved. From the perspective of the research scale, the current research scale of LUSO based on future carbon emission and LC scenarios is mainly concentrated in the national, provincial, and municipal areas [18]. However, the research on the LC land use of urban agglomerations from the perspective of carbon neutrality is still weak, especially the study of the CCUA, which is in western China. From the model’s perspective, many models based on the Cellular automata (CA) are mostly adopted by researchers to predict future land use/cover change (LUCC), such as the Logistic-CA model [19,20], CLUE-S model [21,22], FLUS model [23,24], etc. Although these models are widely used in the delineation of ecological red lines, geomorphic evolution analysis, and territorial space optimization, they are weak in large-scale and multi-land class comprehensive simulations and cannot simulate the detailed patch evolution of multiple land use types [25,26]. Based on the shortcomings of the above models, Liang et al. [27] proposed a patch-generating land use simulation (PLUS) model in 2020. Introducing the land expansion analysis strategy (LEAS) and CA based on muti-type random patch seeds (CARS) effectively solves the above problem [28]. At the same time, the PLUS model also has the advantages of high simulation accuracy and fast data processing and has been used by many scholars in the future study of LUSO [29,30,31]. Finally, although theories, models, methods, and research fields of LUSO based on LC scenarios are constantly enriched and improved, from the perspective of simulation evaluation, ecological benefit consideration after LUSO is still lacking [32]. Ecological benefit consideration of land use has become an essential part of the research on the optimal allocation of land resources [33,34], which can more objectively evaluate the possible ecological benefits of land use distribution under different scenarios from the spatial perspective. The landscape pattern index (LPI) can reflect the degree of fragmentation of the study region and better reveal the study region’s ecological status and spatial variability [35]. Moreover, the changes in land use and landscape pattern are manifested as connectivity and correlation to a certain extent [36], and their mutual influence makes the land use landscape pattern became an important index to evaluate the land use ecological benefits. In urban agglomeration, as the product of the advanced stage of urban industrialization, the continuous expansion of urban boundaries leads to unreasonable land use, and the contradiction between behavior and ecological system environmental protection becomes more prominent, resulting in more complex and special ecological problems [37]. Thus, considering ecological benefits under the LUSO in urban agglomerations can better coordinate the contradiction between social, economic development, and ecological environment.
Considering current research status and limitations, this study takes the CCUA as an example and tries to construct the LUSO framework under the carbon neutral scenario (CN_Scenario) by combining theories of the optimal allocation of land, sustainable development, and LC economy. Then, in the view of land use quantity structure and spatial distribution, simulated and compared the results of LUCEs and ecological benefits of the CCUA in 2030 under the CN_Scenario and baseline scenario (BL_Scenario). The main contributions of this study include the following: (1) Theoretical elaboration: combining theories of land optimal allocation, sustainable development, and LC economy, we constructed the framework of LUSO under carbon neutrality and carried out a more precise and comprehensive theoretical elaboration. (2) Research scale: taking the CCUA as the research object, which can provide a reference for LUSO in urban regions with weak innate economic foundations and high ecological environmental sensitivity, but with excellent development speed and potential. (3) Model use: the multi-objective linear programming (MOLP) model and PLUS model are adopted to realize the dual optimization simulation of the quantitative structure and spatial distribution of land use in the future, which is a good attempt combination in the use of LUSO methods. (4) Simulation evaluation: the LPI is used to evaluate the ecological benefits generated by simulated future land use spatial distribution, which can more objectively evaluate the optimization effect of land use structure under different scenarios.

2. Theoretical Framework

China has pledged to achieve carbon neutrality by 2060. This is not only an inevitable choice for China to address climate change but also an inevitable requirement for promoting social and economic transformation and development. The concept of carbon neutrality involves balancing carbon emissions and absorption. That is, to achieve carbon neutrality, on the one hand, anthropogenic carbon emissions should be reduced from the perspective of “source”, and on the other hand, the carbon sequestration capacity of different ecosystems should be enhanced from the perspective of “sink” [38,39]. In the meantime, LUCC is a vital factor causing carbon emissions, and the LUSO can change the land use carbon source/sink pattern and promote harmonious economic and social development among regions. The LUSO is shown as the adjustment of the internal structure of land resources, namely the transformation between different types of land resources [40]. Its realization means the following: (1) The adjustment of the quantity structure of land resources, that is, the adjustment of the proportion of all types of land. (2) Adjustment of the spatial distribution structure of land resources; that is, different types of land are allocated to specific locations according to regional land suitability [41]. The core of LUSO is transformation, but this transformation is not arbitrary and needs to be carried out under a particular range and conditions.
To achieve the carbon neutrality target, the research of LUSO models based on theories of sustainable development and the LC economy has gradually become a social focus. The idea of sustainable development refers to development that meets the needs of the present without compromising the ability of future generations to meet their own needs [42]. As a series of documents, such as Agenda 21 and the UNFCCC, have been recognized globally, the concept of sustainable development has gradually been regarded by most countries as an essential indicator for measuring social and economic development [43]. The specific content of sustainable development mainly involves realizing the coordination and unity of a sustainable economy, ecology, and society. That is, it requires more human focus on economic efficiency, ecological harmony, and the pursuit of social equity in development. Meanwhile, an LC economy is a new economic development model proposed to cope with climate change [44]; the basic concept is an “economy based on low energy consumption and low pollution. That is, during economic development, theories of sustainable development, technology, and system innovation can be used to reduce energy consumption and pollutant emission to finally realize the coordinated development of economic, social, and ecological benefits [45]. With the explicit goal of achieving carbon neutrality in 2060, land, as an essential carrier of human economic construction, industrial distribution, and energy consumption, is becoming increasingly urgent to reduce LUCEs and increase carbon sink capacity by adjusting land use structure. Therefore, the LUSO, under the guidance of an LC economy, has been paid more and more attention. The LC economy under the guise of the LUSO goal mainly includes two aspects: (1) Increasing the amount of land carbon sink, mainly manifested in increasing the carbon sink function of land and forming an LC land-use structure; implementation of specific measures has increased the area of forestland (FL), wetland (WL), and grassland (GL), improving the surface vegetation coverage and strengthening the ecological restoration of the environment. (2) To achieve land carbon emission reduction, mainly reflected in reducing energy consumption and carbon emission intensity of land use; the specific measures to achieve this include controlling urban expansion scale and changing extensive land use mode, adjusting the industrial structure and developing ecological industries with low energy consumption and high output, and realizing intensive land development and improving the input efficiency of various elements of land per unit area. Finally, the goal of carbon neutrality in land use is realized not only from the perspective of reducing regional land carbon emission intensity, but it is also essential to balance the relationship among land economic, social, and ecological benefits (Figure 1).

3. Materials and Methods

3.1. Study Area

The CCUA is centered on Chengdu and Chongqing city, covering 15 cities in Sichuan Province and 27 districts and counties in Chongqing, with a total area of 186,728.6142 km2 (Figure 2). The territory of mountains, hills, and plains is spread, and topography is complex and diversified. The CCUA is not only the highest level of urbanization in western China, but also has 25 national natural protection areas, such as the Tangjiahe, Baishuihe, and Wanglang natural protection areas. These national natural protection areas play an important role in maintaining biodiversity, regulating climate and hydrology, and improving the ecological environment [46,47]. Therefore, the CCUA is also an essential protection area for ecological security in the URYR. However, the rapid urbanization process, the rapid expansion of STM, and unreasonable land use behavior have increased the ecological and environmental problems of the CCUA, such as soil erosion, air pollution, excessive greenhouse gas emissions, and so on. These problems make the CCUA ecosystem more fragile, threaten the ecological security of URYR and hinder the realization of the goal of carbon neutrality. Therefore, enhancing the ecological resilience of the CCUA through LUSO on the premise of achieving carbon neutrality is an urgent need to maintain the environmental security pattern in the URYR.

3.2. Data Sources

The primary data used in this study included the land use, energy, socioeconomic, and other data of the CCUA in 2000, 2010, and 2020. Among them, the land use data were obtained from GLOBELAND 30 global landcover database (http://www.globallandcover.com (accessed on 7 October 2022)), with a spatial resolution of 30 m, an overall data accuracy of 85.72%, and a Kappa coefficient of 0.82, which can meet the use requirements. The land use types in the study area were cropland (CL), FL, GL, shrubland, WL, water (WTR), artificial surface, glacier, and permanent snow. According to the land use classification in the General Land Use Planning of Sichuan and Chongqing, we reclassified the land use types into CL, FL (including FL and shrubland), GL, WL, WTR, settlement (STM, including artificial surface), and unused land (UL, including glacier and permanent snow). The energy data and socioeconomic data were obtained from the Sichuan statistical yearbook (http://tjj.sc.gov.cn/scstjj/c105855/nj.shtml (accessed on 7 October 2022)) and Chongqing statistical yearbook (http://tjj.cq.gov.cn/zwgk_233/tjnj/ (accessed on 7 October 2022) ). Other data, such as meteorological data, were obtained from the National Greenhouse Data Sharing Platform (http://data.sheshiyuanyi.com/ (accessed on 15 October 2022)). River data were obtained from HydroRIVERS (https://hydrosheds.org/page/overview (accessed on 15 October 2022)). The road network, urban and rural residential area data were obtained from OpenStreetMap (https://www.openstreetmap.org/ (accessed on 15 October 2022)). DEM data were obtained from Geospatial Data Cloud (https://www.gscloud.cn/ (accessed on 15 October 2022)).

3.3. Methods

The research methods in this paper include the following four aspects: (1) Calculation of LUCEs: based on the land use data, carbon emission coefficient (CEC), and energy data of the CCUA in 2000, 2010, and 2020, the direct and indirect carbon emission calculation methods of land use were used to calculate the LUCEs in the CCUA from 2000 to 2020. (2) Prediction of land use quantity structure under two scenarios: the MOLP model was used to predict the land use quantity structure of the CCUA under the CN_Scenario, and the Markov-Chain (MC) model was used to predict the same under the BL_Scenario in 2030. (3) Simulation of land use spatial distribution under two scenarios: the PLUS model was used to simulate the land use spatial distribution of the CCUA in 2030 under two scenarios. (4) LPI (including class level and landscape level) was used to evaluate the ecological benefits of the land use spatial distribution of the CCUA in 2030 under two scenarios.

3.3.1. LUCE Calculation Method

LUCE calculation methods can be divided into direct carbon emission (DCE) calculations and indirect carbon emission (ICE) calculations [48]. Among them, DCE from land use refers to the carbon emissions caused by direct land use by humans, which can be divided into two types: The carbon emissions caused by the shift of land management mode and the carbon emissions caused by the change in different land use types. ICE from land use refers to the emissions of anthropogenic carbon sources carried by land, mainly the carbon emission caused by energy consumption, including urban expansion, economic construction, energy consumption, and other human activities [49].
The DCE from land use in the CCUA mainly includes the carbon emission from CL, FL, GL, WL, WTR, and UL. Referring to previous studies [50,51], the formula is as follows:
E k = e i = T i δ i
where E k is the total amount of DCE; e i is the carbon emissions generated from different land use types; and T i refers to the area of the different land use types. δ i is the CEC of the different land use types. The CEC is combined with the actual situation, and the previous research results are referred to [52], as shown in Table 1.
ICE from land use mainly refers to the calculation of carbon emissions from the STM; that is, the carbon emissions from the STM are characterized by the amount of CO2 generated by energy consumption in production and life. The energy selected in this study includes raw coal, washed coal, coke, crude oil, gasoline, kerosene, diesel oil, natural gas, electric power, and heat. Referring to previous studies [50,51], the formula is as follows:
E t = E t i = E n i θ i γ i
where E t is the carbon emission of STM; E t i is the carbon emission generated by the consumption of energy i; E n i is the consumption of energy i; θ i refers to the amount of standard coal consumed in the conversion of the consumption of energy i; and γ i is the carbon emission conversion coefficient of the consumption of energy i. According to the existing studies on the conversion coefficient of coal and CEC, most of the differences are not significant. Therefore, this study mainly focuses on the conversion coefficient and CEC in the IPCC Guidelines for National Greenhouse Gas Inventory, and refers to relevant research results [52,53,54].
The sum of DCE and ICE from land use equals the total amount of LUCEs in the study area. The formula is as follows:
E = E k + E t
where E is the total amount of carbon emission from land use; E k is the DCE, which refers to the carbon emission of CL, FL, GL, WL, WTR, and UL; and E t is the ICE, which refers to the carbon emission of STM.

3.3.2. Scenario Definition

1.
CN_Scenario
The CN_Scenario involves the LUSO model combining theories of the optimal allocation of land, sustainable development, and LC economy, with social benefits as constraints, aiming at the lowest carbon emissions and the highest economic benefits from the land.
2.
BL_Scenario
The BL_Scenario involves the quantitative structure of land use in 2030 predicted by the Markov-Chain model based on the LUCC of the CCUA in 2000, 2010, and 2020. Since the prediction of the future land use quantity structure under the BL_Scenario is not the focus of this study, the specific methods are not described in detail.

3.3.3. Optimization of Land Use Quantity Structure under CN_Scenario

Considering data availability, this study sets up two objective functions and seven variables. The two objective functions are the lowest objective function of LUCEs, and the highest objective function of land use economic benefit. The seven variables are CL ( x 1 ), FL ( x 2 ), GL ( x 3 ), WL ( x 4 ), WTR ( x 5 ), STM ( x 6 ), and UL ( x 7 ). Due to the social benefit of land mainly referring to all segments of society’s demand level, including the construction land per capita, per capita arable land, urbanization level, and per capita green area, such as wide range, it is difficult to use to quantify the maximum or minimum objective function of a single. Additionally, social efficiency is mainly manifested in the relevant policy documents to limit or protect various land use types, so this study transforms social benefits into constraint conditions for processing.
1.
Prediction of future CEC of STM in the CCUA
Since the CEC of the STM changes dynamically every year, according to the CEC of the STM from 2000 to 2020, the GM (1, 1) model written by MATLAB predicts that the CEC of the STM in 2030 will be 7173 t/Km2.
2.
LUCE benefit function
This study reflects the optimization objective of this function by reflecting the minimization of the final LUCEs in the CCUA. According to the seven decision variables, the LUCE target function can be established by multiplying the CEC of STM in 2030 and the known CEC of different land use types by the area of corresponding land use types. The formula is as follows:
f 1 x = i = 1 7 σ i × L i m i n = 44.2 x 1 570.6 x 2 94.8 x 3 236.1 x 4 25.2 x 5 + 7173 x 6 0.5 x 7
where f 1 x m i n indicates that LUCE tends to be minimized. i denotes the land use type; σ i represents the CEC of the land use type i (t/Km2). L i represents the area of land use type i (Km2).
3.
Land use economic benefit function
In this study, we used the method of economic benefit coefficient (EBC) to measure the economic benefit of the land [55]. The EBC is calculated based on the total agricultural output value, total forestry output value, total animal husbandry output value, and total fishery output value of the research region published by the National Bureau of Statistics, as well as the output value of secondary and tertiary industries in the research region divided by the corresponding area of each land use type. Since the UL in the CCUA comprises bare land and glaciers, the EBC of UL is set as 0. In this study, the EBC of different land types of the CCUA from 2000 to 2020 was calculated by consulting the statistical yearbook, and then the GM (1,1) model was used to predict the EBC of different land use types in 2030. The formula is as follows:
f 2 x = i = 1 7 e i × L i m a x = 12,675,000 x 1 + 2,023,800 x 2 + 69,789,000 x 3 + 48,466,400 x 4 + 48,466,400 x 5 + 1,057,400,000 x 6
where f 2 x max indicates that the land use economic benefits tend to be maximized; i denotes land use type; e i represents the unit area GDP of the land use type i (Yuan/Km2); and L i represents the area of the land use type i (Km2).
4.
Setting constraints based on social benefits
The constraint indicators selected in this study generally reflect the social benefit requirements to achieve policy-based restrictions on the expansion of STM and to protect the number of ecological lands such as FL, WL, and CL. The constraints mainly come from the planning of urban construction, economic development, and environmental protection of the CCUA. With 2020 as the base year and 2030 as the target year, the specific settings are as follows: (1) Total land type area: total land area of all land types equal to the total land area of the CCUA, expressed as x 1 + x 2 + x 3 + x 4 + x 5 + x 6 + x 7 = 186,728.6142 (Km2). (2) CL area: to ensure the food security and social stability of the CCUA, the CL area should not be less than 97% of the base year by 2030, expressed as x 1 109,262.9846 (Km2). (3) FL area: the FL area of the CCUA in 2030 should not be set as the base value of 2020, expressed as x 2 51,245.2890 (Km2). (4) GL area: the GL area of the CCUA in 2030 should be no less than 95% of the base period value in 2020, expressed as x 3 11,894.2949 (Km2). (5) WL area: due to the high ecological service value of WL, the area of WL in 2030 will be equal to that in 2020, expressed as x 4 = 144.0513 (Km2). (6) WTR area: because the WTR area of the CCUA fluctuates significantly under the influence of precipitation, this study sets that the WTR area in 2030 will fluctuate by 10% in 2020, expressed as 2954.7518 x 5 3421.2915 (Km2). (7) STM area: To reasonably restrict the STM to coordinate the relationship between social and economic development and carbon emission reduction, the STM area in this study takes 2020 as the base period, referring to the research results of other scholars [56,57], and takes a 2.5% annual growth rate as the upper limit of the STM area of the CCUA in 2030, expressed as 7038.4266 x 6 9009.1860 (Km2). (8) UL area: due to the UL in the CCUA being composed of bare land and glaciers, considering the ecological restoration of bare land should be carried out vigorously, and the ecological environment of the glacier area should be well protected at the same time, so the UL area in 2030 should not be less than 85% of the area in 2020, expressed as 23.8167 x 7 28.0197 (Km2).
Finally, the evaluation function and constraints are programmed in the multi-objective genetic algorithm of MATLAB to solve the optimization model.

3.3.4. Optimization of Land Use Spatial Distribution under Different Scenarios

1.
The PLUS model driver factors
The driving forces of LUCC are generally divided into natural driving factors and socioeconomic driving factors [58]. Considering the data accessibility, spatial difference, correlation, and quantification, referring to previous studies [59,60], this study selects 12 driving factors from three aspects of natural factors, social factors, and economic factors (Table 2). After rasterization, the projection coordinate system (WGS_1984_UTM_zone_47N) is unified with land use data, and the spatial resolution of all raster images is unified as 100 m × 100 m.
2.
Parameter setting under different scenarios
In this study, the development probability of each land type in the CCUA was calculated using the PLUS model’s LEAS, and then combined with the target pixel number, transfer cost matrix, random patch seed probability, neighborhood factor, and other related parameters of future land use. The CARS was used to simulate the change in land types in the CCUA. Finally, we use the MC model to predict the demand for future landscape types. On the existing basis [61,62] and in combination with the situation of land type transfer in the study area, various parameters are repeatedly adjusted to determine the BL_Scenario of the CCUA in 2030 and the land type transfer cost matrix under carbon neutral CN_Scenario (Table 3). The probability of random patch seeds was set as 0.01 (parameter range 0–1; the closer it is to 1, the easier it is to produce new patches). The weight parameters of local neighborhood factors were set in the BL_Scenario and CN_Scenario as shown in Table 4 (parameter range 0–1; the closer it is to 1, the stronger the expansion ability of land types is).

3.3.5. Land Use Ecological Benefits Evaluation

This study selected the LPI from the two aspects (class level and landscape level) and used Fragstats 4.2 to consider the possible ecological effect of land use spatial distribution in the CCUA under two scenarios from 2020 to 2030. At the class level, four indices were selected: the number of patches (NP), largest patch index (LAPI), landscape shape index (LSI), and splitting index (SPLIT). Six indexes were selected to evaluate contagion (CONTAG), patch cohesion index (COHESION), Shannon’s evenness index (SHEI), Shannon’s diversity index (SHDI), interspersion Juxtaposition index (IJL), and aggregation index (AI) at the landscape level. The ecological significance of each index [63,64,65] is shown in Table 5.

4. Results

4.1. LUCE Change from 2000 to 2020

As shown in Table 6, CL, FL, and GL are the main land use types of the CCUA, accounting for more than 94% of the total area, while WL, WTR, and UL are less, and STM accounts for less than 4%. From 2000 to 2020, the LUCC of the CCUA mainly showed that the area of STM increased rapidly, the area of CL, GL, and WL decreased significantly, the area of WTR and UL increased slightly, and the area of FL decreased slightly. This is mainly because the construction of the CCUA was dramatically promoted during industrialization and urbanization, resulting in the acceleration of the transfer of CL. Meanwhile, the STM spread in space leads to the occupation of CL, GL, WL, and other ecological lands by STM.
From 2000 to 2020, the total LUCEs in the CCUA showed an increasing trend yearly (Table 7). From 2000 to 2010, the LUCEs increased from 344.7300 × 10⁴ t to 4051.1195 × 104 t in 2010, an increase of 11.75 times, with an average annual growth rate (AAGR) of 29.94%. From 2010 to 2020, the LUCEs increased from 4051.1195 × 104 t in 2010 to 4527.3820 × 104 t in 2020, an increase of 1.12 times, with an AAGR of 1.13%. In conclusion, although the overall LUCEs in the CCUA showed an upward trend in the last 20 years, the growth rate of LUCEs decreased significantly after 2010, with the land carbon source effect continuously weakening and the carbon sink capacity gradually increasing. In terms of specific land use type, as the primary carbon source, the total carbon emissions of STM increased from 2834.8104 × 104 t in 2000 to 7106.0208 × 104 t in 2020, but the carbon emissions per unit area decreased from 13,220.98 t/Km2 in 2000 to 10,096.04 t/Km2 in 2020. Although the STM area increases yearly, the carbon emission per unit area gradually decreases, which is closely related to the adjustment of industrial and energy structures and the elimination of high-energy and high-carbon industries in the construction process of the CCUA. As the second largest carbon source, the CL has a decreasing area, so the carbon emission of CL is also decreasing. FL is the most crucial carbon sink in the CCUA, and its carbon uptake accounts for more than 95% of the total carbon uptake, and with the increase in FL area from 2000 to 2020, the carbon sink is also increasing. Although GL, WL, WTR, and UL occupy a relatively small area, as critical ecological land types in the CCUA, their carbon sink role cannot be ignored.

4.2. Comparison of Land Use Quantitative Structure Optimization in 2030 under Different Scenarios

As shown in Table 7 that in 2030, the LUCEs in the CCUA under the CN_Scenario and the BL_Scenario were 3481.6632 × 104 t and 3736.1053 × 104 t, respectively, which showed a downward trend compared with the 4527.3820 × 104 t in 2020. Among them, the LUCEs in 2030 under the CN_Scenario decreased by 23.09% compared with that in 2020, while it only decreased by 17.47% under the BL_Scenario, and the carbon emission reduction was significantly lower than that under the CN_Scenario. The results show that the LUSO model under carbon neutrality, which considers social, economic, and ecological benefits, can produce significant positive effects on carbon emission reduction in land use in the CCUA. In the view of specific land use types, the area of CL, GL, and UL under the CN_Scenario showed a decreasing trend. In contrast, FL, WTR, and STM areas showed an increasing trend from 2020 to 2030. The carbon sink capacity of land was significantly enhanced with the increase in FL and the decrease in CL. At the same time, although the STM area showed an increasing trend compared with 2020, the carbon emission coefficient per unit area of STM decreased. Hence, the carbon emission of STM in 2030 showed a decreasing state. Compared with the CN_Scenario, the area of ecological lands such as CL, GL, and WL in the BL_Scenario is significantly lower, and the STM area expands greatly, which increases the carbon emission of STM and reduces the carbon sink benefit of the land. The above results all support the importance of optimizing and regulating the future land use structure of the CCUA.

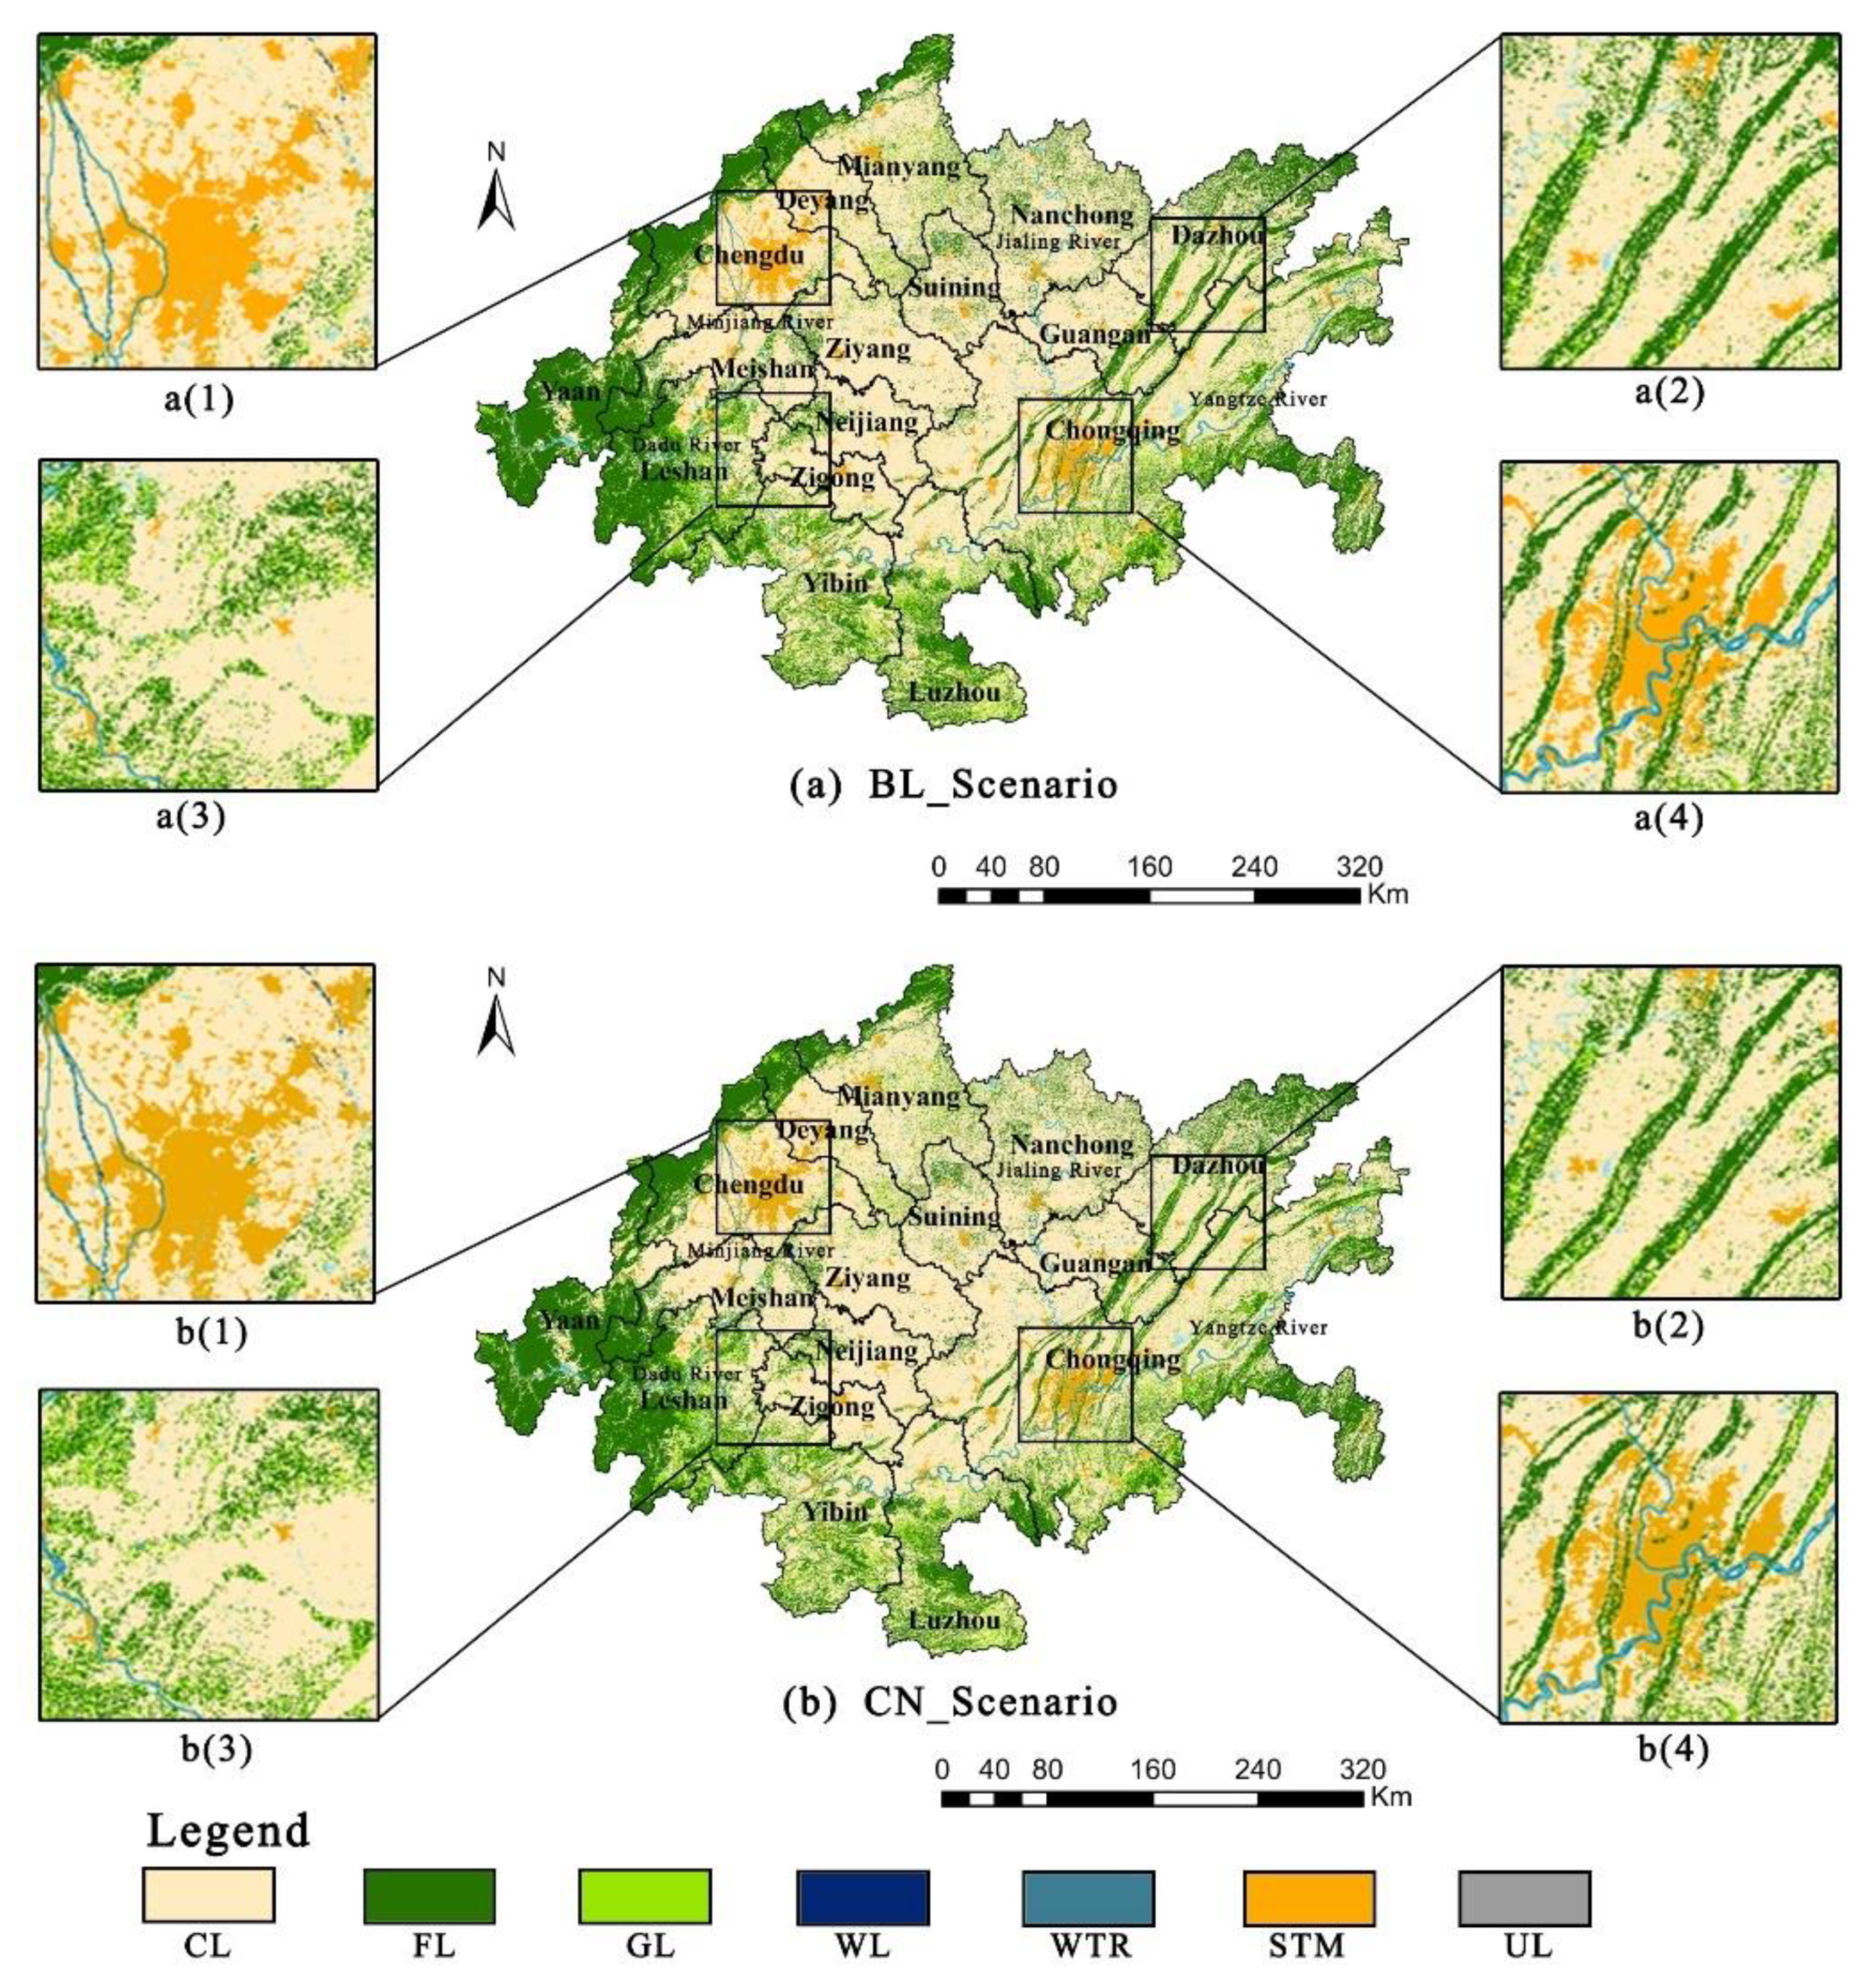
4.3. Comparison of Land Use Spatial Distribution Optimization in 2030 under Different Scenarios

As shown in Figure 3, the land use spatial distribution of the CCUA in 2030 under the two scenarios showed similar characteristics. Among them, Chengdu and Chongqing are still the concentrated distribution areas of STM. FL is mainly distributed in the western part of the CCUA with Mianyang, Deyang, Chengdu, Ya’an, and Leshan, and in the eastern part of the CCUA with Dezhou, Guang’an, Chongqing, and Luzhou. GL is widely distributed in the CCUA, especially in Chongqing, Leshan, Yibin, and Luzhou. CL is still the most prominent land use type in the CCUA, widely distributed in space. Although the area of WL and WTR is relatively small, they are distributed in all counties and urban regions. Among them, the Yangtze River, Jialing River, Minjiang River, and Dadu River in the central and western CCUA connect the WTR systems together.
However, in the view of land use transfer type and land use dynamic degree (LUDD), the two scenarios show apparent differences. From a land use transfer type perspective (Figure 4), a total of 1.79% (3349.3338 Km2) of land types were transferred in the CCUA from 2020 to 2030 under the BL_Scenario, among which the area of CL to STM was the largest (1549.0341 Km2), accounting for 46.25% of the total area of land types transferred. The transformation of CL to the FL was second (757.9488 Km2), accounting for 22.63% of the total area of transferred land, indicating that the transformation of CL to STM and FL was the primary type of LUCC in the CCUA under the BL_Scenario. However, under the CN_Scenario, 0.97% (1806.7429 Km2) of land types were transferred in the CCUA from 2020 to 2030, and the area of CL to STM was the largest (1218.4489 Km2), accounting for 67.44% of the total area of land types transferred. GL transferred to STM was second (220.5902 Km2), accounting for 12.21% of the total land transfer area. Therefore, the transformation of CL to STM was the primary type of LUCC in the CCUA under the CN_Scenario.
From LUDD perspectives (Table 8), the LUDD of different land use types in the CN_Scenario is significantly lower than that in the BL_Scenario. The LUCC is more moderate, the LUDD of STM decreases especially significantly, and the LUDD of ecological lands such as GL, WL, and WRT also decreases. It shows that under the CN_Scenario, the expansion speed of STM in the CCUA decreases. At the same time, the land use types with strong carbon sink capacity, such as FL and WL, continue to increase, and the carbon sink benefits continue to grow.

4.4. Land Use Ecological Benefits Evaluation from 2020 to 2030 under Different Scenarios

The study of landscape patterns is conducive to the study of its dynamic process of change, revealing the mutual influence relationship of the LUCC, and putting forward suggestions for the sustainable development of land use [66,67]. Therefore, this study used landscape pattern analysis to calculate the LPI, and compared and evaluated the ecological benefits of land use spatial distribution under the CN_Scenario and BL_Scenario in 2030.

4.4.1. Comparison of LPI at a Class Level under Different Scenarios

The class-level change characteristics of the CCUA under different scenarios from 2020 to 2030 are shown in Figure 5. For the changes in the NP, the NP of CL and WL in the CCUA showed an overall increasing trend from 2020 to 2030, while the NP of other land types showed a decreasing trend. In addition, the NP of CL, GL, WL, WTR, and STM in 2030 under the BL_Scenario is higher than that under the CN_Scenario, indicating that the fragmentation degree of each land type is lower and the shape of the land tends to be more completely under the CN_Scenario. For the changes in the LAPI, the LAPI of CL and WL under two scenarios generally showed an upward trend. In contrast, the LAPI of STM and GL is on the rise, and the LAPI of other land types changed little. This indicates that in the future, under the disturbance of human activities, CL and WL patches will continue to crack and decrease. In contrast, STM and GL patches will continue to aggregate and increase. For the changes in LSI, the LSI of CL, FL, WTR, and STM in the CCUA showed an upward trend under the two scenarios from 2020 to 2030, while the WL and GL showed a downward trend, and the UL remained unchanged. This indicates that in the next ten years, the irregularity of CL, FL, WTR, and STM patches will continue to increase, mainly caused by urbanization’s impact on the landscape pattern. At the same time, in the CN_Scenario, the LSI values of CL, FL, WTR, and STM are lower than those of the BL_Scenario, and the patch shapes of different regions are more regular. For the SPLIT changes, the SPLIT of FL and STM in the CCUA showed a downward trend, while the SPLIT of CL, GL, and WL showed an upward trend from 2020 to 2030. However, the SPLIT of WTR and STM showed different results under different scenarios. In the next ten years, due to the protection of FLs and the rational development of STM, the patches of FL and STM will continue to increase and converge, forming dominant patches, while ecological land types, such as CL, GL, and WL, will be more easily disturbed by urbanization and human activities.

4.4.2. Comparison of LPI at Landscape Level under Different Scenarios

The landscape-level change characteristics of the CCUA under different scenarios from 2020 to 2030 are shown in Table 9. It can be seen that the CONTAG of landscape space in the CCUA showed an upward trend from 2020 to 2030. Among them, the CONTAG of the CN_Scenario was 59.9106%, which was higher than that of the BL_Scenario (59.5752%), indicating that the landscape space connectivity in the CN_Scenario was good, the spatial composition of the landscape tended to be stable, and the degree of landscape fragmentation was low. For the changes in COHESION, compared with 2020, the COHESION in the landscape space of the CCUA in 2030 showed an increasing trend (99.8289%) under the BL_Scenario, while it showed a decreasing trend (99.8271%) under the CN_Scenario. It indicates that the LUCC under the BL_Scenario is more likely to be diversified, while the LUCC under the CN_Scenario is more likely to be intensive and stable. For the changes in SHDI and SHEI, the two indexes under the BL_Scenario and CN_Scenario showed an upward trend in 2030, and the SHDI and SHEI in the CN_Scenario were higher than those in the BL_Scenario. The results indicated that under the CN_Scenario, the land use in the CCUA was rich and diverse, and landscape patches were distributed evenly in space. For the changes in IJL, the IJL of the CCUA showed an increasing trend from 2020 to 2030, and the IJL of the CN_Scenario was higher than that of the BL_Scenario, indicating that the degree of patch landscape adjacency of the CCUA would continue to increase in the next ten years. Finally, according to the changes in AI, under the two scenarios, the patch landscape aggregation degree of the CCUA raised from 2020 to 2030 compared with 2020, indicating that the patch landscape aggregation degree of the CCUA will increase in the next ten years, and the landscape spatial aggregation in the CN_Scenario is the strongest.
By comparing and evaluating the ecological benefits of land use spatial distribution under two scenarios of the CCUA in 2030, we found that both in the analysis of class level from the micro perspective and the study of landscape level from the overall view, the results indicated that the optimized land use spatial distribution was more conducive to the development of spatial aggregation of different landscape patch types. In the CN_Scenario, the agglomeration degree of the carbon sink land (FL, GL, WL, and WTR) patch area is deepened, and the overall landscape spreading degree is increased. All these phenomena indicate that the spatial distribution of land use after LC optimization is more conducive to playing the ecological benefits of carbon sink land and improving the intensity of carbon sink. Therefore, compared with the BL_Scenario, the land use structure under the CN_Scenario in the CCUA can not only play the effect of carbon emission reduction in quantity, but also play the ecological benefit of carbon sink land more effectively in the land use spatial distribution, making great contributions to regional carbon emission reduction and strengthening regional ecological security.

5. Discussion

5.1. Effectiveness and Limitations of the Prediction Model for the LUSO of the Urban Agglomerations

The optimal allocation of land resources is the fundamental guarantee for sustainable utilization of land resources [68], and the sustainable use of land resources is the basis for the sustainable development of human society. Integrating the concept of carbon neutrality into sustainable development not only expands the concept of sustainable development, but also guides the way and direction for the realization of sustainable use of land under the guidance of carbon neutrality. However, much of the current research on the LUSO under the LC scenario is based on the single reduction in regional land carbon emission intensity, and lack of comprehensive consideration of land use’s economic and social benefits. This is as the concept of carbon neutrality proposed by LUSO to achieve carbon neutrality also lacks theoretical elaboration. Simultaneously, the limitations of the study scale of LUSO, the updating of the application of models, and the evaluation of ecological benefits after land use simulation also need to be improved and supplemented. Finally, the LPI was selected to evaluate the ecological benefits generated by the simulated future land use spatial distribution. The results show that the CCUA under the CN_Scenario not only achieves a more obvious carbon emission reduction effect in terms of the quantitative structure of land use but also plays more ecological benefits in terms of the spatial distribution of land use.
Compared with previous studies on LUSO under LC scenarios, this study not only constructs a framework for LUSO under carbon neutrality but also provides a more comprehensive and clear explanation of carbon neutrality goals theoretically, which makes up for the shortcomings of previous studies on the theoretical level. At the same time, we used the combination of the MOLP model and PLUS model to optimize the land use structure of the CCUA from the two perspectives of land use quantity structure and spatial distribution and made a good attempt in the research method. Moreover, in using the PLUS model, it was found that the overall accuracy of the predicted land use data of the CCUA in 2020 is 0.8520, and the Kappa coefficient is 0.7329. The spatial consistency between the simulated results and the actual data of the CCUA in 2020 is relatively high. The results show that the PLUS model has good applicability in future LUCC prediction and can meet the research needs. Finally, the LPI was used to evaluate the ecological benefits generated by simulated future land use spatial distribution, which could more objectively assess the optimization effect of land use structure under different scenarios.
However, there are still limitations in this study. For one, LUCC is a complex process; simulating LUCC involves natural, economic, social, and policy factors, and the various interactions and constraints between them [69]. So, future studies of LUCC in the CCUA should fully consider the study regions of land use in the past, present, and future of the actual situation combined with the research area of nature, society, and policy factors, to ensure the simulation prediction is scientific and accurate. For another, different parameter settings of the PLUS model will affect the simulation accuracy of the model, and the parameters should be changed accordingly when different research regions are selected. Since the setting of parameters in this paper refers to expert knowledge and combines with the actual situation of the research region, the final determination is made after continuous experiments, but there are still certain subjective factors. Therefore, future research can focus on how to optimize the determination method of PLUS model parameters. Finally, although the driving factors selected in this paper involve climate, topography, social economy, and accessibility, there are still some factors not taken into account due to the difficulty of obtaining some data. For example, natural protection areas with important ecological and environmental value should be protected as restricted areas for transformation. Additionally, concerning the driving factors of the selection method being worthy of further optimization, too few driving factors cannot represent characteristics of LUCC, and too many driving factors can cause data redundancy and reduce the precision of the model. Therefore, how to accurately and efficiently select the effect most significant driving factor among a variety of factors also is the research emphasis of the future.

5.2. Supplements to the Land Use Planning and Management of Current Urban Agglomerations

With the target of carbon neutrality and the construction of urban ecological civilization, a number of studies have recommended implementing more integrated and comprehensive land use and spatial planning to achieve efficient and sustainable use of land resources in urban agglomerations [70]. At both national and local levels, ecological impact and land use protection have to be incorporated in creating and modifying policies and strategies for sustainable development.
First, policymakers should incorporate carbon-neutral targets and the principles of ecological conservation into future land use planning or urban master planning. Regional differences and trade-offs based on these two figures should be taken into account when revising plans and policies, especially in the reallocation of land use (such as STM, FL, and CL) and the development of regional strategies. On the one hand, when formulating the land use planning for the future of the CCUA, it is necessary to reasonably control the excessive growth of STM from the perspective of low carbon, fully meet the demand for carbon sink land types such as FL, GL, and WL, and ensure a reasonable proportion of land use structure. On the other hand, as an important protected area for ecological security in the URYR, the CCUA has a number of national natural protection areas, such as the Tangjiahe, Baishuihe, and Wanglang national natural protection areas, etc. These natural protection areas play an important role in alleviating LUCC, maintaining biodiversity, regulating climate and hydrology, and improving the ecological environment [46,47]. Therefore, in future land use planning, it is necessary to strictly observe the red line of ecological protection, establish a natural protection areas system with national parks as the main body, nature reserves as the foundation, and various natural parks as supplements, strictly control non-ecological activities within the natural protected areas, and prohibit unreasonable land use behaviors.
Second, differentiated carbon emission reduction strategies should be formulated according to the characteristics of different regions in the CCUA. As the core cities of the CCUA, Chengdu and Chongqing bear the most carbon emissions from industry, transportation, and other energy sources. Therefore, for these two large cities, on the one hand, energy input per unit land area should be reduced, and carbon emissions per unit land area should be reduced by strengthening the development of clean energy, so as to ensure that urban development meets the requirements of ecological civilization. On the other hand, we should actively revitalize idle STM, improve the function and efficiency of land use, and reduce the disorderly expansion of STM. In the process of development, other counties and cities should follow their positioning in the main functional areas and balance the relationship between development and protection. We should not only focus on strengthening ecological management, conservation, and restoration to avoid high-intensity land use activities, but also give full play to the carbon sink function of FL, GL, WL, WTR, and other ecological land types and rationally develop green service industries, so as to realize the win–win economic, ecological, and social benefits of ecological land [71].
Finally, the government should take note of spatial correlations in land development efficiency, gradually eliminate administrative barriers, and prioritize coordinated development [72]. This would result in enhanced spatial spillover effects from high-quality development zones, which would improve development efficiency in neighboring areas and reduce unnecessary land carbon emissions.

6. Conclusions

To cope with global climate change and achieve the carbon-neutral development goal of urban agglomeration, the impact of LUSO on LUCEs in urban agglomeration has been paid more and more attention. In this study, we constructed the framework of LUSO under carbon neutrality based on theories of the optimal allocation of land, sustainable development, and LC economy, then simulated and compared the results of LUCEs and ecological benefits of the CCUA in 2030 under different scenarios from the perspectives of land use quantity structure and spatial distribution. The results showed the following:
(1) From 2000 to 2020, the LUCEs in the CCUA showed an increasing trend; the growth rate of carbon emissions from 2010 to 2020 was significantly lower than that from 2000 to 2010, and the STM was the most critical carbon source. Although GL, WL, WTR, and UL occupy relatively small areas, as crucial ecological land types, their carbon sink role cannot be ignored.
(2) In the results of the optimization of the land use quantity structure, the LUCEs of the CCUA in 2030 under the CN_Scenario is 3481.6632 × 104 t, which is significantly lower than the BL_Scenario (3736.1053 × 104 t). The results show that the LUSO model under carbon neutrality, which considers social, economic, and ecological benefits, can indeed produce significant positive effects on carbon emission reduction in land use in the CCUA.
(3) In the results of optimization land use spatial distribution, the spatial distribution of land use of the CCUA in 2030 under the two scenarios showed a similar pattern. However, the area of CL and GL converted to STM in the CN_Scenario is much smaller than that in the BL_Scenario, which can better retain the ecological benefits of CL and GL and reduce land carbon emissions. In addition, the LUDD in the CN_Scenario is significantly lower than in the BL_Scenario, and the LUCC is more moderate.
(4) Under the CN_Scenario, the agglomeration degree of the carbon sink land (FL, GL, WL, and WTR) patch area is deepened, and the overall landscape spreading degree increases. All these results indicate that the spatial distribution of land use after carbon neutral optimization is more conducive to playing the ecological benefits of carbon sink land and reducing land carbon emissions.

Author Contributions

Conceptualization, Z.W. and S.L.; methodology, Z.W.; software, Z.W.; validation, Z.W., F.Z. and D.X.; formal analysis, Z.W.; investigation, Z.W. and F.Z.; resources, D.X.; data curation, Z.W.; writing—original draft preparation, Z.W. and S.L.; writing—review and editing, D.X. and S.L.; visualization, Z.W.; supervision, D.X.; project administration, D.X.; funding acquisition, D.X. All authors have read and agreed to the published version of the manuscript.

Funding

This research was funded by the Special Program for Cultivating Excellent Young Talents under the Dual Support Plan of Sichuan Agricultural University.

Data Availability Statement

The land use data were obtained from GLOBELAND 30 global landcover database (http://www.globallandcover.com (accessed on 7 October 2022)). The energy data and socioeconomic data were obtained from the Sichuan statistical yearbook (http://tjj.sc.gov.cn/scstjj/c105855/nj.shtml (accessed on 7 October 2022)) and Chongqing statistical yearbook (http://tjj.cq.gov.cn/zwgk_233/tjnj/ (accessed on 7 October 2022)). The meteorological data were obtained from the National Greenhouse Data Sharing Platform (http://data.sheshiyuanyi.com/ (accessed on 15 October 2022)). River data were obtained from HydroRIVERS (https://hydrosheds.org/page/overview (accessed on 15 October 2022)). The road network, urban and rural residential area data were obtained from OpenStreetMap (https://www.openstreetmap.org/ (accessed on 15 October 2022)). DEM data were obtained from Geospatial Data Cloud (https://www.gscloud.cn/ (accessed on 15 October 2022)).

Acknowledgments

The authors thank the financial support from the Special Program for Cultivating Excellent Young Talents under the Dual Support Plan of Sichuan Agricultural University. The authors also extend great gratitude to the anonymous reviewers and editors for their helpful reviews and critical comments.

Conflicts of Interest

The authors declare no conflict of interest.

References

  1. Alexiadis, A. Global warming and human activity: A model for studying the potential instability of the carbon dioxide/temperature feedback mechanism. Ecol. Model. 2007, 203, 243–256. [Google Scholar] [CrossRef]
  2. Mehmood, I.; Bari, A.; Irshad, S.; Khalid, F.; Liaqat, S.; Anjum, H.; Fahad, S. Carbon cycle in response to global warming. In Environment, Climate, Plant and Vegetation Growth; Springer: Cham, Switzerland, 2020; pp. 1–15. [Google Scholar]
  3. Burleson, E. Paris agreement and consensus to address climate challenge. In ASIL Insight, Forthcoming; The United Nations: New York, NY, USA, 2016. [Google Scholar]
  4. Levin, K.; Rich, D. Turning Points: Trends in Countries’ Reaching Peak Greenhouse Gas Emissions over Time; World Resources Institute: Washington, DC, USA, 2017. [Google Scholar]
  5. Wang, H.; Lu, X.; Deng, Y.; Sun, Y.; Nielsen, C.P.; Liu, Y.; Zhu, G.; Bu, M.; Bi, J.; McElroy, M.B. China’s CO2 peak before 2030 implied from characteristics and growth of cities. Nat. Sustain. 2019, 2, 748–754. [Google Scholar] [CrossRef]
  6. Zhao, R.; Huang, X.; Liu, Y.; Zhong, T.; Ding, M.; Chuai, X. Urban carbon footprint and carbon cycle pressure: The case study of Nanjing. J. Geogr. Sci. 2014, 24, 159–176. [Google Scholar] [CrossRef]
  7. Li, Z.; Wang, F.; Kang, T.; Wang, C.; Chen, X.; Miao, Z.; Zhang, L.; Ye, Y.; Zhang, H. Exploring differentiated impacts of socioeconomic factors and urban forms on city-level CO2 emissions in China: Spatial heterogeneity and varying importance levels. Sustain. Cities Soc. 2022, 84, 104028. [Google Scholar] [CrossRef]
  8. Eggleston, H.S.; Buendia, L.; Miwa, K. IPCC Guidelines for National Greenhouse Gas Inventories; The National Green-House Gas Inventories Programmer: Hayama, Japan, 2006. [Google Scholar]
  9. Wang, Y.; Niu, Y.; Li, M.; Yu, Q.; Chen, W. Spatial structure and carbon emission of urban agglomerations: Spatiotemporal characteristics and driving forces. Sustain. Cities Soc. 2022, 78, 103600. [Google Scholar] [CrossRef]
  10. Chen, M.; Ye, C.; Lu, D.; Sui, Y.; Guo, S. Cognition and construction of the theoretical connotations of new urbanization with Chinese characteristics. J. Geogr. Sci. 2019, 29, 1681–1698. [Google Scholar] [CrossRef]
  11. Hu, X.; Zhou, W.; Qian, Y.; Yu, W. Urban expansion and local land-cover change both significantly contribute to urban warming, but their relative importance changes over time. Landsc. Ecol. 2017, 32, 763–780. [Google Scholar] [CrossRef]
  12. Fang, C.; Yu, D. Urban agglomeration: An evolving concept of an emerging phenomenon. Landsc. Urban Plan. 2017, 162, 126–136. [Google Scholar] [CrossRef]
  13. Zhou, Y. The metropolitan interlocking region in China: A preliminary hypothesis. In The Extended Metropolis; University of Hawaii Press: Honolulu, HI, USA, 2022; pp. 87–112. [Google Scholar]
  14. Zhang, N.; Ye, H.; Wang, M.; Li, Z.; Li, S.; Li, Y. Response Relationship between the Regional Thermal Environment and Urban Forms during Rapid Urbanization (2000–2010–2020): A Case Study of Three Urban Agglomerations in China. Remote Sens. 2022, 14, 3749. [Google Scholar] [CrossRef]
  15. Fang, K.; Tang, Y.; Zhang, Q.; Song, J.; Wen, Q.; Sun, H.; Ji, C.; Xu, A. Will China peak its energy-related carbon emissions by 2030? Lessons from 30 Chinese provinces. Appl. Energy 2019, 255, 113852. [Google Scholar] [CrossRef]
  16. Zhang, F.; Deng, X.; Xie, L.; Xu, N. China’s energy-related carbon emissions projections for the shared socioeconomic pathways. Resour. Conserv. Recycl. 2021, 168, 105456. [Google Scholar] [CrossRef]
  17. Zhao, R.; Huang, X.; Zhong, T.; Chuai, X. Carbon effect evaluation and low-carbon optimization of regional land use. Trans. Chin. Soc. Agric. Eng. 2013, 29, 220–229. [Google Scholar]
  18. Xu, G.; Schwarz, P.; Yang, H. Determining China’s CO2 emissions peak with a dynamic nonlinear artificial neural network approach and scenario analysis. Energy Policy 2019, 128, 752–762. [Google Scholar] [CrossRef]
  19. Chen, Y.; Li, X.; Liu, X.; Ai, B. Modeling urban land-use dynamics in a fast developing city using the modified logistic cellular automaton with a patch-based simulation strategy. Int. J. Geogr. Inf. Sci. 2014, 28, 234–255. [Google Scholar] [CrossRef]
  20. Han, Y.; Jia, H. Simulating the spatial dynamics of urban growth with an integrated modeling approach: A case study of Foshan, China. Ecol. Model. 2017, 353, 107–116. [Google Scholar] [CrossRef]
  21. Zare, M.; Nazari Samani, A.A.; Mohammady, M.; Salmani, H.; Bazrafshan, J. Investigating effects of land use change scenarios on soil erosion using CLUE-s and RUSLE models. Int. J. Environ. Sci. Technol. 2017, 14, 1905–1918. [Google Scholar] [CrossRef]
  22. Kucsicsa, G.; Popovici, E.A.; Bălteanu, D.; Grigorescu, I.; Dumitraşcu, M.; Mitrică, B. Future land use/cover changes in Romania: Regional simulations based on CLUE-S model and CORINE land cover database. Landsc. Ecol. Eng. 2019, 15, 75–90. [Google Scholar] [CrossRef]
  23. Liu, X.; Liang, X.; Li, X.; Xu, X.; Ou, J.; Chen, Y.; Li, S.; Wang, S.; Pei, F. A future land use simulation model (FLUS) for simulating multiple land use scenarios by coupling human and natural effects. Landsc. Urban Plan. 2017, 168, 94–116. [Google Scholar] [CrossRef]
  24. Guo, H.; Cai, Y.; Yang, Z.; Zhu, Z.; Ouyang, Y. Dynamic simulation of coastal wetlands for Guangdong-Hong Kong-Macao Greater Bay area based on multi-temporal Landsat images and FLUS model. Ecol. Indic. 2021, 125, 107559. [Google Scholar] [CrossRef]
  25. Engelen, G.; White, R.; Maarten, V.; Bernhard, H. Sustainable developments of islands: A policy support framework for the integrated assessment of socioeconomic and environmental development. In Sustainable Development for Island Societies: Taiwan and the World; Asia-Pacific Research Program, Academia Sinica: Taibei, China, 2002; pp. 251–287. [Google Scholar]
  26. Cao, M.; Tang, G.; Shen, Q.; Wang, Y. A new discovery of transition rules for cellular automata by using cuckoo search algorithm. Int. J. Geogr. Inf. Sci. 2015, 29, 806–824. [Google Scholar] [CrossRef]
  27. Liang, X.; Guan, Q.; Clarke, K.C.; Liu, S.; Wang, B.; Yao, Y. Understanding the drivers of sustainable land expansion using a patch-generating land use simulation (PLUS) model: A case study in Wuhan, China. Comput. Environ. Urban Syst. 2021, 85, 101569. [Google Scholar] [CrossRef]
  28. Li, C.; Wu, Y.; Gao, B.; Zheng, K.; Wu, Y.; Li, C. Multi-scenario simulation of ecosystem service value for optimization of land use in the Sichuan-Yunnan ecological barrier, China. Ecol. Indic. 2021, 132, 108328. [Google Scholar] [CrossRef]
  29. Kurnia, A.A.; Rustiadi, E.; Fauzi, A.; Pravitasari, A.E.; Saizen, I.; Ženka, J. Understanding Industrial Land Development on Rural-Urban Land Transformation of Jakarta Megacity’s Outer Suburb. Land 2022, 11, 670. [Google Scholar] [CrossRef]
  30. Chen, Y.; Wang, J.; Xiong, N.; Sun, L.; Xu, J. Impacts of Land Use Changes on Net Primary Productivity in Urban Agglomerations under Multi-Scenarios Simulation. Remote Sens. 2022, 14, 1755. [Google Scholar] [CrossRef]
  31. Fang, Z.; Ding, T.; Chen, J.; Xue, S.; Zhou, Q.; Wang, Y.; Wang, Y.; Huang, Z.; Yang, S. Impacts of land use/land cover changes on ecosystem services in ecologically fragile regions. Sci. Total Environ. 2022, 831, 154967. [Google Scholar] [CrossRef] [PubMed]
  32. Seppelt, R.; Lautenbach, S.; Volk, M. Identifying trade-offs between ecosystem services, land use, and biodiversity: A plea for combining scenario analysis and optimization on different spatial scales. Curr. Opin. Environ. Sustain. 2013, 5, 458–463. [Google Scholar] [CrossRef]
  33. Zheng, W.; Ke, X.; Xiao, B.; Zhou, T. Optimising land use allocation to balance ecosystem services and economic benefits—A case study in Wuhan, China. J. Environ. Manag. 2019, 248, 109306. [Google Scholar] [CrossRef]
  34. Rahman, M.M.; Szabó, G. Multi-objective urban land use optimization using spatial data: A systematic review. Sustain. Cities Soc. 2021, 74, 103214. [Google Scholar] [CrossRef]
  35. Rutledge, D.T. Landscape Indices as Measures of the Effects of Fragmentation: Can Pattern Reflect Process? Department of Conservation: Wellington, New Zealand, 2003.
  36. Zhang, S.; Fan, W.; Li, Y.; Yi, Y. The influence of changes in land use and landscape patterns on soil erosion in a watershed. Sci. Total Environ. 2017, 574, 34–45. [Google Scholar] [CrossRef]
  37. Fang, C.; Liu, H.; Li, G. International progress and evaluation on interactive coupling effects between urbanization and the eco-environment. J. Geogr. Sci. 2016, 26, 1081–1116. [Google Scholar] [CrossRef]
  38. Grant, R.F.; Baldocchi, D.D.; Ma, S. Ecological controls on net ecosystem productivity of a seasonally dry annual grassland under current and future climates: Modelling with ecosys. Agric. For. Meteorol. 2012, 152, 189–200. [Google Scholar] [CrossRef]
  39. Lai, L.; Huang, X.; Yang, H.; Chuai, X.; Zhang, M.; Zhong, T.; Chen, Z.; Wang, X.; Thompson, J.R. Carbon emissions from land-use change and management in China between 1990 and 2010. Sci. Adv. 2016, 2, e1601063. [Google Scholar] [CrossRef]
  40. Zhang, H.; Zeng, Y.; Jin, X.; Shu, B.; Zhou, Y.; Yang, X. Simulating multi-objective land use optimization allocation using Multi-agent system—A case study in Changsha, China. Ecol. Model. 2016, 320, 334–347. [Google Scholar] [CrossRef]
  41. Verburg, P.H.; De Koning, G.H.J.; Kok, K.; Veldkamp, A.; Bouma, J. A spatial explicit allocation procedure for modelling the pattern of land use change based upon actual land use. Ecol. Model. 1999, 116, 45–61. [Google Scholar] [CrossRef]
  42. Basiago, A.D. Methods of defining ‘sustainability’. Sustain. Dev. 1995, 3, 109–119. [Google Scholar] [CrossRef]
  43. Akintoye, V.A.; Opeyemi, O.A. Prospects for Achieving Sustainable Development Through the Millennium Development Goals in Nigeria. Eur. J. Sustain. Dev. 2014, 3, 33. [Google Scholar]
  44. Monnin, P. Central banks and the transition to a low-carbon economy. In Council on Economic Policies, Discussion Note; Council on Economic Priorities: Bern, Switzerland, 2018; p. 1. [Google Scholar]
  45. Yang, L.; Li, Y. Low-carbon city in China. Sustain. Cities Soc. 2013, 9, 62–66. [Google Scholar] [CrossRef]
  46. Dobrowski, S.Z.; Littlefield, C.E.; Lyons, D.S.; Hollenberg, C.; Carroll, C.; Parks, S.A.; Abatzoglou, J.T.; Hegewisch, K.; Gage, J. Protected-area targets could be undermined by climate change-driven shifts in ecoregions and biomes. Commun. Earth Environ. 2021, 2, 198. [Google Scholar] [CrossRef]
  47. Çoruhlu, Y.E.; Çelik, M.Ö. Protected area geographical management model from design to implementation for specially protected environment area. Land Use Policy 2022, 122, 106357. [Google Scholar] [CrossRef]
  48. Wang, Z.; Yang, L. Indirect carbon emissions in household consumption: Evidence from the urban and rural area in China. J. Clean. Prod. 2014, 78, 94–103. [Google Scholar] [CrossRef]
  49. Persson, U.M.; Henders, S.; Cederberg, C. A method for calculating a land-use change carbon footprint (LUC-CFP) for agricultural commodities–applications to Brazilian beef and soy, Indonesian palm oil. Glob. Chang. Biol. 2014, 20, 3482–3491. [Google Scholar] [CrossRef] [PubMed]
  50. Zhang, C.; Zhao, L.; Zhang, H.; Chen, M.; Fang, R.; Yao, Y.; Zhang, Q.; Wang, Q. Spatial-temporal characteristics of carbon emissions from land use change in Yellow River Delta region, China. Ecol. Indic. 2022, 136, 108623. [Google Scholar] [CrossRef]
  51. Xu, G.; Liu, Z.; Jiang, Z. Decomposition model and empirical study of carbon emissions for China, 1995–2004. China Popul. Resour. Environ. 2006, 16, 158–161. [Google Scholar]
  52. Fang, J.; Guo, Z.; Piao, S.; Chen, A. Terrestrial vegetation carbon sinks in China, 1981–2000. Sci. China Ser. D Earth Sci. 2007, 50, 1341–1350. [Google Scholar] [CrossRef]
  53. Sun, H.; Liang, H.; Chang, X.; Cui, Q.; Tao, Y. Land Use Patterns on Carbon Emission and Spatial Association in China. Econ. Geogr. 2015, 35, 154–162. [Google Scholar]
  54. Zhang, R.; Pu, L.; Wen, J.; Xu, Y. Hypothesis and Validation on the Kuznets Curve of Construction Land Expansion and Carbon Emission Effect. J. Nat. Resour. 2012, 27, 723–733. [Google Scholar]
  55. Liu, J.; Li, W.; Zhou, W.; Han, J.; Qian, Y. Scenario simulation balancing multiple objectives for optimal land use allocation of the Beijing-Tianjin-Hebei megaregion. Acta Ecol. Sin. 2018, 38, 4341–4350. [Google Scholar]
  56. Guan, X.; Wei, H.; Lu, S.; Dai, Q.; Su, H. Assessment on the urbanization strategy in China: Achievements, challenges and reflections. Habitat Int. 2018, 71, 97–109. [Google Scholar] [CrossRef]
  57. Zhou, Y.; Huang, X.; Zhong, T.; Chen, Y.; Yang, H.; Chen, Z.; Xu, G.; Niu, L.; Li, H. Can annual land use plan control and regulate construction land growth in China? Land Use Policy 2020, 99, 105026. [Google Scholar] [CrossRef]
  58. Wang, L.; Feng, Z.; Yang, Y. The change in population density from 2000 to 2010 and its influencing factors in China at the county scale. J. Geogr. Sci. 2015, 25, 485–496. [Google Scholar] [CrossRef]
  59. Guo, R.; Wu, T.; Wu, X.; Luigi, S.; Wang, Y. Simulation of Urban Land Expansion under Ecological Constraints in Harbin-Changchun Urban Agglomeration, China. Chin. Geogr. Sci. 2022, 32, 438–455. [Google Scholar] [CrossRef]
  60. Wang, Z.; Li, X.; Mao, Y.; Li, L.; Wang, X.; Lin, Q. Dynamic simulation of land use change and assessment of carbon storage based on climate change scenarios at the city level: A case study of Bortala, China. Ecol. Indic. 2022, 134, 108499. [Google Scholar] [CrossRef]
  61. Li, W.; Lan, Z.; Chen, D.; Zheng, Z. Multi-scenario Simulation of Land Use and its Spatial-temporal Response to Ecological Rick in Guangzhou City. Bull. Soil Water Conserv. 2020, 40, 204–210. [Google Scholar]
  62. Wang, X.; Ma, B.; Li, D.; Chen, K.; Yao, H. Multi-scenario simulation and prediction of ecological space in Hubei province based on FLUS model. J. Nat. Resour. 2020, 35, 230–242. [Google Scholar]
  63. O’Neill, R.V.; Krummel, J.R.; Gardner, R.E.A.; Sugihara, G.; Jackson, B.; DeAngelis, D.L.; Milne, B.T.; Turner, M.G.; Zygmunt, B.; Christensen, S.W.; et al. Indices of landscape pattern. Landsc. Ecol. 1998, 1, 153–162. [Google Scholar] [CrossRef]
  64. Tarr, N.M. Demonstrating a conceptual model for multispecies landscape pattern indices in landscape conservation. Landsc. Ecol. 2019, 34, 2133–2147. [Google Scholar] [CrossRef]
  65. Turner, M.G.; O’Neill, R.V.; Gardner, R.H.; Milne, B.T. Effects of changing spatial scale on the analysis of landscape pattern. Landsc. Ecol. 1989, 3, 153–162. [Google Scholar] [CrossRef]
  66. Wang, F.; Niu, Z.; Xu, P. Seasonal variation of the surface thermal environment in Changshu City based on land-scape pattern. Chin. J. Ecol. 2016, 35, 3404–3412. [Google Scholar]
  67. Cui, S.; Liu, Q.; Wang, J. Scale Effect of Landscape Pattern Index and Its Response to Land Use Change in the Coastal Development Zone: A Case Study of Dafeng City in Jiangsu Province. Geogr. Geo-Inf. Sci. 2016, 32, 87–93. [Google Scholar]
  68. Liu, J.; Jin, X.; Xu, W.; Sun, R.; Han, B.; Yang, X.; Gu, Z.; Xu, C.; Sui, X.; Zhou, Y. Influential factors and classification of cultivated land fragmentation, and implications for future land consolidation: A case study of Jiangsu Province in eastern China. Land Use Policy 2019, 88, 104185. [Google Scholar] [CrossRef]
  69. Torre, A.; Melot, R.; Magsi, H.; Bossuet, L.; Cadoret, A.; Caron, A.; Darly, S.; Jeanneaux, P.; Kirat, T.; Pham, H.V.; et al. Identifying and measuring land-use and proximity conflicts: Methods and identification. SpringerPlus 2014, 3, 1–26. [Google Scholar] [CrossRef] [PubMed]
  70. Hepburn, C.; Qi, Y.; Stern, N.; Ward, B.; Xie, C.; Dimitri, Z. Towards carbon neutrality and China’s 14th Five-Year Plan: Clean energy transition, sustainable urban development, and investment priorities. Environ. Sci. Ecotechnol. 2021, 8, 100130. [Google Scholar] [CrossRef] [PubMed]
  71. Cao, S. Development Potential Evaluation for Land Resources of Forest Tourism Based on Fuzzy AHP Method. Math. Probl. Eng. 2022, 2022, 4545146. [Google Scholar] [CrossRef]
  72. Li, J.; Ouyang, X.; Zhu, X. Land space simulation of urban agglomerations from the perspective of the symbiosis of urban development and ecological protection: A case study of Changsha-Zhuzhou-Xiangtan urban agglomeration. Ecol. Indic. 2021, 126, 107669. [Google Scholar] [CrossRef]
Figure 1. Framework of land use structure optimization under carbon neutral orientation.
Land 12 01016 g001
Figure 2. Study area location.
Land 12 01016 g002
Figure 3. Land use spatial distribution under BL_Scenario (a) and CN_Scenario (b) in 2030. Among them, CL means cropland, FL means forestland, GL means grassland, WL means wetland, WTR means water, STM means settlement, and UL means unused land.
Land 12 01016 g003
Figure 4. The proportion of major land use transfer types under BL_Scenario (a) and CN_Scenario (b) from 2020 to 2030. Among them, CL means cropland, FL means forestland, GL means grassland, WL means wetland, WTR means water, STM means settlement, and UL means unused land.
Land 12 01016 g004
Figure 5. Comparison of LPIs at the class level under different scenarios from 2020 to 2030. Among them, CL means cropland, FL means forestland, GL means grassland, WL means wetland, WTR means water, STM means settlement, UL means unused land, NP means number of patches, LAPI means largest patch index, LSI means landscape shape index, and SPLIT means splitting index.
Land 12 01016 g005
Table 1. CEC of different land use types in the CCUA.
Land Use TypeCLFLGLWLWTRUL
Value (t/Km2)42.2−570.6−94.8−236.1−25.2−0.5
Notes: CL means cropland, FL means forestland, GL means grassland, WL means wetland, WTR means water, and UL means unused land.
Table 2. The PLUS model driving factors and data sources.
Driver TypeFactorsData Sources
Natural factorsElevationGeospatial Data Cloud
(https://www.gscloud.cn/)
Slope
Aspect
Annual average temperatureNational Greenhouse Data Sharing Platform (http://data.sheshiyuanyi.com/)
Annual precipitation
Distance from riversHydroRIVERS
(https://hydrosheds.org/page/overview)
Social
factors
Distance from the expresswayOpenStreetMap
(https://www.openstreetmap.org/)
Distance from firstly road
Distance from the secondary road
Distance from urban and rural residential data
Economic factorsThe density of populationSichuan Province and Chongqing statistical yearbook (http://tjj.sc.gov.cn/scstjj/c105855/nj.shtml)
Per capita GDP
Table 3. Land type transfer cost matrix under different scenarios.
BL_Scenario CN_Scenario
CLFLGLWLWTRSTMUL CLFLGLWLWTRSTMUL
CL1111111CL1110111
FL1111111FL1110111
GL1111111GL1110111
WL1111110WL0001000
WTR1111101WTR1110101
STM1111110STM1110110
UL0110001UL0110001
Notes: CL means cropland, FL means forestland, GL means grassland, WL means wetland, WTR means water, STM means settlement, and UL means unused land.
Table 4. Weight parameters of neighborhood factors of the different land types under different scenarios.
Scenario TypeCLFLGLWLWTRSTMUL
BL_Scenario0.024220.028990.021180.00030.00610.024530.0001
CN_Scenario0.024220.030540.021180.00050.00640.021540.0001
Notes: CL means cropland, FL means forestland, GL means grassland, WL means wetland, WTR means water, STM means settlement, and UL means unused land.
Table 5. LPI and its significance.
TypeLPIMeaning
Class levelNPRepresents the number of patches in a specific landscape.
LAPIRepresents the dominant type of landscape and the direction and strength of human activities.
LSIDescribe the irregularities of the patches.
SPLITRepresents the degree of fragmentation after landscape space is segmented.
CONTAGRepresents the clustering trend of patch types in spatial distribution.
COHESIONRepresents the degree of spatial interconnectedness of patches in the landscape.
Landscape levelSHEIRepresents the diverse changes in different landscapes or different periods of the same landscape.
SHDIDescribing landscape heterogeneity.
IJLReflects the distribution characteristics of the ecosystem severely restricted by certain natural conditions.
AIRepresents the dispersion degree of patches in the landscape.
Notes: NP means number of patches, LAPI means largest patch index, LSI means landscape shape index, SPLIT means splitting index, CONTAG means contagion, COHESION means patch cohesion index, SHEI means Shannon’s evenness index, SHDI means Shannon’s diversity index, IJL means interspersion Juxtaposition index, and AI means aggregation index.
Table 6. Changes in land use area and carbon emission from 2000 to 2020.
Land Use TypeLand Use Area (Km2)LUCE (104 t)
200020102020200020102020
CL117,053.5698117,295.3557112,642.2522493.9661494.9864475.3503
FL49,545.738951,476.06751,245.289−2827.0799−2937.2244−2924.0562
GL15,246.694812,773.475912,520.3104−144.5387−121.0926−118.6925
WL263.7468184.2489144.0513−6.2271−4.3501−3.4011
WTR2460.33812343.81963110.2650−6.2001−5.9064−7.8379
STM2144.17532639.88727038.42662834.81046624.70747106.0208
UL14.350515.759928.0197−0.0007−0.0008−0.0014
Total186,728.6142186,728.6142186,728.6142344.73004051.11954527.3820
Notes: CL means cropland, FL means forestland, GL means grassland, WL means wetland, WTR means water, STM means settlement, and UL means unused land.
Table 7. Comparison of land use structure and carbon emission effect under different scenarios.
Land Use
Type
20202030 (BL_Scenario)2030 (CN_Scenario)
Area
(Km2)
Carbon Emission (104 t)Area
(Km2)
Carbon Emission (104 t)Area
(Km2)
Carbon Emission (104 t)
CL112,642.2522475.3503111,231.8931469.3986111,301.7024469.6932
FL51,245.2890−2924.056252,335.6215−2986.270651,362.3909−2930.7380
GL12,520.3104−118.692510,853.7322−102.893412,169.5821−115.3676
WL144.0513−3.4011116.8646−2.7592144.0513−3.4011
WTR3110.2650−7.83793280.9938−8.26813264.5466−8.2267
STM7038.42667106.02088876.19736366.89638461.87736069.7046
UL28.0197−0.001433.3116−0.001724.4636−0.0012
Total186,728.61424527.3820186,728.61423736.1053186,728.61423481.6632
Notes: CL means cropland, FL means forestland, GL means grassland, WL means wetland, WTR means water, STM means settlement, and UL means unused land.
Table 8. LUDD under different scenarios from 2020 to 2030.
Scenario TypeCLFLGLWLWTRSTMUL
BL_Scenario−0.13%0.21%−1.34%−1.85%0.54%2.61%1.87%
CN_Scenario−0.12%0.02%−0.29%00.49%2.02%−1.29%
Notes: CL means cropland, FL means forestland, GL means grassland, WL means wetland, WTR means water, STM means settlement, and UL means unused land.
Table 9. Comparison of LPI at landscape level under different scenarios from 2020 to 2030.
YearCONTAG (%)COHESION (%)SHDISHEIIJL (%)AI (%)
202058.223499.82771.03970.534349.124583.6265
2030 (BL_Scenario)59.575299.82891.04530.537249.146583.7671
2030 (CN_Scenario)59.910699.82711.05890.544249.779184.2582
Notes: CONTAG means contagion, COHESION means patch cohesion index, SHDI means Shannon’s diversity index, SHEI means Shannon’s evenness index, IJL means interspersion Juxtaposition index, and AI means aggregation index.
Disclaimer/Publisher’s Note: The statements, opinions and data contained in all publications are solely those of the individual author(s) and contributor(s) and not of MDPI and/or the editor(s). MDPI and/or the editor(s) disclaim responsibility for any injury to people or property resulting from any ideas, methods, instructions or products referred to in the content.

