Article

Changes and Driving Forces of Urban–Agricultural–Ecological Space in the Yangtze River Economic Belt from 2000 to 2020

1
School of Urban Design, Wuhan University, Wuhan 430072, China
2
China Institute of Development Strategy and Planning, Wuhan University, Wuhan 430072, China
*
Author to whom correspondence should be addressed.
Land 2023, 12(5), 1014; https://doi.org/10.3390/land12051014
Submission received: 5 April 2023 / Revised: 29 April 2023 / Accepted: 2 May 2023 / Published: 5 May 2023

Abstract

:
Optimizing the urban–agricultural–ecological space in the Yangtze River Economic Belt is integral to China’s sustainable land development and protection. Based on land use data from 2000 to 2020, this study identified the urban-agricultural-ecological space in the Yangtze River Economic Belt. It analyzed its changes and driving forces using the land use transfer matrix, the Dagum Gini coefficient, and GeoDetector. The results show that urban space has increased significantly over the past 20 years, agricultural space has decreased dramatically, and ecological space has remained stable. The transformation of agricultural space into urban space was the dominant type of space transformation, followed by a mutual transformation between agricultural and ecological spaces. Each transformation type exhibited significant spatial inequality within and between regions. Socioeconomic and natural conditions significantly impacted the spatial transformation, and all factors have an apparently interactive reinforcing effect. The research has enhanced the identification accuracy of urban–agricultural–ecological spaces, precisely illustrating the changes and driving forces of the land spatial pattern in the Yangtze River Economic Belt over the last two decades. It holds vital theoretical and practical implications for the optimization of China’s land spatial pattern.

1. Introduction

The development of human society has come at a high cost to natural resources, and the use of land—the most essential natural resource—has been strongly linked to changes in social development [1]. In the last 20 years, the rapid growth of the human population has led to an increased demand for urban housing, industrial space, and grain consumption. This demand has resulted in conflict over using large-scale urban, agricultural, and ecological spaces [2]. To address this issue, the Chinese government implemented a spatial plan in 2019 that unified existing spatial management plans and established a spatial function control approach. This approach focuses on urban–agricultural–ecological spaces (three zones and three lines) as the core elements of land use [3]. The critical challenge for land space management in China is controlling the expansion of urban space into productive farmlands and natural ecological spaces. Ensuring that agricultural and environmental spaces provide the basic guarantees of grain security, regional resilience, and safe water supplies is critical. This issue is at the forefront of land-space management efforts in China [4,5].
Accurately identifying space types and measuring their evolutionary characteristics are fundamental tasks in the study of urban–agricultural–ecological spaces. Numerous studies have utilized spatial analysis techniques to merge land use data into urban–agricultural–ecological spaces according to specific rules, followed by analyzing the evolutionary characteristics of a particular region [6,7,8]. Research in China has found that the transformation of agricultural and ecological spaces has been the predominant type of land space transformation in China over the past two decades [9]. Additionally, the expansion of urban space has resulted in a significant loss of agricultural and ecological space [10]. Notably, the spatial changes in the Yangtze River Economic Belt, which is China’s most important strategic region [11], have been a topic of research interest. While studies have analyzed changes in the three types of space, research on the identification of urban, agricultural, and ecological spaces is limited. Mere merging of land use data is insufficient in effectively and logically classifying spatial functions, particularly at a granular level [12]. Moreover, as a land classification method that applies to both large and medium scales, conducting regional comparisons to analyze the evolutionary characteristics of urban-agricultural-ecological spaces is integral [13]. Nevertheless, previous research has insufficiently analyzed the variances and origins of spatial evolution at the regional level.
Examining the factors that drive spatial changes is crucial in comprehending the process of spatial formation and devising efficient methods of management and regulation. The driving forces of urban–agricultural–ecological space change have complex characteristics with multiple dimensions and levels. Quantitative analysis typically employs social and economic factors, natural conditions, and locational and transportation factors, while policy and engineering factors are commonly analyzed qualitatively [14,15,16]. For rapidly developing China, socioeconomic development drives the expansion of urban space. At the same time, the ecological space with certain traffic and natural conditions has been developed into agricultural space to meet the increasing demand for grain. In addition, due to the acceleration of institutional reform, migration from areas with poor natural and locational conditions to cities leads to the abandonment of agricultural land, which is subsequently reclaimed as ecological space [17]. However, previous research lacks a sufficient quantitative analysis of policy factors and has a limited depth in analyzing spatial differentiation characteristics and the driving forces behind them.
An increasing number of analytical methodologies are being incorporated into the research of urban–agricultural–ecological spaces. Dagum proposed a method of using a Gini coefficient calculation based on subgroup decomposition [18]. Compared with the traditional Gini coefficient and Theil index, this method can measure the main sources of regional disparities, while taking into account the cross-overlap of samples and the distribution of sub-samples [19]. This provides a new perspective for quantitatively measuring inter-regional differences in spatial changes. In addition, the Optimal parameters-based Geographical Detector (OPGD) model can effectively reveal the different impacts of various factors on spatial distribution [20]. Compared with the traditional Geographical Detector (GD) model, the OPGD overcomes the shortcomings of spatial data discretization and the scale effect, which are usually determined by experience [21]. It is suitable for studying the driving forces of land use evolution in regional areas, and also provides a new method for the in-depth analysis of the interaction among urban–agricultural–ecological spatial driving forces.
The Yangtze River is a critical waterway in China, often called one of the country’s main rivers. The Yangtze River Economic Belt, located along the river basin, is home to more than half of China’s population and Gross Domestic Product (GDP) in the 21st century. It is also the country’s most dynamic area for socioeconomic growth and land use change [22]. The significant differences between these regions resulted in a considerable differentiated spatial impact of various drivers on land use transformation. As the population grows in the Yangtze River Economic Belt, understanding the relationship between the social change and urban–agricultural–ecological space transformation is crucial for sustainable land use development and protection. Based on the land usage data of the Yangtze River Economic Belt from 2000 to 2020, this study aims to accurately identify urban–agricultural–ecological spaces using the Dagum Gini coefficient and OPGD, as well as investigate regional differences and driving mechanisms of the transformation of these spaces in the eastern, central, and western parts of the Yangtze River Economic Belt.

2. Materials and Methods

2.1. Study Area

The Yangtze River Economic Belt consists of 11 provincial administrative regions in China with a total land area of approximately 2.05 million square kilometers, accounting for approximately one-fifth of China’s land area. The region includes Sichuan, Yunnan, Guizhou, and Chongqing in the west; Hunan, Hubei, and Jiangxi in the center; and Anhui, Jiangsu, Zhejiang, and Shanghai in the east, with an altitude gradient from west to east (see Figure 1). The period of 2000 to 2020 was chosen as the research timeframe because during this period, the population and GDP of the Yangtze River Economic Belt increased significantly. The population of the Yangtze River Economic Belt increased from 573 million to 606 million, and the GDP grew from CNY 17.86 trillion to CNY 47.16 trillion. From 2000 to 2020, the growth contributed to 46.03% and 48.50% of China’s population and GDP, respectively, resulting in an increase of 0.33 billion people and CNY 29.30 trillion (equivalent to USD 4.24 trillion). The past two decades have been characterized by a pronounced trend of high-speed development, significant land use changes, and consistent national policy support in the region.

2.2. Data Sources

This research mainly used the 2000 and 2020 China’s Multi-Period Land Use Land Cover Remote Sensing Monitoring Dataset (CNLUCC) [23] with a spatial resolution of 100 m as the basis for identifying urban–agricultural–ecological spaces. In addition, the data used to describe the socioeconomic development in the study of spatial transformation mechanisms is sourced from the statistical yearbooks of different prefecture-level cities located in the Yangtze River Economic Belt. Furthermore, the data for average height, slope, and terrain undulation were processed based on the Digital Elevation Model (DEM) data of the Yangtze River Economic Belt. Precipitation and temperature data were sourced from the CRU TS Monthly High-Resolution Gridded Multivariate Climate Dataset [24]. In addition, county boundaries, government sites, roads, and rivers were obtained from a 1:1 million Chinese-based geographic database (www.webmap.cn, accessed on 1 February 2023).

2.3. Methods

2.3.1. Identification of Urban–Agricultural–Ecological Spaces

Most research on urban–agricultural–ecological spaces uses land use reclassification as the study base map. Generally, the urban space mainly includes the artificial surface, while the agricultural space mainly refers to arable land that can produce a large amount of food. Other types, such as forest and grassland, are classified as ecological space. Still, this method does not determine the over-calculation of urban space due to the mixed countryside in agricultural and ecological spaces, or the problem of secondary calculation of distorted element edges caused by distorted remote sensing images. As a result, the accuracy of the results is reduced [25].
To address these issues, this study first reclassified the LUCC map into a basic urban–agricultural–ecological space map based on previous studies. The study area was divided into 2.05 million km grids, and the urban–agricultural–ecological space attributes of each grid were calculated using majority zonal statistics. This approach effectively eliminated scattered village patches distributed in agricultural and ecological spaces, eliminated the interference of edge double counting caused by image distortion [26], and significantly improved the accuracy of the space transformation calculations. In addition, because the grid carried administrative division information, space changes could be quickly counted based on the administrative divisions.
This research used the QGIS software to perform this process. The first step was to use the Create Grid function to establish kilometer grids covering the study area. Then, the Zonal Statistics function was used to calculate the majority of urban, agricultural, and ecological land uses for each grid, which determined the functional spatial type of each grid. QGIS is capable of completing the zonal statistic operation for 2.05-million-kilometer grids more rapidly.

2.3.2. The Transfer Matrix of Space Change

The land use transfer matrix is a matrix of relationships based on the land use status of the same area at different times and is the most basic land use research method [27]. Based on the identification of the urban-agriculture-ecological space (represented as U, A, E), this study focuses on the mutual transformation of three types of spaces, including the transformation from urban space to agricultural space (U→A), from urban space to ecological space (U→E), from agricultural space to urban space (A→U), from agricultural space to ecological space (A→E), from ecological space to urban space (E→U), and from ecological space to agricultural space (E→A).
S i j = { S u u S u a S u e S a u S a a S a e S e u S e a S e e
where S i j denotes the transformed land use area ( i , j = u , a , e ), and u ,   a ,   e represent the urban, agricultural, and ecological spaces, respectively.

2.3.3. Dagum Gini Coefficient

The Dagum Gini coefficient is a useful tool for measuring the disparities in urban–agricultural–ecological space transformation [28] among the eastern, central, and western regions. Compared to traditional Gini coefficients and Theil indices, the Dagum Gini coefficient considers the distribution of subsamples and the issue of sample overlap, allowing for a more accurate analysis of the regional differences within and between regions. The Dagum Gini coefficient not only calculates the overall Gini coefficient G, but also decomposes it into regional difference contributions ( G w ), inter-regional difference contributions ( G n b ), and an unbalanced contribution ( G t ) that reflects the overlap between samples in different regions.
G = G w + G n b + G t
This article is based on the calculation principles of the Dagum Gini coefficient [18] and implements the calculation code in R (Version 4.2.3).

2.3.4. Optimal Parameters-Based Geographical Detector (OPGD) Model

The basic idea of the OPGD model is that if an independent variable significantly impacts a dependent variable, the independent and dependent variables should have similar spatial distribution characteristics. This paper analyzes the effects of single factors and the interaction effects among factors using the factor detector and interaction detector modules. The calculation code was composed and executed utilizing the “gdm()” function, which is incorporated in the ‘GD’ package, within R (Version 4.2.3).
The factor detector is mainly used to detect the extent to which an independent variable explains the spatial variation of a dependent variable, using q as a measure:
q = 1 h = 1 L N h σ h 2 N σ 2
where q represents the strength of the factor’s influence, ranging from [0, 1]. The larger the q value, the stronger the factor’s impact on the dependent variable; h = 1 , 2 , 3 , L is the number of factor classifications and partitions, N h and N represent the number of calculation units in layer h and the whole area, and σ h 2 and σ 2 represent the variance of the dependent variable in layer h and the whole area.
Interaction detection was used to quantitatively characterize the relationship between two independent variables and the pattern of the dependent variable. The steps in the calculation were to first calculate the q values of the different factors and compare them with the q values after their interaction to determine whether their interaction was enhanced, independent, or weakened.
Regarding the selection of driving factors, previous research has shown that the evolution of urban–agricultural–ecological spaces is generally influenced by a combination of natural conditions and socioeconomic factors [29,30,31]. At the same time, China’s unique system results in policy factors playing a particularly significant role in driving spatial change [32]. Additionally, location and transportation factors play a prominent driving role in the agricultural and urban space changes [33,34]. Therefore, based on the traditional factor selection dimensions, this study comprehensively considers the characteristics of the Chinese system and the Yangtze River Economic Belt region, and selects four categories and 24 factor indicators, including policy (X1–X5), natural conditions (X6–X10), location and transportation (X11–X15), and economic and socioeconomic factors (X16–X24), to analyze the transformation of six types of urban–agricultural–ecological spaces. Conventional models use multiple cross-sectional data to explore spatial differentiation, which is beneficial for determining the degree of influence of factors, but poorly measures the direction of factor effects. Therefore, in this study, both the dependent variable (transformation quantity) and the independent variables (such as population and economy) with significant partial variations were taken as the change quantity for detection. This change in the data can effectively improve the usage scenario of the OPGD model from the data level, especially in the field of detecting spatial change drivers. The names and data sources of the selected factors are shown in Table 1.

3. Results

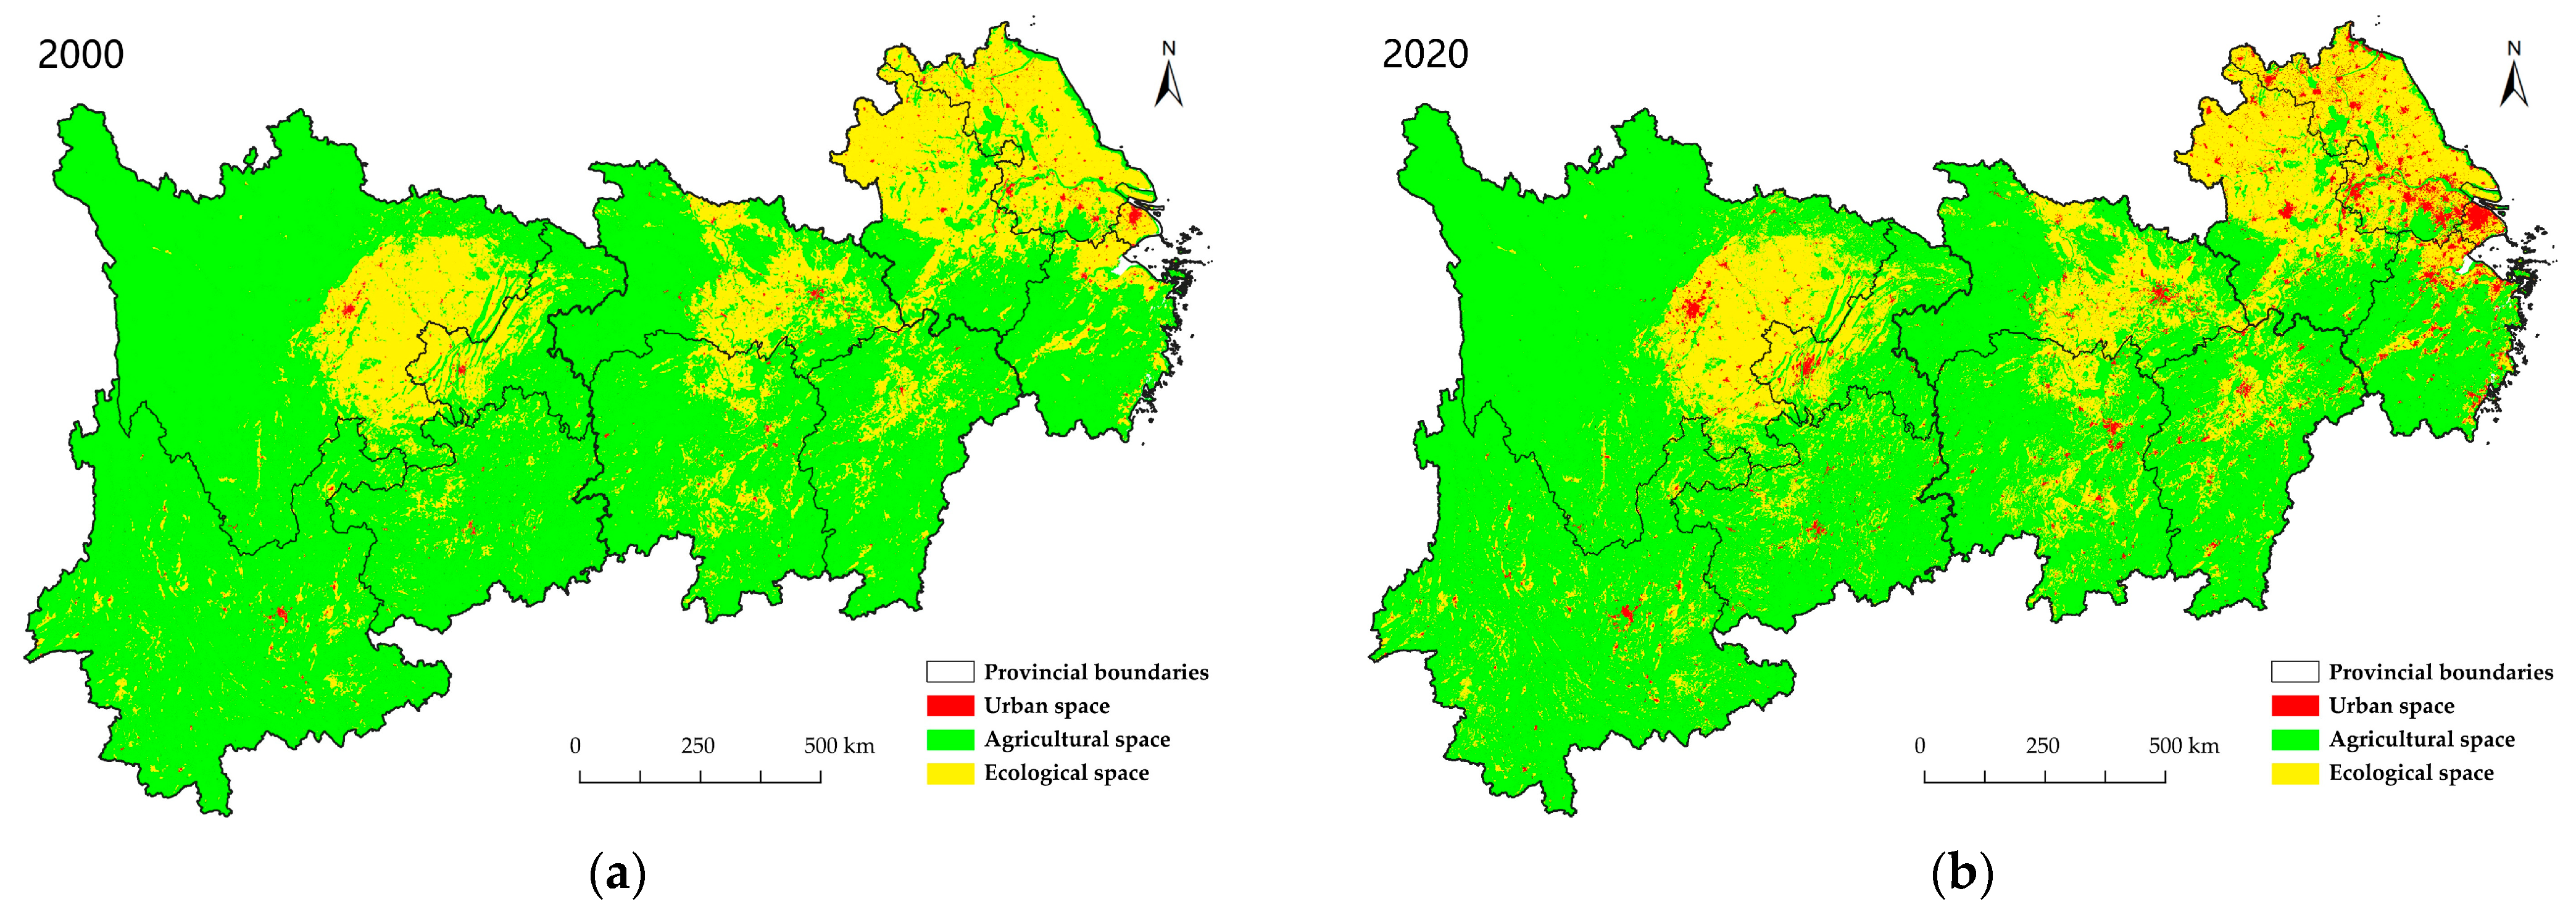
3.1. Distribution Characteristics of Urban–Agricultural–Ecological Space

The distribution characteristics of the urban–agricultural–ecological space appeared stable and exhibited clear patterns. Urban areas are mainly concentrated in major cities and their surrounding regions. In contrast, agricultural areas are primarily located in the Sichuan Basin, Jianghan Plain, and the southern portion of the North China Plain. In contrast, ecological areas tend to be in highly mountainous and hilly regions.
In the past two decades, the land area of the Yangtze River Economic Belt has increased by 1795 km2, mainly because of the silting of river mouths and the subsequent reclamation activities along the coast of Jiangsu. The proportion of urban space to the total space increased by 1.6%, with an area increase of 33,358 km2, whereas the proportion of agricultural space to the total space decreased by 1.4%, with an area decrease of 28,882 km2. The proportion of ecological space remained stable at approximately 70% for a long time, with a decrease of 119 km2 (Table 2).
Regarding the spatial distribution of areas with growth in different types of space (see Figure 2), the regions with significant growth in urban space were concentrated mainly in the eastern provinces of Jiangsu, Zhejiang, and Anhui, as well as in the capital cities of the central and western provinces. Significant reductions in the agricultural spaces characterize these areas. Conversely, the areas with increased agricultural space were primarily in highly mountainous areas with poor topographic conditions in the central and western regions. In terms of ecological space, significant decreases were in the provinces south of the Yangtze River. In contrast, significant increases were observed in the hinterland areas of several large cities throughout the region.

3.2. Distribution Characteristics of Transformation of Urban–Agricultural–Ecological Space

Based on the inter-transformation of urban–agricultural–ecological space data (Table 3), it is evident that over the past 20 years, the most significant type of transformation in the Yangtze River Economic Belt has been the transformation of agricultural space to urban space, accounting for 33.92% of the total transformation data. This was followed by the mutual transformation of agricultural and ecological spaces, which accounted for 56.10% of the total transformation data, with 2.23% of the land eventually transforming into an ecological space. However, the proportion of ecological spaces that were transformed into urban spaces was relatively low, accounting for 8.04% of the total change. Additionally, the proportion of urban space restored to agricultural and ecological space was minimal, at most 2.00%.
Figure 3 and Figure 4 shows that the urbanization of the agricultural space in the Yangtze River Economic Belt was primarily concentrated in the same areas as urban growth, which are mainly located in the eastern region, and major cities in the central and western parts of the region. Meanwhile, the urbanization of the ecological space was primarily concentrated in the coastal areas of Jiangsu and the provinces south of the Yangtze River in the central and eastern parts of the region. The transformation of agricultural and ecological spaces had a similar spatial distribution. It could be observed in many counties in the central and western regions (excluding the Sichuan Plain and the western Sichuan Plateau). The only difference was that the transformation of ecological space into agricultural space was more prevalent in the coastal areas of Jiangsu Province and throughout Jiangxi Province.
In contrast, transforming agricultural space into an ecological space was rare in these areas. As a result, the restoration of urban spaces to agricultural and environmental spaces has a limited spatial distribution. The urban restoration of agricultural space was mainly observed in the Jiang-Han Plain of Hubei and the southern part of the North China Plain. In contrast, the urban restoration of ecological space was primarily limited to the Jiang-Han Plain of Hubei.

3.3. Regional Differences in Spatial Transformation among the Eastern, Central, and Western Regions

According to the analysis of the Dagum Gini coefficient (Table 4), among the six types of spatial transformation, the overall difference in restoring urban space to ecological and agricultural spaces was the largest, followed by the development of ecological and agricultural spaces into urban spaces. However, the difference was the smallest in the mutual transformation between agricultural and environmental spaces. Furthermore, according to the decomposition of the overall Gini coefficient, it can be seen that the contribution of inter-regional differences in the transformation of agricultural space into urban areas to the overall Gini coefficient was much greater than that of the intra-regional differences. Moreover, the contribution rates of intra- and inter-regional differences to the overall differences in the other regions were equal.
The differences between the east and west were greater than those between the central and east and central and west in the five transformation types: the urbanization of agricultural and ecological space, inter-transformation of agricultural and ecological space, and restoration of urban space to ecological space. Regarding the urbanization of agricultural space and inter-transformation of agricultural and ecological spaces, the differences between the eastern and central regions were more significant than those between the central and western regions. Regional differences were particularly noticeable, with expanding gradients in the eastern, central, and western regions.

3.4. Driving Forces of Land Cover Change

3.4.1. Single Factor Analysis

The Q values for each driving factor are listed in Table 5. The results indicated that the impact of each factor was stronger in the transformation from agricultural to urban spaces and weaker in other space conversions. They had little effect on the transformation from urban to ecological spaces.
In the transformation from agricultural and ecological spaces to urban spaces, the most dominant factors were socioeconomic factors, followed by policy and natural condition factors, both with similar strengths. In contrast, the location and transportation factors had the least impact. In the interactive transformation between agricultural and ecological space, natural condition factors had the greatest impact, followed by socioeconomic factors, location and transportation factors, and policy factors, with the impacts of the latter three being the same. In addition, within the natural conditions and socioeconomic impact factors, the influence of terrain-related factors (X6, X7, and X8) was always greater than that of climate-related factors (X9 and X10), while the influence of economic factors (X18, X19, X20, and X21) was always greater than that of population-related factors (X16, X17, and X22).

3.4.2. Factor Interactions

An interactive analysis of geographic detectors can evaluate whether the explanatory power of two factors is enhanced, weakened, or independent. In Figure 5, the dots represent the magnitude of the interaction between the factors on the horizontal and vertical axes. The size of the dot indicates the strength of the interaction, with larger dots representing stronger interactions, while the color of the dot indicates the different types of interactions. The results of the study showed that in various spatial transformations, most factors showed a significant interactive enhancement effect, except for the interactive weakening characteristics of the secondary industry added value (X20) and the distance from railways (X13) in the agricultural space transformed into urban space, as well as the ecological function zoning (X2) and agricultural development zoning (X4) in the ecological space transformed into urban space.
In the transformation from agricultural space to urban space and from reclaimed urban space to agricultural space, socioeconomic factors and other types of factors both showed a strong interactive enhancement effect, followed by an interaction between the influence of natural conditions and other factors. Regarding the interactions between the agricultural and ecological spaces, In the interactive transformation of agricultural and ecological space, the interaction between natural and other types of factors was stronger than the interaction between other factors. Additionally, three socioeconomic factors, namely the added value of the primary industry (X19), the total power of agricultural machinery (X23), and fiscal expenditure (X24), also had a strong interactive enhancement effect. Finally, the interaction between the national forestry engineering (X5), distance from railway (X13), and other factors was stronger in the transformation from ecological to urban space. In contrast, in the transformation from urban to ecological space, only the interactions between the total population (X6), the total output value of the primary industry (X19), and other factors were stronger.

4. Discussion

This study analyzed the spatial patterns and driving factors of land use change in the Yangtze River Economic Belt and drew relevant conclusions based on empirical data, revealing the interrelationships between urbanization, agricultural development, and ecological protection. The space identification method used in this study effectively distinguished the urban–agricultural–ecological spaces. Furthermore, the Dagum Gini coefficient accurately measured the differences within and between regions and their contributions to the overall difference. The OPGD tool overcame the shortcomings of the traditional GeoDetector’s subjective discretization of the data [20] and more effectively detected the impact of different factors on the spatial transformation, closely linking urban–agricultural–ecological space changes with human socioeconomic behavior. These findings have significant theoretical and practical implications.
Using reclassification to determine the urban–agricultural–ecological space can result in an exaggeration of the transferred land area of various types, and the more land use types are considered, the more obvious this exaggeration will be. This will seriously affect the calculation of the intensity of land use changes as well as the proportion of different types of spatial conversions. This study employed a kilometer-based grid method for identifying urban–agricultural–ecological spaces, which not only resolved the issue of the secondary patch calculation but also eliminated the interference of village patches on agricultural-ecological space identification, presenting an accurate evolution pattern of urban–agricultural–ecological spaces in the Yangtze River Economic Belt.
Over the past two decades, China has become the fastest urbanizing country in the world, and the Yangtze River Economic Belt is undoubtedly the main driver of this process. In the inter-transformation of urban–agricultural–ecological space throughout the Yangtze River Economic Belt, one-third of the spatial changes involve the development of agricultural space into urban space, one-tenth of the ecological space into urban space, and more than half of the mutual transformation between agricultural and ecological spaces, resulting in the abandonment of 2.23% of farmland. This reflects the transforming effect of China’s continuous industrialization and urbanization on the spatial functions of land.
The distribution characteristics of the comprehensive spatial transformation and the Dagum Gini coefficient results indicate that the export-oriented economic structure has profoundly impacted the spatial pattern of the urban–agricultural–ecological space in the Yangtze River Economic Belt [35]. Cities closer to the coastline have converted more land into urban spaces to support the development of a manufacturing- and export-oriented economy [36]. The degree of funding for various types of urban spaces varies significantly. The gradient between the eastern, central, and western regions is expanding, with severe imbalances between key cities and small- and medium-sized cities within each region.
Rapid urbanization and industrialization have brought about significant issues regarding grain security, ecological protection, and coordinated regional development [11]. Urbanization not only occupies a large amount of agricultural space but also leads to the transfer of a large number of workers from the agricultural sector [37] because of China’s grain import and price control policies [38], resulting in the abandonment of a large amount of arable land. In the central and southern regions of the Yangtze River Economic Belt, the demand for urbanization and poor terrain conditions have led to the invasion of a large amount of ecological space for urbanization development, damaging the region’s environmental integrity. Furthermore, in western and remote areas, uneven development rights exist among those who need the skills to participate in the urbanization [39], which has led to the reclamation of farmland in ecologically sensitive areas. The Chinese government now recognizes these problems, and there is a clear plan to address them in the future development of the Yangtze River Economic Belt.
According to the mechanism analysis of the spatial transformation of urban–agricultural–ecological spaces based on the geographical detector, socioeconomic factors have the strongest impact on the inter-transformation of urban–agricultural–ecological spaces, followed by policy and natural conditions. However, location and transportation had the most negligible impact. In addition, there was a strong interactive amplification effect between different factors, primarily the socioeconomic and natural conditions. This suggests that, in future Chinese land management policies, integrated social and economic development should be adopted to develop and protect land while controlling it. Furthermore, according to the interaction analysis results, it is necessary to set different strategies for managing urban–agricultural–ecological spaces in different cities based on their natural geographic conditions and social and economic development stages.
Previous research on the land use change in the Yangtze River Economic Belt has often emphasized mutual conversions among different land types [40]. However, compared to this study, such research has limitations in reflecting the interactive relationship between urban development and agricultural ecological protection. It needs to focus on the feedback loop between human behavioral changes and changes in land use. In addition, the urban–agricultural–ecological space identification method adopted in this study effectively identified newly added rural homesteads of approximately 3000 square kilometers into the agricultural space, which provided a more accurate estimation of the total amount of land used for urban development than previous studies [41]. With more accurate urban spatial data obtained, this study found that the influence of economic development factors was more significant than that of the population development factors. In contrast, previous studies [42] found the opposite, consistent with the characteristics of human land use development behavior being more closely related to economic development from the perspective of urban–agricultural–ecological space.
This study highlighted the significant risks to grain and ecological security resulting from the overdevelopment of urban areas from 2000 to 2020. To mitigate these risks, governments should develop strategies to limit how urban spaces encroach on agricultural and environmental areas. Furthermore, to achieve China’s long-term ecological development goals, it is necessary to reform land finance policies over time [43] and provide more guidance for land use. With the population and industries shifting toward the western regions, large-scale agricultural space development has emerged as a concern for ecological protection in the west. Policies promoting regional ecological compensation, supporting industries, and land use in the west [44] can help manage the ecological risks in the region. Finally, the study found that the transfer of agricultural and urban space to urban space is characterized by a “one-way valve,” where the behavior of restoring inefficient and abandoned urban space to agriculture and ecological space only occurs in small amounts in economically developed areas located north of the Yangtze River in central and eastern China. Planning the cultivation and ecological restoration of urban spaces throughout the Yangtze River Economic Belt is necessary to ease the tension between urban development, agriculture, and ecological protection.
However, this study had some limitations. For example, the current urban–agricultural–ecological space identification algorithm based on the mode has oversimplified assumptions. Additional data and methods, such as Open Street Map (OSM) data [45], adjacent analysis [46], and a landscape index [7] could be incorporated for more precise identification. In addition, different driving relationships may exist in different regions [47]. A better classification and discussion of the driving force differences in the eastern, central, and western regions will illustrate the impact of human social behavior on the spatial changes in the Yangtze River Economic Belt. Furthermore, some studies [48] have pointed out that the accuracy of OPGD requires improvement, and future research can use advanced tools to obtain more precise driving force detection results. Addressing these limitations will be the focus of prospective studies.

5. Conclusions

This study identified the urban–agricultural–ecological space of the Yangtze River Economic Belt in 2000 and 2020, analyzed the transformation characteristics of the two years using transfer matrix, Dagum Gini coefficient, and GeoDetector methods, and explained the regional differences and driving forces of the urban–agricultural–ecological space in the Yangtze River Economic Belt. The results showed that the proportion of urban space increased by 1.6% (33,358 km2), that of agricultural space decreased by 1.4% (28,882 km2), and that of ecological space remained stable, decreasing by only 0.1% (119 km2). Among them, the transformation of agricultural space to urban space was the most significant, accounting for 33.92% of the total transformation data, followed by the mutual transformation between agricultural and ecological spaces, which accounted for 56.10% of the total transformation data. The transformation of ecological space to urban space accounted for 8.04% of the total space. The space transformation showed significant inequalities within and between regions, with an obvious agglomeration of agricultural and ecological space urbanization towards the central areas in the eastern and western regions, and the difference gradient between the agricultural and ecological space regions in the east–central–western regions expanding. Socioeconomic factors have the greatest impact on transforming agricultural spaces into urban spaces. In contrast, natural factors have the greatest impact on the mutual transformation of agricultural and ecological spaces. All the influencing factors exhibited a relatively strong interactive enhancing effect. To optimize the utilization of territorial space in the Yangtze River Economic Belt, the Chinese government should gradually advance the reform of land finance policies, reduce urban development on agriculture and ecological space, and use policies such as ecological compensation to slow down the large-scale ecological space cultivation in western regions. Additionally, promoting the overall urban space reclamation and ecological restoration in the Yangtze River Economic Belt is necessary.

Author Contributions

Conceptualization, J.X. and W.W.; Methodology, J.X. and W.W.; Software, J.X. and W.W.; Validation, M.H.; Formal Analysis, J.X. and W.W.; Investigation, J.X., M.H., and W.W.; Resources, W.W.; Data Curation, J.X.; Writing—Original Draft Preparation, J.X.; Writing—Review and Editing, J.X. and W.W.; Visualization, J.X. and M.H.; Supervision, W.W.; Project Administration, W.W.; Funding Acquisition, W.W. All authors have read and agreed to the published version of the manuscript.

Funding

This research was funded by the Changjiang River Scientific Research Institute Open Research Program, grant number “CKWV2021864/KY“.

Data Availability Statement

Publicly available datasets were analyzed in this study. Digital elevation model data can be found here: [https://www.gscloud.cn/], accessed on 1 February 2023. Climate data can be found here: [https://crudata.uea.ac.uk/cru/data/hrg/], accessed on 1 February 2023. Land use data can be found here: [http://www.resdc.cn/], accessed on 1 February 2023. The basic geographic information base map can be found here: [http://www.webmap.cn/], accessed on 1 February 2023.

Conflicts of Interest

The authors declare no conflict of interest.

References

  1. Deng, X.; Li, Z. A Review on Historical Trajectories and Spatially Explicit Scenarios of Land-Use and Land-Cover Changes in China. J. Land Use Sci. 2016, 11, 709–724. [Google Scholar] [CrossRef]
  2. Guneralp, B.; Reba, M.; Hales, B.U.; Wentz, E.A.; Seto, K.C. Trends in Urban Land Expansion, Density, and Land Transitions from 1970 to 2010: A Global Synthesis. Environ. Res. Lett. 2020, 15, 044015. [Google Scholar] [CrossRef]
  3. Zhang, S.; Liu, Z.; Wang, Y. Delineation of the “Three Zones and Three Lines” and Optimization of Spatial Layout: Obstacles and Methodological Thinking. Urban Plan. Forum 2022, 2, 12–19. [Google Scholar] [CrossRef]
  4. Ding, M.; Liu, W.; Xiao, L.; Zhong, F.; Lu, N.; Zhang, J.; Zhang, Z.; Xu, X.; Wang, K. Construction and Optimization Strategy of Ecological Security Pattern in a Rapidly Urbanizing Region: A Case Study in Central-South China. Ecol. Indic. 2022, 136, 108604. [Google Scholar] [CrossRef]
  5. Wu, Y.; Shan, L.; Guo, Z.; Peng, Y. Cultivated Land Protection Policies in China Facing 2030: Dynamic Balance System versus Basic Farmland Zoning. Habitat. Int. 2017, 69, 126–138. [Google Scholar] [CrossRef]
  6. Estel, S.; Kuemmerle, T.; Alcantara, C.; Levers, C.; Prishchepov, A.; Hostert, P. Mapping Farmland Abandonment and Recultivation across Europe Using MODIS NDVI Time Series. Remote Sens. Environ. 2015, 163, 312–325. [Google Scholar] [CrossRef]
  7. Gudmann, A.; Csikós, N.; Szilassi, P.; Mucsi, L. Improvement in Satellite Image-Based Land Cover Classification with Landscape Metrics. Remote Sens. 2020, 12, 3580. [Google Scholar] [CrossRef]
  8. Huang, H.; Zhou, Y.; Qian, M.; Zeng, Z. Land Use Transition and Driving Forces in Chinese Loess Plateau: A Case Study from Pu County, Shanxi Province. Land 2021, 10, 67. [Google Scholar] [CrossRef]
  9. Wang, D.; Fu, J.; Xie, X.; Ding, F.; Jiang, D. Spatiotemporal Evolution of Urban-Agricultural-Ecological Space in China and Its Driving Mechanism. J. Clean. Prod. 2022, 371, 133684. [Google Scholar] [CrossRef]
  10. Luo, K.; Zhang, X. Increasing Urban Flood Risk in China over Recent 40 Years Induced by LUCC. Landsc. Urban Plan. 2022, 219, 104317. [Google Scholar] [CrossRef]
  11. Hou, X.; Liu, J.; Zhang, D.; Zhao, M.; Xia, C. Impact of Urbanization on the Eco-Efficiency of Cultivated Land Utilization: A Case Study on the Yangtze River Economic Belt, China. J. Clean. Prod. 2019, 238, 117916. [Google Scholar] [CrossRef]
  12. Cao, Y.; Jiang, Y.; Feng, L.; Shi, G.; He, H.; Yang, J. Identification of Territorial Spatial Pattern Conflicts in Aksu River Basin, China, from 1990 to 2020. Sustainability 2022, 14, 14941. [Google Scholar] [CrossRef]
  13. Li, S.; Congmou, Z.; Li, Y.; Dong, B.; Tan, K.; Deng, X. Agricultural Space Function Transitions in Rapidly Urbanizing Areas and Their Impacts on Habitat Quality: An Urban–Rural Gradient Study. Environ. Impact Assess. Rev. 2023, 99, 107019. [Google Scholar] [CrossRef]
  14. Li, Y.; Li, Y.; Karácsonyi, D.; Liu, Z.; Wang, Y.; Wang, J. Spatio-Temporal Pattern and Driving Forces of Construction Land Change in a Poverty-Stricken County of China and Implications for Poverty-Alleviation-Oriented Land Use Policies. Land Use Policy 2020, 91, 104267. [Google Scholar] [CrossRef]
  15. Hu, Y.; Hu, Y. Land Cover Changes and Their Driving Mechanisms in Central Asia from 2001 to 2017 Supported by Google Earth Engine. Remote Sens. 2019, 11, 554. [Google Scholar] [CrossRef]
  16. Liu, Y.; Hou, X.; Li, X.; Song, B.; Wang, C. Assessing and Predicting Changes in Ecosystem Service Values Based on Land Use/Cover Change in the Bohai Rim Coastal Zone. Ecol. Indic. 2020, 111, 106004. [Google Scholar] [CrossRef]
  17. Subedi, Y.R.; Kristiansen, P.; Cacho, O. Drivers and Consequences of Agricultural Land Abandonment and Its Reutilisation Pathways: A Systematic Review. Environ. Dev. 2022, 42, 100681. [Google Scholar] [CrossRef]
  18. Dagum, C. A New Approach to the Decomposition of the Gini Income Inequality Ratio. Empir. Econ. 1997, 22, 515–531. [Google Scholar] [CrossRef]
  19. Zhang, X.; Liao, K.; Zhou, X. Analysis of Regional Differences and Dynamic Mechanisms of Agricultural Carbon Emission Efficiency in China’s Seven Agricultural Regions. Environ. Sci. Pollut. Res. 2022, 29, 38258–38284. [Google Scholar] [CrossRef]
  20. Song, Y.; Wang, J.; Ge, Y.; Xu, C. An Optimal Parameters-Based Geographical Detector Model Enhances Geographic Characteristics of Explanatory Variables for Spatial Heterogeneity Analysis: Cases with Different Types of Spatial Data. GISci. Remote Sens. 2020, 57, 593–610. [Google Scholar] [CrossRef]
  21. Shen, W.; Li, Y.; Qin, Y.; Cheng, J. Influencing Mechanism of Climate and Human Activities on Ecosystem Health in the Middle Reaches of the Yellow River of China. Ecol. Indic. 2023, 150, 110191. [Google Scholar] [CrossRef]
  22. Yang, B.; Wang, Z.; Zou, L.; Zou, L.; Zhang, H. Exploring the Eco-Efficiency of Cultivated Land Utilization and Its Influencing Factors in China’s Yangtze River Economic Belt, 2001–2018. J. Environ. Manag. 2021, 294, 112939. [Google Scholar] [CrossRef] [PubMed]
  23. Xu, X.; Liu, J.; Zhang, S.; Li, R.; Yan, C. China multi-period land use and land cover monitoring dataset (CNLUCC). Resour. Environ. Sci. Data Regist. Publ. Syst. 2018. [Google Scholar] [CrossRef]
  24. Harris, I.; Osborn, T.J.; Jones, P.; Lister, D. Version 4 of the CRU TS Monthly High-Resolution Gridded Multivariate Climate Dataset. Sci. Data 2020, 7, 109. [Google Scholar] [CrossRef] [PubMed]
  25. Tang, C.; Li, Y.; Du, Y.; Sun, W. The Evolution of Territorial Spatial Structure of Guangdong- Hong Kong-Macao Greater Bay Area from 1980 to 2018. Geogr. Res. 2021, 40, 928–944. [Google Scholar] [CrossRef]
  26. Cui, R.; Wen, M.; Zhang, K.; Sun, C. Contrast Threshold Adaptive Adjustment Algorithm for Remote Sensing Image Matching. J. Appl. Remote Sens. 2021, 15, 036519. [Google Scholar] [CrossRef]
  27. Li, C.; Wu, J. Land Use Transformation and Eco-Environmental Effects Based on Production-Living-Ecological Spatial Synergy: Evidence from Shaanxi Province, China. Environ. Sci. Pollut. Res. 2022, 29, 41492–41504. [Google Scholar] [CrossRef]
  28. Zou, W. Temporal-Spatial Characteristics and Driving Factors of Urban Land Use Performance: Evidence from Guangdong. Pol. J. Environ. Stud. 2022, 31, 3477–3490. [Google Scholar] [CrossRef]
  29. He, C.; Zhang, J.; Liu, Z.; Huang, Q. Characteristics and Progress of Land Use/Cover Change Research during 1990–2018. J. Geogr. Sci. 2022, 32, 537–559. [Google Scholar] [CrossRef]
  30. Hertel, T.W.; West, T.A.P.; Börner, J.; Villoria, N.B. A Review of Global-Local-Global Linkages in Economic Land-Use/Cover Change Models. Environ. Res. Lett. 2019, 14, 053003. [Google Scholar] [CrossRef]
  31. Abu Hatab, A.; Cavinato, M.E.R.; Lindemer, A.; Lagerkvist, C.-J. Urban Sprawl, Food Security and Agricultural Systems in Developing Countries: A Systematic Review of the Literature. Cities 2019, 94, 129–142. [Google Scholar] [CrossRef]
  32. Wang, X.; Li, X. China’s Agricultural Land Use Change and Its Underlying Drivers: A Literature Review. J. Geogr. Sci. 2021, 31, 1222–1242. [Google Scholar] [CrossRef]
  33. Aburas, M.M.; Ahamad, M.S.S.; Omar, N.Q. Spatio-Temporal Simulation and Prediction of Land-Use Change Using Conventional and Machine Learning Models: A Review. Environ. Monit. Assess. 2019, 191, 205. [Google Scholar] [CrossRef]
  34. Ding, R. The Complex Network Theory-Based Urban Land-Use and Transport Interaction Studies. Complexity 2019, 2019, e4180890. [Google Scholar] [CrossRef]
  35. Xuan, C.; Chen, X. City Size Distribution, Export-Oriented Economies, and Regional Technical Efficiency: The Case of China. Emerg. Mark. Financ. Trade 2020, 56, 1474–1489. [Google Scholar] [CrossRef]
  36. Shu, X. An Empirical Analysis for the Promoting Effect of Marine Economy on Sustainable Development of Inland Economy. J. Coast. Res. 2020, 110, 287–290. [Google Scholar] [CrossRef]
  37. Wang, S.; Bai, X.; Zhang, X.; Reis, S.; Chen, D.; Xu, J.; Gu, B. Urbanization Can Benefit Agricultural Production with Large-Scale Farming in China. Nature Food. 2021, 2, 183–191. [Google Scholar] [CrossRef]
  38. Huang, J.; Zhang, F.; Song, J.; Li, W. An Agent-Based Simulation Model of Wheat Market Operation: The Benefit of Support Price. J. Syst. Sci. Syst. Eng. 2022, 31, 437–456. [Google Scholar] [CrossRef]
  39. Chen, Y.; Tan, Y.; Gruschke, A. Rural Vulnerability, Migration, and Relocation in Mountain Areas of Western China: An Overview of Key Issues and Policy Interventions. Chin. J. Popul. Resour. Environ. 2021, 19, 110–116. [Google Scholar] [CrossRef]
  40. Liu, Y.; Zhang, X.; Kong, X.; Wang, R.; Chen, L. Identifying the Relationship between Urban Land Expansion and Human Activities in the Yangtze River Economic Belt, China. Appl. Geogr. 2018, 94, 163–177. [Google Scholar] [CrossRef]
  41. Zhao, C.; Xiao, P.; Qian, P.; Xu, J.; Yang, L.; Wu, Y. Spatiotemporal Differentiation and Balance Pattern of Ecosystem Service Supply and Demand in the Yangtze River Economic Belt. Int. J. Environ. Res. Public Health 2022, 19, 7223. [Google Scholar] [CrossRef] [PubMed]
  42. Cai, W.; Fangyuan, T. Spatiotemporal Characteristics and Driving Forces of Construction Land Expansion in Yangtze River Economic Belt, China. PLoS ONE 2020, 15, e0227299. [Google Scholar] [CrossRef] [PubMed]
  43. Wu, F. Land Financialisation and the Financing of Urban Development in China. Land Use Policy 2022, 112, 104412. [Google Scholar] [CrossRef]
  44. Jiang, Y.; Guan, D.; He, X.; Yin, B.; Zhou, L.; Sun, L.; Huang, D.; Li, Z.; Zhang, Y. Quantification of the Coupling Relationship between Ecological Compensation and Ecosystem Services in the Yangtze River Economic Belt, China. Land Use Policy 2022, 114, 105995. [Google Scholar] [CrossRef]
  45. Schultz, M.; Voss, J.; Auer, M.; Carter, S.; Zipf, A. Open Land Cover from OpenStreetMap and Remote Sensing. Int. J. Appl. Earth Observ. Geoinf. 2017, 63, 206–213. [Google Scholar] [CrossRef]
  46. Latifovic, R.; Pouliot, D.; Olthof, I. Circa 2010 Land Cover of Canada: Local Optimization Methodology and Product Development. Remote Sens. 2017, 9, 1098. [Google Scholar] [CrossRef]
  47. Xia, J.; Wei, W.; Yin, L.; Hong, M.; Bo, L. Evaluation Method of Morphological Efficiency for “Three Functional Spaces” based on Quadtree Algorithm. J. Geo-Inf. Sci. 2023, 25, 450–467. [Google Scholar] [CrossRef]
  48. Zhang, Z.; Song, Y.; Wu, P. Robust Geographical Detector. Int. J. Appl. Earth Observ. Geoinf. 2022, 109, 102782. [Google Scholar] [CrossRef]
Figure 1. The Yangtze River Economic Belt.
Land 12 01014 g001
Figure 2. The urban–agricultural–ecological space spatial pattern: (a) the year 2000, (b) the year 2020.
Land 12 01014 g002
Figure 3. Total amount of changes in urban–agricultural–ecological space from 2000 to 2020: (a) urban space, (b) agricultural space, (c) ecological space.
Land 12 01014 g003
Figure 4. Total amount of the inter-transformation of urban–agricultural–ecological space from 2000 to 2020: (a) A→U, (b) E→U, (c) A→E, (d) E→A, (e) U→A, (f) U→E.
Land 12 01014 g004
Figure 5. The explanatory power of factor interactions. (a) A→U, (b)E→U, (c) A→E, (d) E→A, (e) U→A, (f) U→E.
Land 12 01014 g005
Table 1. The policy, natural conditions, locational transportation, and socio-economic factors.
Factor DimensionDriving FactorsData Source
PolicyX1Main Functional AreaChina’s national and provincial main functional areas planning
X2Ecological functional areasChina’s ecological function zoning
X3Urban Cluster Development PlanningPlanning of urban agglomeration level in China’s 14th Five-Year Plan
X4Sustainable Agricultural Development PlanningChina’s National Agricultural Sustainable Development Plan (2015–2030)
X5National Forestry ProjectThe significant national forestry project in China
Natural conditionsX6Average Elevation (m)Calculate the mean of DEM data within the statistical area
X7Average Slope (°)Convert the DEM data into SLOPE data and calculate the average slope of the statistical area
X8Terrain undulation degree (m)Calculate the range of DEM data within the statistical area
X9Average precipitation (mm)Calculate the mean of precipitation grid data within the statistical area
X10Average temperature (°)Calculate the mean of temperature grid data within the statistical area
Location and transportationX11Distance to provincial capital city (m)Calculate the mean distance from the statistical area to the provincial capital cities
X12Distance to prefecture-level city center (m)Calculate the mean distance from the statistical area to the prefecture-level cities
X13Distance to railroad (m)Calculate the mean distance from the statistical area to the railroad
X14Distance to major highways (m)Calculate the mean distance from the statistical area to the major highways
X15Distance to major rivers (m)Calculate the mean distance from the statistical area to the major rivers
Socioeconomic factorsX16Change in population size (people)Calculate the interpolation of the statistical yearbook data for the period of 2000–2020 in the statistical area.
X17Change in urbanization rate (%)
X18Change in gross regional product (CNY)
X19Change in value added of primary industry (CNY)
X20Change in value added of secondary industry (CNY)
X21Change in value added of tertiary industry (CNY)
X22Change in average population density (people per km2)
X23Change in total power of agricultural machinery (kWh)
X24Change in fiscal expenditure (CNY)
Table 2. Urban–Agricultural–Ecological Space in the Yangtze River Economic Belt (km2).
YearUrban SpaceAgricultural
Space
Ecological SpaceTotalProportion
200018,196600,4571,439,3292,057,9830.9:29.2:69.9
202051,554571,5751,436,6482,059,7782.5:27.8:69.9
Table 3. Inter-transformation of urban–agricultural–ecological space data.
Transformation TypeA→UE→UE→AA→EU→AU→E
Area (km2)28,198.036678.7722,388.2324,242.171146.96458.98
Note: U, urban space; A, agricultural space; E, ecological space.
Table 4. The result of the Dagum Gini coefficient.
A→UE→UA→EE→AU→EU→A
Total   G 0.65350.70360.52490.55840.87010.8526
G w Eastern0.46550.74320.59060.68920.87220.8055
Central0.54950.56960.44500.43990.86510.8304
Western0.65640.70530.48470.50280.83530.8569
G n b Eastern–Central0.70180.67560.57040.6640.88580.8194
Central–Western0.61060.69830.47730.47970.87950.8947
Eastern–Western0.75850.78410.62280.70220.85780.8875
Contribution rate G w 24.90%30.19%33.26%32.26%32.24%30.18%
G n b 59.40%33.51%33.25%33.35%29.01%32.59%
G t 15.70%36.30%33.49%34.39%38.76%37.23%
Table 5. The Q value of each factor varied for space transformations from 2000 to 2020.
A→UE→UE→AA→EU→EU→A
X10.32 ***0.04 ***0.08 ***0.06 ***0.000.04 ***
X20.03 ***0.01 *0.07 ***0.07 ***0.000
X30.08 ***0.000.05 ***0.04 ***0.000.02 **
X40.15 ***0.07 ***0.08 ***0.09 ***0.000.09 ***
X50.31 ***0.14 ***0.09 ***0.06 ***0.000.05 ***
Avg.0.180.050.070.060.000.04
X60.35 ***0.06 ***0.16 ***0.16 ***0.010.11 ***
X70.32 ***0.05 ***0.11 ***0.12 ***0.010.11 ***
X80.23 ***0.03 ***0.17 ***0.16 ***0.000.07 ***
X90.05 ***0.07 ***0.04 ***0.04 ***0.02 ***0.04 ***
X100.05 ***0.04 ***0.02 ***0.02 **0.01 **0.03 ***
Avg.0.200.050.100.100.010.07
X110.09 ***0.02 ***0.1 ***0.1 ***0.010.02 ***
X120.06 ***0.010.06 ***0.06 ***0.000.01 *
X130.03 ***0.11 ***0.04 ***0.04 ***0.02 **0.02 **
X140.06 ***0.02 ***0.1 ***0.08 ***0.01 *0.02 **
X150.13 ***0.02 ***0.05 ***0.06 ***0.02 **0.01
Avg.0.070.040.070.070.010.01
X160.18 ***0.05 ***0.02 **0.02 ***0.010.01 **
X170.02 **0.03 ***0.04 ***0.03 ***0.010.02 ***
X180.48 ***0.08 ***0.05 ***0.05 ***0.01 **0.09 ***
X190.05 ***0.02 ***0.18 ***0.19 ***0.02 ***0.11 ***
X200.49 ***0.09 ***0.04 ***0.03 ***0.02 **0.1 ***
X210.4 ***0.07 ***0.07 ***0.06 ***0.01 **0.08 ***
X220.29 ***0.07 ***0.12 ***0.11 ***0.010.07 ***
X230.11 ***0.07 ***0.15 ***0.14 ***0.010.19 ***
X240.43 ***0.04 ***0.05 ***0.05 ***0.01 *0.07 ***
Avg.0.270.0570.080.0780.0120.082
* represents significance at the 95% confidence level, ** represents significance at the 99% confidence level, *** represents significance at the 99.9% confidence level.
Disclaimer/Publisher’s Note: The statements, opinions and data contained in all publications are solely those of the individual author(s) and contributor(s) and not of MDPI and/or the editor(s). MDPI and/or the editor(s) disclaim responsibility for any injury to people or property resulting from any ideas, methods, instructions or products referred to in the content.

