1. Introduction
Humans are increasingly changing ecosystems around the world. In the past, human–nature relationships were often governed by balancing anthropogenic pressures to accelerate technological and economic development with maintaining ecosystem functionality and resilience [
1]. Recently, human-induced changes, such as land-use change and climate variability, have led to widespread reductions in benefits to local communities (i.e., ecosystem services) [
2]. The complex landscapes of the Mediterranean region face anthropogenic changes due to the simultaneous acceleration of multiple land uses (e.g., urban expansion, agricultural intensification) as well as land abandonment, which affects the flow of ecosystem services, both spatially and temporally [
3].
Trees outside the forest (TOF) are considered important elements in the context of green infrastructure [
4] and integrated components in agroforestry systems [
5,
6]. Since their definition in 2000, TOFs have gained attention in both scientific and policy debates [
7]. Indeed, TOFs: (i) promote biodiversity conservation by enhancing ecological connectivity and providing wildlife habitat [
8]; (ii) improve air, water, and microclimate quality [
9]; (iii) provide timber and non-timber products, especially in developing countries where TOFs are the main forest resource [
10]; and (iv) have social and cultural values, in both rural and urban contexts [
11].
Recent studies refer to the landscape or subregional scale and focus on assessing the spatial distribution of TOFs in France [
12], testing different approaches to classify and map TOFs in the USA [
13] and India [
14], and assessing the spatial and temporal dynamics of TOFs in Germany [
15]. TOFs are not always included in national forest inventories (NFIs) [
16], or at least there are no standardized measures for their monitoring [
17]. In Europe, TOFs are included in the national forest inventories of France [
18], Switzerland [
19], and Sweden [
20]. The Italian National Forest Inventory [
21] focused on the spatial characterization of TOFs at the national level, defined as a homogeneous area of land use and cover with an area between 500 and 5000 m
2 or, if elongated, with a width between 3 and 20 m. Several studies have shown that it is necessary to conduct mapping to study the spatio-temporal changes in trees outside forests in the context of land cover changes [
22]. Recent research has evaluated the characteristics of specific composition and wood volume, highlighting the importance of TOFs in terms of biodiversity and ecosystem services [
23]. Another important role of TOFs is to reverse the effects of land use/land cover change (LULCC) to maintain ecosystem functionality and resilience in landscapes [
24]. Microhabitats are an extensive biodiversity stock [
25]; studies highlight the importance of these for biodiversity conservation [
26] and their vulnerability to external pressures [
27]. As aforementioned, TOFs could potentially show a high level of microhabitat presence and perform a function of protection for these elements, and so they should be studied. Nevertheless, several knowledge gaps need to be addressed to better understand the TOFs’ functionality and classification. For instance, the shape, location, and extent of TOFs are still not adequately assessed [
28], and there is no large-scale and continuous assessment and mapping of TOFs.
Therefore, the aim of this study was to evaluate the changes induced by the anthropogenic land use change, population dynamics, and soil sealing in relation to their effects on TOFs.
The multitemporal TOF maps will be used to evaluate the real dynamics of these elements over a period of about 15 years (from 2000 to 2015) and on landscape changes. To perform this, we evaluate: (i) the role played by TOFs in addition to forests in terms of their presence in the area and their ecological functionality, and (ii) the net balance resulting from the area dynamics and the relative impacts on the landscape using landscape metrics.
2. Materials and Methods
2.1. Study Area
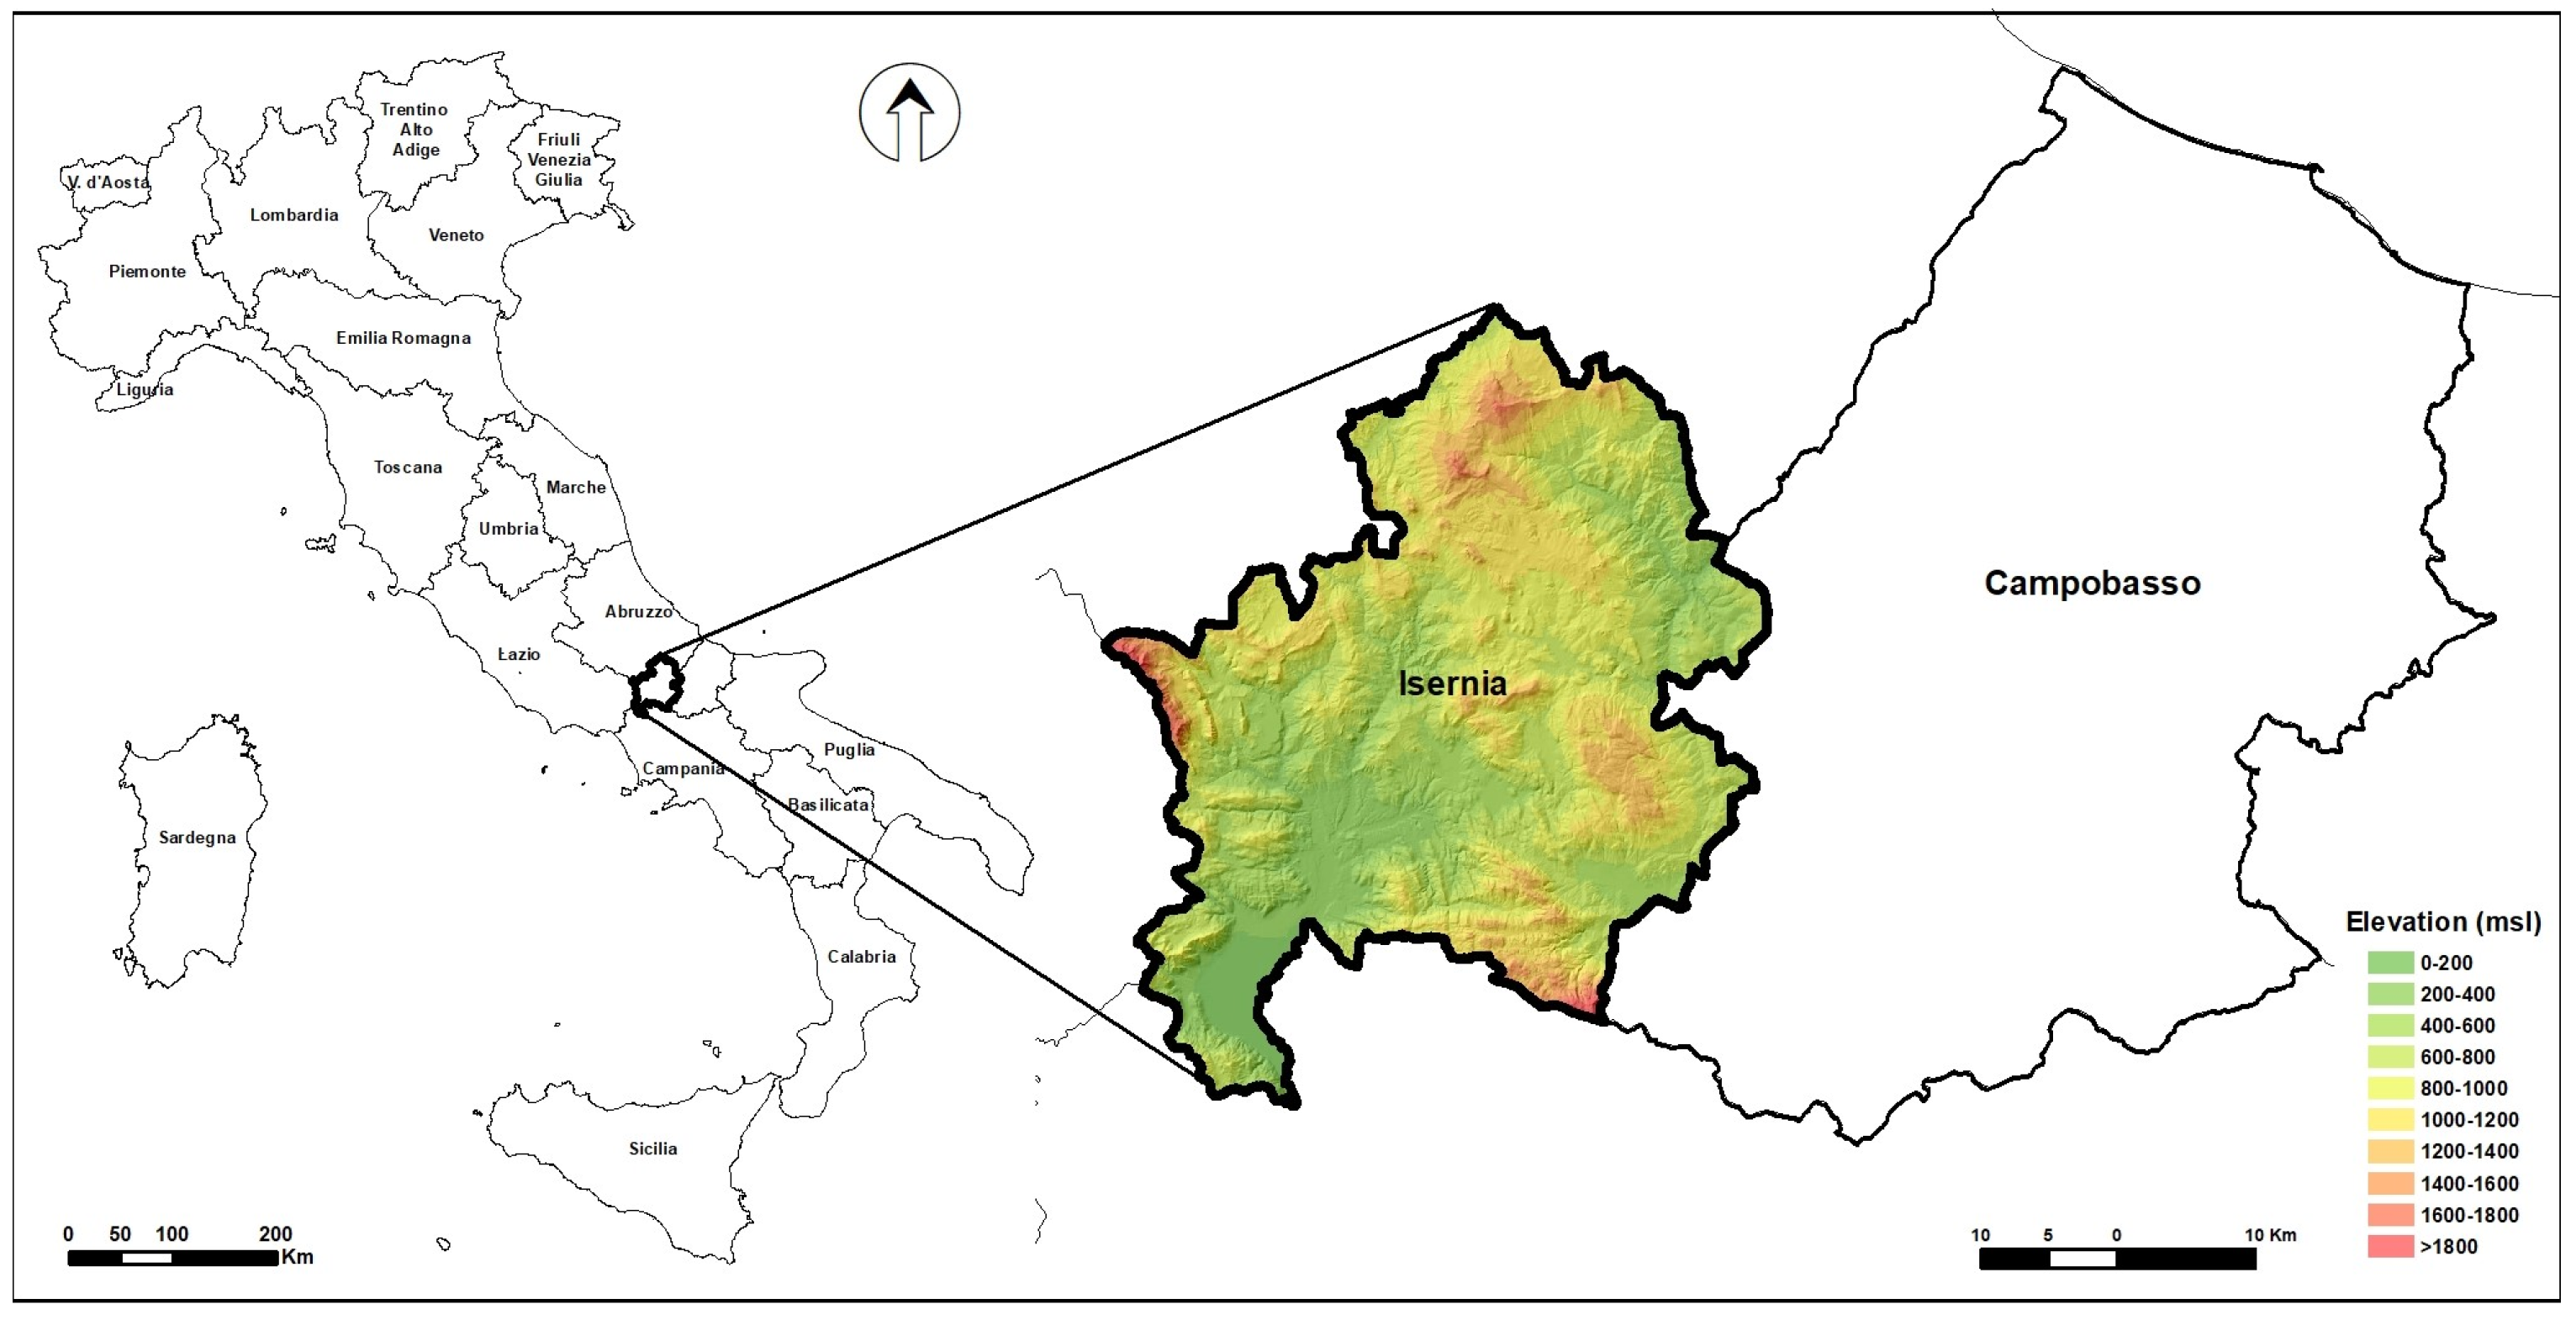
The study area is the province of Isernia (
Figure 1), in the region of Molise (central Italy), approximately 1520 km
2 in size, with complex landscape structures. The continuous depopulation of the Molise region [
29] and the constant increase in land consumption [
30] make this area an anomalous and unpredictable case.
The altitude, which ranges from 200 m a.s.l. in the East to 2050 m a.s.l. on the Matese chain in the Southwest, determines a landscape gradient between the predominantly agricultural area on the Adriatic coast and the mountain-dominated area in the inner areas. The climate also varies from Mediterranean to temperate [
31]: in the area closest to the sea, with relatively low altitudes and a more Mediterranean climate, the average annual temperature is 14–16 °C and never drops below 0 °C even in the winter months. The innermost area, which includes the study area, has a more temperate climate with annual precipitation ranging from 858 to 1100 mm per year. Average annual temperatures range from 10 °C in the higher areas, with two winter months when they fall below zero, to 14 °C in the lower areas, where there are no months when the temperature falls below zero.
About 21% of the territory is used for agriculture, while more than 58% is covered by forests, a value that is constantly increasing due to the widespread phenomenon of the spontaneous recolonization of abandoned lands as a result of the progressive depopulation of rural areas and the abandonment of traditional agricultural and pastoral practices [
32]. Shrublands and natural grasslands account for less than 14% of the total land area. More than 50% of agricultural land is cropland; 16% is used for cropping, and 32% is used for grass cultivation.
The forest-type map of Molise [
33] shows that the forests are dominated by deciduous broadleaf trees. Pedunculate oak forests (
Quercus cerris) represent 40% of the total forest area and are the most common forest type in this region. Downy oak (
Quercus pubescens) dominates the forest landscape (22% of the forests) in hilly, warm sectors, while beech forests (
Fagus sylvatica—9.5% of the forest area) replace deciduous oak forests in mountain sectors (above 1200 m a.s.l.) and in colder locations.
2.2. Photointerpretation
Some characteristics of TOFs, such as structure, spatial distribution, and surface area, are more difficult to assess than forest formations. Some methods are based on forest inventory criteria; however, sampling protocols designed for forests may not be effective for this resource type. Other, less traditional sampling schemes should be tested for different TOF categories that would theoretically be more appropriate. Recently, Fattorini et al. [
34] developed a sampling procedure that is very suitable for estimating TOF areas, based on the mapping layer performed in this work. The method provides accurate estimates, also of quantitative variables, of the TOF by sampling small sample sizes.
Automatic wall-to-wall classification of the tens of thousands of VHR images is not yet possible with current technologies. In fact, wall-to-wall classification of medium resolution imagery (Landsat) used for global forest mapping is not yet perfect or cannot locate all objects [
35].
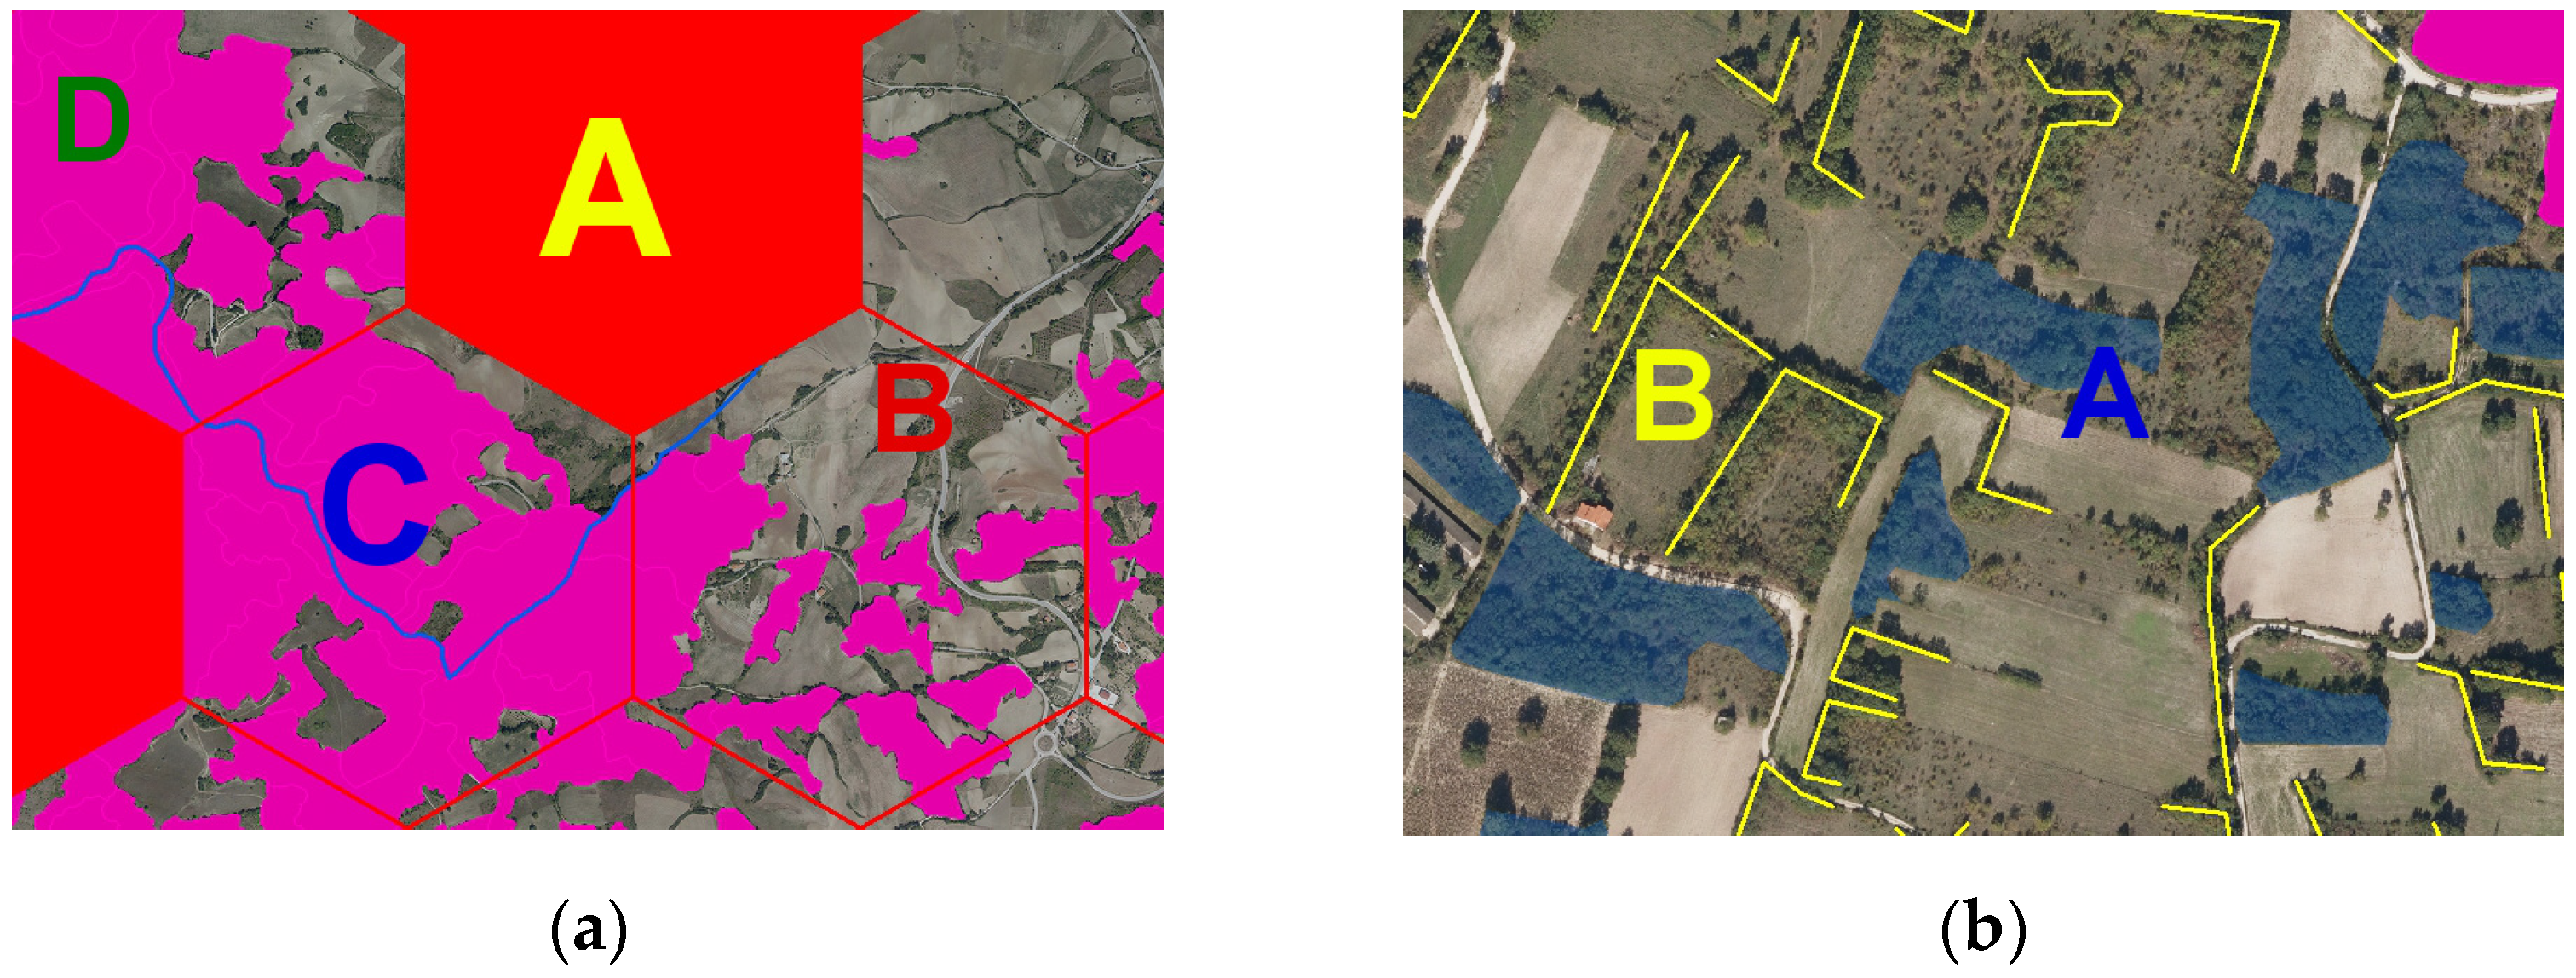
To map the TOFs, we performed a traditional photointerpretation (
Figure 2) with GIS (ArcGIS software version 10.0, Redlands, CA, USA) using color orthophotos with a resolution of 1 m per pixel for the year 2000 (IT2000 project, General Aviation Company, Parma, Italy) and 0.20 m per pixel (AGEA-Agency for Agricultural Disbursements) for the year 2015 in true and false colors.
The choice of the traditional photointerpretation technique was made because the aim of this work is not to contribute in terms of investigation techniques, but to characterize and evaluate the ecological importance of these forests in heterogeneous landscape contexts. For this reason, a detailed mapping was necessary.
The forest-type map of the Molise region [
31] was used to mask forest areas that were already mapped in 2000. This map was created by mapping all defined forest areas according to the FRA2000 definition [
7]. A hexagonal grid of one square kilometer was created for the entire study area, which was used instead of the classic square or rectangular grid because it provides a better quality for photointerpretation [
36]. The TOFs definition of the Italian National Forest Inventory [
21] was used: small wooded land (SWL) with an area between 500 and 5000 square meters and linear forest formations (LFF) with a width of less than 20 m and an unspecified minimum length [
37].
TOFs were mapped by digitizing a layer of polygons for the SWLs, while LFFs were mapped as a layer of lines by assigning each line the width measured on the video (
Figure 2). The decision to use lines for the LFFs was made to speed up the mapping of very long elements. Then, the vector layer was buffered with the attribute of the average width of each feature and merged with that of the SWL.
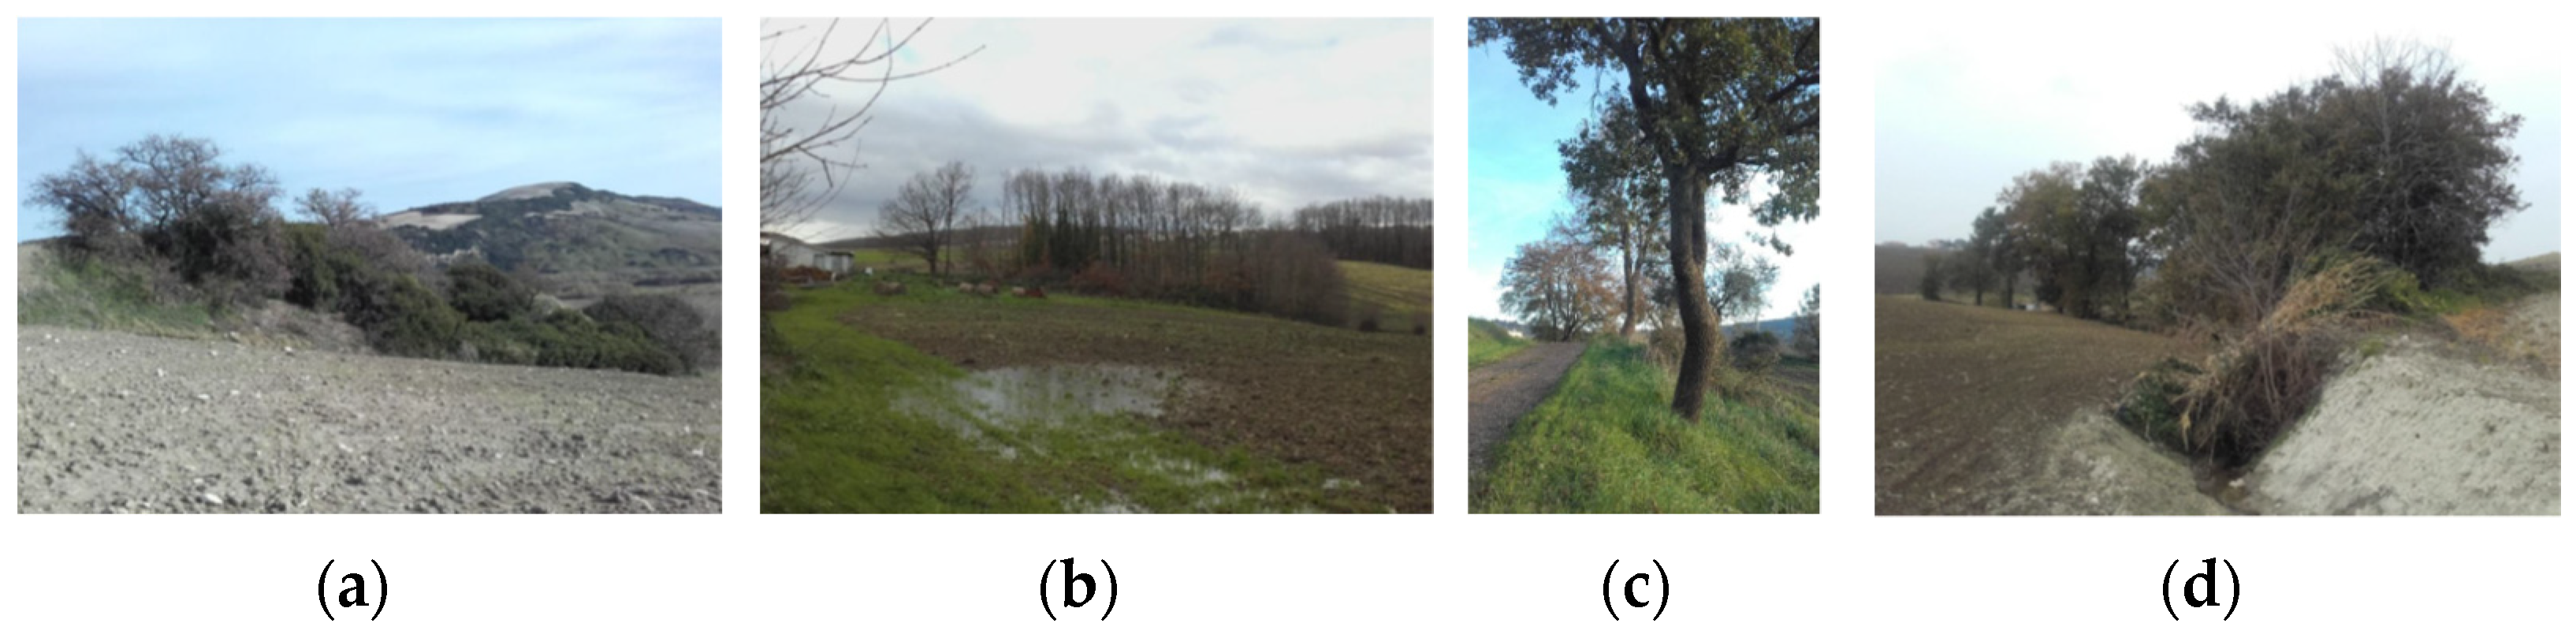
An assessment of the quality of photointerpretation was performed for the TOFs map 2000 by checking the presence or absence of sample plots (
Figure 3). The number of sample plots required in the areas of Isernia province was calculated using the formula of Snedecor and Cochran [
38]:
Theorem 1. Snedecor and Cochran formula: n = number of observations; p = expected accuracy expressed as a percentage (85%); t (Student’s) = 1.96, if we accept 95% confidence in the accuracy estimate; E = maximum percentage error allowed in the estimate (5%).
With an accepted error of 5% (E = 0.05) and an expected accuracy of 85% (p = 0.85), the number of checks requested (N) was 195. The rapid field survey showed an accuracy of over 95% (95.6%), with a number of positive points in the check of 186 out of 195. We did not check the 2015 map, because no new TOFs were recorded during the 15 year period, only the loss of existing TOFs.
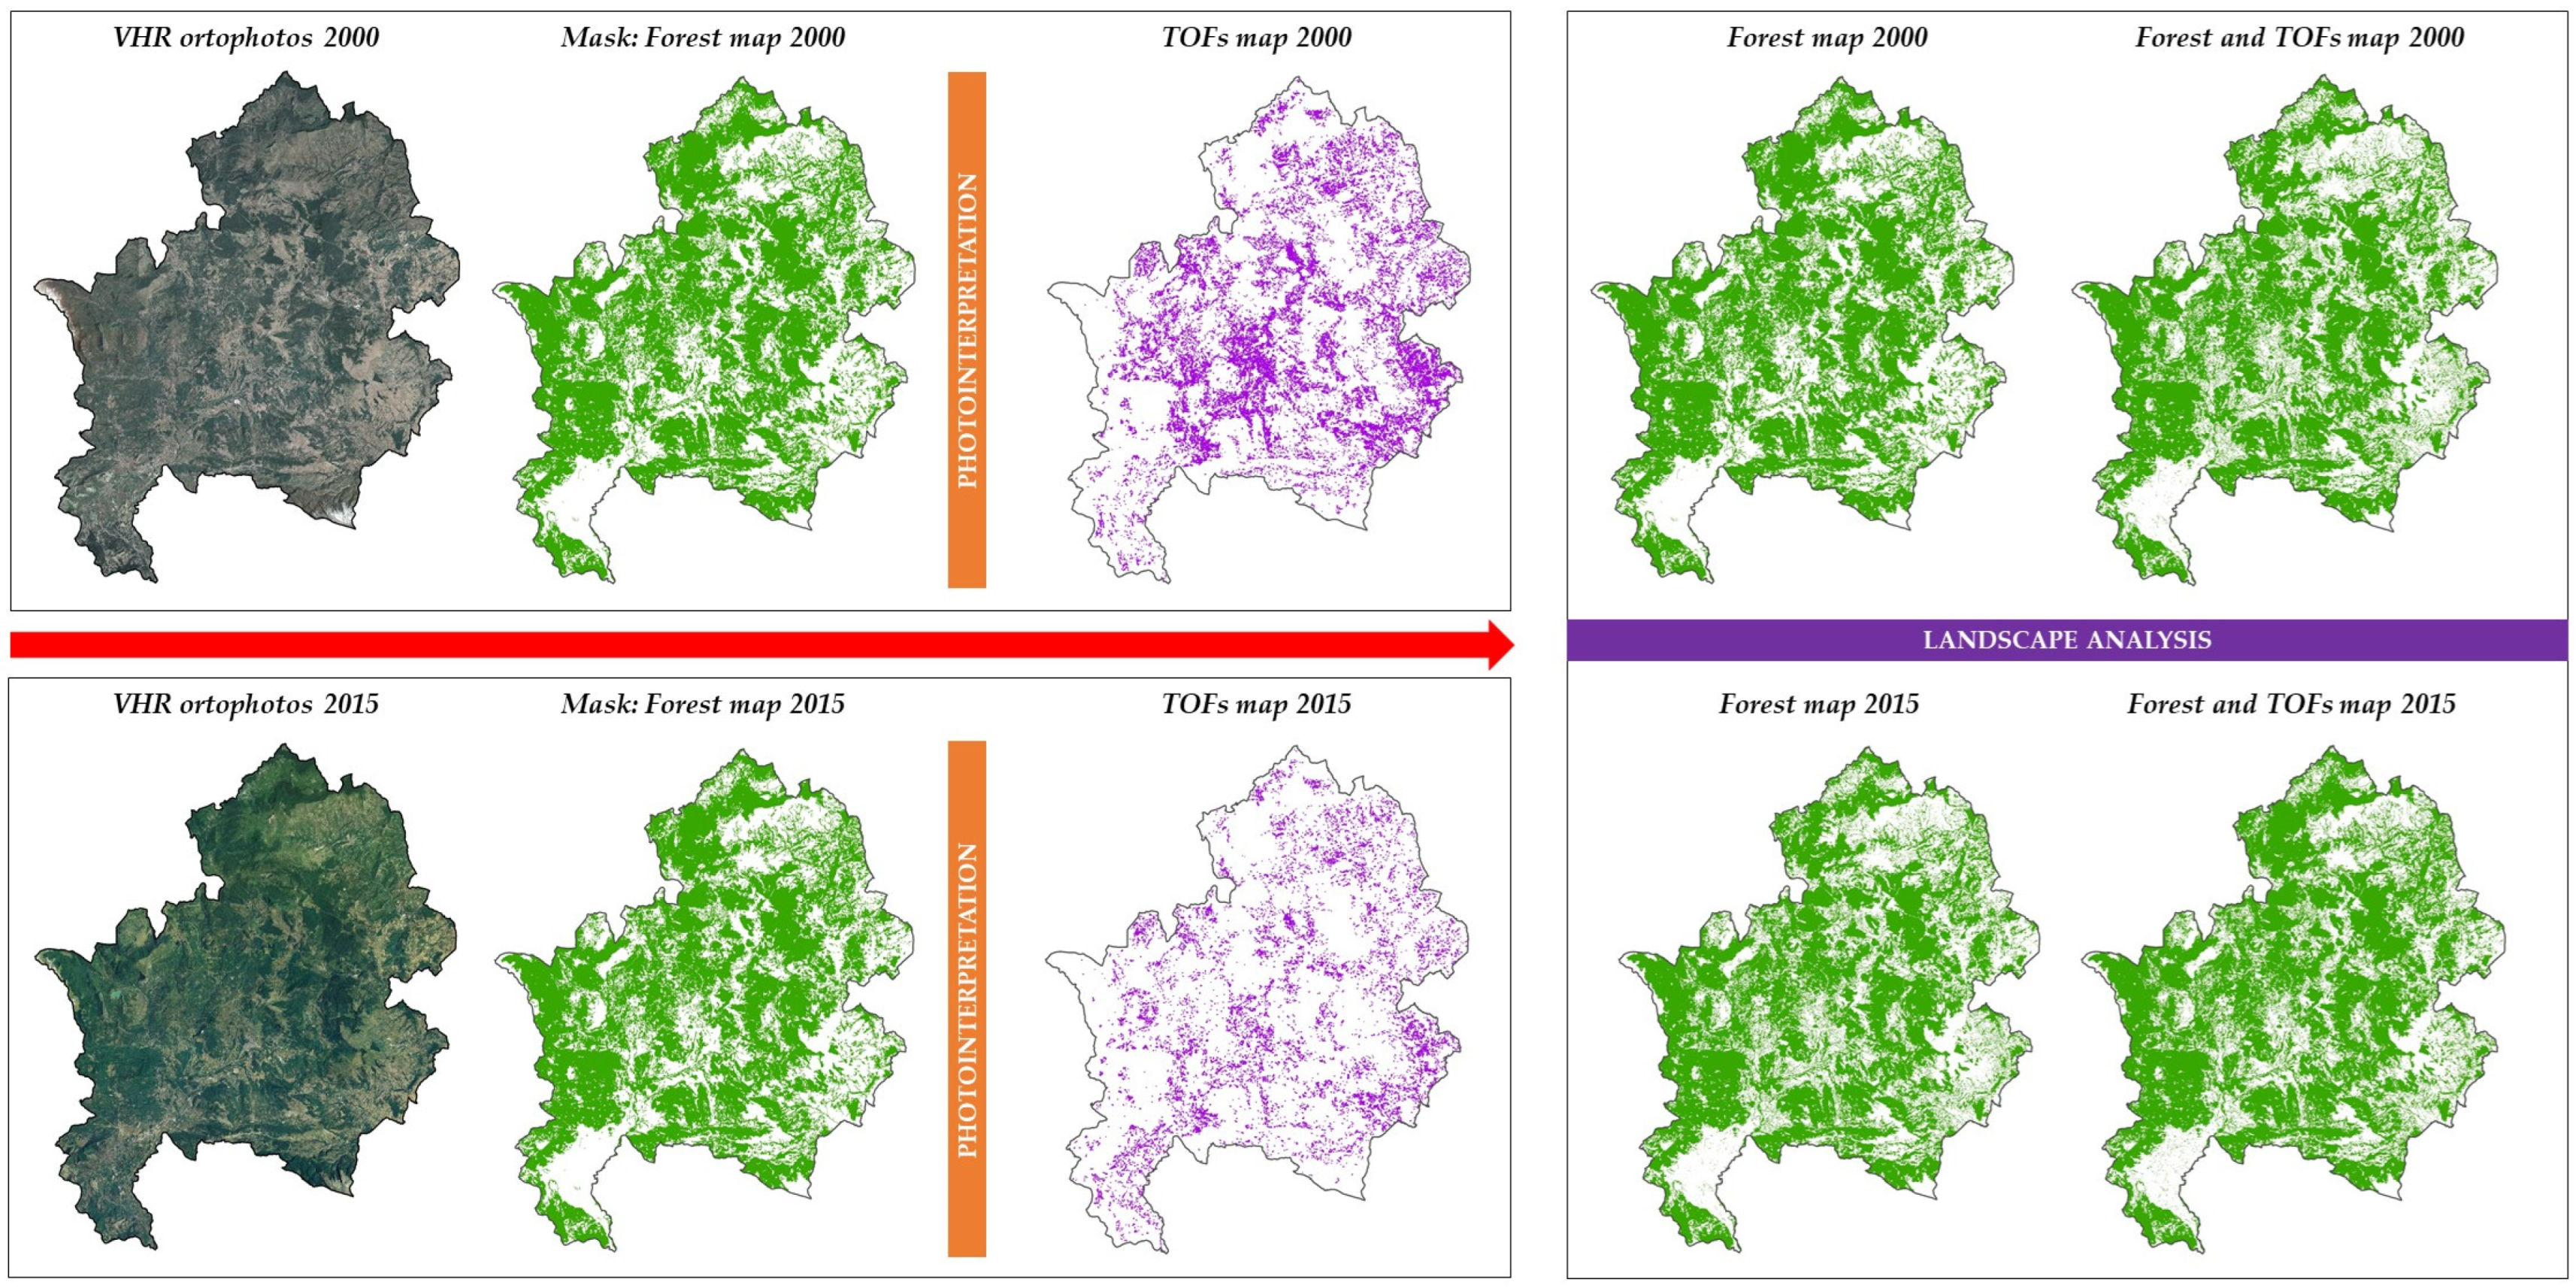
The first version of the TOFs map of the Molise region [
34] was reinterpreted and both the TOFs mapping and the map of regional forest types used as a mask for the 2015 TOFs update were updated in 2015. The TOFs layers were merged with the respective forest maps, resulting in four maps used to assess changes: two for 2000, one with and one without TOFs, and two for 2015 (
Figure 4).
2.3. Landscape Metrics
Landscape metrics were used to quantify the changes caused by the dynamics of TOFs. Frazier and Kedron [
39] have proposed several alternative methods to capture landscape features and spatial heterogeneity, but they are not yet consolidated and easily applicable. Therefore, the classical landscape indices are still the most appropriate to assess landscape structure [
40,
41]. In order to obtain useful information about the complexity and organization of the landscape, as well as its changes, some indicators were obtained based on spatial information. The four maps were converted into a grid with a pixel resolution of 10 m, and the landscape indices for the area edge (17 indices), shape (16 indices), core area (5 indices), and aggregation (17 indices) groups were processed and interpreted for the three levels: for each patch, for each class or type of patch, and for the whole landscape. Fragstat 4.2 [
41], a free and easily accessible software, was used to determine the values of the metrics: Total Area (TA), Percentage of Landscape (PLAND), Largest Patch Index (LPI), Total Edge (TE), Edge Density (ED), Patch Area (PA_?), Radius of Gyration Mean (GYRATE_MN), Radius of Gyration (GYRATE_?), Shape Index (SHAPE_?), Fractal Dimension Index (FRAC_?), Perimeter Area Ratio (PARA_?), Related Circumscribing Circe (CIRCLE_?), Contiguity Index (CONTIG_?), Perimeter Area Fractal Dimension (PAFRAC), Total Core Area (TCA), Core Area Percent of Landscape (CPLAND), Number of Disjunct Core Area (NDCA), Disjunct Core Area Density(DCAD), Core Area Index (CAI_?), Number of Patches (NP), Patch Density (PD), Landscape Shape Index(DIVISION), Proximity Index (PROX_?), Euclidean Nearest Neighbor (ENN_?), Proportion of Like Adjacencies (PLADJ), Interspersion Juxtaposition Index (IJI), Connectance Index (CONNECT), Patch Cohesion Index (COHESION), Landscape Division Index (DIVISION), Effective Mesh Size (MESH), Splitting Index (SPLIT), Aggregation Index (AI), and Normalized Landscape Shape Index (NLSI).
3. Results
The forest area in Isernia province in 2000 was over 89,000 ha compared to over 90,000 in 2015, with an increase of 1155.53 ha, which is equivalent to 1.29% more forest area, while in the Natura 2000 network, the increase was lower, only 0.71%, a sign of greater stability of recolonizable surfaces, such as grasslands.
3.1. TOF Dynamics
TOF areas in 2000 were 2.6% of the province’s surface (
Table 1); in 2015, the area decreased from 3920 hectares in 2000 to 2752 hectares (1.8% provincial area). In fifteen years, 45% of the TOFs have been lost, almost 30% of their area. However, this decrease corresponds to an increase of almost 30% in the average area.
The dynamics of SWLs and LFFs (
Table 2) show that the latter have undergone a greater decline, both in terms of number and total area; their total number has more than halved and the area has been reduced by a third. On the other hand, the average surface area has increased by 40%.
Initial characterization was performed by overlaying the TOFs with a series of layers, e.g., the LULC map and the DEM-derived layers (slope, elevation, and aspect). In 2000, TOFs were predominantly located in agricultural landscapes (73%), while they were much less common in grasslands (approximately 21%) and artificial lands (approximately 5%). In 2015, the occurrence of TOFs decreased in agricultural areas, while it increased in grasslands (
Table 3).
The presence of TOFs predominantly in agricultural areas influences the other features analyzed. Compared to slopes, TOFs are more (69%) located on land with slopes less than 20%, which is typical for agricultural land, and not more than 40% slope.
The distribution of TOFs relative to elevation gages is also strongly influenced by the elevation of agricultural land, but less so than for slopes. The agricultural lands in the study area are all almost evenly distributed in the elevation ranges from sea level to 800 m, while the TOFs are mainly found at the highest elevations, mostly between 400 and 800 m.
The analysis of the Natura 2000 areas showed that 40% of the studied sites are Natura 2000 sites (32 SPAs and 4 SACs), and that the number of SWLs decreased by 38% and their total area by 25% in 2015 (
Table 4). The increase in the average area was about 23%. LFFs have been subject to more significant changes than SWLs.
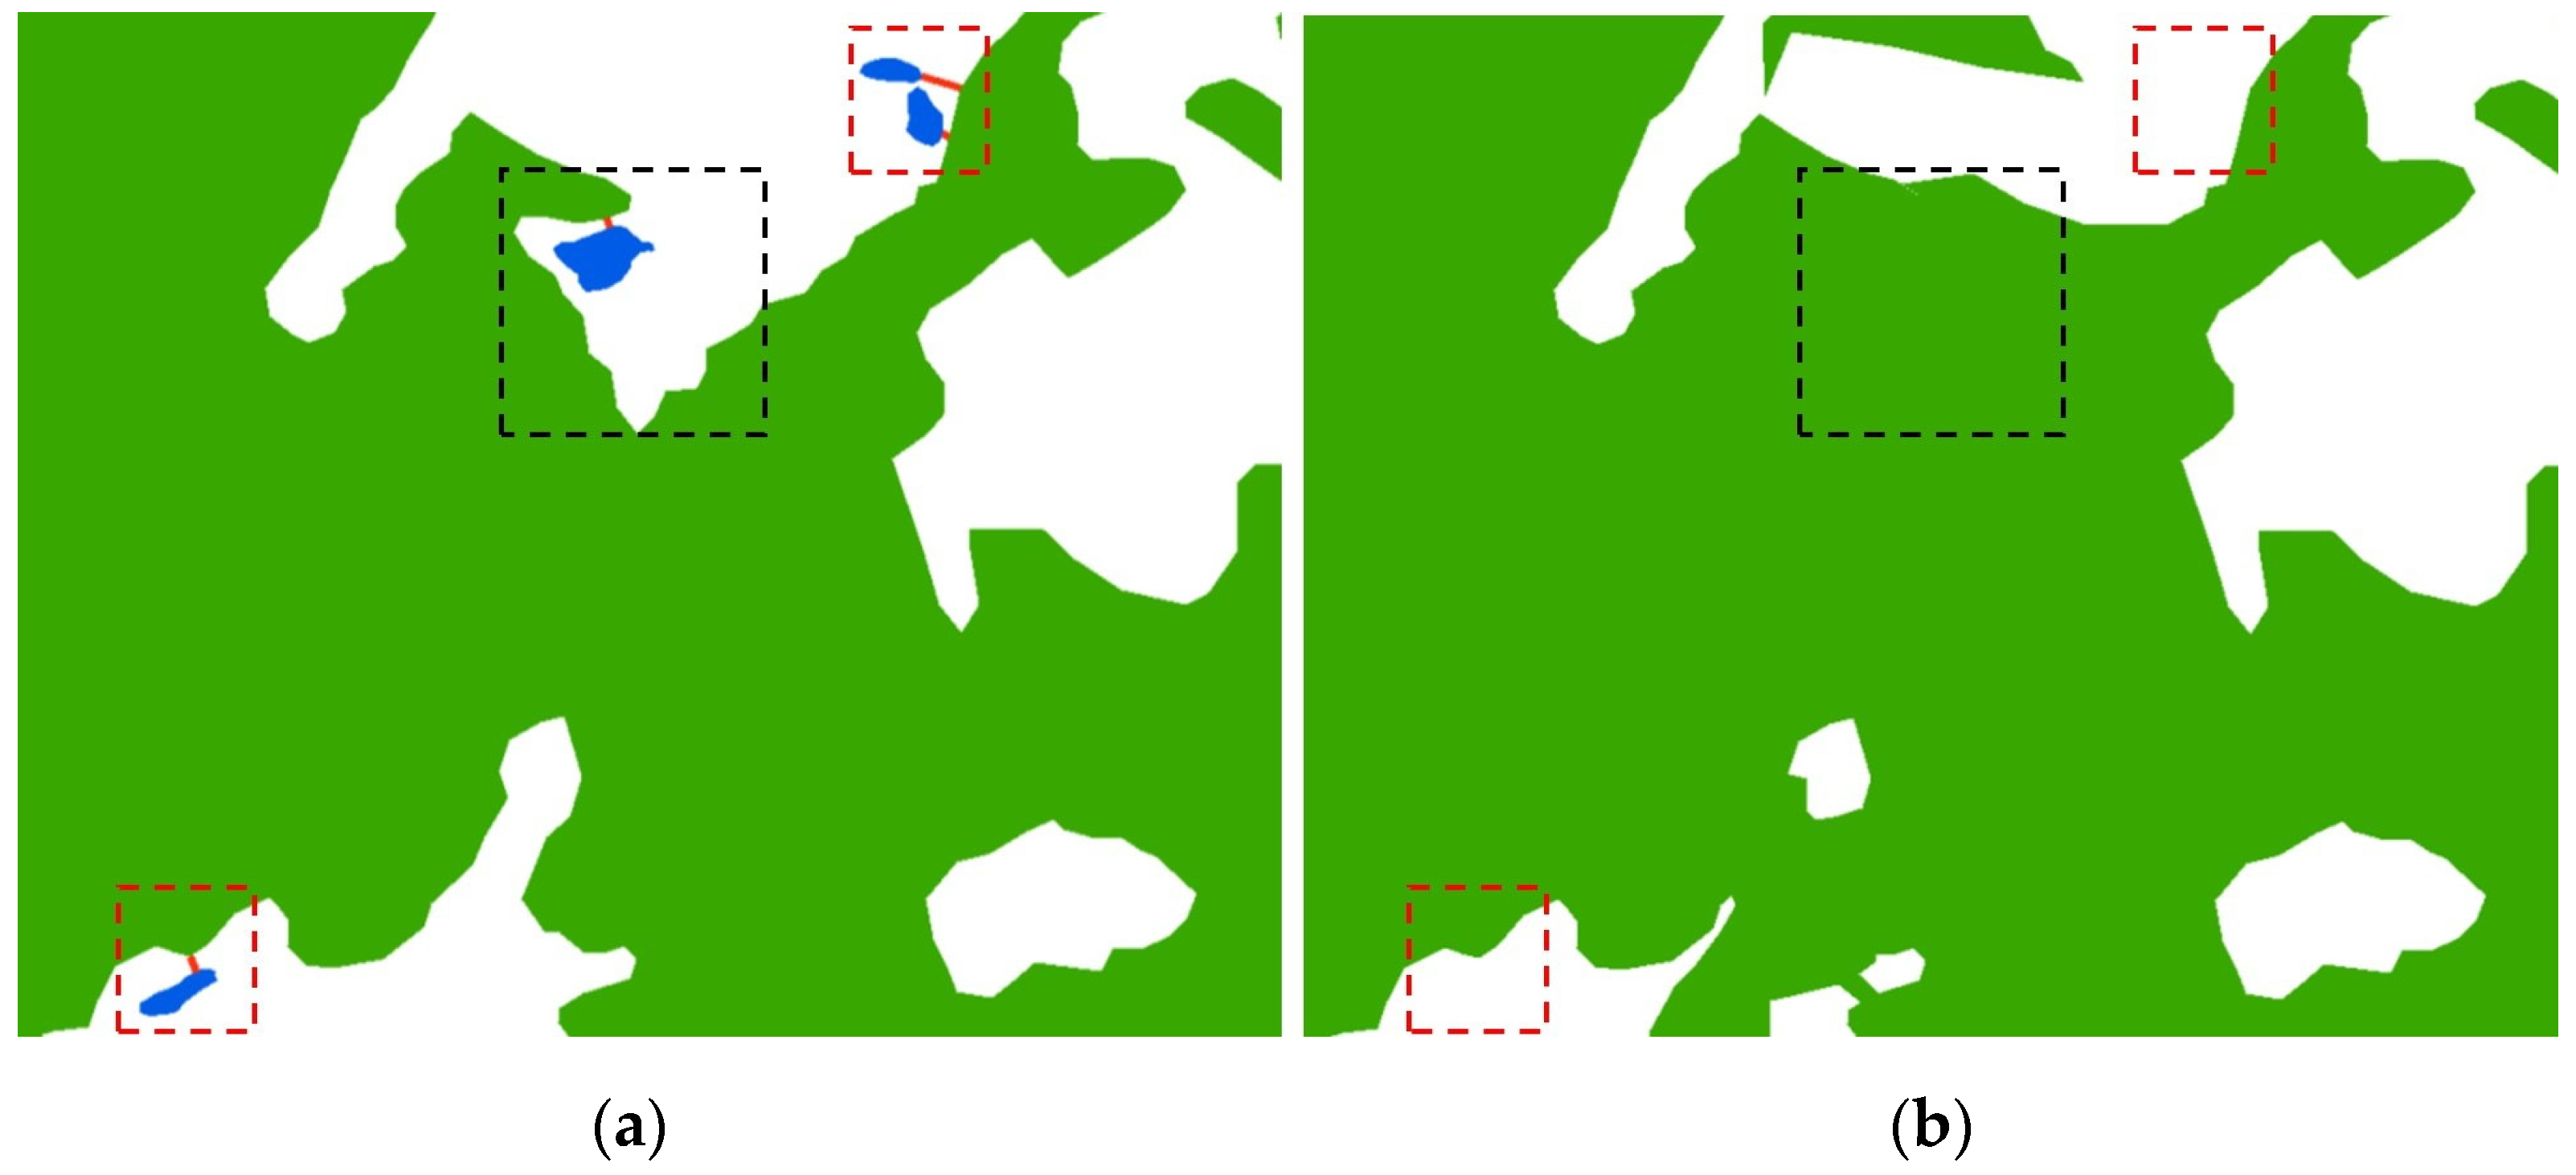
To obtain a comprehensive characterization of the changes, a GIS analysis of the nearest features with distances and bearings was conducted. Several TOFs were converted to forest, with a 5000 m
2 increase in area or incorporation into adjacent forest areas. In fifteen years, 1587 TOFs were incorporated into existing forest areas (
Figure 5), representing about 30% of the total TOF area lost. It was calculated that in 2000, the average distance of these TOFs from the forest edge was almost 15 m. In 2015, the studied TOFs located at this distance from the forest covered an area of >800 ha.
3.2. Landscape Dynamics
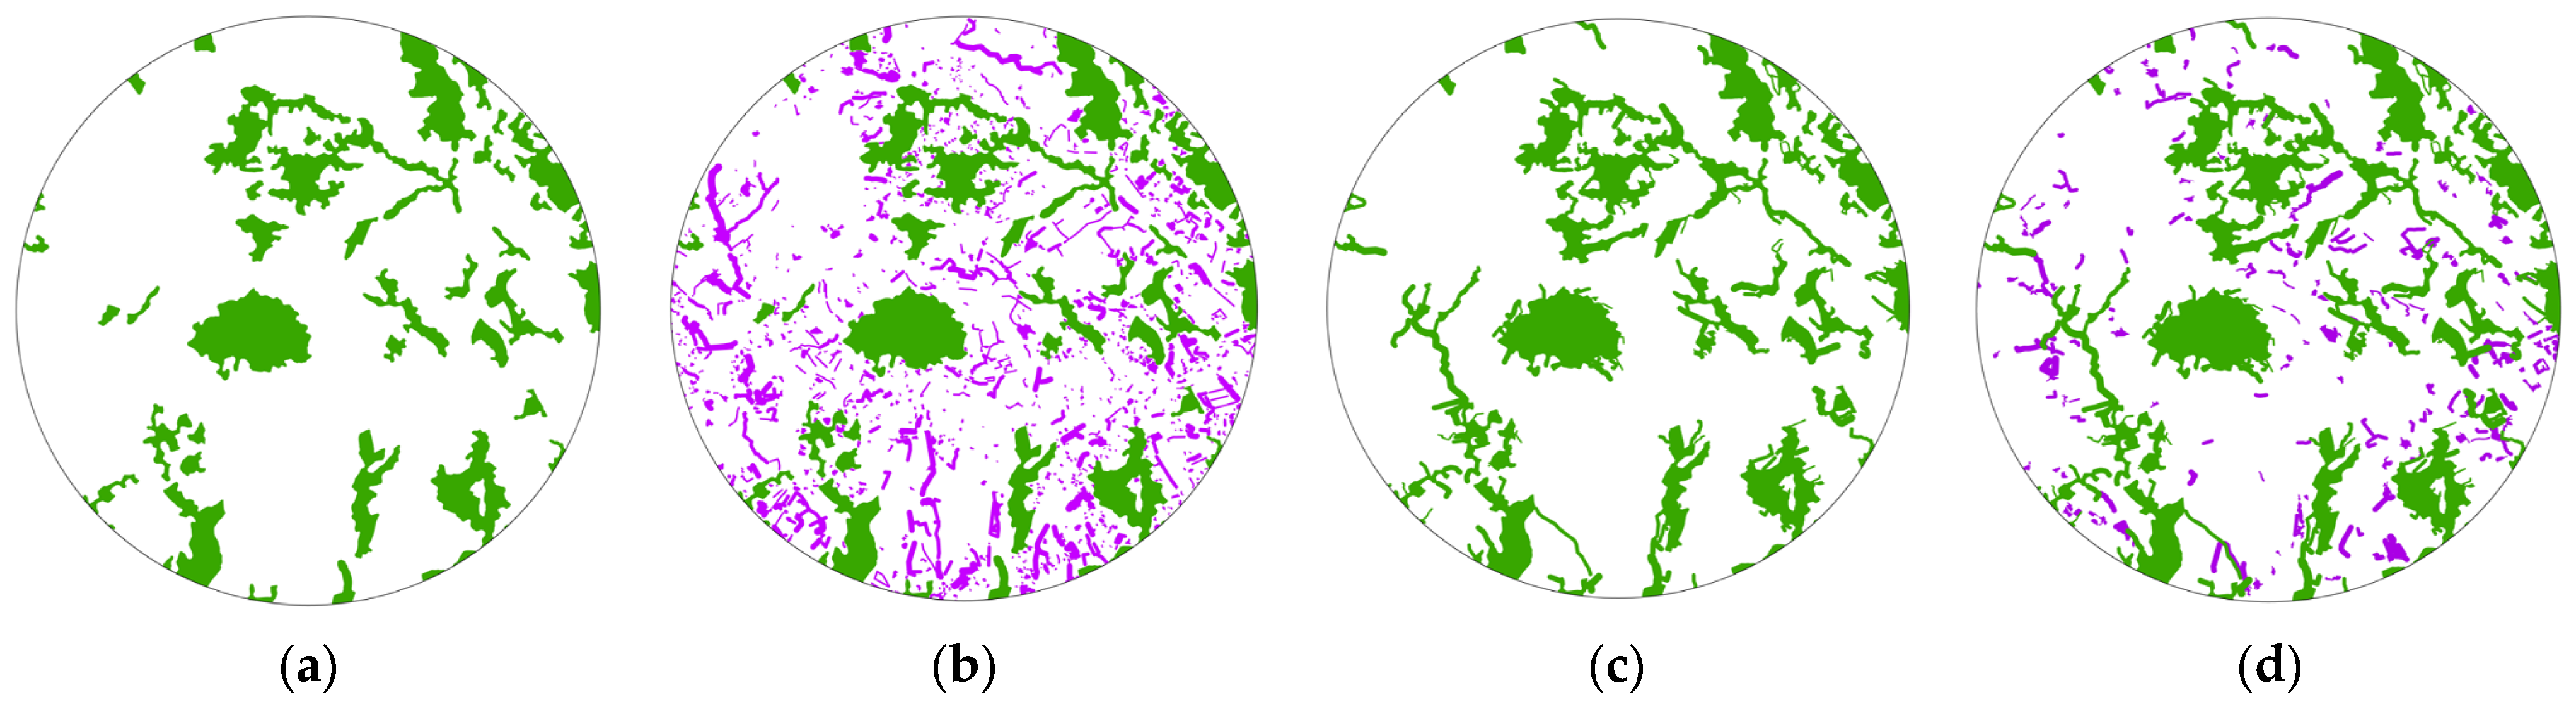
Many of the metrics present in FRAGSTAT have been elaborated, but their interpretation must take into account that many of the metrics are partially or completely redundant, i.e., they quantify a similar or identical aspect of landscape structure. In most cases, the redundant metrics are highly or even perfectly correlated. For example, at the landscape level, areal density (PD) and mean patch size (MPS) are perfectly correlated because they represent the same information. These redundant metrics are alternative ways to represent the same information. In this work, landscape metrics were used to assess changes in forest patch connectivity over time and with and without TOF (
Figure 6). Only landscape and class metrics were used, as patch-level metrics are not useful for the purpose of this study. For this reason, only the index in
Table 5 were considered out of all the metrics processed.
The area/edge indices (ED, AREA_MN, AREA_MD_ and GYRATE_MN) show dynamics that are naturally influenced by the increase in forest area between the two time points, and the addition of the high number of TOF patches in the elaboration. Indeed, we noted that all tend to decrease, but this tendency, as explained below, does not mean that fragmentation leads to a decrease in aggregation.
The addition of TOFs to the landscape analysis obviously increases the PD and LSI indices, both in 2000 and 2015; the increase in forest cover and the simultaneous decrease in TOFs lead to a decrease in both indices. The presence of TOFs increases the total value of TCA, which has increased in the dynamics of the fifteen years considered, both when considering only forests and TOFs. The high values of COHESION show that the forest habitats are already highly connected, and the presence of TOFs, which increases their fragmentation, does not affect this index, which is higher when the number of habitat grouped or aggregated increases. This is confirmed by the observation of the MESH value, which increases both with the presence of TOFs and in the two scenarios studied. ENN_MN, which is used to quantify the separation of each plot, shows that the presence of TOFs increases aggregation, even if the plots were lost in 2015, since the preserved plots have become larger.
4. Discussion
Since 2015, the number of TOFs has decreased by about 50%; the total area is 30% smaller than the last count (930 ha), and 85% of the TOFs that disappeared were linear formations. In total, 930 hectares out of 1160 hectares disappeared, of which 84% of these TOFs were in rural areas. This phenomenon may be due to the fact that they are no longer valued for their functions as windbreaks, property boundaries, etc., but were considered obstacles for agricultural machinery, potential reservoirs for weed propagation, or are cleared by landowners to be used as energy sources.
TOFs mapping has shown that there is more forest cover on the plots, but it is not accounted for due to the limitations of forest mapping, such as the smallest mappable unit (MMU) and the geometric resolution of the ancillary data used for mapping. The images used in this study have a resolution of 20 cm. In Italy, AGEA conducts national orthophoto mapping every three years; in countries where such mapping is not available, very expensive high-resolution satellite imagery would have to be acquired.
As mentioned above, the net forest balance for the period considered is +1.29% (+1155 ha), but when the dynamics of TOFs were considered, the reality is different. The TOF areas lost during the same period totaled 1167 ha, so the net balance in the considered years is almost zero.
The loss of TOFs in Natura 2000 areas is mitigated by the special schemes suitable for nature and biodiversity protection (e.g., management plans) and the limited presence of rural areas more subject to this dynamic, or by the conversion of TOFs into forest areas reaching a minimum area of 5000 m2. Additionally, in the Natura 2000 network, the most penalized elements were linear formations; of the approximately 155 hectares of total area lost, linear formations accounted for 107 hectares. However, in this case, the net forest area (forest + TOFs) is positive and amounts to +80 hectares, so part of the TOFs were converted to forests. This means that even in natural or semi-natural areas, such as grasslands, there are dynamics of landscape simplification and, in particular, a potential loss of grassland habitats of community interest. This phenomenon is mainly due to the failure in the management of the Natura 2000 network.
This trend in TOFs does not coincide with the trends studied for the whole Italian territory [
24], confirming that the dynamics of these areas are related to changes in the fine-grained microstructure of historic landscapes [
22].
TOFs contribute to a national carbon budget and, therefore, must be taken into account in the nationally determined contributions and performance-based payments in forest systems (REDD+) [
42].
Another aspect worth highlighting is the species richness quantified in the study area by Marchetti et al. [
23]. It would be interesting to verify the new specific richness caused by the loss of TOF, and the dynamics of forest insects associated with the landscape [
12] and microhabitats should be investigated.
TOFs also have a strong impact on the landscape perception by citizens, the added value of TOFs to the landscape is strongly related to the degree of anthropization, confirming the importance of the multifunctionality of these elements and the need for balanced management decisions between human perception of TOF, its ecological role, and the provision of other services [
43].
5. Conclusions
The results of this study show that counting and measuring TOFs remain the only methods to verify actual changes in the landscape following the loss or conversion of these areas. The integration of active and passive remote sensing techniques can facilitate manual mapping, but the availability of high-resolution data, especially from active terrestrial or aerial sensors, requires the availability of an instrument.
Ecosystem services provided by TOFs are not yet officially recognized, such as the possibility of carbon accounting [
44], the important ecological niche function as microhabitats for birds [
45] and invertebrates [
46], as well as for the still few studies on fungi, mosses, and lichens.
TOFs must be considered as real microhabitats, or rather as minihabitats, to be protected due to their ecological importance.
Author Contributions
Conceptualization, M.O. and M.M.; methodology, M.O.; software, M.O.; validation, M.M.; formal analysis, M.O.; investigation, M.O.; resources, M.M.; data curation, M.O.; writing—original draft preparation, M.O.; writing—review and editing, M.M.; supervision, M.O. All authors have read and agreed to the published version of the manuscript.
Funding
This research received no external funding.
Data Availability Statement
The data that support the findings of this study are available from the corresponding author upon reasonable request and approval from the study sites representative coauthors.
Acknowledgments
The authors extend their sincere gratitude to the various experts who worked on the 2000 Molise regional TOFs mapping and to Gianni Ciccaglione who updated the 2015 TOFs map of the Isernia province.
Conflicts of Interest
The authors declare no conflict of interest.
Abbreviation
| AI | Aggregation Index |
| AREA_MN | Patch Area Mean |
| AREA_MD | Patch Area Median |
| COHESION | Patch Cohesion Index |
| CONTIG_MN | Contiguity Index Mean |
| CONTIG_CV | Contiguity Index (Coefficient of Variation) |
| DCAD | Disjunct Core Area Density |
| DEM | Digital Elevation Model |
| ED | Edge Density |
| ENN_MN | Euclidean Nearest Neighbor Distance Mean |
| GIS | Geographic Information System |
| GYRATE_MN | Radius of Gyration Mean |
| IJI | Interspersion Juxtaposition Index |
| INFC | Italian National Forest Inventory |
| LFF | Linear Forest Formation |
| LSI | Landscape Shape Index |
| LULC | Land Use/Land Cover |
| LULCC | Land Use/land Cover Change |
| MESH | Effective Mesh Size |
| NDCA | Number of Disjunct Core Area |
| NFI | National Forest Inventory |
| PAFRAC | Perimeter Area Fractal Dimension |
| PD | Patch Density |
| SWL | Small Wooded Land |
| UNESCO | United Nations Educational, Scientific and Cultural Organization |
| TOFs | Tree Outside Forests |
| TCA | Total Core Area |
References
- Steffen, W.; Richardson, K.; Rockström, J.; Cornell, S.E.; Fetzer, I.; Bennett, E.M.; Biggs, R.; Carpenter, S.R.; de Vries, W.; de Wit, C.A.; et al. Sustainability. Planetary Boundaries: Guiding Human Development on a Changing Planet. Science 2015, 347, 1259855. [Google Scholar] [CrossRef] [PubMed]
- Steffen, W.; Persson, Å.; Deutsch, L.; Zalasiewicz, J.; Williams, M.; Richardson, K.; Crumley, C.; Crutzen, P.; Folke, C.; Gordon, L.; et al. The Anthropocene: From Global Change to Planetary Stewardship. Ambio 2011, 40, 739–761. [Google Scholar] [CrossRef] [PubMed]
- Stoate, C.; Báldi, A.; Beja, P.; Boatman, N.D.; Herzon, I.; van Doorn, A.; de Snoo, G.R.; Rakosy, L.; Ramwell, C. Ecological Impacts of Early 21st Century Agricultural Change in Europe—A Review. J. Environ. Manag. 2009, 91, 22–46. [Google Scholar] [CrossRef]
- Millán, M.S. Forestry Programs in Communal Ownership Woodlands at Natural Network 2000: A Delphi Analysis|Programas Forestais Nas Comunidades de Montes Veciñais En Mancomún Na Rede Natura 2000: Unha Análise Delphi. Rev. Galega Econ. 2003, 12, 225–246. [Google Scholar]
- Krishnankutty, C.N.; Thampi, K.B.; Chundamannil, M. Trees Outside Forests (TOF): A Case Study of the Wood Productionconsumption Situation in Kerala. Int. For. Rev. 2008, 10, 156–164. [Google Scholar] [CrossRef]
- Guo, Z.D.; Hu, H.F.; Pan, Y.D.; Birdsey, R.A.; Fang, J.Y. Increasing Biomass Carbon Stocks in Trees Outside Forests in China over the Last Three Decades. Biogeosciences 2014, 11, 4115–4122. [Google Scholar] [CrossRef]
- FAO. Global Forest Resources Assessment 2010; FAO: Rome, Italy, 2010; Volume 147. [Google Scholar]
- Lumsden, L.F.; Bennett, A.F. Scattered Trees in Rural Landscapes: Foraging Habitat for Insectivorous Bats in South-Eastern Australia. Biol. Conserv. 2005, 122, 205–222. [Google Scholar] [CrossRef]
- Grote, R.; Samson, R.; Rocio, A.; Amorim, J.H.; Cari, P.; Churkina, G.; Fares, S.; Le Thiec, D.; Niinemets, U.; Mikkelsen, T.N.; et al. Functional Traits of Urban Trees: Air Pollution Mitigation Potential. Front. Ecol. Environ. 2016, 14, 543–550. [Google Scholar] [CrossRef]
- Thaman, R.R. Trees Outside Forests as a Foundation for Sustainable Development in the Small Island Developing States of the Pacific Ocean. Int. For. Rev. 2002, 4, 268–276. [Google Scholar] [CrossRef]
- Tyrväinen, L.; Pauleit, S.; Seeland, K.; De Vries, S. Benefits and Uses of Urban Forests and Trees. In Urban Forests and Trees: A Reference Book; Springer: Berlin/Heidelberg, Germany, 2005; pp. 81–114. ISBN 354025126X. [Google Scholar]
- Rossi, J.P.; Garcia, J.; Roques, A.; Rousselet, J. Trees Outside Forests in Agricultural Landscapes: Spatial Distribution and Impact on Habitat Connectivity for Forest Organisms. Landsc. Ecol. 2016, 31, 243–254. [Google Scholar] [CrossRef]
- Meneguzzo, D.M.; Liknes, G.C.; Nelson, M.D. Mapping Trees Outside Forests Using High-Resolution Aerial Imagery: A Comparison of Pixel- and Object-Based Classification Approaches. Environ. Monit. Assess. 2013, 185, 6261–6275. [Google Scholar] [CrossRef] [PubMed]
- Das, T.; Das, A.K. Mapping and Identification of Homegardens as a Component of the Trees Outside Forests Using Remote Sensing and Geographic Information System. J. Indian Soc. Remote Sens. 2014, 42, 233–242. [Google Scholar] [CrossRef]
- Plieninger, T.; Schleyer, C.; Mantel, M.; Hostert, P. Is There a Forest Transition Outside Forests? Trajectories of Farm Trees and Effects on Ecosystem Services in an Agricultural Landscape in Eastern Germany. Land Use Policy 2012, 29, 233–243. [Google Scholar] [CrossRef]
- de Foresta, H.; Somarriba, E.; Temu, A.; Boulanger, D.; Feuilly, H.; Gauthier, M. Towards the Assessment of Trees Outside Forests: A Thematic Report Prepared in the Framework of the Global Forest Resources Assessment; FAO: Rome, Italy, 2013. [Google Scholar]
- Schnell, S.; Altrell, D.; Ståhl, G.; Kleinn, C. The Contribution of Trees Outside Forests to National Tree Biomass and Carbon Stocks—A Comparative Study across Three Continents. Environ. Monit. Assess. 2015, 187, 4197. [Google Scholar] [CrossRef] [PubMed]
- Bélouard, T.; Coulon, F. Trees Outside Forests: France. In Trees Outside Forests. Towards a Better Awareness—FAO Conservation Guide 35; Bellefontaine, R., Petit, S., Pain-Orcet, M., Deleporte, P., Bertault, J.-G., Eds.; FAO: Rome, Italy, 2002. [Google Scholar]
- Brändli, U.-B. Schweizerisches Landesforstinventar. Ergebnisse Der Dritten Erhebung 2004–2006; Eidgenössische Forschungsanstalt für Wald, Schnee und Landschaft WSL: Birmensdorf, Switzerland; Bundesamt für Umwelt, BAFU: Bern, Switzerland, 2010.
- Fridman, J.; Holm, S.; Nilsson, M.; Nilsson, P.; Ringvall, A.H.; Ståhl, G. Adapting National Forest Inventories to Changing Requirements—The Case of the Swedish National Forest Inventory at the Turn of the 20th Century. Silva Fenn. 2014, 48, 1095. [Google Scholar] [CrossRef]
- Gasparini, P.; Di Cosmo, L.; Floris, A.; De Laurentis, D. (Eds.) Italian National Forest Inventory—Methods and Results of the Third Survey; Springer Tracts in Civil Engineering; Springer International Publishing: Cham, Switzerland, 2022; ISBN 978-3-030-98677-3. [Google Scholar]
- Novotný, M.; Skaloš, J.; Plieninger, T. Spatial-Temporal Changes in Trees Outside Forests: Case Study from the Czech Republic 1953–2014. Appl. Geogr. 2017, 87, 139–148. [Google Scholar] [CrossRef]
- Marchetti, M.; Garfì, V.; Pisani, C.; Franceschi, S.; Marcheselli, M.; Corona, P.; Puletti, N.; Vizzarri, M.; di Cristofaro, M.; Ottaviano, M.; et al. Inference on Forest Attributes and Ecological Diversity of Trees Outside Forest by a Two-Phase Inventory. Ann. For. Sci. 2018, 75, 37. [Google Scholar] [CrossRef]
- Sallustio, L.; di Cristofaro, M.; Hashmi, M.; Vizzarri, M.; Sitzia, T.; Lasserre, B.; Marchetti, M. Evaluating the Contribution of Trees Outside Forests and Small Open Areas to the Italian Landscape Diversification during the Last Decades. Forests 2018, 9, 701. [Google Scholar] [CrossRef]
- Torossian, J.L.; Kordas, R.L.; Helmuth, B. Chapter Eight—Cross-Scale Approaches to Forecasting Biogeographic Responses to Climate Change. In Large-Scale Ecology: Model Systems to Global Perspectives; Dumbrell, A.J., Kordas, R.L., Woodward, G., Eds.; Advances in Ecological Research; Academic Press: Cambridge, MA, USA, 2016; Volume 55, pp. 371–433. [Google Scholar]
- Larrieu, L.; Paillet, Y.; Winter, S.; Bütler, R.; Kraus, D.; Krumm, F.; Lachat, T.; Michel, A.K.; Regnery, B.; Vandekerkhove, K. Tree Related Microhabitats in Temperate and Mediterranean European Forests: A Hierarchical Typology for Inventory Standardization. Ecol. Indic. 2018, 84, 194–207. [Google Scholar] [CrossRef]
- Hamza, F.; Hanane, S. The Effect of Microhabitat Features, Anthropogenic Pressure and Spatial Structure on Bird Diversity in Southern Tunisian Agroecosystems. Ann. Appl. Biol. 2021, 179, 195–206. [Google Scholar] [CrossRef]
- Leakey, R.R.B. Towards the Assessment of Trees Outside Forests. For. Trees Livelihoods 2013, 22, 212–213. [Google Scholar] [CrossRef]
- Alessandro, P.; Marta, C. Heterogeneity of Linear Forest Formations: Differing Potential for Biodiversity Conservation. A Case Study in Italy. Agrofor. Syst. 2012, 86, 83–93. [Google Scholar] [CrossRef]
- Munafò, M. Consumo Di Suolo, Dinamiche Territoriali e Servizi Ecosistemici; ISPRA: Roma, Italy, 2022.
- Garfi, V.; Marchetti, M. Tipi Forestali e Preforestali Della Regione Molise; Edizioni dell’Orso Srl: Novi Ligure, Italy, 2011; ISBN 8862742800. [Google Scholar]
- Sallustio, L.; Munafò, M.; Riitano, N.; Lasserre, B.; Fattorini, L.; Marchetti, M. Integration of Land Use and Land Cover Inventories for Landscape Management and Planning in Italy. Environ. Monit. Assess. 2016, 188, 1–20. [Google Scholar] [CrossRef]
- Chiavetta, U.; Camarretta, N.; Garfı, V.; Ottaviano, M.; Chirici, G.; Vizzarri, M.; Marchetti, M. Harmonized Forest Categories in Central Italy. J. Maps 2016, 12, 98–100. [Google Scholar] [CrossRef]
- Fattorini, L.; Puletti, N.; Chirici, G.; Corona, P.; Gazzarri, C.; Mura, M.; Marchetti, M. Checking the Performance of Point and Plot Sampling on Aerial Photoimagery of a Large-Scale Population of Trees Outside Forests. Can. J. For. Res. 2016, 46, 1264–1274. [Google Scholar] [CrossRef]
- Hansen, M.C.; Potapov, P.V.; Moore, R.; Hancher, M.; Turubanova, S.A.; Tyukavina, A.; Thau, D.; Stehman, S.V.; Goetz, S.J.; Loveland, T.R.; et al. High-Resolution Global Maps of 21st-Century Forest Cover Change. Science 2013, 342, 850–853. [Google Scholar] [CrossRef]
- McCollum, J.M.; Cochran, J.K.; Rose, A.K. A Discrete Global Grid of Photointerpretation; Research Paper SRS-44; Forest Service U.S. Department of Agriculture: Anchorage, AK, USA, 2008; Volume 1, p. 7.
- De Natale, F.; Floris, A.; Gasparini, P.; Scrinzi, G.; Tabacchi, G.; Tosi, V. Linee Generali Del Progetto Per Il Secondo Inventario Forestale Nazionale Italiano; MiPAF–Ispettorato Generale del Corpo Forestale dello Stato, CRA-ISAFA: Trento, Italy, 2005; Volume 1, p. 27. [Google Scholar]
- Snedecor, G.W.; Cochran, W.G. Statistical Methods, 7th ed.; Iowa State University Press: Ames, IA, USA, 1980. [Google Scholar]
- Frazier, A.E.; Kedron, P. Landscape Metrics: Past Progress and Future Directions. Curr. Landsc. Ecol. Rep. 2017, 2, 63–72. [Google Scholar] [CrossRef]
- Šímová, P.; Gdulová, K. Landscape Indices Behavior: A Review of Scale Effects. Appl. Geogr. 2012, 34, 385–394. [Google Scholar] [CrossRef]
- McGarigal, K.; Marks, B.J. FRAGSTATS: Spatial Pattern Analysis Program for Quantifying Landscape Structure; General Technical Report; US Department of Agriculture, Forest Service: Portland, OR, USA, 1995; Volume 1, p. 122.
- Bhandari, S.K.; Maraseni, T.; Timilsina, Y.P.; Parajuli, R. Species Composition, Diversity, and Carbon Stock in Trees Outside Forests in Middle Hills of Nepal. For. Policy Econ. 2021, 125, 102402. [Google Scholar] [CrossRef]
- Di Cristofaro, M.; Sallustio, L.; Sitzia, T.; Marchetti, M.; Lasserre, B. Landscape Preference for Trees Outside Forests along an Urban-Rural-Natural Gradient. Forests 2020, 11, 728. [Google Scholar] [CrossRef]
- Chakravarty, S.; Pala, N.A.; Tamang, B.; Sarkar, B.C.; Manohar, K.A.; Rai, P.; Puri, A.; Vineeta; Shukla, G. Ecosystem Services of Trees Outside Forest. Sustain. Agric. For. Environ. Manag. 2019, 1, 327–352. [Google Scholar] [CrossRef]
- Dolman, P.M.; Hinsley, S.A.; Bellamy, P.E.; Watts, K.K. Woodland Birds in Patchy Landscapes: The Evidence Base for Strategic Networks. Ibis 2007, 149, 146–160. [Google Scholar] [CrossRef]
- Fuentes-Montemayor, E.; Goulson, D.; Cavin, L.; Wallace, J.; Park, K. Factors Influencing Moth Assemblages in Woodland Fragments on Farmland: Implications for Woodland Management and Creation Schemes. Biol. Conserv. 2012, 153, 265–275. [Google Scholar] [CrossRef]
Figure 1.
Study area map. On the left, the administrative boundaries of the Italian regions; on the right, the administrative boundaries of Isernia and Campobasso provinces of the Molise region.
Figure 1.
Study area map. On the left, the administrative boundaries of the Italian regions; on the right, the administrative boundaries of Isernia and Campobasso provinces of the Molise region.
Figure 2.
GIS (ArcGIS software version 10.0, Redlands, CA, USA) photointerpretation stages: (a): true color orthophotos with a resolution of 1 m per pixel, 2000 (IT2000 project, General Aviation Company, Parma, Italy) with various overlayed layers, (A) hexagons filled with red, which indicates portions of the territory that have already been photointerpreted, (B) hexagons containing patches of territory yet to be photointerpreted; (b): true color orthophotos 0.20 m per pixel resolution, 2015 (AGEA-Agency for Agricultural Disbursements), (A) polygons filled with blue identified elements as Small Wooded Lands, (B) yellow lines elements identified as Linear Forest Formations.
Figure 3.
Some cases of checked TOFs in 2000: (a) in agricultural areas; (b) in agricultural areas that disap-peared in 2015; (c) LFF on roadsides; (d) partially human-modified TOFs as early as 2000.
Figure 3.
Some cases of checked TOFs in 2000: (a) in agricultural areas; (b) in agricultural areas that disap-peared in 2015; (c) LFF on roadsides; (d) partially human-modified TOFs as early as 2000.
Figure 4.
Summary of the cartographic.
Figure 4.
Summary of the cartographic.
Figure 5.
An example of TOFs embedded (dashed black line) and removed (dashed red line) between 2000 (a) and 2015 (b). Green: forest; blue: TOFs; red line: distance between forest-TOFs.
Figure 5.
An example of TOFs embedded (dashed black line) and removed (dashed red line) between 2000 (a) and 2015 (b). Green: forest; blue: TOFs; red line: distance between forest-TOFs.
Figure 6.
A spot view of: (a) forest map of 2000, (b) forest map and TOFs of 2000, (c) forest map of 2015, and (d) forest map and TOFs of 2015. Green: forest; purple: TOFs.
Figure 6.
A spot view of: (a) forest map of 2000, (b) forest map and TOFs of 2000, (c) forest map of 2015, and (d) forest map and TOFs of 2015. Green: forest; purple: TOFs.
Table 1.
Coverage (A), abundance (N), and average size (a) of TOFs between 2000 and 2015 and their rela-tive change with respect to the baseline (%).
Table 1.
Coverage (A), abundance (N), and average size (a) of TOFs between 2000 and 2015 and their rela-tive change with respect to the baseline (%).
| | 2000 | 2015 | Δ(%)-2000–2015 |
|---|
| N | 22,564 | 12,253 | −45.7 |
| A (ha) | 3920.1 | 2752.2 | −29.8 |
| a (m2) | 1737.3 | 2246.2 | 29.3 |
Table 2.
Coverage (A), abundance (N), and average size (a) of small wooded land (SWL) and linear forest formation (LFF) between 2000 and 2015 and their relative change with respect to the baseline (%).
Table 2.
Coverage (A), abundance (N), and average size (a) of small wooded land (SWL) and linear forest formation (LFF) between 2000 and 2015 and their relative change with respect to the baseline (%).
| | SWL | LFF | Total TOFs | | |
|---|
| 2000 | 2015 | 2000 | 2015 | 2000 | 2015 | Δ(%)-SWL | Δ(%)-LFF |
|---|
| N | 10,149 | 6549 | 12415 | 5704 | 22,564 | 12,253 | −35.5 | −54.1 |
| A (ha) | 1198.6 | 966.2 | 2721.6 | 1786.1 | 3920.1 | 2752.2 | −19.4 | −34.4 |
| a (m2) | 1180.0 | 1476.1 | 2192.1 | 3131.3 | 1737.3 | 2246.2 | 24.9 | 42.8 |
Table 3.
Coverage (A), percentage ratio (%) and their relative change (Δ) with respect to LULC of TOFs between 2000 and 2015.
Table 3.
Coverage (A), percentage ratio (%) and their relative change (Δ) with respect to LULC of TOFs between 2000 and 2015.
| LULC | TOFs 2000 | TOFs 2015 | Δ(%)-2000–2015 |
|---|
| A (ha) | % | A (ha) | % |
|---|
| Agricultural lands | 2707.2 | 73.6 | 1773.1 | 68.6 | −34.5 |
| Grasslands and pastures | 786.2 | 21.4 | 637.4 | 24.7 | −18.9 |
| Artificial surfaces | 171.8 | 4.7 | 156.2 | 6.1 | −9.1 |
| Water bodies | 3.2 | 0.1 | 4.2 | 0.2 | 31.3 |
| Other | 8.2 | 0.2 | 12.3 | 0.5 | 50.1 |
Table 4.
Abundance (N), coverage (A), and average size (a) of small wooded land (SWL) and linear forest formation (LFF) between 2000 and 2015 and their relative change with respect to the baseline (%) in Natura 2000 network.
Table 4.
Abundance (N), coverage (A), and average size (a) of small wooded land (SWL) and linear forest formation (LFF) between 2000 and 2015 and their relative change with respect to the baseline (%) in Natura 2000 network.
| | SWL | LFF | Total TOFs | Δ(%)-SWL | Δ(%)-LFF |
|---|
| 2000 | 2015 | 2000 | 2015 | 2000 | 2015 |
|---|
| N | 1797 | 1108 | 1903 | 948 | 3700 | 2056 | −38.3 | −50.2 |
| A (ha) | 199.5 | 151.3 | 356.3 | 249.1 | 555.8 | 400.4 | −24.2 | −30.1 |
| a (m2) | 1110.3 | 1365.1 | 1872.1 | 2627.7 | 1502.2 | 1947.2 | 23.0 | 40.4 |
Table 5.
Landscape metrics at the class level for 2000 and 2015 (For: forest, ForTOF: forest and TOFs).
Table 5.
Landscape metrics at the class level for 2000 and 2015 (For: forest, ForTOF: forest and TOFs).
| | 2000 | 2015 |
|---|
| | For | ForTOF | For | ForTOF |
|---|
| ED | 17.04 | 19.64 | 17.29 | 19.20 |
| AREA_MN | 36.85 | 8.40 | 59.79 | 12.30 |
| AREA_MD | 0.44 | 0.08 | 1.12 | 0.16 |
| GYRATE_MN | 61.20 | 26.44 | 92.23 | 33.32 |
| CONTIG_MN | 0.36 | 0.20 | 0.55 | 0.29 |
| CONTIG_CV | 85.26 | 100.47 | 45.28 | 75.17 |
| PAFRAC | 1.42 | 1.49 | 1.48 | 1.46 |
| TCA | 85,557.1 | 88,439.2 | 86,752.4 | 88,581.2 |
| NDCA | 2322 | 10530 | 1451 | 7204 |
| DCAD | 0.72 | 3.25 | 0.45 | 2.22 |
| PD | 0.72 | 3.25 | 0.45 | 2.22 |
| LSI | 101.25 | 126.20 | 100.58 | 116.67 |
| ENN_MN | 57.9 | 52.1 | 67.3 | 58.6 |
| IJI | 59.76 | 54.85 | 59.36 | 55.64 |
| COHESION | 99.96 | 99.95 | 99.96 | 99.96 |
| MESH | 18,162.19 | 18,941.34 | 18,479.71 | 19,118.65 |
| AI | 93.14 | 91.57 | 93.23 | 92.22 |
| Disclaimer/Publisher’s Note: The statements, opinions and data contained in all publications are solely those of the individual author(s) and contributor(s) and not of MDPI and/or the editor(s). MDPI and/or the editor(s) disclaim responsibility for any injury to people or property resulting from any ideas, methods, instructions or products referred to in the content. |
© 2023 by the authors. Licensee MDPI, Basel, Switzerland. This article is an open access article distributed under the terms and conditions of the Creative Commons Attribution (CC BY) license (https://creativecommons.org/licenses/by/4.0/).


