Article

The Impact and Mechanism of the Increased Integration of Urban Agglomerations on the Eco-Efficiency of Cities in the Region—Taking the Chengdu–Chongqing Urban Agglomeration in China as an Example

1
College of Earth and Environmental Sciences, Lanzhou University, Lanzhou 730000, China
2
Key Laboratory of Western China’s Environmental Systems, Ministry of Education of the People’s Republic of China, Lanzhou University, Lanzhou 730000, China
*
Author to whom correspondence should be addressed.
Land 2023, 12(3), 684; https://doi.org/10.3390/land12030684
Submission received: 10 February 2023 / Revised: 9 March 2023 / Accepted: 13 March 2023 / Published: 15 March 2023

Abstract

:
China is attaching increasing importance to the creation of regional integration, high-quality economic development and ecological civilization. An accurate grasp of the traction effect of the increased level of integration of urban agglomerations on the eco-efficiency (EE) of cities in the region will help to promote the steady improvement of urban economic development and the ecological environment. This paper constructs an index system to measure the level of integration of the Chengdu–Chongqing urban agglomeration (CCUA) and the EE of each city within it from 2011 to 2020 and explores the impact of regional integration on urban EE and its mechanism of action. The study presents the follow findings: (1) The level of integration of the CCUA increased nearly 10 times from 2011 to 2020, with the government playing a significant leading role. (2) The positive and negative effects of the level of integration of the CCUA on urban EE depend on factors such as the level of economic development, the stage of development and the location. There are several relationships between the level of intra-regional integration and urban EE: first, a nearly linear increase, as in Chongqing and Chengdu; second, an increase in fluctuation, as in Dazhou, Guang’an and Leshan; and third, a fluctuation, decrease, flat or even no real increase, as in Luzhou, Ya’an and Zigong. (3) Based on this, this paper considers the mechanism of the level of integration within the region on urban EE in terms of both economic and eco-environmental effects, with a view to exploring the future green development path of the CCUA.

1. Introduction

Entering the 21st century, a new round of scientific and technological revolution as well as industrial upgrading has prompted the international division system to undergo systematic adjustment. The rise of trade protectionism and trade unilateralism in Western countries has led to the decline of multilateral economic and trade cooperation mechanisms represented by the WTO and the emergence of increasingly significant regionalization features in the wave of globalization, such as the gradual strengthening of intra-regional economic and trade cooperation mechanisms and of bilateral and limited multilateral or regional integration cooperation based on geographical proximity around core countries to form groups of trade, which has become one of the most valuable and relevant economic activities to be studied [1,2]. At the same time, China’s economy has changed from a high-speed growth stage to a medium-speed growth stage of high-quality development and ecological civilization construction, such as the establishment of a dual carbon target, the pursuit of quality and efficiency and economic and ecological harmony through green development [3]. Moreover, the Chinese government is paying increasing attention to the issue of coordinated inter-regional development and intra-regional integration within the country, such as the construction of economic zones and urban agglomerations to enhance the level of integrated regional development in an attempt to improve economic efficiency; alleviate or solve the problems of resource scarcity, environmental pollution and ecological degradation; and shift from traditional development to a sustainable development model. This scientific issue has attracted increasingly widespread attention from the academic community.
The concept of regional integration was first proposed in 1954 by the Dutch economist Tinbergen, who saw regional integration as a means of seeking a dumping ground for the surplus products of capitalism. In 1961, the American economist Balassa proposed the definition of regional economic integration as both a “process” and a “state” [4]. Since then, numerous scholars have defined regional integration from different perspectives [5,6,7]. The core of regional integration refers to the process or phenomenon in which the development factors tend to flow freely or without barriers within a certain economic region, so as to achieve interoperability and interconnection between regions and maximize the regional benefits. The study of regional integration includes the measurement level of regional integration [8,9,10,11], development stages [12], coordination mechanisms [13], driving mechanisms [14], economic effects [15], environmental effects [16], etc. Firstly, in terms of the relationship between regional integration development, economic development, Total Factor Productivity (TFP) and other issues, existing studies show that regional integration can reduce transaction costs for both sides; enhance intra-regional trade and investment flows [17] and promote the movement of people [18]; improve the utilization efficiency of resource elements and improve the level of technology; and alleviate factor mismatch and promote the advanced development of the manufacturing industry, which in turn is conducive to improving employment level and achieving balanced labor force employment [19,20], as well as helping to promote synergistic economic development, political equality and mutual tolerance and institutional co-governance across borders in the region [21]. However, the impact of regional integration on the economics and growth rate of each element is also related to the stage of development of the region [22,23,24], the level of development of the region and its location [25] and others. Secondly, in terms of the environmental effects of regional integration, many scholars have evaluated the environmental performance of regionally integrated economies, such as the evaluation of energy efficiency in urban agglomerations [26] and the evaluation of green productivity [27] and the pattern of green technological innovation capacity; only a few studies have quantitatively measured the causal relationship between regional integration and environmental pollution [28,29,30,31]. In general, regional integration has inhibitory effects on pollutant emissions [13] and carbon emissions [31] and is beneficial to reducing emissions [32], but the effects are spatially heterogeneous. Finally, there are studies that address both the socio-economic and ecological environment. For example, existing results show that the integrated development of the Yangtze River Delta market significantly improved regional carbon emissions [33], and the integration has a non-linear inverted “U” shape on the quality development of urban economies [34]. EE was first proposed by Schaltegger and Sturm, whom briefly defined EE as the ratio of economic growth to environmental impact, specifically as a production process that yields a larger economic output with smaller resource and environmental inputs [35]. This definition, which takes into account both socio-economic development and resource environment systems, effectively solves the problem of how to quantify both at the same level and has been promoted by the World Business Confederation for Sustainable Development (WBSCD) and the World Organization for Economic Cooperation and Development (OECD) [35,36]. The current research on EE focuses on the following two aspects: studies on the measurement of EE and spatial and temporal patterns [37,38,39,40] and studies on the factors influencing EE. For example, the impact of upgrading the industrial structure [41,42], urban competition [43,44], infrastructure [45,46], urbanization [47], land use [48], green technology innovation [49,50], environmental regulation [51,52], economic development [53] and so on have been investigate.
Little research has been conducted on the impact of regional integration on EE. It was found that the integration of the Yangtze River Economic Belt can significantly improve the EE of cities along the belt through economic growth effects, industrial structure effects and technological innovation effects [30]. The remaining relevant studies are mainly in the following areas: the study of the integrated impact of regional integration on two major systems, economic and ecological [33,34], and the impact of the proxy variables of regional integration, such as market segmentation and transport networks, on EE [46,54]. Studies have shown that technological innovation in areas with weak market segmentation promotes green EE, while technological innovation in areas with strong market segmentation inhibits green EE [55]. In addition, it has been found that high speed rail networks exacerbate urban EE imbalances to some extent [46]. At the same time, some studies have identified factors such as urbanization, openness, technology, environmental regulation and industrial structure as contributing to spatial differences in EE [56,57].
It is clear that not only is systematic analysis of the impact of regional integration on EE lacking, but research on the impact of regional integration on urban EE in western China based on the scale of urban agglomeration is lacking as well. The heterogeneity between different cities is also not considered in existing studies. Western China is a reservoir and backyard for China’s green and high-quality economic development, playing a pivotal role in ecological security and resource and energy supply. Currently, urban agglomerations are the main spatial body and economic growth pole of China’s new urbanization, and they are important spatial carriers of China’s regional integration and high-quality development [58]. In 2011, the National Development and Reform Commission issued “the Regional Planning of Chengdu-Chongqing Economic Zone”. In 2016, the State Council approved “the Development Plan of CCUA”. In 2020, the sixth meeting of the Central Finance and Economics Commission clearly proposed promoting the construction of the twin-city economic circle in the Chengdu–Chongqing region, and the State Council issued “the Outline of the Construction Plan for the Twin-City Economic Circle in the Chengdu-Chongqing Region” in 2021. This indicates that the CCUA has officially become the fourth mega-urban agglomeration in China, and the only one located inland. The central government requires the CCUA to pursue a rapid increase in its level of regional integration while building an ecological barrier in the upper reaches of the Yangtze River; that is, the CCUA should try to promote the green development of the region by relying on the integration of the urban agglomeration. In addition, the CCUA is a typical case of inter-provincial collaboration in western China, and the study of its inter-provincial regional integration utility has certain representativeness and research value. As a result, taking the CCUA as an example, the purpose of this study is to attempt to answer the following scientific questions: How does the increased level of regional integration of urban agglomeration affect urban EE within urban agglomeration? How does the impact vary between cities? What are the intrinsic mechanisms? Answering these scientific questions will facilitate our exploration of green development paths for urban agglomerations.
Based on the foregoing scientific questions, the following research hypotheses were formulated. According to the conclusions of the previous analysis [30], regional integration within urban agglomerations affects urban EE in two main ways: by promoting economic growth and by improving the ecological environment. However, the role of regional integration on urban EE in China may be influenced by regional differences, development stages and urban heterogeneity. The following two hypotheses are proposed:
H1: 
Based on the Chinese scenario, which is entering the middle and late industrialization phase and a period of economic growth, the integration of urban agglomerations has generally improved the EE of the cities within their zones, but there may also be cases of fluctuating impacts, including those that do not really improve overall.
H2: 
In terms of impact mechanisms, the economic effect mainly promotes economic growth by integrating resource allocation efficiency, reducing costs, increasing competitive effects and scale effects and enhancing production efficiency, but the outcome of the impact on urban EE depends on the contrast between the forces of the spillover effect and the siphon effect. The ecological effect is mainly seen through the internalization of the externalities of urban environmental pollution and the resolution of the “prisoner’s dilemma” in the cross-regional management of environmental pollution, which has improved the ecological environment of cities, including the use of integration mechanisms to improve total factor productivity of energy, sharing of environmental protection technologies, reducing carbon emissions, improving cross-regional pollution management and ecological construction cooperation mechanisms. However, there are still a few cities that have experienced a decline in EE because of the “trade transfer effect”.
In view of this, we first construct an index system to measure the regional integration of the CCUA and an index system for measuring the EE of cities in the region based on the Super-SBM model. Then, the values of regional integration of urban agglomerations and EE of each city from 2011 to 2020 are measured, and finally, the correlations between them and their mechanisms are explored.

2. Materials and Methods

2.1. Study Area and Data Sources

According to the “Outline of the Construction Plan of Chengdu-Chongqing Regional Twin-City Economic Circle” (http://www.gov.cn/zhengce/2021-10/21/content_5643875.htm) (accessed on 14 March 2023), combined with the availability of data, Chongqing, Chengdu, Zigong, Luzhou, Deyang, Mianyang, Suining, Neijiang, Leshan, Nanchong, Meishan, Yibin, Guang’an, Dazhou, Ya’an and Ziyang are selected for the study (Figure 1). The CCUA is located at the intersection of “the Belt and Road” and the Yangtze River Economic Belt and is the starting point of the new land and sea channel in the west, which has the unique advantages of connecting southwest and northwest, and communicating with East Asia, Southeast Asia and South Asia. The total area of the region is 18.5 × 10⁴ km2, with a resident population of 130 million in 2021 and a regional GDP of nearly CNY 7.4 trillion. With excellent ecological endowments and abundant energy and minerals, the region is the most densely populated industrial base in western China, with high innovation capability, market space and openness, and it has a unique and important strategic position in the overall development of the country. It is thus typical and representative to take the CCUA as a case.
The data sources of this paper include: train data from China Railway Travel App, nighttime lighting data from Harvard Dataverse (https://doi.org/10.7910/DVN/YGIVCD) and the rest of the data are mainly from “Chongqing Statistical Yearbook”, “Sichuan Statistical Yearbook”, “China Energy Statistical Yearbook”, “China Environmental Statistical Yearbook”, statistical yearbooks of prefecture-level cities from 2011 to 2021, the National Bureau of Statistics (http://www.stats.gov.cn) (accessed on 14 March 2023) and various relevant government departments.

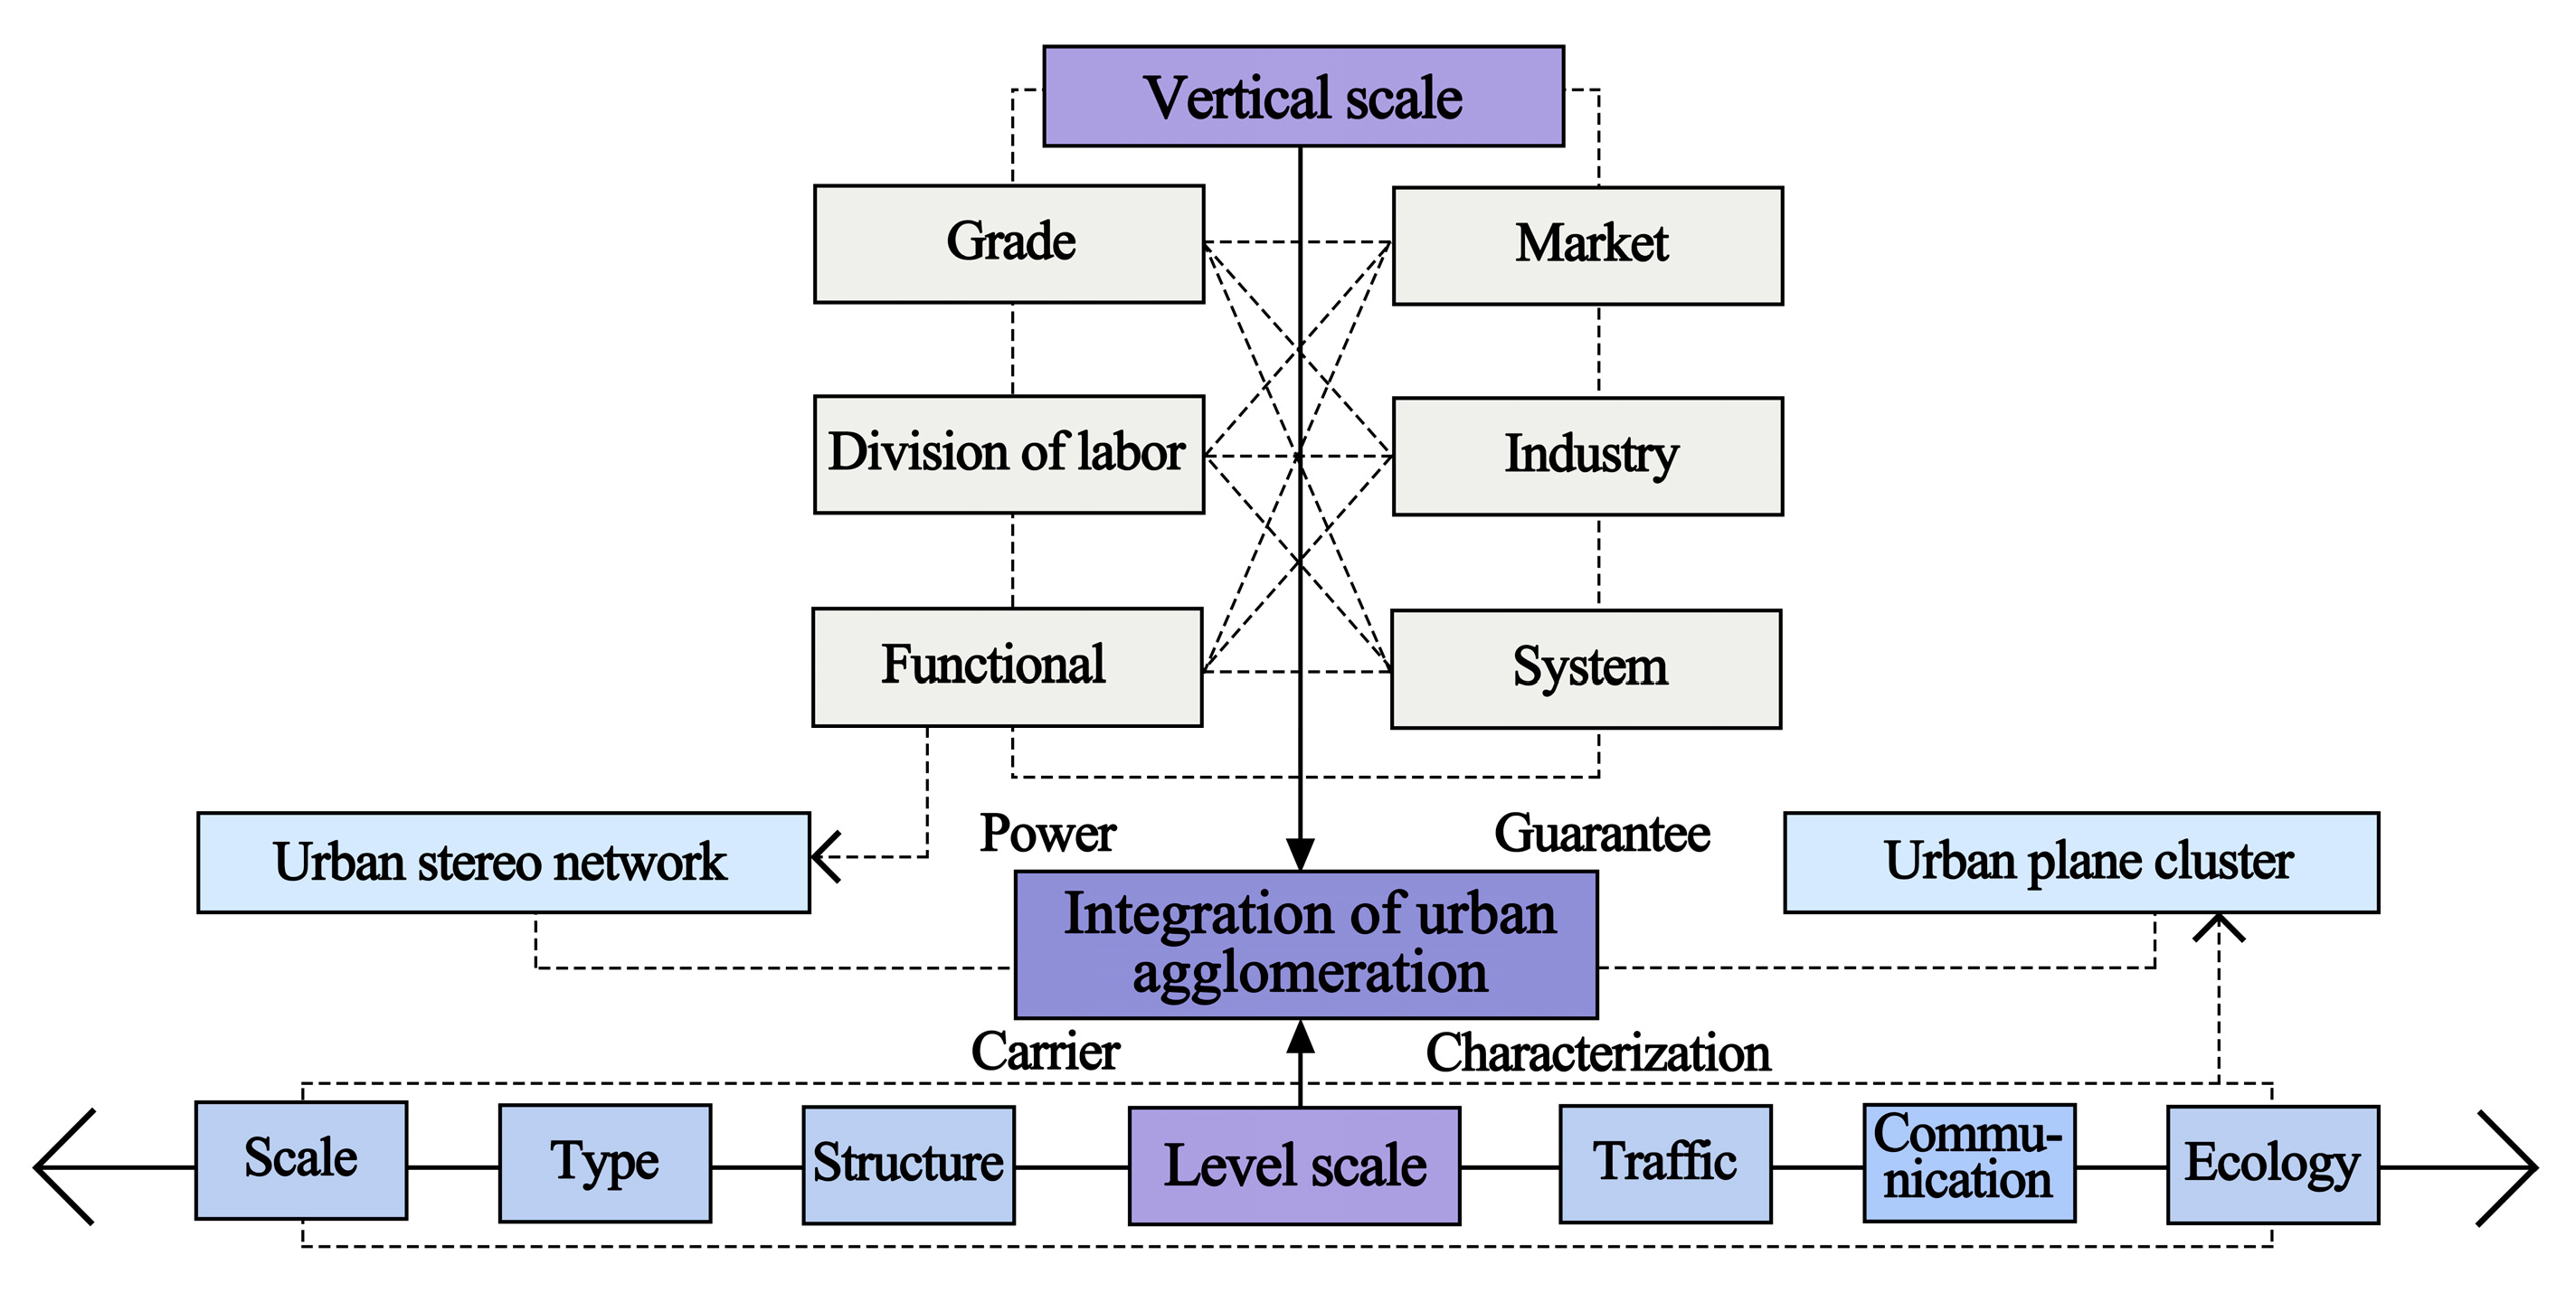
2.2. Indicator System

(1)
Measurement of regional integration level
Since the “the 13th Five-Year Plan”, the development of the Chengdu–Chongqing region has entered the fast lane, and the relationship between the “twin cities” has shifted from competition to cooperation based on national strategies. In this context, we drew on the content of the development dividend theory to construct a measurement model of the integration of the CCUA containing both horizontal and vertical axes. That is, we constructed an H-V model of regional integration (Figure 2). The horizontal axis characterizes the horizontal scale representing geospatial factors, referring to interconnected urban planar clusters of different scales, types and structures, mainly covering factors that directly act on geographic space, such as transportation, communication and ecological space. The vertical axis characterizes the vertical scale of non-geospatial factors, referring to the mutually complementary three-dimensional network of cities with different levels, different divisions of labor and different functions, mainly covering the factors that indirectly act on geographic space such as the market, industry, systems and the economy. The integration of urban agglomerations is subject to both horizontal and vertical scales. The horizontal pursuit mainly includes the continuous expansion of geographic space and increasingly strong ties, which is an important carrier and external representation of urban agglomeration integration; the vertical pursuit mainly includes the common development of the remaining elements, which is an important power source and guarantee of urban agglomeration integration.
Based on the above model, we constructed a comprehensive evaluation index system of the integration level of the CCUA consisting of 1 target layer, 2 secondary target layers, 5 control layers, 6 first-level indicators and 10 second-level indicators (Table 1).
First of all, spatial integration is the carrier of urban agglomeration integration. Transportation, as a social prior capital, has a significant contribution to bringing geosocial space closer and promoting regional economic growth [59]. As important transportation infrastructures in the CCUA, the railroad and highway are highly representative, so train frequency and highway density in the CCUA from 2011 to 2020 are selected as positive indicators to measure transportation.
Second, market integration is the root of urban agglomeration integration. We measured market integration through product and factor markets. The degree of product market segmentation is measured by the market segmentation index, and the fluctuation of the relative price difference of 120 city pairs is measured by the consumer price index in the last 10 years in 16 cities. If the fluctuation tends to converge over time, it indicates that the inter-regional transaction costs decrease, the degree of market segmentation decreases and market integration increases, and vice versa, it decreases [9]. The level of factor market integration is characterized by three aspects: capital market similarity, technology market similarity and labor market similarity. The similarity of the capital market is compounded by three indicators: the amount of actual foreign capital used as a share of GDP, the balance of deposits in financial institutions per capita and the balance of loans in financial institutions per capita. The similarity of the technology market is compounded by two indicators: the amount of funds spent on scientific and technological activities per capita and the number of patent applications per capita. Finally, the similarity of the labor market is characterized by the number of social employees as a share of the total population. The results of composite indicators are synthesized from specific indicators using the entropy method and by calculating the coefficient of variation.
Third, the level of industrial integration mainly depends on whether the industrial division of labor and production layout between cities is reasonable. The Krugman index and the similarity coefficient of industrial structure are commonly used indicators to measure the industrial division of labor. Among them, the Krugman index directly reflects the degree of specialization and division of labor of regional industries, and the similarity coefficient of industrial structure reflects the degree of isomorphism of regional industries; both of methods jointly measure regional industrial integration from the front and side, so they are fused to construct an industrial integration index to measure the level of industrial integration of the CCUA [60].
Fourth, economic integration is the driving force behind the integration of urban agglomerations. The economic development gap often hinders the flow of commerce and other factors, so the economic integration indicator is selected from the opposite perspective of economic integration, which is the economic development gap. Since the urban GDP per capita can characterize the level of economic development and the standard deviation can reflect the degree of difference between indicators, we calculated the standard deviation of the GDP per capita of the CCUA from 2011 to 2020 using the standard deviation value method as an inverse indicator to measure the level of economic integration. The larger the value of the standard deviation is, the greater the difference in the level of economic development among cities within the urban agglomerations, the greater the hindrance to the economic integration of the urban agglomerations and the lower the level of economic integration.
Finally, institutional integration is the guarantee of urban agglomeration integration. The government’s macro-control of coordinated regional development is reflected in strategic agreements and policy regimes. The assignment method is as follows: the value assigned to the year and after the implementation of the policy in the region is 1, and the value assigned to before the implementation of the policy in the region is 0.
(2)
EE measurement of cities
Referring to previous practices [51,61,62], a system of EE indicators is constructed (Table 2). The indicator contains four resource inputs, namely labor, capital, energy and land; three desired outputs, namely GDP, tax revenue and urban greenery; and three undesirable outputs, namely sulfur dioxide, industrial effluent and smoke and dust. In particular, capital stock is measured using the perpetual inventory method [53], nighttime lighting data are extracted by ArcGIS and the missing data are derived by interpolation.

2.3. Weight Determination

The entropy method is derived from the concept of thermodynamics in physics and determines the indicator weight through the degree of dispersion of the indicator data. The greater the dispersion of the data is and the lower the information entropy is, the greater the amount of information it provides, the greater the influence of the indicator and the greater the weighting is, and vice versa [63]. The entropy method is an objective evaluation method, which can effectively avoid the arbitrariness of subjective assignment and solve the problem of overlapping information among multiple indicators, thus making the evaluation of indicators more scientific and accurate. The main steps are as follows [64].
Data Normalization: As there are differences in the scale, order of magnitude and positive and negative orientation of the indicators, the initial data need to be standardized. When a higher indicator value is more favorable to the development of the system, the positive indicator calculation method is used:
a i j = x i j m i n x i j m a x x i j m i n x i j   , i = 1 ,   2 ,   ,   n ;   j = 1 ,   2 ,   ,   m
If a smaller indicator is better for the development of the system, a negative indicator calculation is used:
a i j = m a x x i j x i j m a x x i j m i n x i j ,     i = 1 ,   2 ,   ,   n ;   j = 1 ,   2 ,   ,   m
The weight of the value of indicator j in year i is calculated as:
Y i j = a i j i = 1 m a i j
The information entropy of the indicator is calculated as:
e j = k i = 1 m   Y i j × I n Y i j   ,   let   k = 1 I n m     ,     then   0 e j 1
The information entropy redundancy is calculated as:
d j = 1 e j
The weighting of the indicator is calculated as:
w i = d i j = 1 n d j
The single indicator evaluation score is calculated as:
S i j = w i × a i j
The combined level score for year i is calculated as:
S i = j n S i j
In the above equations, x i j represents the value of the j evaluation indicator in the i year, m i n x j and m a x x j are the minimum and maximum values of the j evaluation indicator in all years, respectively, m is the number of years of evaluation and n is the number of indicators.

2.4. Other Methods

(1)
Market Segmentation Index
The market split index follows the relative price variance measure used by Parsley and Wei. Specifically, we assumed that there are two regions: i and j. p i k , t is the price of commodity k in region i in period t and p j k , t is the price of commodity k in region j in period t. The calculation steps are as follows [65].
We calculate the absolute magnitude of the relative price Δ Q i j , k , t , and the formula is:
Δ Q i j , k , t = l n p i k , t l n p i k , t 1 l n p j k , t l n p j k , t 1
We use the de-meaning method to eliminate the impact of fixed effects, assuming that Δ Q i j , k , t consists of a fixed effect a k and a random effect ξ i j , k , t , with the fixed effect only being related to the type of commodity and the random effect being related to the particular market environment of the two locations. To eliminate the a k term, Δ Q i j , k , t for a given year t and a given commodity type k should be averaged across N city pairs to obtain Δ Q k , t ¯ , and then this mean should be subtracted from each of the N  Δ Q i j , k , t to obtain:
Δ Q i j , k , t Δ Q k , t ¯ = a k a k ¯ + ξ i j , k , t ξ i j , k , t ¯
where q i j , k , t is used to calculate the relative price change of the variance. It is only related to regional segmentation factors and some random factors, reflecting the degree of regional market segmentation, and its variance is V a r   ( q i j , k , t ) :
q i j , k , t = ξ i j , k , t ξ i j , k , t ¯ = Δ Q i j , k , t Δ Q k , t ¯
(2)
Krugman Index
The Krugman index, first proposed by Paul Krugman in 1991 in his study of localization and trade, is also known as the industry division of labor index or the industrial specialization coefficient, and is now often used to measure the overall degree of variation in industrial structure between regions [66].
The calculation formula is:
K I i j = k = 1 n X i k X j k
where X i k denotes the share of industry k in the whole industry in region i and X j k denotes the share of industry k in the whole industry in region j. K I i j denotes the Krugman index, which ranges from 0 to 2. When region i and region j have exactly the same industrial structure, K I i j is 0. When the industrial structure of region i and region j are completely different, K I i j is the sum of the shares of all industries in region i and region j, which is 2. Krugman later goes on to note that this index also provides a broad measure of the degree of the industrial division of labor between regions. In general, the smaller the value of the index is, the stronger the degree of industrial isomorphism between regions is. The smaller the degree of the division of labor between the two regions is, and conversely, the weaker the degree of isomorphism is, the greater the degree of the division of labor is.
(3)
Similar coefficient of industrial structure
The main industrial developments of the cities in the region are compared with each other to measure the degree of industrial layout differentiation between cities. Let Simpq be the similarity coefficient of industrial structure between city p and city q [67]:
S i m p q = i = 1 n   Z p i Z q i i = 1 n Z p i 2 × i = 1 n Z q i 2 ,   i = 1 ,   2 ,   3 ,   ,   n
here, Zpi is the total value of the i industrial sector of city p and Zqi is the total value of the i industrial sector of city q. The indicator Simpq is in the range of [0, 1]. When it is close to 1, it proves that the more obvious the trend of industrial isomorphism between p and q, the worse the degree of integration is. Conversely, the greater the variability of industrial distribution is, the better the degree of integration is.
(4)
Super-SBM model
The DEA analysis proposed by Charnes and Cooper is currently favored by most scholars because it can effectively solve the problem of inconsistency between input and output units [68]. Tone further improved the DEA model by proposing the Super-SBM model, which solves the problem that multiple decision units cannot be further distinguished when their efficiency value is 1 [69]. Therefore, this paper uses the Super-SBM model to measure the EE, which is shown in the following equation [70]:
m i n ρ = 1 m i = 1 m   x ¯ x i k 1 r 1 + r 2   ( s = 1 r 1 y d ¯ y s k d + q = 1 r 2 y u ¯ y q k u )
x j = 1 , k n x i j λ j ;   y d ¯ j = 1 , k n y s j d λ j   y d ¯ j = 1 , k n y q j d λ j ;   x j = 1 , k n x k   y d ¯ y k d ;   y u ¯ y k u ; λ j 0 ,   i = 1 , 2 , , m ;   j = 1 , 2 , , n S = 1 , 2 , ,   r 1 ;   q = 1 , 2 , ,   r 2
where n decision units are assumed, each of which consists of input m, desired output r 1 and undesired output r 2 ; x, y d , y u are elements in the corresponding input matrix, desired output matrix and undesired output matrix, respectively; and ρ is the urban EE value.

3. Results

3.1. The Regional Integration Level of the CCUA Is Constantly Improving

Firstly, the level of regional integration of the CCUA has basically increased year by year from 2011 to 2020, with a large margin. The comprehensive score has increased by nearly 10 times from 0.0986 in 2011 to 0.9425 in 2020 (Figure 3).
Secondly, the development of regional integration in the CCUA can be divided into two distinct phases (Figure 3): first, the overall level of regional integration grew at a slower rate from 2011 to 2015, and second, the level of regional integration grew at a significantly faster rate from 2016 to 2020. The reason for this is that the State Council approved the “Regional Planning for the Chengdu-Chongqing Economic Zone” in 2011, and for the first time the CCUA was planned as an integrated economic zone on a national scale, but construction facilitating that integration is still in a preliminary stage. Therefore, the development is relatively flat. The National Development and Reform Commission issued the “CCUA Development Plan” in 2016, which has effectively promoted the socio-economic development of the urban agglomeration, improved infrastructure conditions, accelerated the flow of various factors in the region and introduced many policies beneficial to the integrated development, which greatly contributed to the level of development of regional integration.
Finally, specifically, the spatial, market, industrial, economic and institutional integration all increased overall, with market integration playing the largest role in influencing regional integration, followed by institutional integration (Figure 3), which means that the integration of product and factor markets within the CCUA had a greater impact during the study period, with the government playing an increasingly important role as the main policy maker and implementer in accelerating the integration of the urban agglomeration.

3.2. Regional Integration Has Enhanced the EEs of Cities in the Region

In general, the EEs of most cities have improved with the improvement in the integration level of the CCUA, which can be divided into the following types: First, with the improvement in the level of regional integration, the urban EE showed an approximate linear growth relationship, such as in Chongqing, Chengdu, Mianyang, Deyang and Nanchong (Figure 4). Second, when regional integration had a low score in the early stage, urban EE fluctuated or even declined. However, when the level of regional integration was high, especially above 0.7, the urban EE increased rapidly and generally presented a fluctuating or upward sloping “V” or “U” shape, such as in Dazhou, Guang’an, Leshan, Meishan and Ziyang (Figure 5).

3.3. Regional Integration Has Not Really Improved the EEs of Cities in the Region

The improvement in the regional integration level of the CCUA has had a fluctuating impact on EEs of Suining and Zigong, but has not produced an improvement effect. The changes in the EEs of Neijiang and Yibin are more specific, with a “V” or “U” shape, but their EEs in the final year are no greater than in the initial year. The EEs of Luzhou and Ya’an fluctuated more and improved very little (Figure 6).

3.4. Mechanism Analysis

Because urban EE takes into account both socio-economic development and resources and environment, the impact of the regional integration of the CCUA on urban EE in the region should be considered in terms of economic and eco-environmental effects.
The economic effect mainly represents how the internal integration of urban agglomeration affects the EE by affecting the urban economy in the region, mainly including the following two situations. On the one hand, regional integration has significantly promoted the economic growth of some cities in the region and improved EE. There are two main reasons for this: (1) In terms of scale effect, based on the support of national and local policies, to some extent, the integration of the CCUA has broken the constraints of geographical space and administrative barriers between cities in Chongqing and Sichuan, integrated the previously fragmented single markets, expanded the market scale, reduced the circulation cost of various regional production factors, improved the efficiency of resource allocation and has thus provided good conditions for industrial spatial transfer and the promotion of regional specialization. Industrial transfer and agglomeration further generate economies of scale through input sharing, labor market clustering, knowledge spillover and others [71]. The emergence of such economies of scale reduces the production costs of enterprises and improves production efficiency, thus promoting the economic growth of most cities. (2) In terms of competitive effects, regional integration has reduced the local protection and market barriers of the original industries in the CCUA, enhanced the intensity of competition among enterprises and reduced the rent-seeking space of enterprises. Enterprises can only gain more market share and excess profits by continuously increasing independent innovation and improving production efficiency, while inefficient enterprises will accelerate their exit from the market [72]. The survival of the fittest brought about by the competitive effect can improve the production efficiency of most cities in the CCUA, accelerate the elimination of less-developed production capacity and inefficient enterprises, promote the flow of factor resources to departments with high productivity and efficiency, reduce resource mismatch and thus promote economic growth [73]. Specifically, the construction of several sections of railways was accelerated, including the Chengdu–Chongqing Central High-speed Railway, the Chengdu–Dazhou–Wanzhou High-speed Railway, the Chongqing–Qianjiang Railway, the Chengdu–Zigong–Yibin High-speed Railway, the Sichuan–Chongqing section of the Chongqing–Kunming High-speed Railway and the Ankang–Chongqing section of the Xi’an–Chongqing High-speed Railway. The transportation accessibility of the CCUA has been continuously improved, and the growth of the Chongqing and Chengdu metropolitan area (a one-hour “commuting circle”) is accelerating. At the same time, the CCUA has jointly attracted investment, built industrial cooperation parks, and built four world-class industrial clusters such as automobiles, electronic information, equipment manufacturing and specialty consumer goods. In particular, the electronic information cluster has been included in the third batch of advanced manufacturing clusters in China, which has gradually addressed the defects of insufficient industrial convergence and serious homogenization competition between Sichuan and Chongqing, has jointly built a supply and demand information docking platform for the industrial chain and has promoted the transformation and upgrading of traditional advantageous industries. In 2021, the added value of above-scale industries in the CCUA increased by 10.7% year-on-year, 1.1 percentage points higher than that of China as a whole, and its electronic information industry exceeded CNY 2 trillion.
On the other hand, for one thing, the impact of regional integration on the economic growth of some cities was first promoting and then inhibiting, or first inhibiting and then promoting [22]. For another, this impact is also related to the development position in which the city is located; that is, there is heterogeneity in the impact of regional integration on the economic growth of cities in the CCUA, which determined by two forces, the spillover effect and the siphoning effect [73,74]. At a stage of high trade costs, severe market segmentation and very low regional economic integration, the partial improvement in the efficiency and integration of economic agglomeration has helped to promote the economic growth of some cities and has inhibited it in others because of the “black light” and edge effects. However, with the improvement in the level of market integration, even to the advanced stage, the diffusion effect has gradually increased or even exceeded the agglomeration effect. Regional integration has enhanced its inhibition on the economic growth of some cities, but it has also promoted the economic growth of marginalized cities. For example, when the spillover effect is greater than the siphon effect, regional integration generally has a greater impact on the economic development of peripheral cities; when the siphon effect is greater than the spillover effect, central cities will benefit more from the construction of regional integration. In terms of the actual situation of the CCUA, in the first three quarters of 2022, the gross regional product of the main metropolitan area of Chongqing and Chengdu was CNY 1.6 trillion and CNY 1.49 trillion, respectively. Chengdu and Chongqing are the well-deserved “polar core” of the circle. On the one hand, the surrounding cities can take advantage of Chengdu’ and Chongqing as economic centers to enjoy the spillover of capital, technology and knowledge and can enhance the efficiency of capital allocation by reducing transaction costs and improving information asymmetry, thus promoting overall economic and industrial development. On the other hand, the surrounding cities will also be affected by the negative externalities of Chengdu and Chongqing. This is due to the lack of absorption and bearing capacity of peripheral cities and their further loss of human and material capital because of insufficient supporting measures. In this context, the continuous siphoning of resource elements and the imbalance of policy guidance will aggravate the “poverty” of peripheral cities and cause the imbalance of regional economic development. As a result, the increased level of integration of the CCUA has not always contributed to the economic efficiency of the cities in the region.
At the same time, regional integration affects urban EE by influencing the urban ecology of the region. The two main scenarios are as follows: first, the improvement in regional integration has reduced the level of environmental pollution of cities in the region. The direct impact of regional integration on urban pollution reduction includes the establishment of a joint pollution prevention and control mechanism and collaborative governance in urban agglomeration, which can realize the internalization of the externalities of environmental pollution in different cities and solve the “prisoner’s dilemma” problem in the cross-regional governance of environmental pollution. Moreover, the intermediate mechanism of regional integration for pollution reduction is reflected in the following aspects: ① Regional integration has made energy trading between cities possible according to the advantages of division of labor. The elimination of trade barriers in energy-rich cities has greatly reduced the transport costs of energy trade in energy-poor areas, helping to improve the total factor productivity of energy and reducing the environmental load [75]. ② In the classical new economic geography model, regional integration promotes the realization of industrial agglomeration, contributes to the exploitation of enterprise agglomeration externalities, enables the diffusion and sharing of environmental technologies, and improves the green growth efficiency of cities [23,76]. ③ Regional integration promotes the transformation and upgrading of the industrial structure of cities and reduces the carbon emission intensity of enterprise production [77]. For example, the CCUA has systematically planned its ecological and environmental protection strategy and continuously improved its ecological and environmental protection cooperation mechanism. For example, they have successively jointly issued the “Ecological and Environmental Protection Plan for the Twin Cities Economic Circle in the Chengdu-Chongqing Region”, formulated the “Work Points for 2022 on Ecological and Environmental Protection in the Construction of the Twin Cities Economic Circle in the Chengdu–Chongqing Region”, issued the “Work Plan for Deepening Cooperation with Sichuan and Chongqing to Promote Ecological and Environmental Protection in the Twin Cities Economic Circle in the Chengdu-Chongqing Region” and signed the inter-provincial and municipal ecological environment protection joint supervision agreement and the ecological environment joint law enforcement work agreement. Joint law enforcement has been carried out more than 70 times, more than 500 ecological and environmental problems have been solved and 28 neighboring districts and counties have organized to carry out the joint investigation and rectification of environmental safety hazards. Meanwhile, the CCUA has also continued to promote the green and low-carbon transformation of regional industries, such as by establishing an ecological environmental zoning control system, actively promoting the implementation and application of achievements and industrial upgrading and transformation and steadily promoting cooperation in areas such as carbon finance and carbon markets. By the end of 2021, Chongqing’s carbon market quota has been sold for about 28 million tons, and Sichuan’s national voluntary greenhouse gas emission reduction has been sold for about 34 million tons.
On the other hand, regional market integration may also exacerbate environmental pollution in a very small number of cities or may have an uncertain impact. Environmental pollution is often seen in normative theories as a by-product of economic growth. The “trade transfer effect” caused by promoting local integration in the short term is conducive to local economic growth and exacerbates local pollution to some extent. At the same time, the CCUA is an area with a relatively developed economy and a high intensity of environmental regulation. The introduction of foreign direct investment in the region mainly flows to technology-intensive and knowledge-intensive industries, while the traditional heavy chemical enterprises with large emissions of industrial sulfur dioxide, smoke and waste water gradually transfer to the less economically developed cities.
In summary, the impact of the integration process of the CCUA on the EE of cities is broadly focused on two aspects (Figure 7): On the one hand, regional integration can reduce the oppressiveness of the ecological environment by improving economic integration, economic efficiency, labor productivity, unit energy output, economic management technology level and reducing energy consumption, thereby enhancing EE. The higher the level of regional integration, the higher the mandatory constraints on the ecological environment, thus prompting the upgrading of urban industries and green transformation. For example, the mandatory withdrawal of environmentally polluting products with a low market share in turn promotes a higher level of regional integration. Moreover, the strengthening of regional integration has facilitated the movement of labor, capital and other factors between cities, resulting in less ecological oppression and greater EE in mountainous and hilly areas. This is the basic logic behind the finding that the improvement in the integration level of the CCUA has promoted the improvement in the EEs of most cities. On the other hand, resource-based or marginal cities within the CCUA, such as Suining, Zigong, Neijiang, Yibin, Luzhou, Ya’an and other cities located in mountainous or hilly areas, mainly transport labor and resources to the surrounding cities. Their economic transformation is poor and their degree of integration into the urban agglomeration is low. They enjoy less benefits from agglomeration, and their competitiveness is weak; that is, their regional integration leads to high-quality resource output, which leads to failure to really improve the EE of these cities.

4. Discussion

The results of this paper show that as the level of integration of the CCUA increases, the changes in urban EE can be divided into three categories.
The first category shows an approximately linear growth relationship, such as in Chongqing, Chengdu, Mianyang, Deyang and Nanchong. These cities tend to have a good level of development themselves. For example, Chengdu and Chongqing are deservedly the “extreme core”; Mianyang vigorously promotes the development of electronic information, equipment manufacturing, energy and the chemical, food and beverage industries, and it is known as the second city in Sichuan Province; Nanchong has a comprehensive three-dimensional transportation network of water, land and air; Deyang’s GDP ranks fourth in the province and is included in the 2022 list of the top 100 Chinese cities in terms of scientific and technological innovation. These cities have inherent advantages in attracting various factor resources, industrial optimization and technological progress, and are consequently able to enjoy the maximum benefits of regional integration.
The second category is cities with a fluctuating upward relationship, such as Dazhou, Guang’an, Leshan, Meishan and Ziyang. In the early stage of regional integration, the EE of these cities fluctuates or declines; in the later stage, the EE suddenly rises rapidly. These cities often have a weak economic base of their own and are driven by regional integration. Firstly, cities such as Dazhou and Guang’an are constantly importing labor, energy and other factors to the core cities. These are not only large labor-exporting cities but also mature resource-based cities with a large outflow of quality production factors out of the local area. Secondly, cities in this category are constantly inheriting the less-developed industries of the more developed cities and are affected by the “pollution halo” and “darkness under the lights” of these more developed cities. For example, Meishan and Ziyang are connected to Chengdu and Chongqing and are most affected by the siphoning or diffusion of the core cities. Thirdly, cities such as Leshan have difficulties optimizing their industries. Although there are rich tourism resources, high energy consumption and high pollution industries are still the leading forms industry in this category of cities. The industrial linkage is not high, and the tourism industry chain is not complete.
The third category is the relationships where EE has not been truly enhanced, such as Neijiang, Yibin, Luzhou, Ya’an, Suining and Zigong. These cities tend to have poor industrial transformation and rely on low-energy industries to develop their economies, such as Ya’an and Zigong, which are mature resource-based cities, and Luzhou, which is a declining resource-based city. Resource-based cities generally have the problem of resource-based industries being “dominant”, with an unreasonable industrial structure and a large proportion of resource-based industries, which is not conducive to the sustainable development of a city. Resource-based cities should develop and utilize resources efficiently; improve the technology level of resource-based industries, extend the industrial chain; accelerate the cultivation of a number of leading enterprises and industrial clusters for the deep processing of resources; attach great importance to ecological and environmental issues; internalize the costs of ecological and environmental restoration and treatment of enterprises; and vigorously protect and improve people’s livelihood. However, it is worth mentioning the city of Yibin, which has grown very rapidly in the last decade. In the early stage of regional integration, Yibin vigorously developed its secondary industries and built a strong industrial city, with the highest growth rates in the wine and food industries and the comprehensive energy industry. Although economic development was at a high stage, ecological and environmental construction had to be given a red light. In the latter period, Yibin actively transformed and upgraded its industries; organized and completed industrial development plans for rail transportation, intelligent terminals, new energy vehicles, general aviation and new materials; built Yibin University City and Yibin Science and Technology Innovation City; and significantly improved its EE. Although Yibin is in the third category because its EE is not significantly higher than that of the beginning of the year, its EE has been rising continuously since 2015, with a good development prospect, and it is an example of urban transformation and development!
The difference between this paper and previous studies is that fewer studies have suggested that the impact of regional integration on EE is also influenced by complex factors such as the stage of urban development, urban location and their own conditions and made corresponding research hypotheses and classifications. This is the greatest contribution of this paper.
The shortcomings of this paper include the following three points: Firstly, subject to the data, the study spans a relatively short period of time and fails to make a comparative analysis between different urban agglomerations, and the analysis of the mechanism is not deep enough. Secondly, we chose the time period from 2011 to 2020 for the study, with the year 2020 coinciding with the outbreak of COVID-19. The impacts of COVID-19 on the economy and ecology of the CCUA are not considered in this paper. A time series including the period from 2020 to 2022 should be chosen in the future to explore what impacts COVID-19 have had. Thirdly, this paper has given less consideration to the economic level of ordinary citizens and households in the CCUA and its surrounding areas, and will consider developing this part of the work in the future. In summary, we look forward to further research in the future.

5. Conclusions

CCUACCUA (1) The level of integration of the CCUA shows an overall upward trend from 2011 to 2020, with a nearly 10-fold increase in the composite score. Its integration process can be divided into two distinct phases: the slow integration growth phase from 2011 to 2015 and the accelerated integration growth phase from 2016 to 2020. Moreover, regional integration is influenced most by market integration and second most by institutional integration. There is a significant macro-led role for the government.
(2) The increased level of integration of urban agglomerations has generally improved the EE of cities in the region, for example, the near linear level of regional integration of cities such as Chengdu, Chongqing, Mianyang, Deyang and Nanchong has improved their respective EE. However, regional integration may also have fluctuating effects on EE. For example, the level of regional integration in cities such as Dazhou, Guang’an, Leshan, Meishan and Ziyang fluctuates and improves with their respective EE. At the same time, there are also cases where EE does not really improve, for example, the EEs of cities such as Neijiang, Yibin, Luzhou, Ya’an, Suining and Zigong show fluctuating, decreasing or flat trends and do not really improve.
(3) The influence mechanism of the level of integration of the CCUA on urban EE is mainly considered from two aspects: the economic effect and the eco-environmental effect. On the one hand, regional integration can promote economic growth by speeding up the barrier-free flow of factors, integrating resource allocation efficiency, reducing costs, bringing into play the scale effect and releasing the competitive effect of enterprises, but the comparison between the power of the spillover effect and the siphon effect determines whether the EE of each city is enhanced. On the other hand, regional integration can promote the internalization of urban environmental pollution externalities and thus solve the “prisoner’s dilemma” of environmental pollution management across regions and improve the ecological environment by increasing TFP, sharing environmental technology and improving cross-regional pollution management and ecological construction cooperation mechanisms. However, there are still a few cities where the EE has declined due to the “trade diversion effect”.
(4) The reasons for the classification of the impact of the level of integration of urban agglomerations on the EE of cities in the domain include three main points: Cities in the first category are well developed, have inherent advantages in all respects and tend to enjoy the maximum benefits of regional integration. The second category of cities, with their own weak economic base, have siphoned off a large number of high-quality resource elements and are constantly taking over less-developed industries from more developed cities, often fluctuating in the constant pull of the diffusion and siphoning effects to enhance EE. The third category of cities is dominated by resource-based cities with a single, low-grade and difficult-to-transform industry, where the EE cannot be truly enhanced!

Author Contributions

Conceptualization, data curation, software, visualization, formal analysis, writing—original draft, Y.J.; funding acquisition, methodology, resources, validation, project administration Y.Y.; writing—review and editing, Y.Y. and J.X. All authors have read and agreed to the published version of the manuscript.

Funding

The National Natural Science Foundation of China (41971198) and The Second Tibetan Plateau Scientific Expedition and Research Project (2019QZKK1005).

Institutional Review Board Statement

Not applicable.

Informed Consent Statement

Informed consent was obtained from all subjects involved in the study.

Data Availability Statement

Data will be made available on request.

Conflicts of Interest

The authors declare no conflict of interest.

References

  1. Spiridonov, V.; Shabiev, S.; Aliukov, S. Scientific Aspects of the Study of Transcontinental Relations and Global Settlement. Land 2022, 11, 342. [Google Scholar] [CrossRef]
  2. Chen, T.; He, C. Research Progress in International Trade Geography. Prog. Geogr. Sci. 2020, 39, 1732–1746. Available online: https://kns.cnki.net/kcms/detail/detail.aspx?dbcode=CJFD&dbname=CJFDLAST2020&filename=DLKJ202010012&uniplatform=NZKPT&v=Qe-SZJMirTb1TD9pJdgvs1azgLWYWUsWXzeRBjFjhw4AVyagaQuLkYYEws7BTcku (accessed on 20 January 2023). [CrossRef]
  3. Sun, J.; Jiang, Z. The Path of High-quality Development in Coastal Areas of China. Acta Geogr. Sin. 2021, 76, 277–294. [Google Scholar] [CrossRef]
  4. Havens, R.M.; Balassa, B. The Theory of Economic Integration. J. Political Econ. 1961, 29, 47. [Google Scholar] [CrossRef]
  5. Aggarwal, V.K.; Koo, M.G. Beyond Network Power? The Dynamics of Formal Economic Integration in Northeast Asia. Pac. Rev. 2005, 18, 189–216. [Google Scholar] [CrossRef]
  6. Schiff, M.; Winters, L.A. Regional Integration and Development. World Bank Publ. 2003, 82, 171. [Google Scholar] [CrossRef]
  7. Lu, D.; Zhang, Q. Analysis on the Degree of Regional Integration in Beijing-Tianjin Region. China Popul. Resour. Environ. 2010, 20, 162–167. [Google Scholar] [CrossRef]
  8. Chen, Z.; Knez, P.J. Measurement of Market Integration and Arbitrage. Rev. Financ. Stud. 2015, 2, 2. [Google Scholar] [CrossRef]
  9. Estrada, M. The Global Dimension of the Regional Integration Model (GDRI-Model). Mod. Econ. 2013, 4, 346–369. [Google Scholar] [CrossRef] [Green Version]
  10. Chen, H.; Li, G. Study on the Level and Procedure of Beijing-Tianjin-Hebei Metropolitan Regional Market Integration from 1985 to 2007. Geogr. Res. 2009, 28, 1476–1483. Available online: https://kns.cnki.net/kcms/detail/detail.aspx?FileName=DLYJ200906004&DbName=CJFQ2009 (accessed on 20 January 2023).
  11. Lou, W. Measurement and Comparison of Regional Economic Integration in Beijing-Tianjin-Hebei, Yangtze River Delta and Pearl River Delta. Stat. Obs. 2014, 2, 90–92. [Google Scholar] [CrossRef]
  12. Duan, D.; Chen, Y.; Du, D. Research on the Regional Integration Development of China’s Three Major Urban Agglomerations from the Perspective of Technology Transfer. Sci. Geogr. Sin. 2019, 39, 1581–1591. [Google Scholar] [CrossRef]
  13. Chen, L.; Li, X.; Du, Z.; Long, R. The Spatial Effect of the Economic Growth of Changsha-Zhuzhou-Tanzhou Integration. Econ. Geogr. 2016, 36, 64–72. [Google Scholar] [CrossRef]
  14. Lu, X.; Bai, M.; Kuang, B.; Chen, D. Unlocking the Relationship between Land Finance and Regional Integration. Land 2021, 10, 895. [Google Scholar] [CrossRef]
  15. Li, H.; Huang, F.; Xu, Y. Does regional economic integration promote foreign capital inflow?—Based on empirical analysis of Yangtze River Delta Urban Agglomeration. Inq. Into Econ. Issues 2020, 10, 81–93. Available online: https://kns.cnki.net/kcms2/article/abstract?v=3uoqIhG8C44YLTlOAiTRKibYlV5Vjs7i8oRR1PAr7RxjuAJk4dHXolRJKeYjvqtwRqlWwR3u-wVBu76U-QT2Cv3K5wQp5XwC&uniplatform=NZKPT&src=copy (accessed on 2 March 2023).
  16. Zhang, K. Regional Integration, Environmental pollution and Social welfare. J. Financ. Res. 2020, 12, 114–131. Available online: https://kns.cnki.net/kcms2/article/abstract?v=3uoqIhG8C44YLTlOAiTRKibYlV5Vjs7iy_Rpms2pqwbFRRUtoUImHeMqUPQGxLI-4GKUlW9mryNwFIDhvwOjiYEQaYUIC_cv&uniplatform=NZKPT&src=copy (accessed on 2 March 2023).
  17. Baas, T.; Brücker, H. Macroeconomic Impact of Eastern Enlargement on Germany and UK: Evidence From a CGE Model. Appl. Econ. Lett. 2010, 17, 125–128. [Google Scholar] [CrossRef]
  18. Elsner, B. Does Emigration Benefit the Stayers? Evidence from EU Enlargement. Soc. Sci. Res. Netw. 2012, 26, 531–553. Available online: https://www.xueshufan.com/publication/3123223777 (accessed on 20 January 2023). [CrossRef]
  19. Wang, X.; Xie, X. The Employment Effect of Regional Integration from the Perspective of Economic Growth and Industrial Agglomeration: An Empirical Study based on the Yangtze River Economic Belt. Inq. Into Econ. Issues 2018, 6, 84–90. Available online: https://kns.cnki.net/kcms2/article/abstract?v=3uoqIhG8C44YLTlOAiTRKibYlV5Vjs7i0-kJR0HYBJ80QN9L51zrP4OHrQwwfsAoty3ZHDUs8ix-si2cM_QoNHl-rqnk0R6N&uniplatform=NZKPT&src=copy (accessed on 2 March 2023).
  20. Xu, Z.; Gao, Y.; Huo, Z. Regional Economic Integration, Producer services Agglomeration and Manufacturing Industry Transformation and Upgrading. Forum Sci. Technol. China 2022, 1, 122–130. [Google Scholar] [CrossRef]
  21. Xheneti, M.; Smallbone, D.; Welter, F. EU Enlargement Effects on Cross-border Informal Entrepreneurial Activities. Eur. Urban Reg. Stud. 2013, 20, 314–328. [Google Scholar] [CrossRef]
  22. Combes, P.P.; Mayer, T.; Thisse, J.F. Economic Geography: The Integration of Regions and Nations. Post-Print 2008, 37, 126–128. [Google Scholar] [CrossRef]
  23. Krugman, P. Increasing Returns and Economic Geography. Soc. Sci. Electron. Publ. 1991, 99, 83–499. [Google Scholar] [CrossRef]
  24. Fujita, M.; Thisse, J.F. Economics of Agglomeration: Cities, Industrial Location, and Regional Growth; Cambridge University Press: Cambridge, UK, 2002; pp. 351–387. [Google Scholar] [CrossRef]
  25. Wang, X.; Xie, X.; Sun, B. Technological Progress Effect Path of Regional Integration: Based on the Empirical Data of the Yangtze River Economic Belt. East China Econ. Manag. 2019, 33, 64–71. [Google Scholar] [CrossRef]
  26. Wu, Q.; Li, H. Study on Energy Efficiency in the Middle Reaches of the Yangtze River City Group. China Popul. Resour. Environ. 2016, 26, 140–146. [Google Scholar] [CrossRef]
  27. Li, P. Environment Technical Efficiency Green Productivity and Sustainable Development. Res. Quant. Econ. Technol. Econ. 2017, 34, 3–23. [Google Scholar] [CrossRef]
  28. You, J.; Chen, X. Whether Regional Integration Cooperation Leads to Pollution Transfer: Evidence from the Enlargementf the Yangtze River Delta Urban Cluster. China Popul. Resour. Environ. 2019, 29, 118–129. [Google Scholar] [CrossRef]
  29. Li, G.; Gao, D.; Lu, S. Regional Integration and Green Development of Urban Agglomerations: Quasi-natural Experiment Based on Yangtze River Delta Expansion. Econ. Surv. 2022, 39, 22–31. [Google Scholar] [CrossRef]
  30. Deng, R.; Zhang, A.; Tang, Y. Impact of Integrated Development of the Yangtze River Economic Belt on Urban Ecological Efficiency—An Empirical Analysis Based on PSM-DID Model. Soft Sci. 2021, 35, 22–27. [Google Scholar] [CrossRef]
  31. Guo, Y.; Cao, X.Z.; Wei, W.D.; Zeng, G. The Impact of Regional Integration in the Yangtze River Delta on Urban Carbon Emissions. Geogr. Res. 2022, 41, 181–192. [Google Scholar] [CrossRef]
  32. Zhang, K. Is Regional Integration Conducive to Reducing Emissions? J. Financ. Res. 2018, 1, 67–83. Available online: https://kns.cnki.net/kcms2/article/abstract?v=3uoqIhG8C44YLTlOAiTRKibYlV5Vjs7i0-kJR0HYBJ80QN9L51zrP-cGZW45rQ6gBqKixHdGBcX3k2lqpyjWWglrgywvZTSV&uniplatform=NZKPT&src=copy (accessed on 2 March 2023).
  33. Li, W.; Yang, S.; Wu, Y. The Impact of Regional Market Integration on Carbon Emission Benefit: A Spatial Econometric Analysis from the Yangtze River Delta. Soft Sci. 2019, 6, 4–26. [Google Scholar] [CrossRef]
  34. Huang, W.; Zhang, Y. Does Regional Integration Strategy Affect the High Quality Development of Urban Economy in China?—An Empirical Study on the Urban Agglomeration of the Yangtze River Economic Belt. Ind. Econ. Res. 2019, 6, 14–26. [Google Scholar] [CrossRef]
  35. Ms, A.; Xin, Z.A.; Ys, B. The Impact of Low-carbon City Construction on Ecological Efficiency: Empirical Evidence from Quasi-natural Experiments. Resour. Conserv. Recycl. 2020, 157, 104777. [Google Scholar] [CrossRef]
  36. Desimone, L.D.; Popoff, F. Eco-Efficiency: The Business Link to Sustainable Development. Int. J. Sustain. High. Educ. 2000, 1, 220–221. [Google Scholar] [CrossRef]
  37. Zheng, D.; Hao, S.; Sun, C. Spatial and Temporal Evolution of Ecological Efficiency in China. Geogr. Res. 2018, 37, 1034–1046. [Google Scholar] [CrossRef]
  38. Yang, Y.; Deng, X. Spatial and Temporal Evolution of Urban Ecological Efficiency and Regional Differences of Influencing Factors in China. Sci. Geogr. Sin. 2019, 33, 1111–1118. [Google Scholar] [CrossRef]
  39. Shen, W.; Hu, Q.; Li, J. Spatial and Temporal Evolution and Spatial Interaction of Regional Eco-efficiency in China. J. Nat. Resour. 2020, 35, 2149–2162. [Google Scholar] [CrossRef]
  40. Dong, F.; Zhang, Y.; Zhang, X. Applying a Data Envelopment Analysis Game Cross-efficiency Model to Examining Regional Ecological Efficiency: Evidence from China. J. Clean. Prod. 2020, 267, 122031. [Google Scholar] [CrossRef]
  41. Han, Y.; Zhang, F.; Huang, L. Does Industrial Upgrading Promote Eco-efficiency?—A Panel Space Estimation Based on Chinese Evidence. Energy Policy 2021, 154, 112286. [Google Scholar] [CrossRef]
  42. Cai, Y.; Wang, H. An Empirical Study on the Impact of Industrial Structure Upgrading on Regional Eco-efficiency. Stat. Decis. 2020, 36, 110–113. [Google Scholar] [CrossRef]
  43. Huang, J.; Xie, Y.; Yu, Y. Urban Competition, Spatial Spillover, and Ecological Efficiency: Effects of High Pressure and Low Suction. China Popul. Resour. Environ. 2018, 28, 1–12. [Google Scholar] [CrossRef]
  44. Huang, J.; Fang, X.; Huang, B. The Driving Mechanism of Spatial Spillover of Urban Eco-efficiency in China: Following the Good and Thinking Together VS Seeing the Bad and Slow Down. China Soft Sci. 2018, 3, 97–109. Available online: https://kns.cnki.net/kcms2/article/abstract?v=3uoqIhG8C44YLTlOAiTRKibYlV5Vjs7i0-kJR0HYBJ80QN9L51zrPy8W2ndCD5mHCs598lZHG7NPU3ajBvdCwnDPfArPbwXB&uniplatform=NZKPT&src=copy (accessed on 2 March 2023).
  45. Tang, C.; Xue, Y.; Wu, H. How Does Telecommunications Infrastructure Affect Eco-efficiency? Evidence from a Quasi-natural Experiment in China. Technol. Soc. 2022, 69, 101963. [Google Scholar] [CrossRef]
  46. Luo, N.; Tian, M.; Yang, J. The Impact of High-speed Rail Network on Urban Eco-efficiency: Based on the Spatial Econometric Study of 277 Prefecture-level Cities in China. China Popul. Resour. Environ. 2019, 29, 1–10. [Google Scholar] [CrossRef]
  47. Li, L.; Xu, W.; Zheng, J. A Study on Spatial Interactive Effects Between Urbanization Process and Ecological Efficiency in the Yellow River Basin. Econ. Surv. 2022, 39, 25–34. [Google Scholar] [CrossRef]
  48. Wen, G.; Liu, M.; Hu, X. Spatial Correlation and Spatial Effect of Cultivated Land Use Ecological Efficiency in the Dongting Lake Plain. Sci. Geogr. Sin. 2022, 46, 1102–1112. [Google Scholar] [CrossRef]
  49. Zaenhaer, D.; Sun, H. Spatial Spillover of Green Technology Innovation on Urban Eco-efficiency and threshold effect analysis. Manag. Decis. 2022, 38, 169–173. [Google Scholar] [CrossRef]
  50. Chen, F.; Ahmad, S.; Arshad, S. Towards Achieving Eco-efficiency in Top 10 Polluted Countries: The Role of Green Technology and Natural Resource Rents. Gondwana Res. 2022, 110, 114–127. [Google Scholar] [CrossRef]
  51. Ren, S.; Li, X.; Yuan, B.; Li, D.; Chen, X. The effects of three types of environmental regulation on eco-efficiency: A cross-region analysis in China. J. Clean. Prod. 2018, 173, 245–255. [Google Scholar] [CrossRef]
  52. Xu, C.; Zhuang, G. Spatial and Temporal Effects of Industrial Agglomeration on Eco-efficiency in Bohai Rim Based on Environmental Regulation. Econ. Surv. 2020, 37, 11–19. [Google Scholar] [CrossRef]
  53. Wang, S.; Hua, G.; Yang, L. Coordinated Development of Economic Growth and Ecological Efficiency in Jiangsu, China. Environ. Sci. Pollut. Res. 2020, 27, 36664–36676. Available online: https://www.zhangqiaokeyan.com/journal-foreign-detail/0704019810984.html (accessed on 20 January 2023). [CrossRef] [PubMed]
  54. Gong, X.; Wang, M.; Zhang, H. FDI, Market Segmentation and Regional Eco-efficiency: Direct Impact and Spillover Effect. China Popul. Resour. Environ. 2018, 28, 95–104. [Google Scholar] [CrossRef]
  55. Pan, M.; Xie, R. Spatial Differentiation of Technological Innovation Driving Green Eco-efficiency. Soft Sci. 2019, 33, 20–25. [Google Scholar] [CrossRef]
  56. Zhou, C.; Shi, C.; Wang, S.; Zhang, G. Estimation of Eco-Efficiency and Its Influencing Factors in Guangdong Province Based on Super-SBM and Panel Regression Models. Ecol. Indic. 2018, 86, 67–80. [Google Scholar] [CrossRef]
  57. Ren, M.; Wang, X.; Liu, Z. Spatial and Temporal Changes of Regional Eco-efficiency and Its Influencing Factors in China. East China Econ. Manag. 2019, 33, 71–79. [Google Scholar] [CrossRef]
  58. Sun, Y.; Jia, Z.; Chen, Q.; Na, H. Spatial Pattern and Spillover Effects of the Urban Land Green Use Efficiency for the Lanzhou-Xining Urban Agglomeration of the Yellow River Basin. Land 2023, 12, 59. [Google Scholar] [CrossRef]
  59. Liu, X.; Liang, C. Analysis of Comprehensive Evaluation of the Integration Level of Urban Agglomerations in China and Their Temporal and Spatial Evolution Characteristics: Concurrent Discussion on the Influence of the Urban Agglomeration Scale. J. Lanzhou Univ. 2021, 49, 49–61. [Google Scholar] [CrossRef]
  60. Li, L. Study on the Model Selection and Mechanism of Integration of the Mid-Yangtze River Urban Agglomeration, 1st ed.; Social Science Literature Press: Beijing, China, 2019; pp. 1–20. [Google Scholar]
  61. Chi, M.; Guo, Q.; Mi, L.; Wang, G.; Song, W. Spatial Distribution of Agricultural Eco-Efficiency and Agriculture High-Quality Development in China. Land 2022, 11, 722. [Google Scholar] [CrossRef]
  62. Jiang, H.; Yin, J.; Qiu, Y.; Zhang, B.; Ding, Y.; Xia, R. Industrial Carbon Emission Efficiency of Cities in the Pearl River Basin: Spatiotemporal Dynamics and Driving Forces. Land 2022, 11, 1129. [Google Scholar] [CrossRef]
  63. Chen, M.; Lu, D.; Zhang, H. Comprehensive Evaluation and the Driving Factors of China’s Urbanization. Acta Geogr. Sin. 2009, 64, 387–398. Available online: https://kns.cnki.net/kcms/detail/detail.aspx?dbcode=CJFD&dbname=CJFD2009&filename=DLXB200904003&uniplatform=NZKPT&v=jHaxNOeVsyTa-enC6fj-7Ti3_W2YaZYpTLVhPDEFnhwDZ7BzKer8l2yJxjltlfkn (accessed on 20 January 2023).
  64. Li, Z.; Luo, Z.; Wang, Y. Suitability Evaluation System for the Shallow Geothermal Energy Implementation in Region by Entropy Weight Method and TOPSIS Method. Renew. Energy 2022, 184, 564–576. [Google Scholar] [CrossRef]
  65. Hajibaba, H.; Grün, B.; Dolnicar, S. Improving the Stability of Market Segmentation Analysis. Int. J. Contemp. Hosp. Manag. 2020, 32, 1393–1411. [Google Scholar] [CrossRef]
  66. Kiseleva, O.; Lebedev, A.; Pinkovetskaia, I. Specialization and Concentration of Small and Medium Enterprises Employees: Russian data. Amazon. Investig. 2019, 8, 6–15. Available online: https://amazoniainvestiga.info/index.php/amazonia/article/view/59 (accessed on 2 March 2023).
  67. Ye, C.; Zhu, J.; Li, S. Assessment and Analysis of Regional Economic Collaborative Development within an Urban Agglomeration: Yangtze River Delta as a Case Study. Habitat Int. 2019, 83, 20–29. [Google Scholar] [CrossRef]
  68. Charnes, A.; Cooper, W.W.; Rhodes, E. Measuring the Efficiency of Decision Making Units. Eur. J. Oper. Res. 1978, 2, 429–444. [Google Scholar] [CrossRef]
  69. Tone, K.A. Slacks-based Measure of Super-efficiency in Data Envelopment Analysis. Eur. J. Oper. Res. 2002, 143, 32–41. [Google Scholar] [CrossRef] [Green Version]
  70. Khan, S.; Cui, Y.; Khan, A. Tracking Sustainable Development Efficiency with Human-Environmental System Relationship: An Application of DPSIR and Super Efficiency SBM Model. Sci. Total Environ. 2021, 783, 146959. [Google Scholar] [CrossRef]
  71. Wang, L.; Shen, D. Study on the Evolution of the Industrial Structure of the Mid-Yangtze River Urban Agglomeration. Reg. Econ. Rev. 2014, 4, 30–37. [Google Scholar] [CrossRef]
  72. Jensen, R.; Miller, N.H. Market Integration, Demand and the Growth of Firms: Evidence from a Natural Experiment in India. Am. Econ. Rev. 2018, 108, 3583–3625. Available online: https://xueshu.baidu.com/usercenter/paper/show?paperid=177k0c90sm6f0690w27x00y0sd356091&site=xueshu_se (accessed on 20 January 2023). [CrossRef] [Green Version]
  73. Ding, J.; Meng, W.; Wang, Q. Regional Integration, Economic Growth and Regional Differences in the Yangtze River Delta—New Evidence from Synthetic Control Method. Soft Sci. 2022, 36, 38–45. [Google Scholar] [CrossRef]
  74. Sun, B. Does Market Integration Reduce Environmental Pollution? Empirical Analysis Based on City Panel Data of the Yangtze River Economic Belt. J. Environ. Econ. 2018, 3, 37–56. [Google Scholar] [CrossRef]
  75. Zhang, C.; Zhang, Z. Spatial Effects of Energy Endowments and Technological Progress on Carbon Intensity in China. China Popul. Resour. Environ. 2015, 25, 37–43. [Google Scholar] [CrossRef]
  76. Dong, B.; Gong, J.; Xin, Z. FDI and environmental regulation: Pollution haven or a race to the top? J. Regul. Econ. 2012, 41, 216–237. [Google Scholar] [CrossRef]
  77. Yan, D.; Sun, W. Impact of regional integration area enlargement on urban carbon emission intensity and mechanism: An empirical study based on the Yangtze River Delta Regional Integration, Economic Growth and Regional Differences in the Yangtze River Delta—New Evidence from Synthetic Control Method. Resour. Sci. 2022, 44, 1358–1372. [Google Scholar] [CrossRef]
Figure 1. Study area.
Land 12 00684 g001
Figure 2. H-V model for urban agglomeration integration.
Land 12 00684 g002
Figure 3. Evolution of regional integration of CCUA.
Land 12 00684 g003
Figure 4. Regional integration of the CCUA linearly improved the EEs of some cities from 2011 to 2020.
Land 12 00684 g004
Figure 5. The regional integration fluctuation of the CCUA has improved the EEs of some cities from 2011 to 2020.
Land 12 00684 g005
Figure 6. Regional integration of the CCUA does not improve the EEs of a few cities during 2011 to 2020.
Land 12 00684 g006
Figure 7. The impact of the integration of the CCUA on the EEs of cities in the region.
Land 12 00684 g007
Table 1. Comprehensive Evaluation Index System of Integration Level of CCUA.
Target LevelSecondary Target LayerControl LevelFirst Level IndicatorsWeightSecond Level IndicatorsWeight
Measurement of the level of integration of urban agglomerationHorizontal DevelopmentSpatial Integration (22.7%)Transportation0.227Number of trains scheduled0.119
Highway density0.108
Vertical DevelopmentMarket Integration (42.1%)Product Market0.045Product Market Segmentation Index0.045
Elemental Market0.376Capital Market Similarity0.087
Technology Market Similarity0.100
Labor Market Similarity0.189
Industry Integration (12.0%)Industry Integration Index0.12Krugman Index0.064
Industrial structure similarity coefficient0.056
Economic Integration (8.3%)Economic Gap0.083Standard deviation of GDP per capita0.083
System Integration (14.9%)Policy Promotion0.149Synergistic development policy of each prefecture-level city0.149
Table 2. Evaluation index system of urban EE in CCUA.
First Level IndicatorsSecond Level IndicatorsExplanation of Indicators
InputsLaborNumber of urban employees at year-end
CapitalBase period capital stock in 2011
Energy sourceNighttime light
LandUrban land area
Desirable outputsGDPBase period deflated GDP in 2011
TaxesBase period deflated tax in 2011
Urban greeningArea of greenery coverage in built-up areas
Undesirable outputsSulfur dioxideIndustrial sulfur dioxide emissions
Industrial wastewaterIndustrial wastewater discharge
Smoke and dustIndustrial smoke (dust) emissions
Disclaimer/Publisher’s Note: The statements, opinions and data contained in all publications are solely those of the individual author(s) and contributor(s) and not of MDPI and/or the editor(s). MDPI and/or the editor(s) disclaim responsibility for any injury to people or property resulting from any ideas, methods, instructions or products referred to in the content.

