Article

Response of Urban Ecosystem Carbon Storage to Land Use/Cover Change and Its Vulnerability Based on Major Function-Oriented Zone Planning

School of Economics & Management, Beijing Forestry University, Beijing 100107, China
*
Authors to whom correspondence should be addressed.
Land 2023, 12(8), 1563; https://doi.org/10.3390/land12081563
Submission received: 3 July 2023 / Revised: 29 July 2023 / Accepted: 30 July 2023 / Published: 7 August 2023

Abstract

:
Vigorous emphasis has been placed on optimizing land spatial planning to protect carbon storage and enhance ecosystem resilience. What is the effectiveness of the Major Function-Oriented Zone (MFOZ) planning implemented to achieve this goal in China? Especially in urbanized areas where there are more pronounced conflicts between humans and land. Taking the Beijing-Tianjin-Hebei (BTH) urban agglomeration as the target area, this study explored the response of carbon storage to land use/cover change (LUCC) and its vulnerability to ecological service functions under MFOZ planning. The 30 m × 30 m spatially resolved Landsat TM/ETM remote sensing images from 2000 to 2020 were used. The data preprocessing was performed mainly through radiometric calibration, clipping, and reclassification through the ArcGIS 10.7 software. Applying the InVEST model, which uses the LUCC map and carbon storage density of the four carbon pools, including above-ground carbon density, below-ground carbon density, dead organic carbon density, and soil organic carbon density, to evaluate the carbon storage under the current landscape or in the future, the results show that: (1) The BTH ecosystem experienced a carbon storage reduction of about 7.25 × 10⁷ Mg from 2000 to 2020 due to the expansion of construction land, which crowded out cropland. Carbon storage in the BTH showed a high concentration in the “northeast-southwest” direction and a tiny distribution in the “middle-east” direction. (2) From 2015, the initial effects of the MFOZ planning were seen, with the ecological land in the Central Core Zone and Eastern Coastal Development Zone decreasing while the proportion of high-carbon storage areas in the Eastern Coastal Development Zone increasing. (3) Over the two decades, the land use intensity index improved by 4.65 overall, and vulnerability worsened from 2000 to 2015 and was alleviated from 2015 to 2020. This study will provide a scientific reference for optimizing urban spatial land use planning and promoting carbon sequestration in ecosystems.

1. Introduction

To combat climate change, more than 130 nations and regions have put forward the idea of carbon neutrality, including China [1,2]. Carbon storage in terrestrial ecosystems plays a pivotal role in the global carbon budget and changes in the climate [3,4]. Due to its tremendous biological capacity for carbon sequestration, the terrestrial ecosystem, which is composed primarily of forest, grassland, wetland, mangroves, and seaweed, is acknowledged as the second largest carbon storage system [5,6]. However, human-caused changes to land use and cover, such as the expansion of building sites and the disappearance of forests and grasslands, tend to have an impact on the vegetation and soil biomass of the terrestrial ecosystem [7,8]. This phenomenon is most evident in highly urbanized areas [9], which means that their carbon storage capacity and ecosystem carbon storage service functions are facing significant challenges. Land use/cover change (LUCC) was one of the key factors influencing how the ecosystem evolved in terms of storing carbon [10,11]. In the intensifying conflict between environmental protection and urbanization [12], assessing the impact of LUCC in urban terrestrial ecosystems on carbon storage and the vulnerability of carbon storage service functions is an urgent issue.
How to conserve carbon storage and improve ecosystem resilience through the rational use and optimization of land space has received increasing attention from researchers [13]. Quantifying the link between LUCC and carbon storage is required to answer this question. The preceding literature on the effects of LUCC on single or multiple carbon pools laid a strong foundation. Some studies have proven the impacts of LUCC on carbon storage in particular regions [11,14,15]. These regions embrace river basins [16,17,18], plateaus [19,20], coastal areas [15,21], and arid zones [22,23], etc. Most findings prove that LUCC can increase or decrease carbon storage by affecting soil structure and vegetation cover. However, the bulk of prior research focused more on distinctive landscape areas, ecologically protected zones, or ecologically vulnerable places and less on urban agglomerations that better captured the influence of human activities on LUCC [24].
The protection of urban agglomeration ecosystems should receive special attention because they are not only an important driving force for economic development but also the focal point of urbanization. The existing papers studied the impact of LUCC on carbon storage in the Yangtze River Delta region, Shanghai City, and Hubei Province and concluded that LUCC caused by urbanization has an adverse impact on carbon storage [25,26,27]. Given the instance of Nanjing City, the loss of carbon storage might be mostly linked to forest decline [28]. The Beijing-Tianjin-Hebei (BTH) region in China is an ideal illustration of a massive urban area. The LUCC in the BTH region has undergone a major transformation, which affects soil carbon storage and carbon balance and degrades the ecosystem services of carbon absorption [29]. LUCC can be controlled through regulations or policy instruments [30,31]. However, few studies have comprehensively analyzed the carbon storage response to LUCC from the respective perspectives of land spatial planning or urban management systems.
Major Function-Oriented Zone Planning (MFOZ) serves as a crucial element in China’s spatial planning strategy, addressing the dual objectives of economic growth and ecological conservation [32,33,34]. Research on spatial planning strategies has increasingly moved away from focusing on how they affect social and economic efficiency to considering how they affect ecological services [35]. Scholars have conducted interesting studies on the impact of spatial planning policies on carbon storage changes by taking agricultural production areas [36], environmental protection areas [35], and important ecological function areas as target areas [37,38]. However, these studies have limited their scope to specific functional areas and have not been expanded to include overall changes across different functional areas. Under the goal orientation of coordinated development in the BTH, ecological coordination is an important aspect. Thus, the BTH region follows and implements the Chinese government’s MFOZ planning strategy. However, existing studies rarely analyze carbon storage changes in the BTH urban agglomeration from the perspective of the MFOZ. A decade has passed, but it is not known whether differentiated spatial planning has contributed to ecological advancement and sustainable growth.
Organizations like the International Panel on Climate Change (IPCC) and the United Nations Environment Program (UNEP) have proposed studies on the vulnerability of integrated natural-human systems from the perspective of global climate change [39,40,41]. Carbon storage services are one of the most important components of ecosystem services. Ecosystem service vulnerability is a property of ecosystems that exhibit a lack of adaptive capacity when subjected to external disturbances, resulting in changes to their service functions and attributes [38,40]. Most existing scholars have focused on carbon storage changes induced by land use conversion [7,11,15,22,42], but the inherent relations between LUCC and the functional vulnerability of ecosystem carbon storage services have not been thoroughly investigated [43,44,45]. Therefore, a further study of urban ecosystem carbon storage changes and their vulnerability is necessary to mitigate the loss and degradation of ecosystem services.
This study took the BTH region of China as the study area. It intends to investigate how LUCC may affect the spatiotemporal dynamics of carbon storage and the vulnerability of carbon storage services in urban ecosystems under MFOZ Planning. This study offers two contributions: First, the study explores the vulnerability of ecosystem carbon storage services by introducing the association between carbon storage changes and land use intensity in urban areas with high human activity and intense urban expansion. Second, it complements the study on the spatiotemporal dynamic effects of LUCC on carbon storage and the vulnerability of its ecological service functions in terms of specific land space management policies [19]. This work serves as a scientific resource for improving urban spatial land use planning and fostering ecological carbon capture and storage [46].

2. Materials and Methods

2.1. Study Area

The BTH region is located in the North China Plain (113°27–119°50′ E, 36°05–42°40′ N). The BTH region is characterized by a humid, temperate continental monsoon climate, located between the mid-latitude coastal and inland transition zones. There is relatively high humidity in the air throughout the year, with rainfall in the summer and snowfall in the winter. The average annual temperature ranges from 0 to 12 °C, and the average annual precipitation ranges from 400 to 800 mm, decreasing from southeast to northwest. There are various types of land, including plateaus, mountains, and basins, distributed in the northwest, while the southeast is primarily covered with plains [47] (Figure 1). In 2020, the areas of cropland, forest, grassland, water area, built-up land, and unused land accounted for 46.16%, 21.02%, 15.73%, 3.31%, 13.00%, and 0.78% of the whole area, respectively. Land use types have changed during the urbanization process. The total area of the BTH region is approximately 216,000 km2, of which Beijing covers 16,400 km2, Hebei 187,700 km2, and Tianjin 11,900 km2.
Beijing and Tianjin are surrounded by Hebei Province, which is composed of 11 prefecture-level cities. The BTH region began implementing a provincial MFOZ plan in 2014, and its 13 cities are divided into four functional zones [48,49], namely the central core functional area (Beijing, Tianjin, Langfang, and Baoding), the central and Southern Hebei functional expansion area (Shijiazhuang, Hengshui, Xingtai, and Handan), the coastal cultural development area (Tianjin, Tangshan, and Cangzhou), and the northern ecological functional area (Zhangjiakou, Chengde, Baoding, Beijing, and Qinhuangdao).

2.2. Research Methods

The steps outlined below were taken to analyze the dynamic evolution of urban ecosystem carbon storage and its vulnerability to LUCC in the BTH region. Firstly, the land use types are reclassified into six categories using the re-classification function of GIS 10.7 software. Using a single dynamic degree and land use transfer matrix approach, the land use changes in the BTH area and each functional zone from 2000 to 2020 are evaluated in time and space. Secondly, InVEST modeling is employed to assess the influence of LUCC on total and sub-pool carbon storage, including the overall region and each functional zone. Furthermore, local spatial autocorrelation was analyzed to investigate the temporal and geographical variation properties of carbon storage using Moran’s I index. Finally, an analysis and evaluation of LUCC’s effects on carbon storage and its vulnerability were performed. The workflow diagram is shown in Figure 2.

2.2.1. Land Use Transfer Matrix Analysis

The land use transfer matrix reflects the transfer of land use types clearly by establishing a two-dimensional matrix. The formula is as follows:
S ij = [ S 11 S 12 S 1 n S 21 S 22 S n 1 S n 2 S n n ]
where Sij is the area of a certain land use type, n is the serial number of land use types, and i and j are the serial numbers of the different land use types at the start and end of the research period, respectively.

2.2.2. InVEST Model

The InVEST model is a comprehensive evaluation model of ecosystem service functions. It can offer a variety of ecosystem services and value assessments, including habitat quality, water yield, soil and water conservation, carbon sequestration, etc. The carbon storage is estimated using the InVEST model’s carbon storage module. The guiding principle of InVEST is to use the LUCC map of the study area and the carbon storage density of the four carbon pools, including above-ground vegetation carbon pools (AGC), below-ground carbon pools (BGC), dead organic carbon pools (DOC), and soil organic carbon pools (SOC), to evaluate the carbon sequestration under the current landscape or in the future. The storage of the four carbon pools will be added to determine the overall carbon storage of each map unit and the entire landscape [50].
CTotal = AGC + BGC + DOC + SOC
where CTotal, AGC, BGC, DOC, and SOC refer to the four carbon storage pools (Mg/ha). Although the carbon density parameters in the InVEST model were assumed to be static and do not change over time, the study shows that the impact of LUCC on carbon storage changes can be well assessed even if dynamic changes are ignored [51]. Viewing carbon density as a constant is able to simplify the calculation and transfer process of carbon storage as well as make discussions relative to the literature easier [11,51].

2.2.3. Spatial Autocorrelation Analysis

Spatial autocorrelation refers to the interrelationship between the attribute values of a geographical object taken at adjacent spatial locations. It is a measure of the degree of spatial aggregation or dispersion of the attribute. By identifying the significant level of the Local Moran’s I statistic, the Local Indicator of Spatial Association (LISA) is used to examine the spatial correlation and differences between a region and its environs. The correlation between the attribute values of each geographic unit and its nearby spatial units is further assessed using local spatial autocorrelation. The global Moran’s I is effectively divided into regional units by the LISA index. The local Moran’s I may be calculated using the following formula:
I i = ( X i X ¯ ) S X 2 j i [ W ij ( x j x ¯ ) ]
S X 2 = j [ W ij ( X j X ¯ ) 2 ] N
where the meaning of the items on the right side of the equal sign is the same as in Equation (1). In this study, the spatial autocorrelation types of BTH carbon storage are classified into five structures using LISA plots: HH (high-high), LL (low-low), HL (high-low), LH (low-high), and NN (non-significant). Among them, HH and LL are positive correlation types, indicating a high degree of spatial aggregation of carbon storage, i.e., areas with high/low carbon storage are also surrounded by high/low carbon storage; HL and LH are negative correlation types, indicating spatial dispersion of carbon storage, i.e., areas with high/low carbon storage are surrounded by low/high carbon storage; and NN is a non-significant type, indicating no significant aggregation or dispersion of carbon storage [25,52].

2.2.4. Ecosystem Vulnerability Assessment Methodology

According to the IPCC, vulnerability depends on exposure, sensitivity, and adaptive capability. It refers to how fragile or incapable a system is to withstand the negative consequences of climate change [43]. Schröter et al. [45] subsequently extended the concept of vulnerability by proposing a starting point vulnerability assessment methodology to include land use change. Based on the starting point vulnerability assessment method proposed by Schröter et al. [45], the vulnerability of carbon storage services in ecosystem services was measured using the potential impact index (PI), a method proposed by Metzger et al. [53] to quantify the vulnerability of land use change on ecosystem services, which was calculated by applying the following formula:
P I = C x C y C y ÷ Y x Y y Y y
L = 100 × i = 1 n ( D i × P i )
where C represents carbon storage, L represents land use intensity, and x and y represent the period’s first and last years, respectively. Di is the land type I’s land use degree grading index, Pi is the percentage of the area occupied by land type I, and n is the total number of land use categories.

2.3. Data Collection and Processing

The national-scale land use/cover change (LUCC) database established by the Institute of Geographical Sciences and Resources, Chinese Academy of Sciences (http://www.resdc.cn (accessed on 18 June 2022)) provided land use type data from 2000 to 2020 in 5-year intervals for the BTH urban agglomeration. They are based on 30 m × 30 m spatially resolved Landsat TM/ETM remote sensing images. It was discovered that the data set’s overall correctness was greater than 90% via the consistent quality assessment, meeting the experimental requirements [54]. The land use data were classified into six kinds using the supervised classification technique in accordance with GB/T 21010-2017 (Table 1) [55]. The average kappa value was 0.85, indicating a satisfactory result for the classification quality [56].
Carbon density is the amount of carbon stored per unit area. It is one of the vital indicators for carbon storage estimation by InVEST. The primary sources for the parameters of carbon density were field investigation reports and research literature. Two principles were followed in the parameter selection process. First, the reference area should be similar in geographical location (i.e., the same study area or latitude), topography, climate conditions, and vegetation coverage as the object study area. Second, to prevent variations in measurement or experimental techniques, data from the same author should be used as much as possible. The carbon density data this study used were provided by the literature, which also takes the BTH region as a target area [57]. It is one of the few articles that modified the land biomass and soil organic carbon density in the BTH region based on 25 years of average precipitation and temperature [58], which contributes to more convincing results. The detailed values are shown in Table 2.
In this study, with reference to [48], the land use degree index is divided into 3 grades, which means that n in Equation (6) is equal to 3. Specifically, forest land, grassland, and water areas are graded 2, arable land is graded 3, construction land is graded 4, and unused land is graded 1 (Table 3).

3. Results

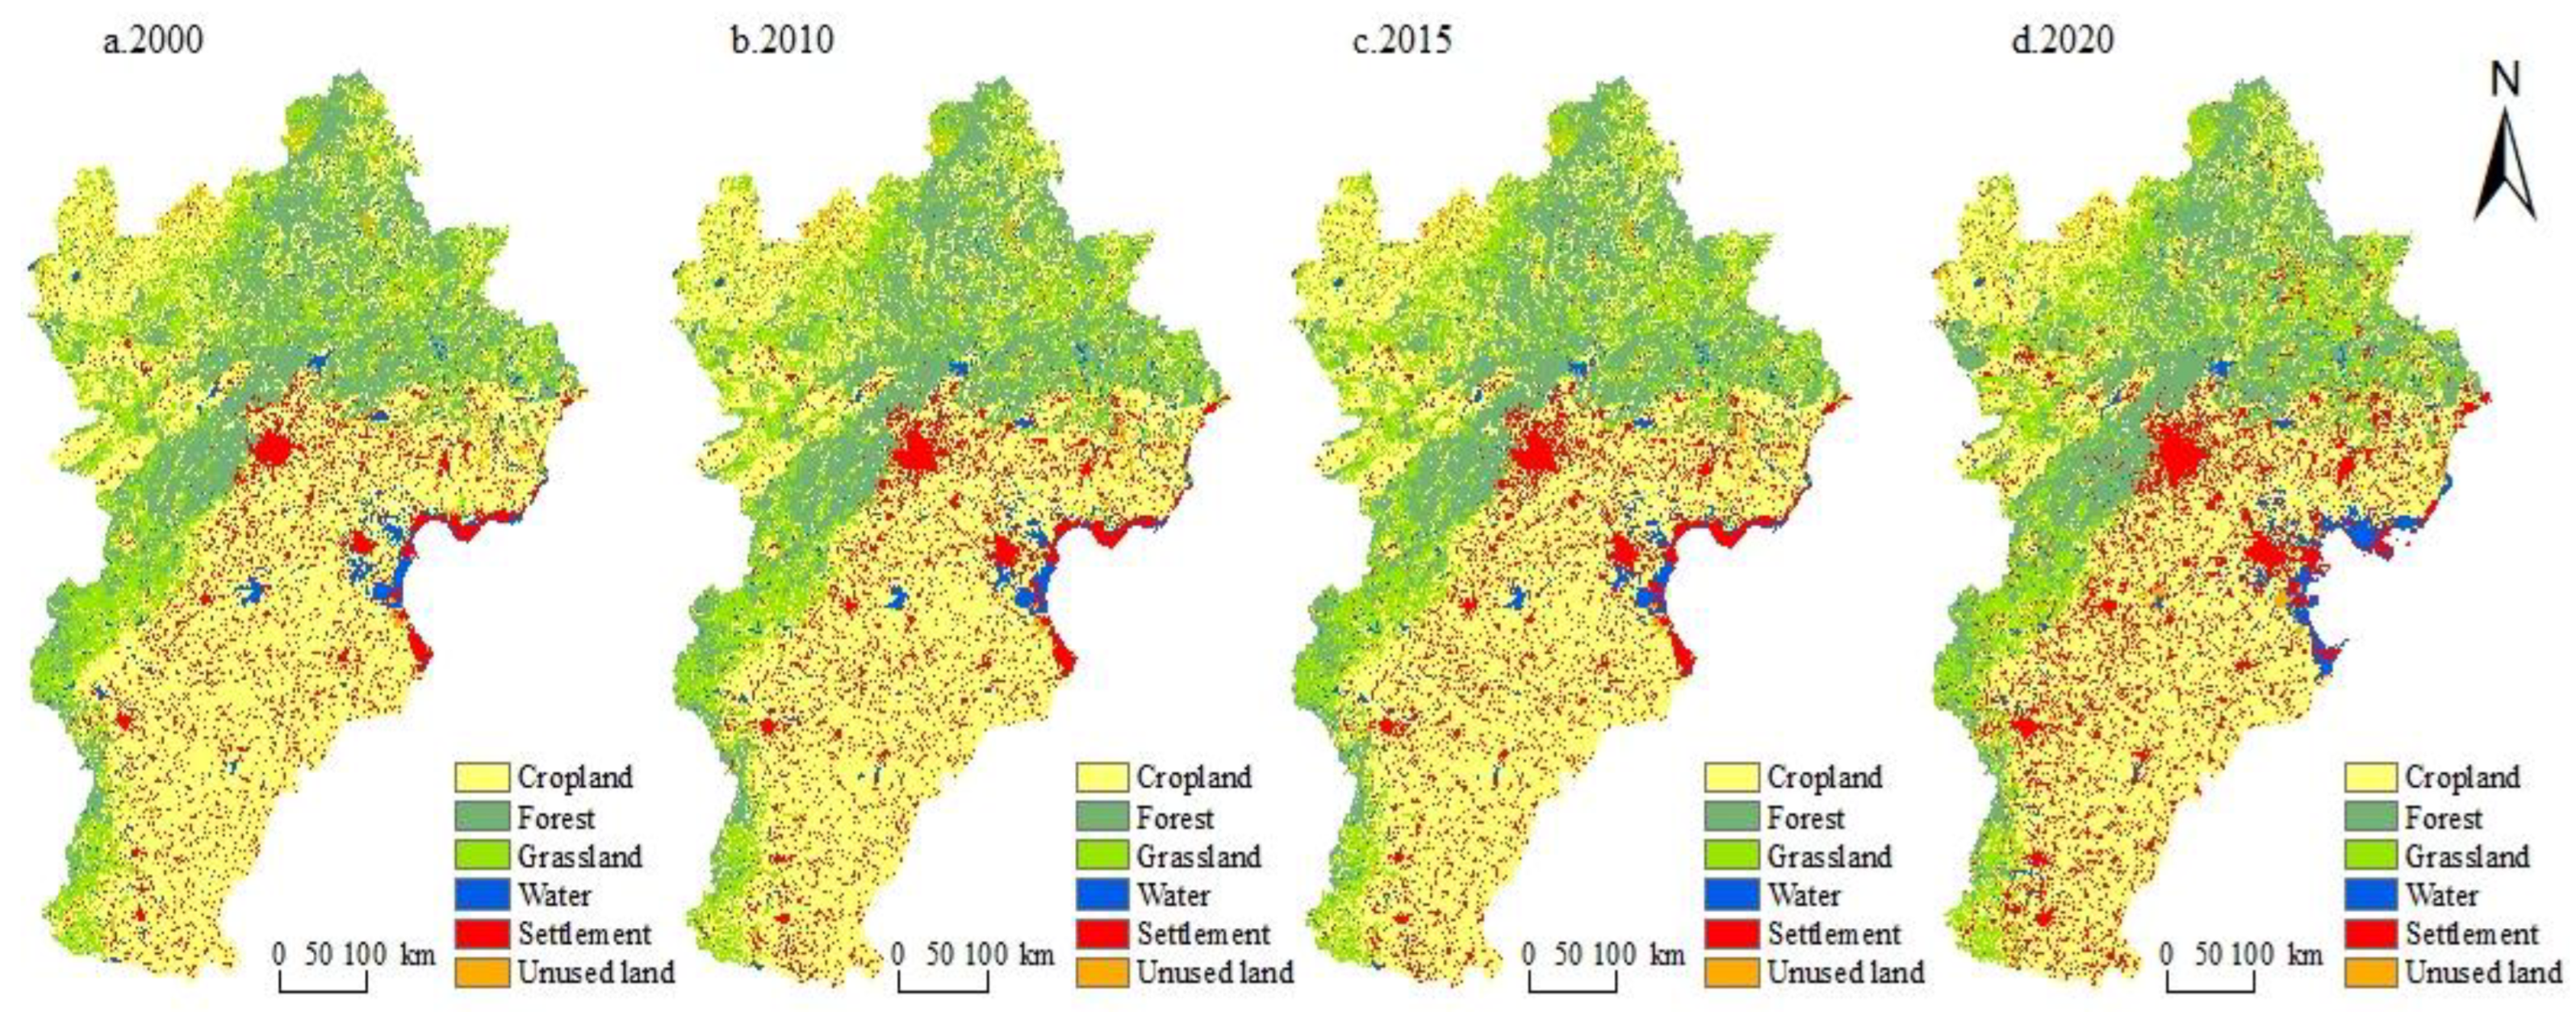
3.1. Spatiotemporal Changes in LUCC from 2000–2020

Cropland accounted for half of BTH’s total area, making it the largest land use on the map. It is followed by forest and grassland, with unused land being the least abundant land use type. The central and southern regions of Hebei Province, as well as coastal cities, are where most of the agriculture is located. Grassland and forest are unevenly distributed in the northeast of BTH, mainly in Zhangjiakou and Chengde cities. It is obvious that the urban land extends outward from the center of the city (Figure 3).
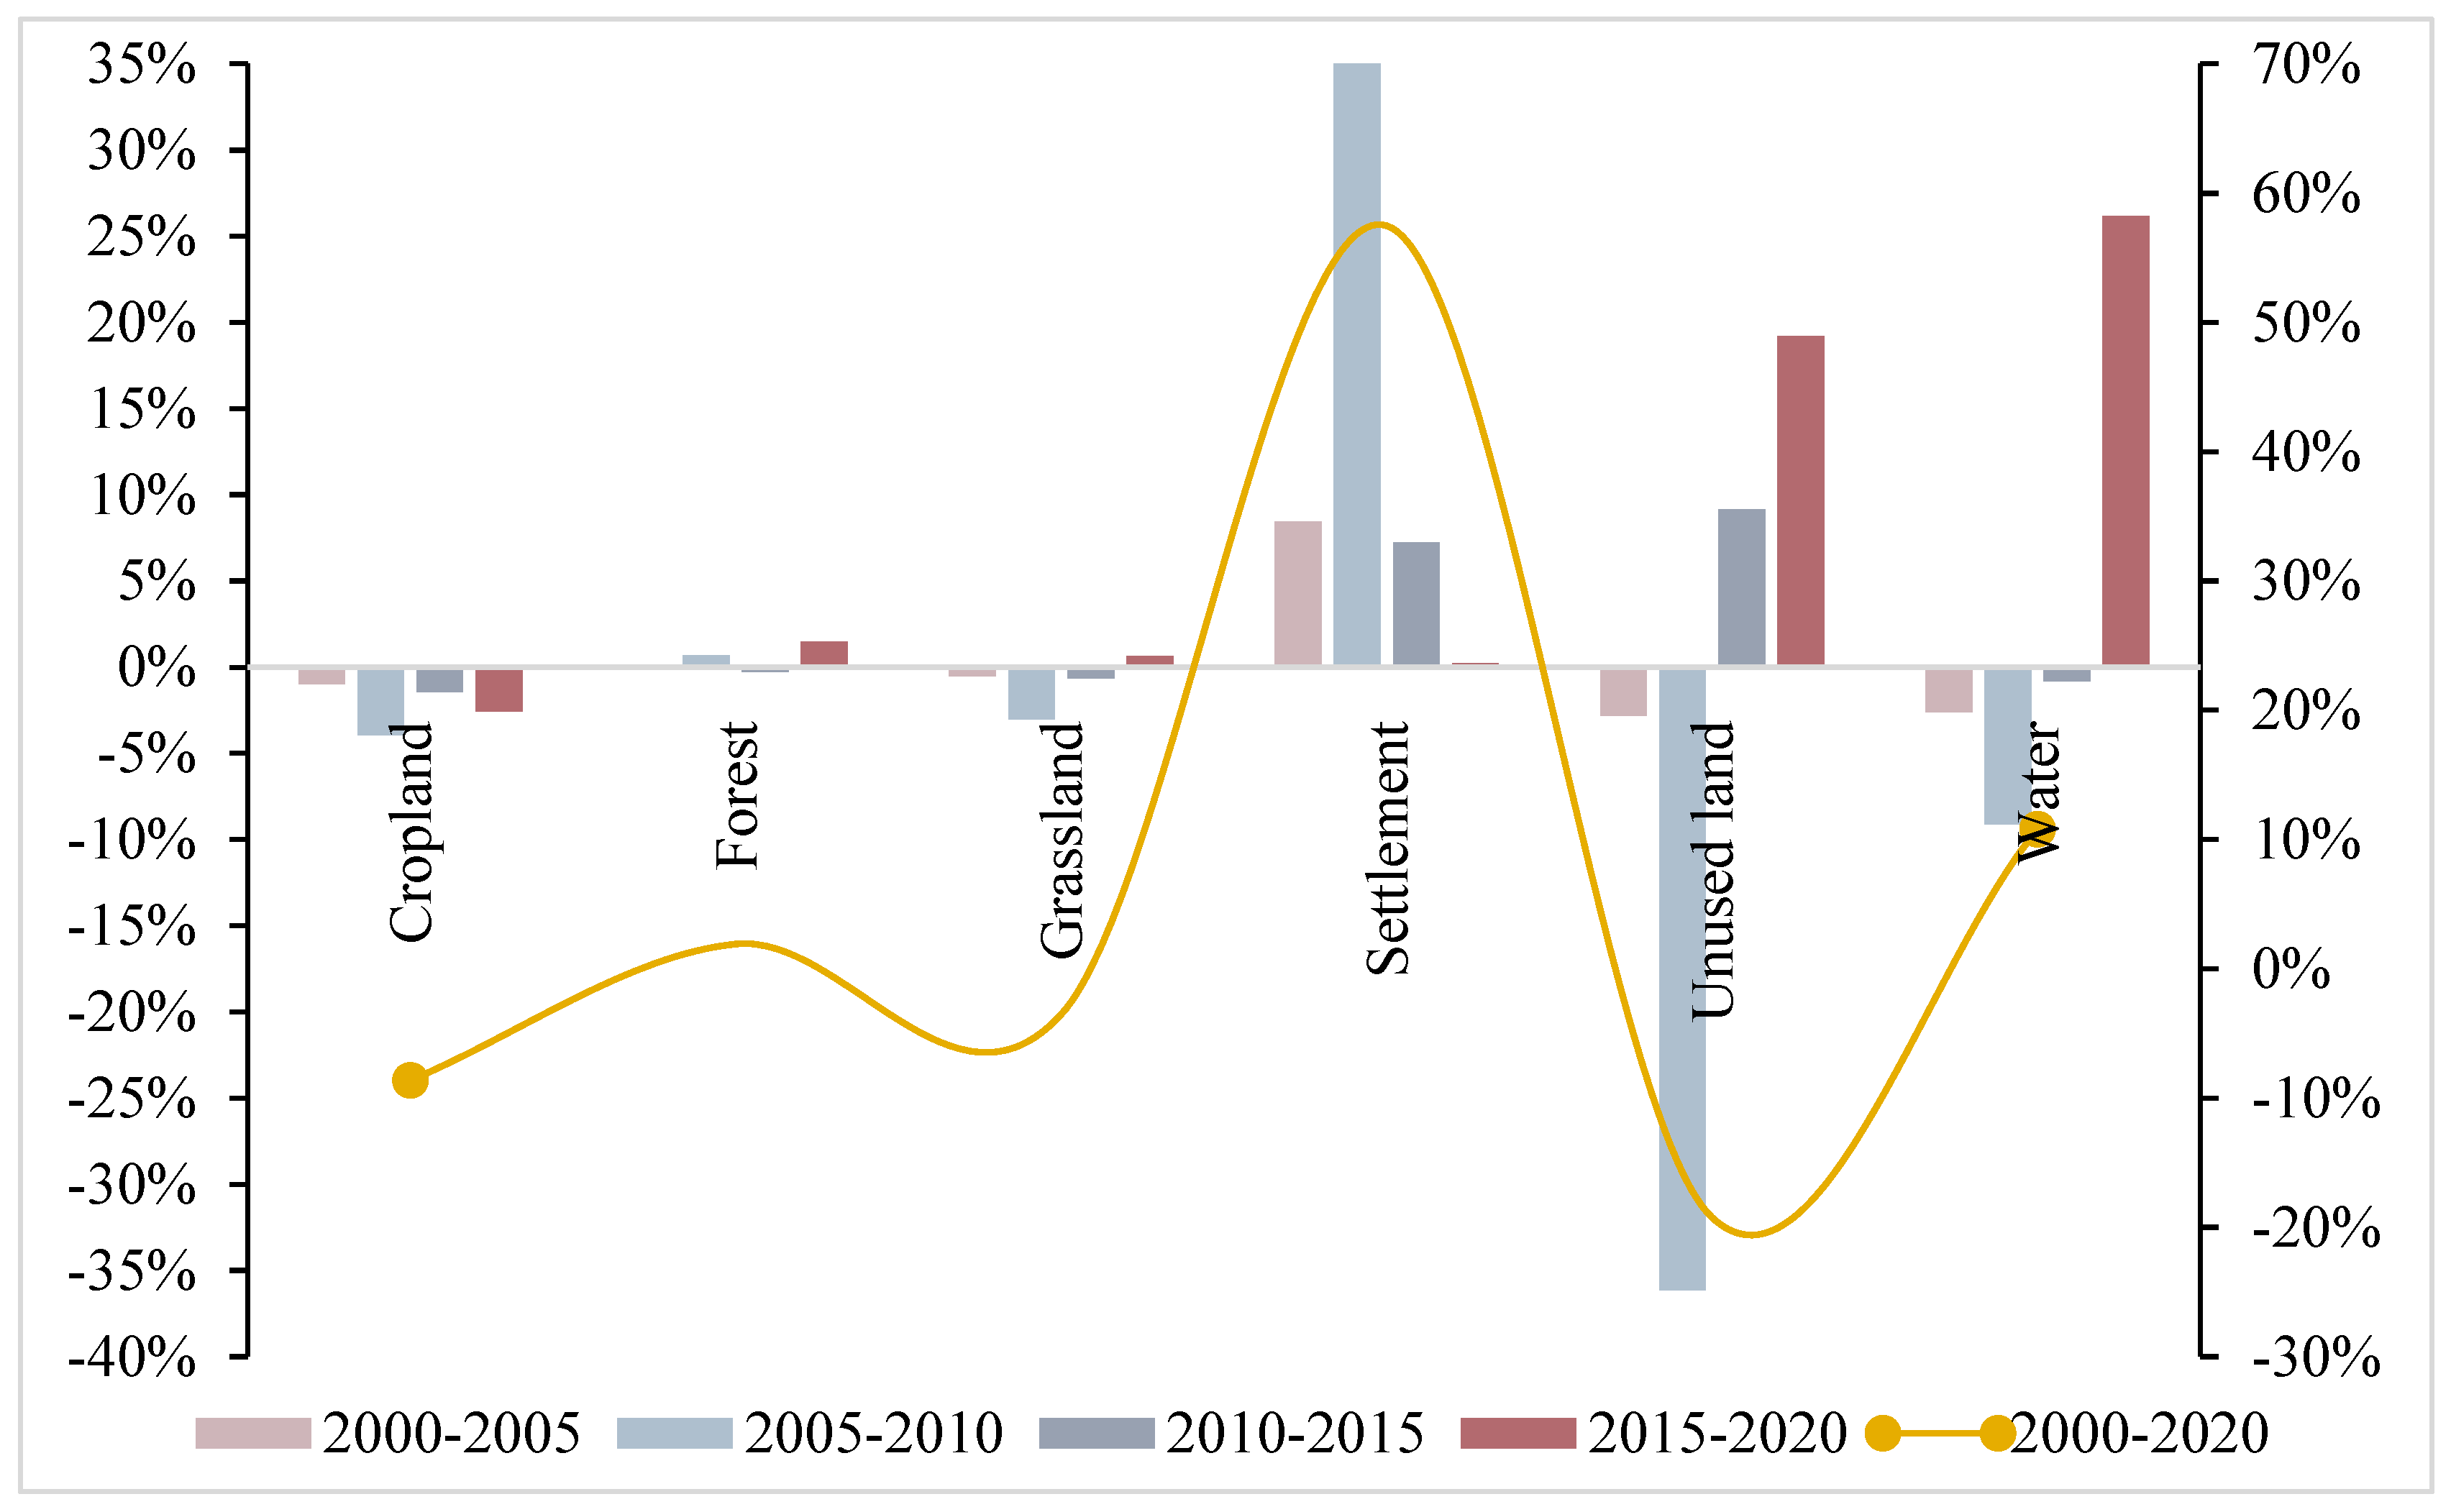
From a single land dynamic degree viewpoint, land use area changes intermittently with time. From 2000 to 2005 and 2015–2020, the land use area apparently changed, but in other periods it kept a stable pattern. It showed that building land witnessed the most obvious shift, with a net increase of 10,267.68 km2, while forest and water land areas rose by 1.92% and 10.79%, respectively. However, the area of cropland has been greatly reduced, which is the dominant source of increased construction land, with a net decrease of −9428.18 km2. Grassland and unoccupied land both fell concurrently at rates of 3.52% and 19.24%, respectively (Table 4 and Figure 4).
The BTH area has witnessed a huge transformation among different land-use types during the last two decades. As shown in the LUCC transfer matrix in Table 5, the area that went through change was 214,965.50 km2, which represents 9.95% of the total. The foremost change type was from agriculture to building land. The greatest area transferred out was farmland, totaling 109,315.93 km2, of which 16,156.86 km2, or 14.80%, was turned into building land. The largest area transferred was also cropland, which was mainly construction land, accounting for 27.77%. However, the results showed that the cropland was net transferred out, with an area of 9938.55 km2. The construction land saw a net transfer, covering an area of 9892.98 km2. The conversion of cropland and grassland into forest land, with more grassland being converted into forest land than cropland, is primarily responsible for the growth of forest land. Additionally, a section of grassland is converted to built-up land, resulting in a decrease in the overall amount of grassland. In short, despite certain fluctuations over the last 20 years, built-up land, forests, and grasslands have seen a net transfer in, while arable land, grasslands, and unused land have seen a net transfer out.
An overlay analysis was used to identify the distribution and evolution of land use types in different Major Function-Oriented Zones. As shown in Figure 5, the area ratios of different LUCC types in the four zones changed variously in 2000, 2005, 2010, 2015, and 2020. Cropland is the majority of the land in the four areas, and it makes up roughly 70% of the Eastern Coastal Development Zone and the southern Functional Development Zone. The dynamic trends of the four zones are the same as the whole BTH region, showing a trend of cropland loss and construction land increase.
For specific functional areas, the second largest type of land use is construction land in the Central Heart Function Zone, accounting for about 13%, which expanded to 20% in 2020. A positive scenario is that the proportions of forest and grassland did not decrease. Over the past 20 years, the proportion of water area in the Central Heart Function Zone ranks only second to the Eastern Coastal Development Zone, which proves the effectiveness of the water conservation policies. In the Eastern Coastal Development Zone and Southern Functional Development Zone, the proportion of cropland is higher than in other regions, but with a decreasing tendency over the years. In comparison, the grassland area in the Southern Functional Development Zone is large, only behind the Northwest Ecological Conservation Zone among the four zones. The water area in the Eastern Coastal Development Zone is the largest. In the Northwest Ecological Conservation Zone, with Zhangjiakou and Chengde as the main bodies, natural land with high carbon storage density accounts for nearly 90% of the total area. The forest land accounted for in the zone is the largest proportion among the four districts, nearly equal to its construction land area.

3.2. Spatiotemporal Dynamics of Carbon Storage from 2000 to 2020

The findings indicate that there was a negative trend in the overall carbon storage of the BTH area throughout the five time periods. It declined by 7.25 × 10⁷ Mg between 2000 and 2020, with a decreasing rate of 1.79%. With a loss rate of around 0.70% between 2005 and 2010, carbon storage saw the quickest fall, making up more than a third of the overall loss in carbon storage. The cumulative carbon storage losses from 2000 to 2005, 2010 to 2015, and 2015–2020 totaled 2.89 × 10⁶ Mg, 1.33 × 10⁶ Mg, and 1.86 × 10⁶ Mg, accounting for 12.39%, 25.96%, and 22.94% of the total carbon storage losses, respectively (Figure 6).
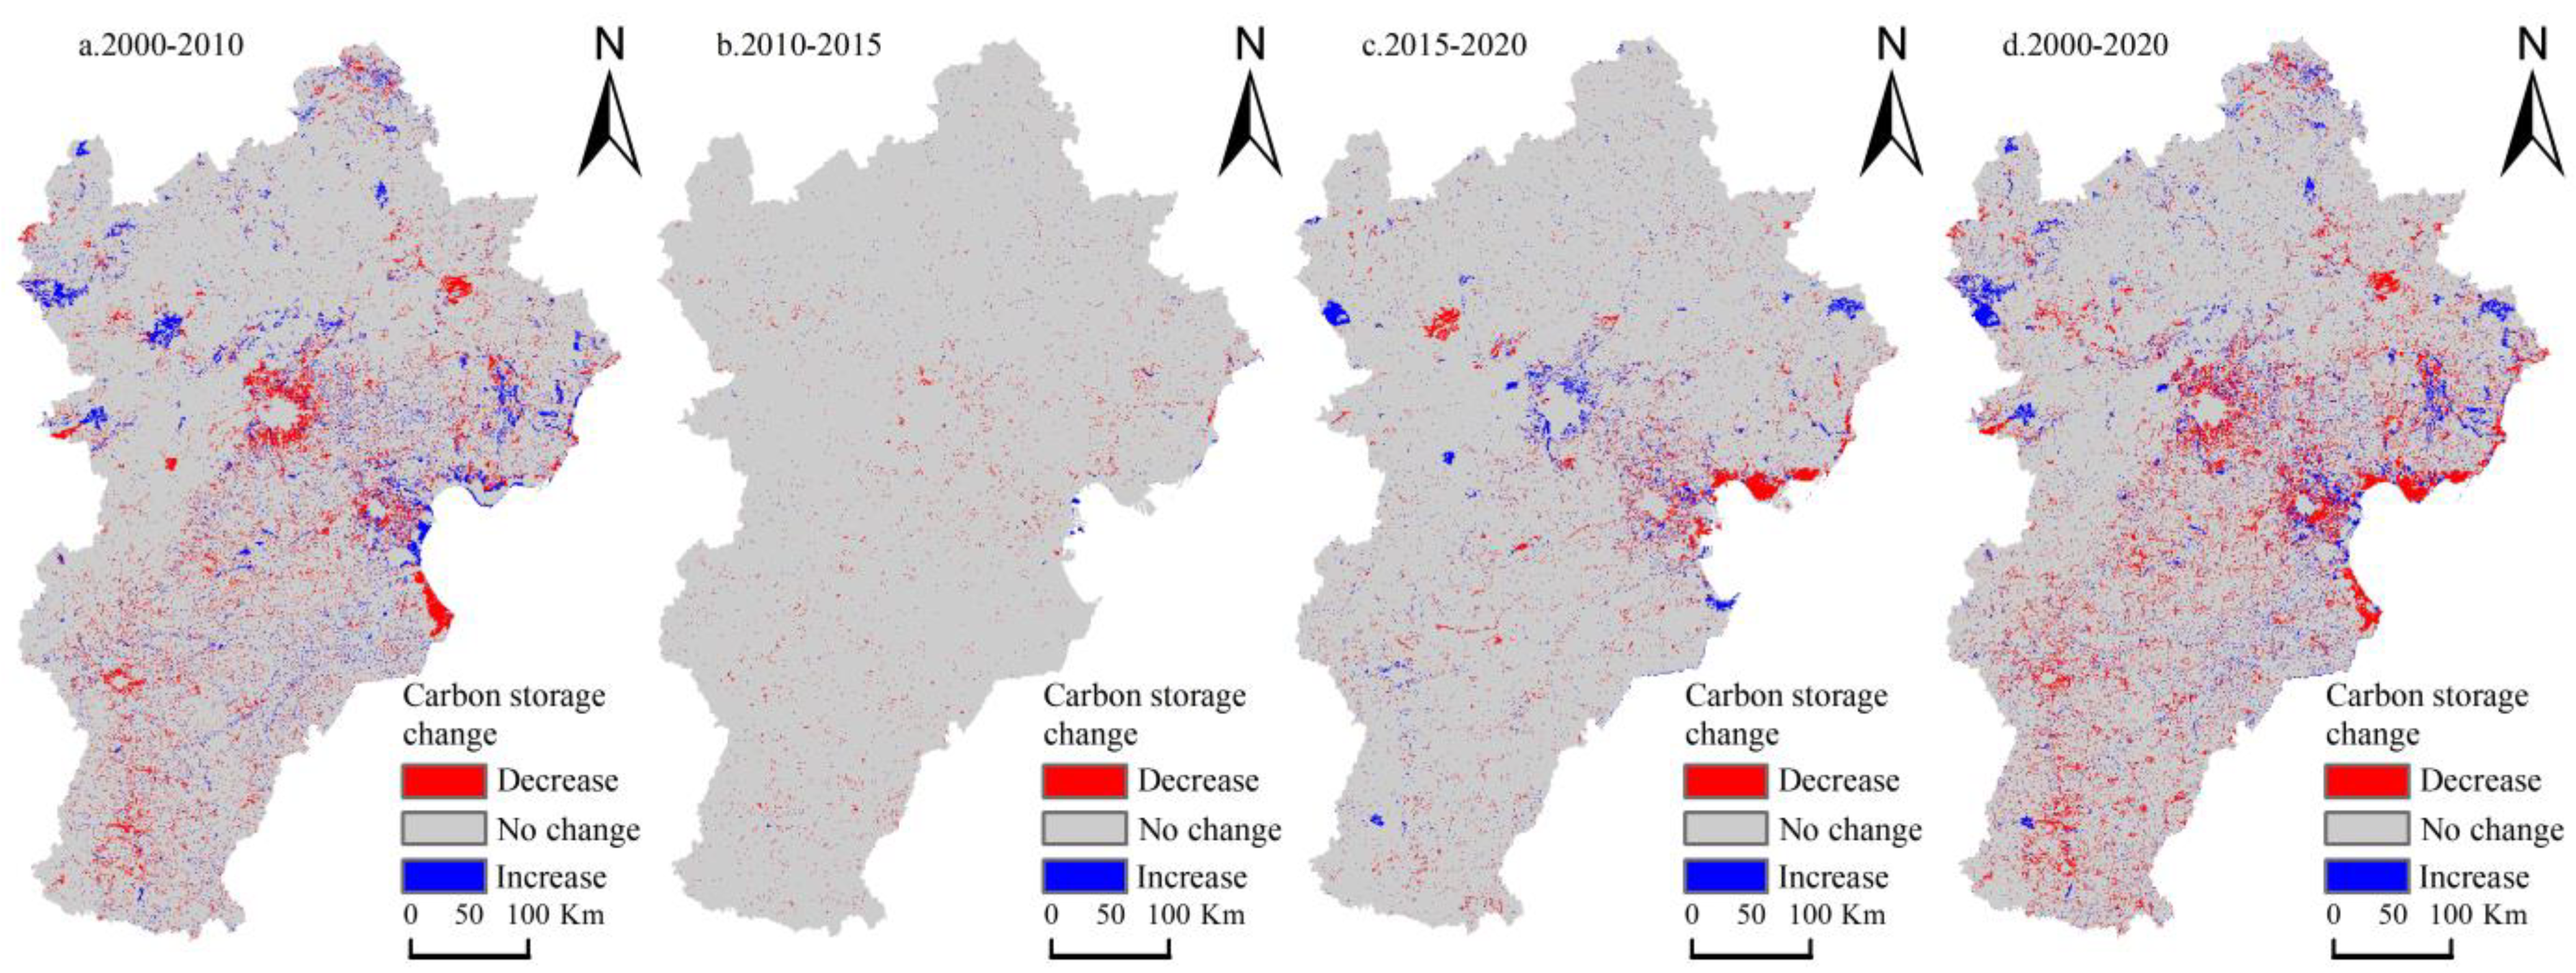
It showed that the high carbon storage areas present characteristics of “Northeast flake-Midwest belt-Southwest edge” (Figure 7). The predominant land use type in these locations is forest land with a high soil carbon density. Beijing and Tianjin are the cities with the least carbon storage in comparison. With the expansion of the urban scale, low-carbon storage areas extend to the surrounding areas. Results also indicated that the coastal land use types of Tangshan, Tianjin, and Langfang are part of the water land, where carbon storage is low as well.
The data were split into three groups, including declining, essentially unchanged, and rising, with the purpose of more clearly portraying the regional heterogeneity of carbon storage in the BTH region. Grid subtraction is performed on the carbon storage distribution map of two adjacent time points from 2000 to 2020. Following raster reclassification, areas with a change in carbon storage greater than 5% were labeled as increasing areas, regions with a variation amount less than 5% were deemed to be declining areas, and areas with a volume of change between ±5% were characterized as areas that had little to no change. The results in Figure 7 and Table 6 showed that the carbon storage in the majority of the regions has not altered between 2000 and 2020, accounting for 87.27% of the total area of BTH. The south-central region of Hebei Province and the core metropolitan regions of Beijing and Tianjin are where carbon storage is decreasing, accounting for 8.38% of the total land. These regions are characterized by high human activity and more drastic land use changes—for instance, the switch of significant portions of arable land to building land—than other regions. The increase in carbon storage covers only 4.35% of the entire region and is scattered in southwestern Zhangjiakou City, the south-eastern part of Chengde City, and the marginal areas of other southeastern coastal cities in Hebei Province. Carbon sequestration has benefited from the implementation of sustainable and environmentally friendly initiatives such as the return of farmland to forest, restoring agricultural land to forest, vegetation conservation, and the exploitation of water and unused land into land with a high carbon density, like agricultural land.
Carbon storage varies slightly with different types of land use throughout time. In particular, there was an increase in the quantity of carbon preserved in forests, construction grounds, and water, whereas there was a decline in farmland, grassland, and unoccupied land. Cropland, forests, grasslands, and built-up land are listed in descending order of the value for total carbon storage, as illustrated in Figure 8. The main reason is that most areas of Hebei Province are covered with cropland, despite the highest carbon storage density of forestry land. Cropland is the dominant carbon sink in the terrestrial ecosystem of BTH, contributing 41.37−44.46% of the complete carbon storage of the entire region. After farmland, forest land has the second-largest carbon reservoir. In 2020, there were more trees than at any time in the previous 20 years. Despite making up only 21.02% of the overall land, it stores 38.15% of the region’s total carbon. As a result of BTH’s intensive reforestation efforts and the implementation of environmental protection measures, its area and carbon storage are growing annually.
The carbon storage capacity of the four carbon pools decreased to various degrees between 2000 and 2020 (Table 7). Specifically, carbon storage in the SOC pool covers around 65% of the total, making it the most effective form of carbon storage. The SOC pool and DOC pool had a total loss of 13.52 × 10⁶ Mg and 9.36 × 10⁶ Mg, respectively. The carbon storage in the BGC pool fell from 10.10 × 10⁸ Mg to 9.64 × 10⁸ Mg, with a loss of 45.57 × 10⁶ Mg being the biggest. The carbon storage capacity of the AGC pool is the weakest; it experienced a decrease of 4.02 × 10⁶ Mg. Looking back at the results reported in Table 4 in the past 20 years, it is not difficult to find that the change of farming land, forest, and grassland into construction land performed a net transfer out. Sequestration of carbon by these types of land uses, mainly through below-ground vegetation, results in the loss of overall carbon storage.
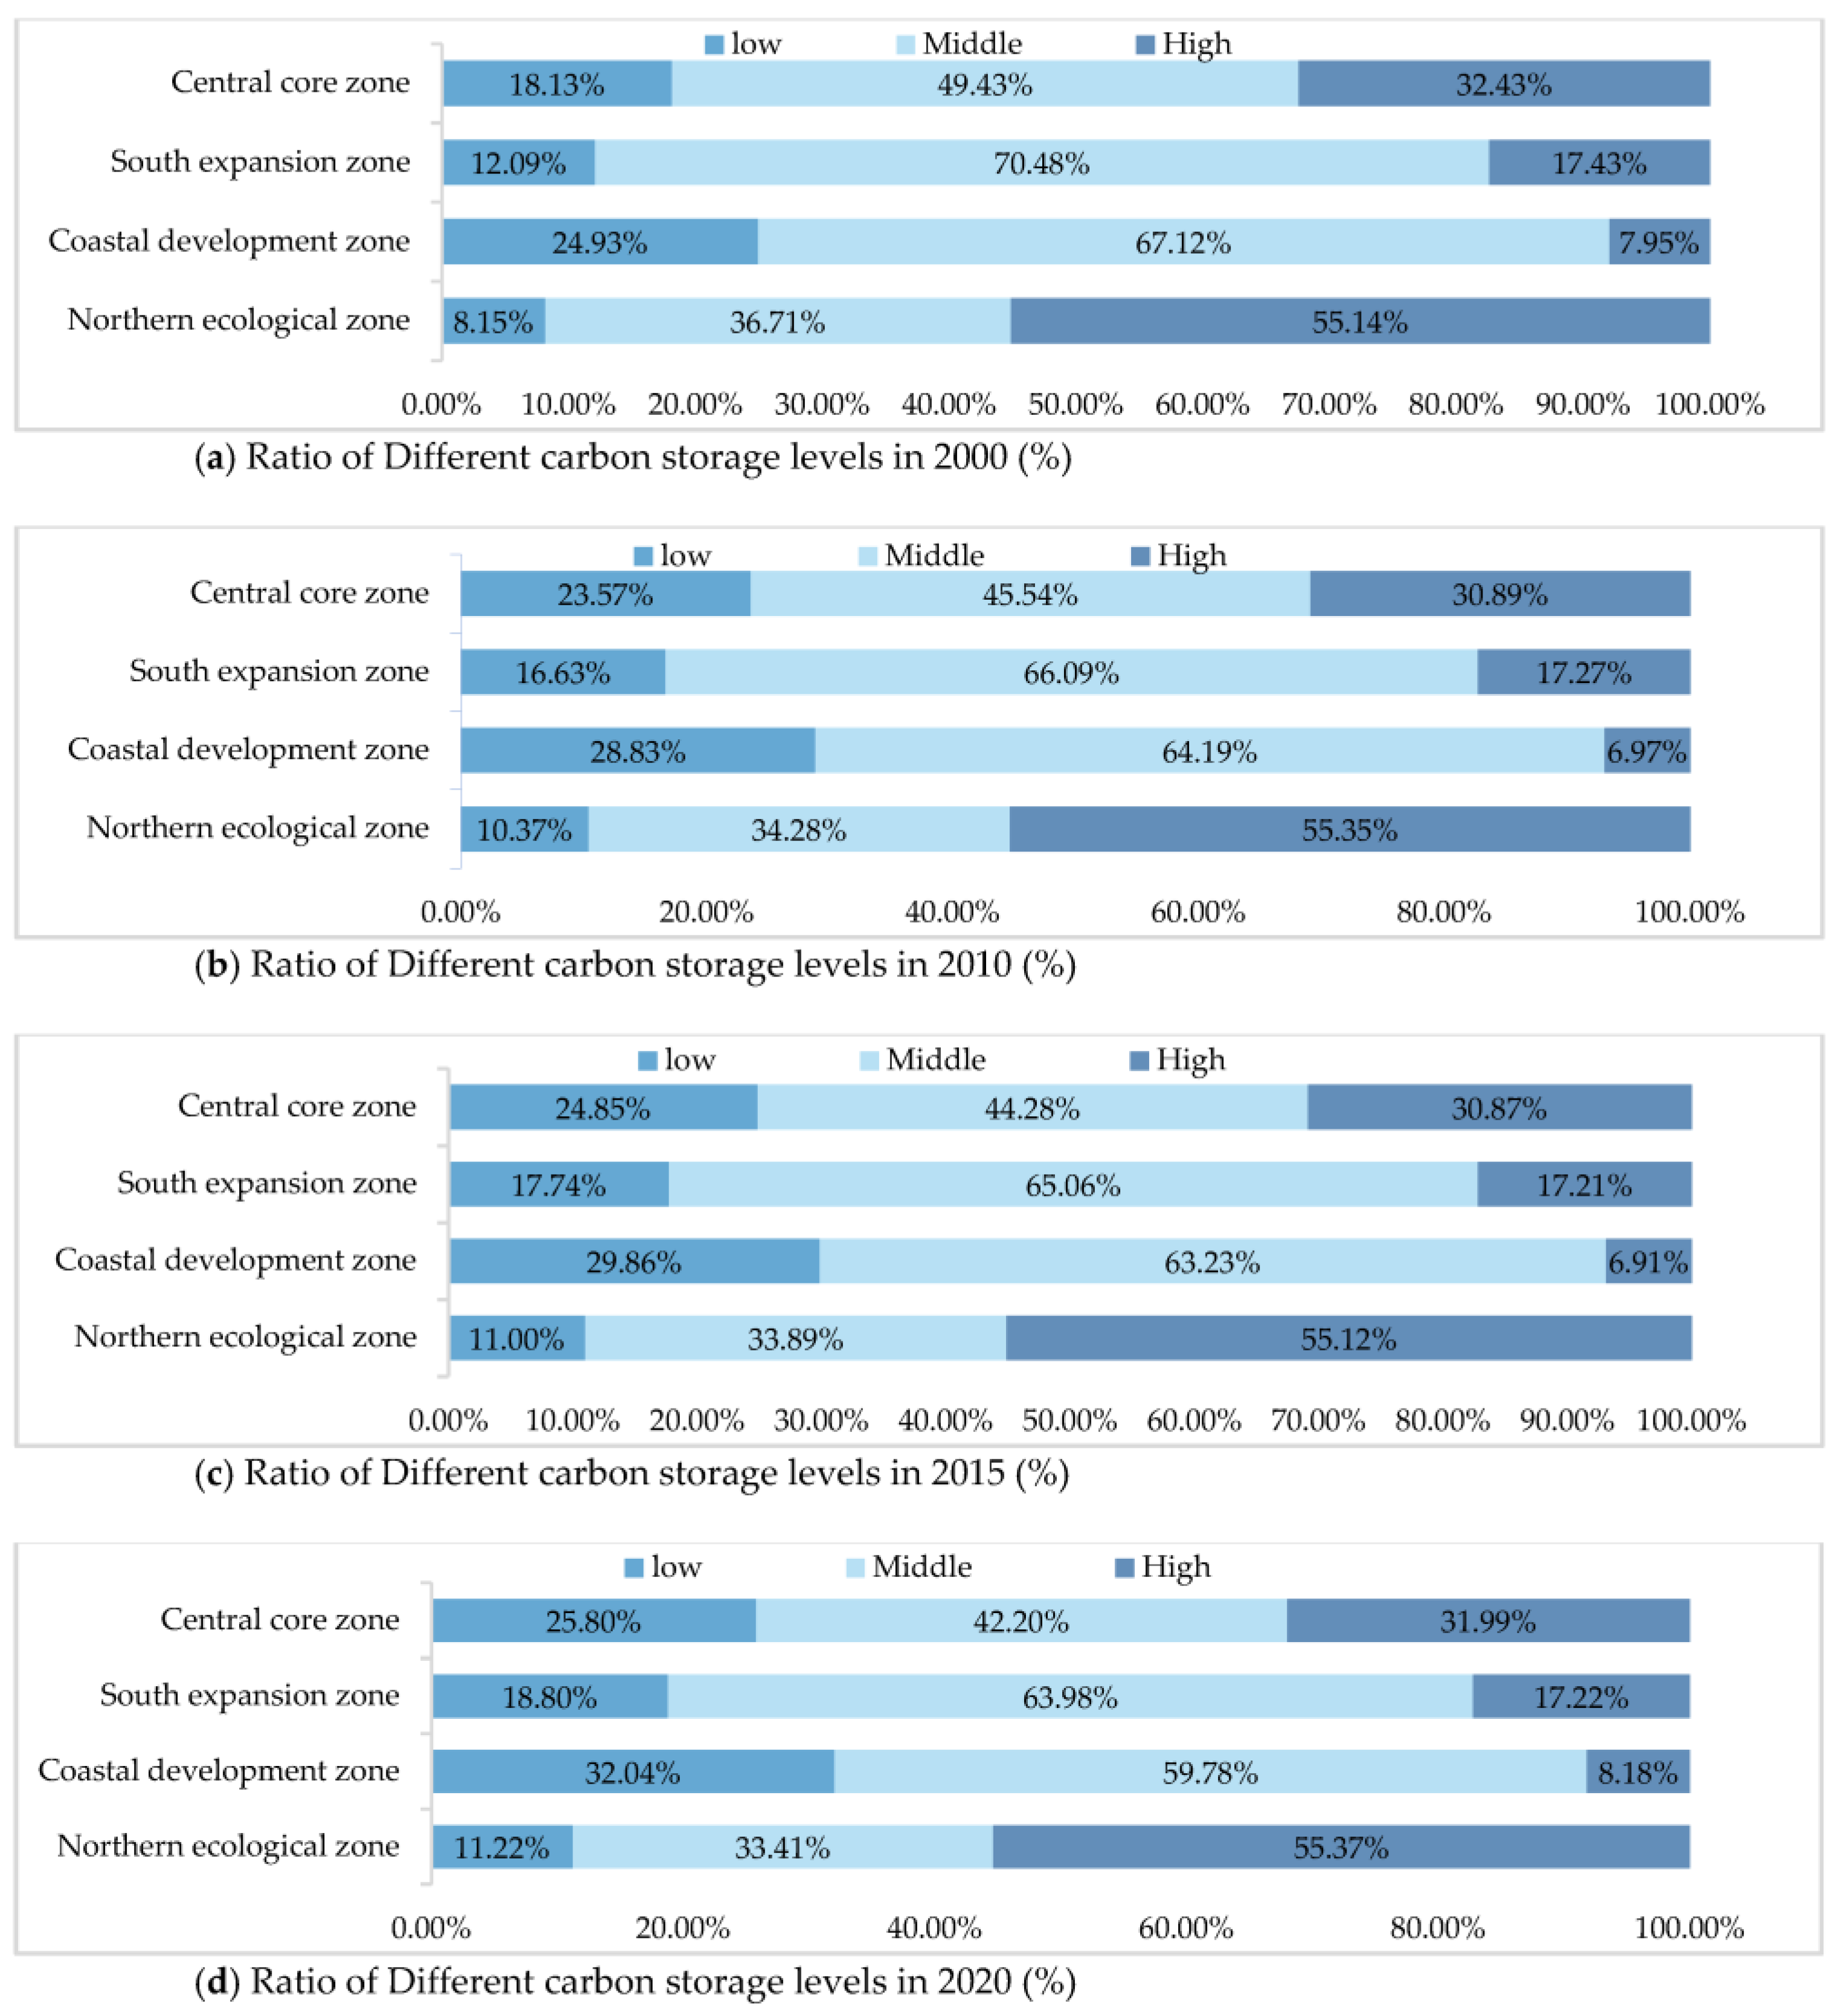
The decreasing order of carbon storage in the four MFOZs of the BTH was the Northwest Ecological Zone, the Central Core Zone, the Southern Expansion Zone, and the Eastern Coastal Development Zone. To explore the carbon storage capacity of various MFOZs, ArcGIS 10.7 software was used to reclassify the carbon storage volume, and the natural breakpoint grading technique was employed to categorize the raster data into three groups: low carbon storage area (0–6.58 Mg C/ha), medium carbon storage area (6.58–16.00 Mg C/ha), and high carbon storage area (16.00–29.97 Mg C/ha). Figure 9 demonstrates that the BTH region’s high carbon storage regions are mostly found in the Northwest Ecological Zone, whereas they make up the smallest amount of the Eastern Coastal Development Zone. The medium carbon pools are mainly located in the Southern Expansion Zone and the Eastern Coastal Development Zone. Low-carbon storage areas are situated in the Central Core Zone and the Eastern Coastal Development Zone, but a higher proportion is in the Eastern Coastal Development Zone. From 2015 to 2020, the high-carbon pools in the Eastern Coastal Development Zone gradually increased, while the Central Core Zone followed the same trend but with a relatively small rate of change. The proportion of carbon pools in each class in the Northwest Ecological Zone remains stable across all classes over the period 2000–2020. However, in the Southern Expansion Zone and the Eastern Coastal Development Zone, there has been an increased pattern of the carbon pools shifting from medium to low grades, which is the major cause of the decline in total carbon storage in the BTH region.

3.3. Spatial Autocorrelation Analysis

Figure 10 presents the spatial autocorrelation patterns of carbon storage. It shows the characteristics of high-high value region aggregation, low-low value region banded distribution, and high-low and low-high value regions sporadically distributed. While the low-value regions gather in Baoding, Shijiazhuang, Xingtai, Handan, and the center part of the middle-south region, the high-value areas of carbon storage are clustered in Chengde, Zhangjiakou, and most counties in the northeast. High-low-value agglomeration is mainly in Tianjin, scattered in Cangzhou, Shijiazhuang, Hengshui, and areas in the Middle East. The low-high area is rare, scattered in several counties in Chengde and Zhangjiakou.

3.4. Dynamic Response of Carbon Storage to Land Use Change

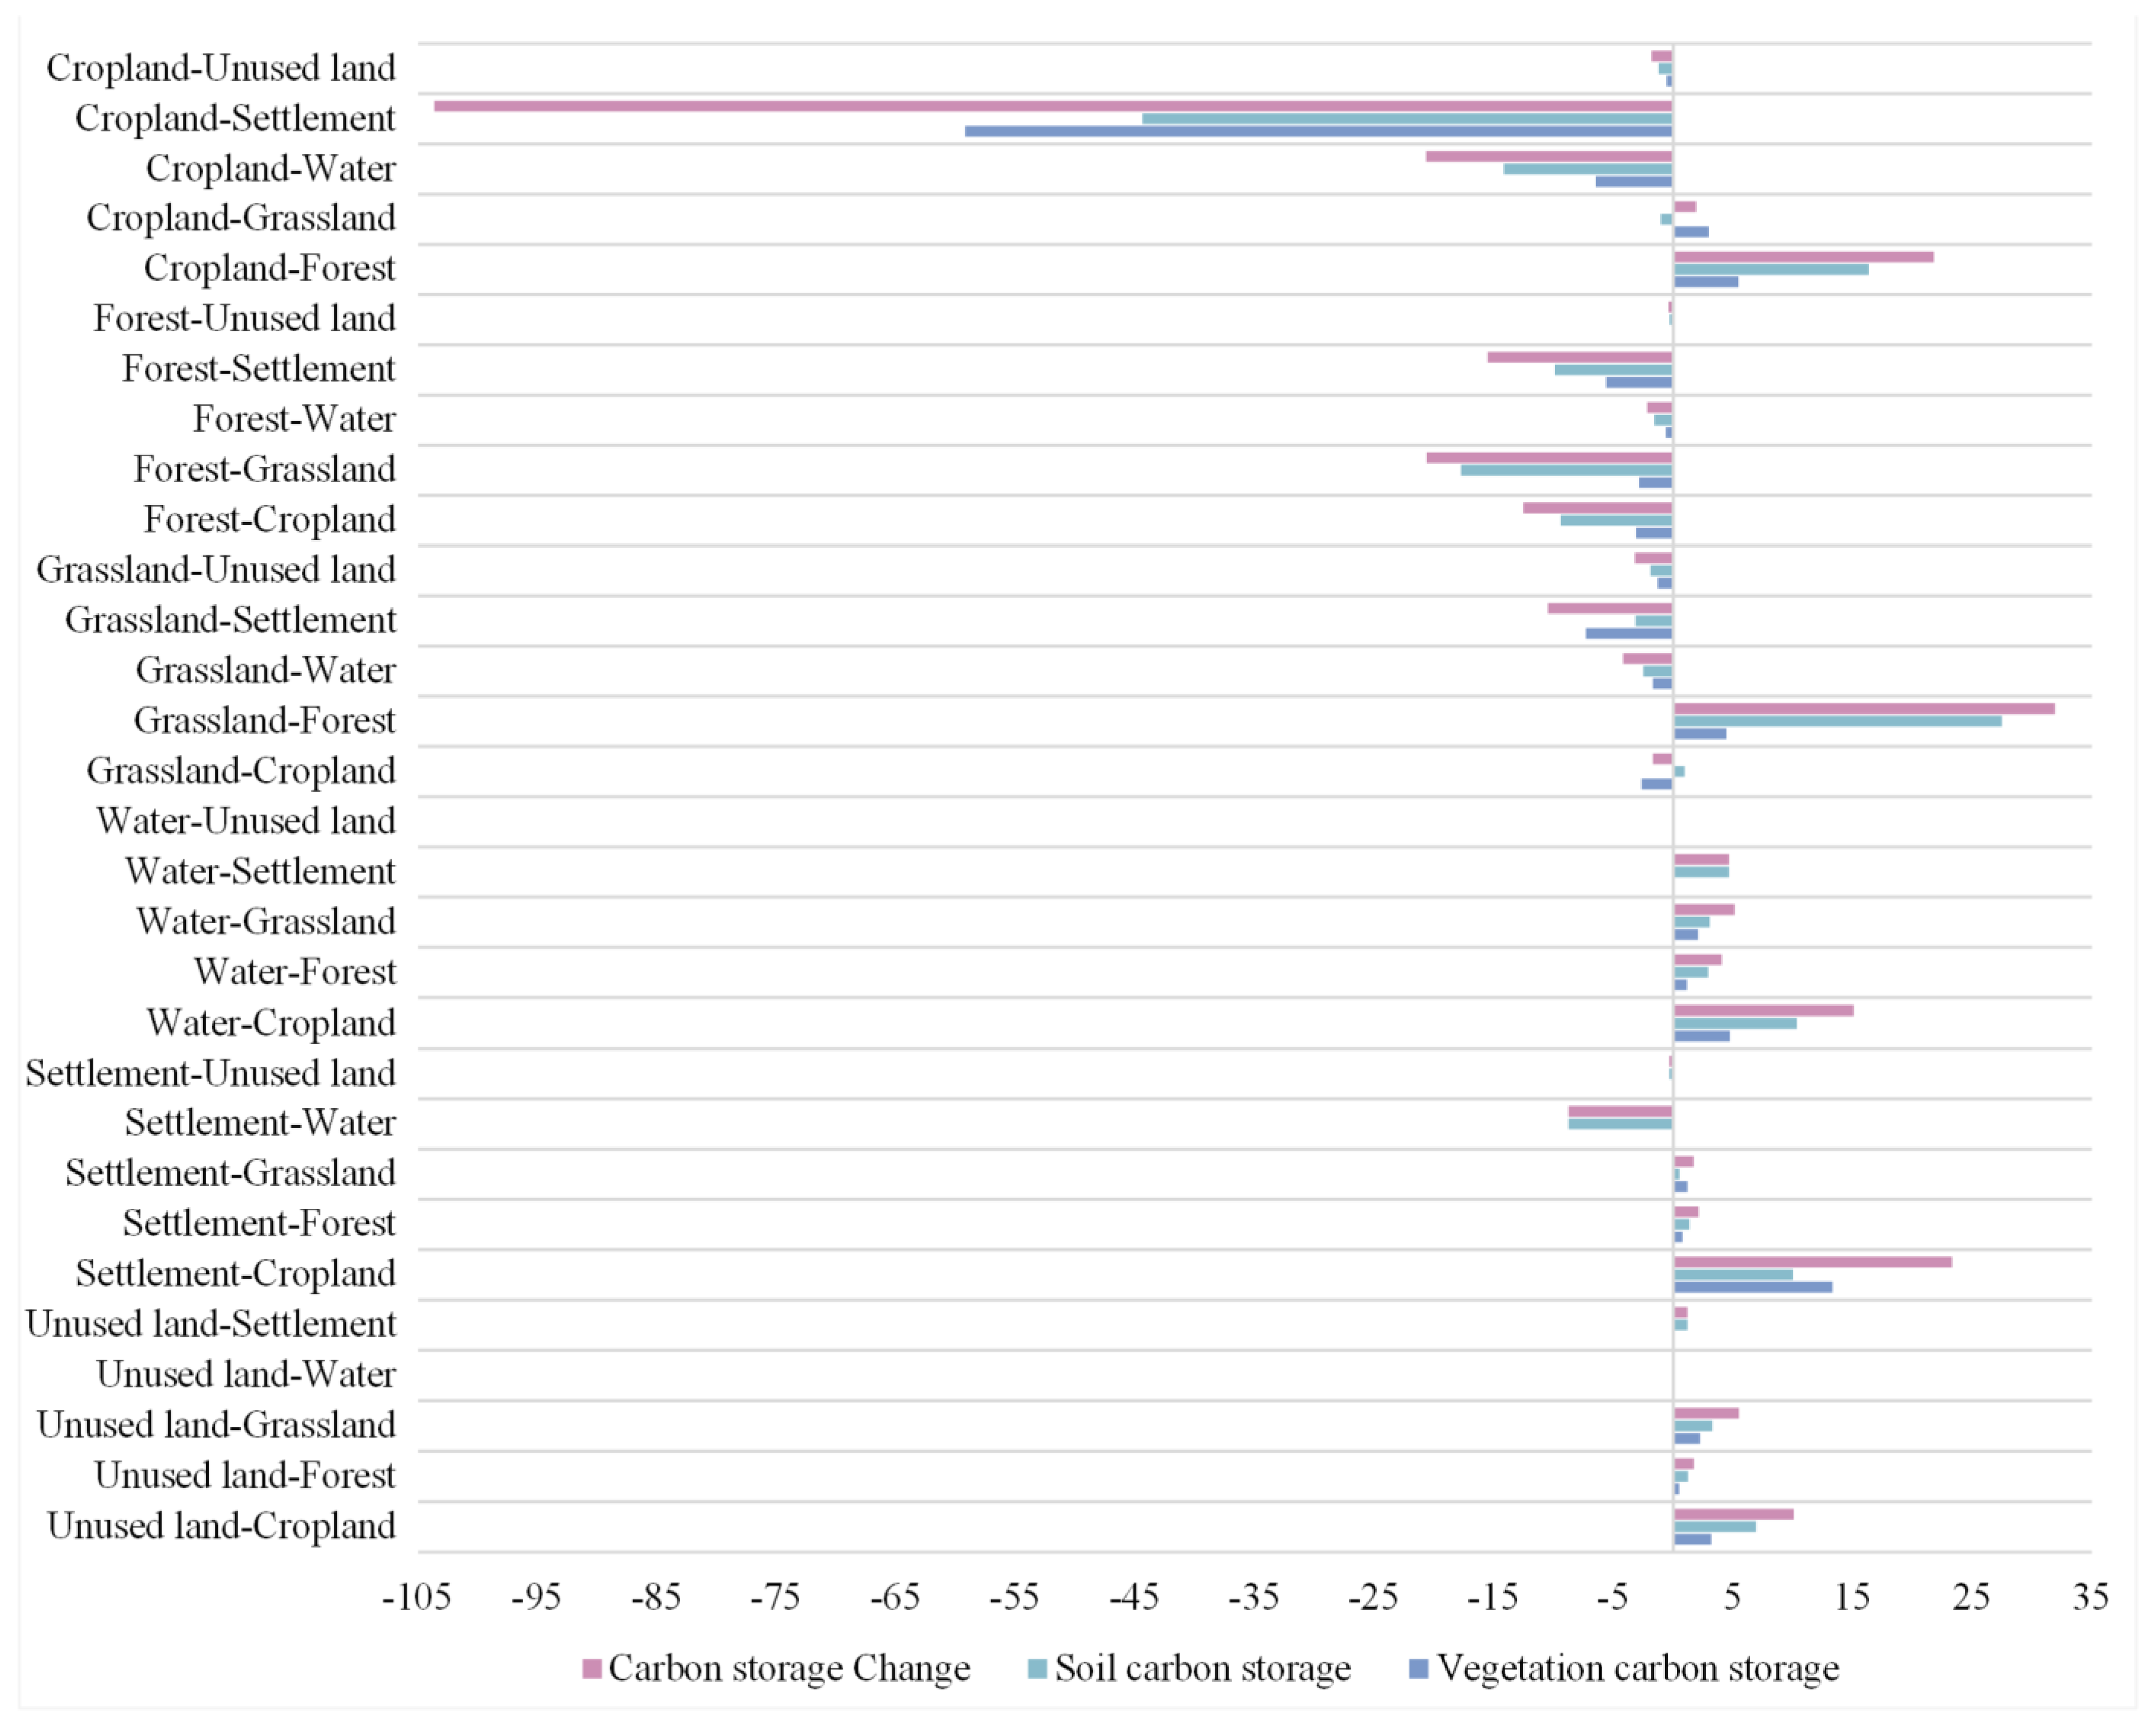
The superimposed partition analysis was used to obtain the dynamic response of carbon storage to the 30 groups of LUCC change from 2000 to 2020. As shown in Figure 11, the turning of significant tracts of cropland and grassland into building land as well as the shift of forest land to grassland are the major causes of the loss of carbon storage in the BTH. As the carbon density of the water and unused land is set at 0 Mg C/ha, the transfer of water and unused land facilitates carbon sink yield. The conversion to cropland and grassland increases carbon storage in the BTH region. However, the contributions to the total carbon storage increase are slight. Over the 20 years, the switching of cropland to construction land induced the largest reduction in carbon storage, at 103.643 × 10⁷ Mg.
From 2000 to 2020, 73.65% of the cropland was converted to construction land, which caused the barrenness or reduction of vegetation cover, reducing the carbon storage of above-ground, below-ground vegetation, and dead organisms. In addition, the conversion of arable land to water is also detrimental to the growth of carbon storage, resulting in a decline in vegetation carbon storage and soil carbon storage of 6.492 × 10⁶ Mg and 14.188 × 10⁶ Mg, respectively. Meanwhile, there was also a minor conversion of arable land to forest land, which brought about an increase in the total carbon storage of 21.802 × 10⁶ Mg.
Since forests provide the maximum density of carbon storage, switching to any other low-density land type will decrease carbon storage. The conversion of forest land to buildable land over the past 20 years resulted in the biggest loss of carbon storage, amounting to 20.639 × 10⁶ Mg. Second, the reductions in carbon storage brought about by the conversion of forest to agriculture and grassland were 15.531 × 10⁶ Mg and 12.561 × 10⁶ Mg, respectively. These conversion mechanisms diminish soil carbon storage.
The conversion of grassland to arable land, water, construction land, and vacant land resulted in losses of carbon storage of 1.709 × 10⁶ Mg, 4.214 × 10⁶ Mg, 10.497 × 10⁶ Mg, and 3.23 × 10⁶ Mg, respectively. Moreover, the conversion of grassland to other land uses resulted in a 12.267 × 10⁶ Mg net increase in carbon storage. The transformation of a sizable tract of grassland into forest land increased carbon storage by 31.917 × 10⁶ Mg.
All transfers of water land to other land use categories result in an increase in carbon storage, totaling 28.902 × 10⁶ Mg, due to the low carbon storage density of water area. More specifically, the conversion of water land to cropland is responsible for 52.16% of the entire increase in carbon storage. It means that between 2000 and 2020, a large amount of water was used for food cultivation. Additionally, a small portion of the watershed was turned into building land, grassland, and forest areas.
The turnout for building land increased the amount of carbon storage. There are transfers in and out between building land and arable land, although the area transferred out is smaller than the area transferred in. Therefore, a negative net increase was gained in the ultimate carbon storage of the construction land itself. Due to the land management initiatives like the MFOZ planning strategy, the growth of building land has been constrained since 2015 (Table 4), and some areas have even been reverted to forest and grassland [59]. Over the last 20 years, these two conversions have increased carbon storage by 2.111 × 10⁶ Mg and 1.694 × 10⁶ Mg, respectively.
The lowest carbon storage density is attributable to the exploitation of undeveloped land, which resulted in an increase in carbon storage of 18.451 × 10⁶ Mg. A substantial part of unused land shifted to cropland, followed by grassland, which brought about an increase in carbon storage of 10.085 × 10⁶ Mg and 5.490 × 10⁶ Mg, respectively. Moreover, a tiny portion of arable land was converted to building and forest land, increasing carbon storage by a total of 2.876 × 10⁶ Mg. The establishment of environmental protection policies, which promote the growth of vegetative cover on vacant land, was largely responsible for these outcomes.

3.5. Vulnerability Assessment of Ecosystem Carbon Storage Services

The vulnerability of carbon storage to LUCC in the BTH region was assessed for periods of 2000–2005, 2005–2010, 2010–2015, and 2015–2020 (Table 8). It is revealed that the land use intensity in the BTH region has increased by 4.65 unit indices within 20 years, with a growth rate of 1.79%, demonstrating a tendency of growing initially and then declining. It was the sharp increase in the highest graded index of construction land from 2000–2015 that led to the increase in the composite index of BTH. The land use intensity decreased between 2015 and 2020 due to the slowdown in the growth of building land and the increase in the amount of ecological land constrained by land conservation policies and environmental protection rules.
In addition, the potential impact (PI) indices for the three time periods 2000–2005, 2005–2010, and 2010–2015 are all negative, at −8.13 Tg, −5.21 Tg, and −19.68 Tg, respectively, while the PI index for 2015–2020 is 5.94. The results show the vulnerability of ecosystem service functions for carbon storage deteriorating from 2000–2015, especially from 2010–2015. It reveals that the lack of rational land utilization in the BTH region during the 15 years has led to a dramatic increase in the potential negative impacts of carbon storage services. The PI index turns from negative to positive, indicating that the problem of vulnerability in the ecosystem service function of carbon storage has been alleviated. Despite the continued existence of the aforementioned issues, the situation has improved.

4. Discussion

4.1. Spatiotemporal Impact of LUCC on Carbon Storage and Its Vulnerability to Service Functions

Influenced by LUCC, the terrestrial ecosystems of the BTH urban agglomeration witnessed severe carbon storage losses between 2000 and 2020. The same findings were also obtained in the studies of other scholars [25,54,57]. This result means that the BTH ecosystem is suffering damage. The occupation of large amounts of ecological and arable land is the main reason (i.e., the conversion of a considerable proportion of arable land, which is the largest carbon pool in the BTH region, into land for construction with little vegetation cover and frequent human activity) [60]. These trends and results also occurred in similar regions, such as Jiangsu Province, Chongqing Province, and the Yangtze River Delta [15,25,42,61].
The spatial and temporal variation of carbon storage were mainly consistent with those of land use change, with the characteristics of “high concentration in the northeast-southwest and little accumulation in the middle-east” [62]. It presented a significant spatial auto-correlation that the high-high value areas are clustered in the northwest, the L-L value areas are distributed in a band in the central-southern part, and the H-L and L-H value areas are scattered around. Previous investigations also support our findings [54]. The implementation of local land management policies during the synergistic development of BTH has led to an increase in carbon storage with spatial spillover effects [63].
The implementation of MFOZ Planning has yielded positive results. The results showed that after a significant reduction in ecological land, such as forests and grasslands, there has been an area increase in 2015–2020. Policy factors have effectively restricted the expansion of urban sites. Meanwhile, under the regulation of environmental protection policies, the ecological land in the Central Core Zone has stopped significantly transferring out. Similar results have been obtained in another study [64]. Although total carbon storage is still growing negatively, there has been a significant reduction in the amount of carbon lost. This finding is corroborated by comparable studies [48,49]. Specifically, the increase in the proportion of high carbon pools in the Eastern Coastal Development Zone and the Central Core Zone are the main reasons for the above result. The Northwest Ecological Zone has maintained its role of contributing the largest share of carbon storage to the entire region through extensive forest and grassland coverage [54]. It implied that the management of watersheds, forests, and agriculture had started to have a positive effect on terrestrial carbon storage [65]. Similar results were obtained in the cases of the Yangtze River Delta region and Nanning City in China [66]. Internationally, countries such as Germany, France, the Netherlands, Korea, etc., implemented spatial planning strategies based on their circumstances, which have also played a positive role [35,67].
Land use intensity changes and land use type transformations both have a direct influence on carbon storage in the atmosphere. The analysis discovered a trend of growing and then decreasing land use intensity in the BTH region during the previous 20 years. Correspondingly, the vulnerability of the ecosystem carbon storage service function also played a role in changing from deterioration to mitigation. After 2015, the vulnerability index of ecosystem carbon storage service function in the BTH urban agglomeration turns from negative to positive, indicating that the implementation of the policy of decommissioning non-capital functions in Beijing in 2013, as well as the MFOZ planning in 2014, are beginning to bear fruit. This reflects the gradual rationalization of regional land use planning and regulation, and the continuous optimization of the spatial structure of urban, agricultural, and ecological categories [46]. The MFOZ planning improved the efficiency of land resource allocation and reverse ecological degradation [48].

4.2. Strategies to Increase Carbon Storage in BTH in the Future

An urgent agenda should be set to allocate and utilize land reasonably and mitigate terrestrial carbon storage losses for BTH. The following recommendations deserve attention: First and foremost, the government should judiciously regulate the different types of land use, put special emphasis on structuring land use optimally [10], support the coordination of urban growth, arable land protection, and ecological protection, and improve coastal area management [61]. Encourage the steady expansion, or at the very least the stability, of carbon-rich grassland and woodland regions. Secondly, the implementation of adaptive management is seen as effective in enhancing the resilience of carbon storage functions in terrestrial ecosystems [26,68]. Social investment is needed to dynamically monitor and regulate land bearing in areas of frequent human activity and industrial intensity. Scientific management tools are bound to be used for the rational allocation of land-industry-population to reduce land-use intensity and meet ecosystem capacity and socioeconomic needs simultaneously. The last but not the least, being aware of the numerous roles of the land and understanding the transition from a single land function to a production-ecological compound function [22]. For example, encourage inter-cropping patterns, develop under-forest economics, and enhance the greenbelt provision to increase the area of ecological land while improving food supply and urban development. In summary, existing policies such as the establishment and management of protected areas, differentiated land management, and the expansion of urban carbon sinks can be used as policy instruments to enhance the ecological service function of carbon storage in megacities.
There are large differences in the impact of LUCC on carbon storage in the major functional areas under different planning policies [54]. By optimizing the effectiveness of land use within the corresponding functional orientation of each zone, the formulation and implementation of MFOZ planning according to regional differentiation allow for controlling the disorderly development of land space and mitigating the deterioration of the ecological environment [48]. Given that the results showed that carbon storage patterns shift in geographically diverse ways at Major Function Oriented Zones. Water conservation and reforestation are crucial for balancing the loss of carbon storage [69]. Restrict the conversion of cropland to construction land in the Central Heart Function Zone and Southern Functional Development Zone, which are instrumental in carbon storage and promote carbon balance in the BTH region. It is undeniable that differentiated planning policies for carbon stock increases should be accompanied by differentiated carbon compensation schemes to foster the synergistic development of ecology and economy in the whole region. In summary, this “win-win” strategy of spatial planning policy is also suitable for replication in other countries.

4.3. Limitations and Future Perspectives

The research also involves some questions that remain unresolved. Some uncertain factors may exist when calculating carbon storage via the InVEST model. Firstly, the carbon density estimates used in this study are not based on precise measurements but rather on results from earlier research that have been weather-adjusted. The conclusions of the overall research are unaffected, although future carbon density measurements still need to be more accurate. Secondly, interannual and seasonal variations in carbon density variation were not considered, owing to the lack of conditions for implementing field monitoring and the unavailability of more precise data required [11,70]. A dynamic approach or a more comprehensive estimation model is also needed, which are the future research directions in this field. Finally, the data on land use change is mostly based on the use of remote sensing technology. Although remote sensing technology is maturing, the accuracy of land use classification is difficult to guarantee due to the subjective factors of operators in the process of remote sensing image interpretation.
In metropolitan settings, the effect of land use conversion on carbon storage is more complicated. For instance, the stark disparity between producing and living land, the likelihood of frequent land use changes, or the inability to assess these elements’ influence on the soil all contribute to erroneous measurement results. Moreover, with the rapid urbanization process, plenty of individuals move to the city, which may result in a lot of abandoned farmland or poor management of grassland and forests, which lowers plant cover or soil organic compounds below the target value of carbon storage density.

5. Conclusions

Carbon storage is a key indicator to measure ecosystem services [62]. Recently, vigorous emphasis has been placed on optimizing land spatial planning to protect carbon storage and enhance ecosystem resilience. This study explored the response of carbon storage to LUCC as well as the vulnerability of its ecological service functions under MFOZ planning. The main findings are as follows:
(1)
The BTH urban ecosystem experienced a carbon storage reduction of about 7.25 × 10⁷ Mg from 2000 to 2020. The main cause is the expansion of construction land, which crowded out cropland, with cropland being the largest carbon pool. The spatial distribution of carbon storage displayed high consistency with land use distribution and tended to be aggregated in space. The distribution of high carbon storage shows a pattern of “northeast flaky-Midwest belt-southwest edge point”, while the low carbon storage areas are concentrated in the central areas of Beijing and Tianjin.
(2)
The BTH agglomeration’s land area is separated into four categories for differentiated development under MFOZ planning. The high-carbon place is mainly concentrated in the Northwest Ecological Zone, the medium-carbon field is located in the Southern Expansion Zone, and the low-carbon location is distributed in the Eastern Coastal Development Zone and the Central Core Zone. The first consequences of the MFOZ design were apparent starting in 2015, with the ecological land in the Central Core Zone and Eastern Coastal Development Zone stopping decreasing, meanwhile, the proportion of high-carbon storage areas in the Eastern Coastal Development Zone increased.
(3)
Over the two decades, the land use degree index improved by 4.65 overall, with PI indices ranging from −8.13 to 5.94 Tg, which are the positive results of the slowdown in construction land expansion. Vulnerability worsened from 2000–2015 and was alleviated from 2015–2020. This reflects the gradual rationalization of land use planning and regulation in the BTH region.

Author Contributions

Conceptualization, L.G. and Y.X.; methodology, L.G.; writing—original draft preparation, L.G. and Y.Z.; writing—review and editing, Y.W. and H.H.; supervision, Y.Z.; project administration, H.H. All authors have read and agreed to the published version of the manuscript.

Funding

This research was funded by the National Social Science Foundation of China, grant number 18BGL052.

Data Availability Statement

The datasets generated during and/or analyzed during the current study are available in the (Resources and Environmental Sciences, Chinese Academy of Sciences (RESDC)) repository, (http://www.resdc.cn (accessed on 18 June 2022)).

Acknowledgments

We would like to thank the National Social Science Foundation of China for funding this paper.

Conflicts of Interest

No potential conflicts of interest were reported by the authors.

References

  1. Liu, Z.; Deng, Z.; He, G.; Wang, H.; Zhang, X.; Lin, J.; Qi, Y.; Liang, X. Challenges and opportunities for carbon neutrality in China. Nat. Rev. Earth Environ. 2021, 3, 141–155. [Google Scholar] [CrossRef]
  2. Rollo, A.M.; Rollo, A.; Mora, C. The tree-lined path to carbon neutrality. Nat. Rev. Earth Environ. 2020, 1, 332. [Google Scholar] [CrossRef]
  3. Ito, A.; Nishina, K.; Noda, H.M. Impacts of future climate change on the carbon budget of northern high-latitude terrestrial ecosystems: An analysis using ISI-MIP data. Polar Sci. 2016, 10, 346–355. [Google Scholar] [CrossRef]
  4. Aneseyee, A.B.; Soromessa, T.; Elias, E.; Noszczyk, T.; Hernik, J.; Benti, N.E. Expressing carbon storage in economic terms: The case of the upper Omo Gibe Basin in Ethiopia. Sci. Total Environ. 2022, 808, 152166. [Google Scholar] [CrossRef] [PubMed]
  5. Case, M.J.; Johnson, B.G.; Bartowitz, K.J.; Hudiburg, T.W. Forests of the future: Climate change impacts and implications for carbon storage in the Pacific Northwest, USA. For. Ecol. Manag. 2021, 482, 118886. [Google Scholar] [CrossRef]
  6. Reichstein, M.; Bahn, M.; Ciais, P.; Frank, D.; Mahecha, M.D.; Seneviratne, S.I.; Zscheischler, J.; Beer, C.; Buchmann, N.; Frank, D.C. Climate extremes and the carbon cycle. Nature 2013, 500, 287–295. [Google Scholar] [CrossRef]
  7. Feng, Y.; Chen, S.; Tong, X.; Lei, Z.; Gao, C.; Wang, J. Modeling changes in China’s 2000–2030 carbon stock caused by land use change. J. Clean. Prod. 2020, 252, 119659. [Google Scholar] [CrossRef]
  8. Guo, R.; Zhao, Y.; Shi, Y.; Li, F.; Hu, J.; Yang, H. Low carbon development and local sustainability from a carbon balance perspective. Resour. Conserv. Recycl. 2017, 122, 270–279. [Google Scholar] [CrossRef]
  9. Liu, W.; Zhan, J.; Zhao, F.; Yan, H.; Zhang, F.; Wei, X. Impacts of urbanization-induced land-use changes on ecosystem services: A case study of the Pearl River Delta Metropolitan Region, China. Ecol. Indic. 2019, 98, 228–238. [Google Scholar] [CrossRef]
  10. Jie, Y.; Baopeng, X.; Degang, Z. Spatio-temporal evolution of carbon stocks in the Yellow River Basin based on InVEST and CA-Markov models. Chin. J. Eco-Agric. 2021, 29, 1018–1029. [Google Scholar] [CrossRef]
  11. Xu, C.; Zhang, Q.; Yu, Q.; Wang, J.; Wang, F.; Qiu, S.; Ai, M.; Zhao, J. Effects of land use/cover change on carbon storage between 2000 and 2040 in the Yellow River Basin, China. Ecol. Indic. 2023, 151, 110345. [Google Scholar] [CrossRef]
  12. Jin, G.; Chen, K.; Wang, P.; Guo, B.; Dong, Y.; Yang, J. Trade-offs in land-use competition and sustainable land development in the North China Plain. Technol. Forecast. Soc. 2019, 141, 36–46. [Google Scholar] [CrossRef]
  13. Weißhuhn, P.; Müller, F.; Wiggering, H. Ecosystem Vulnerability Review: Proposal of an Interdisciplinary Ecosystem Assessment Approach. Environ. Manag. 2018, 61, 904–915. [Google Scholar] [CrossRef] [PubMed] [Green Version]
  14. Wang, L.; Zhu, R.; Yin, Z.; Zexia, C.; Fang, C.; Lu, R.; Zhou, J.; Feng, Y. Impacts of Land-Use Change on the Spatio-Temporal Patterns of Terrestrial Ecosystem Carbon Storage in the Gansu Province, Northwest China. Remote Sens. 2022, 14, 3164. [Google Scholar] [CrossRef]
  15. Zhu, L.; Song, R.; Sun, S.; Li, Y.; Hu, K. Land use/land cover change and its impact on ecosystem carbon storage in coastal areas of China from 1980 to 2050. Ecol. Indic. 2022, 142, 109178. [Google Scholar] [CrossRef]
  16. Zhao, M.; He, Z.; Du, J.; Chen, L.; Lin, P.; Fang, S. Assessing the effects of ecological engineering on carbon storage by linking the CA-Markov and InVEST models. Ecol. Indic. 2019, 98, 29–38. [Google Scholar] [CrossRef]
  17. Nogueira, E.M.; Yanai, A.M.; de Vasconcelos, S.S.; de Alencastro Graça, P.M.L.; Fearnside, P.M. Carbon stocks and losses to deforestation in protected areas in Brazilian Amazonia. Reg. Environ. Chang. 2018, 18, 261–270. [Google Scholar] [CrossRef] [Green Version]
  18. Li, M.; Liang, D.; Xia, J.; Song, J.; Cheng, D.; Wu, J.; Cao, Y.; Sun, H.; Li, Q. Evaluation of water conservation function of Danjiang River Basin in Qinling Mountains, China based on InVEST model. J. Environ. Manag. 2021, 286, 112212. [Google Scholar] [CrossRef]
  19. Liang, Y.; Hashimoto, S.; Liu, L. Integrated assessment of land-use/land-cover dynamics on carbon storage services in the Loess Plateau of China from 1995 to 2050. Ecol. Indic. 2021, 120, 106939. [Google Scholar] [CrossRef]
  20. Li, K.; Cao, J.; Adamowski, J.F.; Biswas, A.; Zhou, J.; Liu, Y.; Zhang, Y.; Liu, C.; Dong, X.; Qin, Y. Assessing the effects of ecological engineering on spatiotemporal dynamics of carbon storage from 2000 to 2016 in the Loess Plateau area using the InVEST model: A case study in Huining County, China. Environ. Dev. 2021, 39, 100641. [Google Scholar] [CrossRef]
  21. Hoque, M.Z.; Cui, S.; Islam, I.; Xu, L.; Ding, S. Dynamics of plantation forest development and ecosystem carbon storage change in coastal Bangladesh. Ecol. Indic. 2021, 130, 107954. [Google Scholar] [CrossRef]
  22. Zhu, G.; Qiu, D.; Zhang, Z.; Sang, L.; Liu, Y.; Wang, L.; Zhao, K.; Ma, H.; Xu, Y.; Wan, Q. Land-use changes lead to a decrease in carbon storage in arid region, China. Ecol. Indic. 2021, 127, 107770. [Google Scholar] [CrossRef]
  23. Adelisardou, F.; Zhao, W.; Chow, R.; Mederly, P.; Minkina, T.; Schou, J.S. Spatiotemporal change detection of carbon storage and sequestration in an arid ecosystem by integrating Google Earth Engine and InVEST (the Jiroft plain, Iran). Int. J. Environ. Sci. Technol. 2022, 19, 5929–5944. [Google Scholar] [CrossRef]
  24. Wu, Y.; Zhang, X.; Shen, L. The impact of urbanization policy on land use change: A scenario analysis. Cities 2011, 28, 147–159. [Google Scholar] [CrossRef]
  25. Gao, J.; Wang, L. Embedding spatiotemporal changes in carbon storage into urban agglomeration ecosystem management—A case study of the Yangtze River Delta, China. J. Clean. Prod. 2019, 237, 117764. [Google Scholar] [CrossRef]
  26. Zhang, F.; Xu, N.; Wang, C.; Wu, F.; Chu, X. Effects of land use and land cover change on carbon sequestration and adaptive management in Shanghai, China. Phys. Chem. Earth Parts A/B/C 2020, 120, 102948. [Google Scholar] [CrossRef]
  27. Tang, L.; Ke, X.; Zhou, Q.; Wang, L.; Koomen, E. Projecting future impacts of cropland reclamation policies on carbon storage. Ecol. Indic. 2020, 119, 106835. [Google Scholar] [CrossRef]
  28. Chuai, X.; Yuan, Y.; Zhang, X.; Guo, X.; Zhang, X.; Xie, F.; Zhao, R.; Li, J. Multiangle land use-linked carbon balance examination in Nanjing City, China. Land Use Policy 2019, 84, 305–315. [Google Scholar] [CrossRef]
  29. Li, C.; Zhao, J.; Thinh, N.X.; Xi, Y. Assessment of the effects of urban expansion on terrestrial carbon storage: A case study in Xuzhou City, China. Sustainability 2018, 10, 647. [Google Scholar] [CrossRef] [Green Version]
  30. Schulp, C.J.E.; Nabuurs, G.; Verburg, P.H. Future carbon sequestration in Europe—Effects of land use change. Agric. Ecosyst. Environ. 2008, 127, 251–264. [Google Scholar] [CrossRef]
  31. Rozas-Vásquez, D.; Fürst, C.; Geneletti, D.; Almendra, O. Integration of ecosystem services in strategic environmental assessment across spatial planning scales. Land Use Policy 2018, 71, 303–310. [Google Scholar] [CrossRef]
  32. Hernández-Guzmán, R.; Ruiz-Luna, A.; González, C. Assessing and modeling the impact of land use and changes in land cover related to carbon storage in a western basin in Mexico. Remote Sens. Appl. Soc. Environ. 2019, 13, 318–327. [Google Scholar] [CrossRef]
  33. Wu, J.; Tang, Z.; Lü, F.; Yang, K. Ultrasonic guided wave focusing in waveguides with constant irregular cross-sections. Ultrasonics 2018, 89, 1–12. [Google Scholar] [CrossRef] [PubMed]
  34. Fan, J.; Wang, Y.; Wang, C.; Chen, T.; Jin, F.; Zhang, W.; Li, L.; Xu, Y.; Dai, E.; Tao, A.; et al. Reshaping the sustainable geographical pattern: A major function zoning model and its applications in China. Earth’s Future 2019, 7, 25–42. [Google Scholar] [CrossRef]
  35. Hwang, J.; Choi, Y.; Kim, Y.; Ol, L.N.; Yoo, Y.; Cho, H.J.; Sun, Z.; Jeon, S. Analysis of the effect of environmental protected areas on land-use and carbon storage in a megalopolis. Ecol. Indic. 2021, 133, 108352. [Google Scholar] [CrossRef]
  36. Wood, S.; Karp, D.; Declerck, F.; Kremen, C.; Naeem, S.; Palm, C. Functional traits in agriculture: Agrobiodiversity and ecosystem services. Trends Ecol. Evol. 2015, 30, 531–539. [Google Scholar] [CrossRef] [PubMed] [Green Version]
  37. Sannigrahi, S.; Chakraborti, S.; Joshi, P.K.; Keesstra, S.; Sen, S.; Paul, S.K.; Kreuter, U.; Sutton, P.C.; Jha, S.; Dang, K.B. Ecosystem service value assessment of a natural reserve region for strengthening protection and conservation. J. Environ. Manag. 2019, 244, 208–227. [Google Scholar] [CrossRef]
  38. Huang, A.; Xu, Y.; Sun, P.; Zhou, G.; Liu, C.; Lu, L.; Xiang, Y.; Wang, H. Land use/land cover changes and its impact on ecosystem services in ecologically fragile zone: A case study of Zhangjiakou City, Hebei Province, China. Ecol. Indic. 2019, 104, 604–614. [Google Scholar] [CrossRef]
  39. Xu, X.; Wang, L.; Sun, M.; Fu, C.; Bai, Y.; Li, C.; Zhang, L. Climate change vulnerability assessment for smallholder farmers in China: An extended framework. J. Environ. Manag. 2020, 276, 111315. [Google Scholar] [CrossRef] [PubMed]
  40. Sekhri, S.; Kumar, P.; Fürst, C.; Pandey, R. Mountain specific multi-hazard risk management framework (MSMRMF): Assessment and mitigation of multi-hazard and climate change risk in the Indian Himalayan Region. Ecol. Indic. 2020, 118, 106700. [Google Scholar] [CrossRef]
  41. Liu, L.; Liang, Y.; Hashimoto, S. Integrated assessment of land-use/coverage changes and their impacts on ecosystem services in Gansu Province, northwest China: Implications for sustainable development goals. Sustain. Sci. 2020, 15, 297–314. [Google Scholar] [CrossRef]
  42. Xiang, S.; Wang, Y.; Deng, H.; Yang, C.; Wang, Z.; Gao, M. Response and multi-scenario prediction of carbon storage to land use/cover change in the main urban area of Chongqing, China. Ecol. Indic. 2022, 142, 109205. [Google Scholar] [CrossRef]
  43. McCarthy, J.J.; Canziani, O.F.; Leary, N.A.; Dokken, D.J.; White, K.S. Climate Change 2001: Impacts, Adaptation, and Vulnerability: Contribution of Working Group II to the Third Assessment Report of the Intergovernmental Panel on Climate Change; Cambridge University Press: Cambridge, UK; New York, NY, USA, 2002. [Google Scholar]
  44. Pörtner, H.; Roberts, D.C.; Adams, H.; Adler, C.; Aldunce, P.; Ali, E.; Begum, R.A.; Betts, R.; Kerr, R.B.; Biesbroek, R. Climate Change 2022: Impacts, Adaptation and Vulnerability; IPCC: Geneva, Switzerland, 2022. [Google Scholar]
  45. Schroeter, D.; Cramer, W.; Leemans, R.; Prentice, I.C.; Araújo, M.B.; Arnell, N.W.; Bondeau, A.; Bugmann, H.; Carter, T.R.; Gracia, C.A. Ecosystem service supply and vulnerability to global change in Europe. Science 2005, 310, 1333–1337. [Google Scholar] [CrossRef] [PubMed] [Green Version]
  46. Pan, Z.; Gao, G.; Fu, B. Spatiotemporal changes and driving forces of ecosystem vulnerability in the Yangtze River Basin, China: Quantification using habitat-structure-function framework. Sci. Total Environ. 2022, 835, 155494. [Google Scholar] [CrossRef] [PubMed]
  47. Zhou, Y.; Chen, M.; Tang, Z.; Mei, Z. Urbanization, land use change, and carbon emissions: Quantitative assessments for city-level carbon emissions in Beijing-Tianjin-Hebei region. Sustain. Cities Soc. 2021, 66, 102701. [Google Scholar] [CrossRef]
  48. Wang, J.; Li, L.; Li, Q.; Wang, S.; Liu, X.; Li, Y. The Spatiotemporal Evolution and Prediction of Carbon Storage in the Yellow River Basin Based on the Major Function-Oriented Zone Planning. Sustainability 2022, 14, 7963. [Google Scholar] [CrossRef]
  49. Nie, X.; Lu, B.; Chen, Z.; Yang, Y.; Chen, S.; Chen, Z.; Wang, H. Increase or decrease? Integrating the CLUMondo and InVEST models to assess the impact of the implementation of the Major Function Oriented Zone planning on carbon storage. Ecol. Indic. 2020, 118, 106708. [Google Scholar] [CrossRef]
  50. Sharp, R.; Chaplin-Kramer, R.; Wood, S.; Guerry, A.; Tallis, H.; Ricketts, T.; Nelson, E.; Ennaanay, D.; Wolny, S.; Olwero, N.; et al. InVEST User’s Guide; The Natural Capital Project; Stanford University: Stanford, CA, USA; University of Minnesota: Minneapolis, MN, USA; The Nature Conservancy: Arlington, TX, USA; World Wildlife Fund: Gland, Switzerland, 2018. [Google Scholar] [CrossRef]
  51. Clerici, N.; Cote-Navarro, F.; Escobedo, F.J.; Rubiano, K.; Villegas, J.C. Spatio-temporal and cumulative effects of land use-land cover and climate change on two ecosystem services in the Colombian Andes. Sci. Total Environ. 2019, 685, 1181–1192. [Google Scholar] [CrossRef]
  52. Wang, H.; Liu, X.; Zhao, C.; Chang, Y.; Liu, Y.; Zang, F. Spatial-temporal pattern analysis of landscape ecological risk assessment based on land use/land cover change in Baishuijiang National nature reserve in Gansu Province, China. Ecol. Indic. 2021, 124, 107454. [Google Scholar] [CrossRef]
  53. Metzger, M.J.; Rounsevell, M.; Acosta-Michlik, L.; Leemans, R.; Schröter, D. The vulnerability of ecosystem services to land use change. Agric. Ecosyst. Environ. 2006, 114, 69–85. [Google Scholar] [CrossRef]
  54. He, Y.; Xia, C.; Shao, Z.; Zhao, J. The spatiotemporal evolution and prediction of carbon storage: A case study of urban agglomeration in China’s Beijing-Tianjin-Hebei region. Land 2022, 11, 858. [Google Scholar] [CrossRef]
  55. Yang, Y.; Bao, W.; Li, Y.; Wang, Y.; Chen, Z. Land use transition and its eco-environmental effects in the Beijing–Tianjin–Hebei urban agglomeration: A production–living–ecological perspective. Land 2020, 9, 285. [Google Scholar] [CrossRef]
  56. Sun, X.; Lu, Z.; Li, F.; Crittenden, J.C. Analyzing spatio-temporal changes and trade-offs to support the supply of multiple ecosystem services in Beijing, China. Ecol. Indic. 2018, 94, 117–129. [Google Scholar] [CrossRef]
  57. Wang, C.; Zhan, J.; Chu, X.; Liu, W.; Zhang, F. Variation in ecosystem services with rapid urbanization: A study of carbon sequestration in the Beijing–Tianjin–Hebei region, China. Phys. Chem. Earth Parts A/B/C 2019, 110, 195–202. [Google Scholar] [CrossRef]
  58. Tang, X.; Zhao, X.; Bai, Y.; Tang, Z.; Wang, W.; Zhao, Y.; Wan, H.; Xie, Z.; Shi, X.; Wu, B.; et al. Carbon pools in China’s terrestrial ecosystems: New estimates based on an intensive field survey. Proc. Natl. Acad. Sci. USA 2018, 115, 4021–4026. [Google Scholar] [CrossRef] [Green Version]
  59. Nolan, C.J.; Field, C.B.; Mach, K.J. Constraints and enablers for increasing carbon storage in the terrestrial biosphere. Nat. Rev. Earth Environ. 2021, 2, 436–446. [Google Scholar] [CrossRef]
  60. Jiang, W.; Deng, Y.; Tang, Z.; Lei, X.; Chen, Z. Modelling the potential impacts of urban ecosystem changes on carbon storage under different scenarios by linking the CLUE-S and the InVEST models. Ecol. Model. 2017, 345, 30–40. [Google Scholar] [CrossRef]
  61. Chuai, X.; Huang, X.; Lai, L.; Wang, W.; Peng, J.; Zhao, R. Land use structure optimization based on carbon storage in several regional terrestrial ecosystems across China. Environ. Sci. Policy 2013, 25, 50–61. [Google Scholar] [CrossRef]
  62. Yu, Y.; Guo, B.; Wang, C.; Zang, W.; Huang, X.; Wu, Z.; Xu, M.; Zhou, K.; Li, J.; Yang, Y. Carbon storage simulation and analysis in Beijing-Tianjin-Hebei region based on CA-plus model under dual-carbon background. Geomat. Nat. Hazards Risk 2023, 14, 2173661. [Google Scholar] [CrossRef]
  63. Guo, J.; Jiang, C.; Wang, Y.; Yang, J.; Huang, W.; Gong, Q.; Zhao, Y.; Yang, Z.; Chen, W.; Ren, H. Exploring ecosystem responses to coastal exploitation and identifying their spatial determinants: Re-orienting ecosystem conservation strategies for landscape management. Ecol. Indic. 2022, 138, 108860. [Google Scholar] [CrossRef]
  64. Siedentop, S.; Fina, S.; Krehl, A. Greenbelts in Germany’s regional plans—An effective growth management policy? Landsc. Urban Plan. 2016, 145, 71–82. [Google Scholar] [CrossRef]
  65. Liang, Y.; Song, W. Integrating potential ecosystem services losses into ecological risk assessment of land use changes: A case study on the Qinghai-Tibet Plateau. J. Environ. Manag. 2022, 318, 115607. [Google Scholar] [CrossRef] [PubMed]
  66. Huang, X.; Pan, B. Progress, problems and suggestions on the implementation of major function area planning. Nat. Res. Econ. Chin. 2020, 33, 4–9. [Google Scholar] [CrossRef]
  67. Roth, D.; Köhne, M.; Rasch, E.D.; Winnubst, M. After the facts: Producing, using and contesting knowledge in two spatial-environmental conflicts in the Netherlands. Environ. Plan. C Politics Space 2020, 39, 626–645. [Google Scholar] [CrossRef]
  68. Barrett, K.J.; Cannon, J.B.; Schuetter, A.M.; Cheng, A.S. Effects of collaborative monitoring and adaptive management on restoration outcomes in dry conifer forests. For. Ecol. Manag. 2021, 488, 119018. [Google Scholar] [CrossRef]
  69. Zhang, W.; Hu, G.; Dang, Y.; Weindorf, D.C.; Sheng, J. Afforestation and the impacts on soil and water conservation at decadal and regional scales in Northwest China. J. Arid. Environ. 2016, 130, 98–104. [Google Scholar] [CrossRef]
  70. Lehmann, J.; Hansel, C.M.; Kaiser, C.; Kleber, M.; Maher, K.; Manzoni, S.; Nunan, N.; Reichstein, M.; Schimel, J.P.; Torn, M.S.; et al. Persistence of soil organic carbon caused by functional complexity. Nat. Geosci. 2020, 13, 529–534. [Google Scholar] [CrossRef]
Figure 1. Location of the study area.
Land 12 01563 g001
Figure 2. The analytical framework of the study.
Land 12 01563 g002
Figure 3. Spatiotemporal distribution of LUCC in the BTH region from 2000 to 2020.
Land 12 01563 g003
Figure 4. Dynamic changes of LUCC types in the BTH region from 2000 to 2022.
Land 12 01563 g004
Figure 5. Changes in LUCC types in function zones from 2000 to 2020. (a) Central Core Zone, (b) Southern Expension Zone, (c) Eastern Coastal Development Zone, (d) NorthWest Ecological Conservation Zone.
Land 12 01563 g005
Figure 6. Spatial distribution of carbon storage in the BTH region from 2000 to 2020.
Land 12 01563 g006
Figure 7. Spatial changes in carbon storage in BTH from 2000 to 2020.
Land 12 01563 g007
Figure 8. Carbon storage change of LUCC types in the BTH region from 2000 to 2020.
Land 12 01563 g008
Figure 9. Changes in carbon storage in LUCC types from 2000 to 2020.
Land 12 01563 g009
Figure 10. The Lisa clustering map of carbon storage in the BTH region from 2000 to 2020.
Land 12 01563 g010
Figure 11. Dynamic response of carbon storage to land use change from 2000 to 2020.
Land 12 01563 g011
Table 1. Classification of Land use types in the Beijing-Tianjin-Hebei Region.
CodeLand Use TypeOriginal CodeOriginal Land Use Type
1Cropland11, 12Paddy fields and dry farmland
2Forest21, 22, 23, 24Wood land, shrub land, sparsely forested land, and other forested land
3Grassland31, 32, 33High coverage grassland, middle coverage grassland, and low coverage grassland
4Water41, 42, 43, 44, 45, 46River and canal, lake, reservoir and waterhole, permanent glacial snow, shoals, and beachland
5Settlement51, 52, 53Cities and towns, rural settlements, industrial and traffic land
6Unused land61, 62, 63, 64, 65, 66, 67Sandy land, Gobi, saline-alkali land, swampland, bare land, rock and gravel, and other unused land
Table 2. Carbon density of each land cover type (Mg C/hm2).
Types of Land UseAGCBGCDOCSOC
Cropland3.847.839.82103.01
Forest25.1368.6914.11225.11
Grassland20.9251.2710.5594.93
Water0000
Construction land00074.12
Unused land0000
Table 3. Land use intensity division.
Land Use TypeCroplandForestGrasslandWaterConstruction LandUnused Land
Land use intensity grade *322241
* 1 represents low land use grade; 2 represents relatively low land use grade; 3 represents relatively high land use grade; 4 represents high land use grade.
Table 4. Changes in LUCC in the BTH region from 2000 to 2020 (in km2).
YearItemCroplandForestGrasslandConstruction LandUnused LandWater
Area
2000Area (km2)109,323.04 44,631.91 35,282.41 17,862.32 2079.60 6469.43
2005 108,265.18 44,645.40 35,102.00 19,370.94 2020.97 6300.83
2010 104,007.01 44,957.28 34,042.27 26,171.10 1290.68 5726.45
2015102,512.83 44,829.51 33,816.28 28,064.22 1409.16 5681.13
202099,894.86 45,488.65 34,040.88 28,130.00 1679.48 7167.64
2000–2005Change Rate (%)−0.97%0.03%−0.51%8.45%−2.82%−2.61%
2005–2010−3.93%0.70%−3.02%35.10%36.14%−9.12%
2010–2015−1.44%−0.28%−0.66%7.23%9.18%−0.79%
2015–2020−2.55%1.47%0.66%0.23%19.18%26.17%
2000–2020−8.62%1.92%−3.52%57.48%−19.24%10.79%
Table 5. LUCC conversion matrix from 2000 to 2020 (in km2).
2000
2020CroplandForestGrasslandWaterConstruction UnusedTransfer in
Cropland——3466.446868.631827.237473.42804.8799,623.64
Forest4652.48——6769.08356.80224.3076.7545,292.73
Grassland6706.046675.92——485.11348.34315.5933,931.74
Water2318.49251.46448.38——1280.95148.116819.22
Construction 16,156.86839.761364.35817.61——184.3527,665.61
Unused 299.0128.74216.79498.3947.81——1632.55
Transfer out10,9315.9344,475.6335,067.986356.9717,677.502071.49214,965.50
Variation *−9692.29817.11−1136.24462.259988.11−438.94
* The value of variation is equal to transfer in minus transfer out; a positive value means an increase in the area of the corresponding LUCC, and vice versa.
Table 6. Area percentages of carbon density changes (%).
2000–20052005–20102010–20152015–20202000–20102000–2020
Unchanged area98.78 90.37 95.14 94.83 89.73 87.27
Increased area0.37 3.89 0.29 2.12 3.96 4.35
Decreased area0.85 5.73 1.05 3.05 6.31 8.38
Table 7. Carbon storage change of different carbon pools in the BTH region from 2000 to 2020 (unit: 106 Mg).
AGCBGCDOCSOCTotal
2000227.51 1010.36 207.55 2598.18 4043.61
2005226.77 1004.47 206.34 2597.05 4034.63
2010223.72 980.81 201.48 2600.55 4006.57
2015222.36 971.63 199.60 2594.17 3987.75
2020223.49 964.79 198.19 2584.66 3971.13
Table 8. Potential impact of land use change on carbon storage capacity.
YearLand Use Intensity IndexLand Use Intensity ChangeTotal Carbon Storage/TgCarbon Storage Change/TgPI */Tg
2000259.33 4043.61
2005260.44 1.10 4034.63 −8.97 −8.13
2010265.83 5.39 4006.57 −28.07 −5.21
2015266.78 0.96 3987.75 −18.81 −19.68
2020263.98 −2.80 3971.13 −16.62 5.94
* PI < 0 negative potential impact; PI = 0 no potential impact; PI > 0 positive potential impact.
Disclaimer/Publisher’s Note: The statements, opinions and data contained in all publications are solely those of the individual author(s) and contributor(s) and not of MDPI and/or the editor(s). MDPI and/or the editor(s) disclaim responsibility for any injury to people or property resulting from any ideas, methods, instructions or products referred to in the content.

