1. Introduction
Rainstorms and floods are among the most common and serious natural disasters [
1]. Every year, there are rainstorms and floods of varying natures in the southwest of China, and excessive precipitation is the major cause. In the rainy season, excessive precipitation increases the soil moisture content and water level in the lakes and rivers, inducing waterlogging, mountain torrents, and debris flows, and even the bursting of riverbanks, which causes damage to housing, traffic, and agriculture, as well as human life loss [
2,
3,
4,
5,
6,
7].
The research methods for floods can generally be divided into three categories. The first is the historical flood case study [
8,
9,
10,
11,
12,
13], which analyzes historical floods in a specific region. The second is the index system evaluation method [
14,
15,
16,
17], which evaluates regional rainstorms and flood disasters through a fuzzy, comprehensive evaluation method. The factors affecting regional floods include not only natural attributes such as topography, landscape, and climate but also social attributes such as social economy, population composition, and flood control construction. The third category is the precipitation category method [
18,
19,
20], which takes the anomaly percentage of ten-day precipitation and monthly precipitation as the main index to measure the degree of flooding and waterlogging. Some researchers also classify categories according to the daily precipitation observations of local meteorological services. In addition, domestic studies have mainly focused on disaster assessment [
12,
13,
14], emergency management [
4], and individual case analysis [
21,
22,
23,
24]. The scope is usually the entirety of China or a single province; the Southwest region is rarely treated as an independent region for analysis. Previous studies have used a single threshold of 50 mm/day to quantify rainstorm flooding, which does not consider the accumulated effects of less intense rainstorms and consequently underestimates damage. Furthermore, these studies have been limited by the data period available, often having been conducted many years ago. This paper offers updated research results on the rainstorms and floods in Southwest China.
This paper focuses on the southwest region of China, including Yunnan, Guizhou, and Sichuan provinces, as well as Chongqing Municipality, which is located on the eastern slope of the Tibetan plateau. Affected by weather and climate systems, such as the plateau circulation, the southwest monsoon, and inappropriate human activities, this region is prone to serious floods and drought [
21,
22,
23,
24]. This study used the daily rainfall category method to define the rainstorms and floods in the entire southwest region. A total of 90 weather stations with continuous data records since their establishment in 1961 were selected for use in this study. We analyzed the temporal and spatial variation characteristics of rainstorms and floods in Southwest China and their relationships with atmospheric circulation. This plays a complementary role in related research, which is helpful for disaster forecasting and prevention. The rest of the paper is organized as follows:
Section 2 describes the method and data;
Section 3 and
Section 4 present the results; and
Section 5 offers conclusions.
2. Materials and Methods
The monthly average geopotential height, specific humidity, and wind fields were sourced from NCEP/NCAR reanalysis [
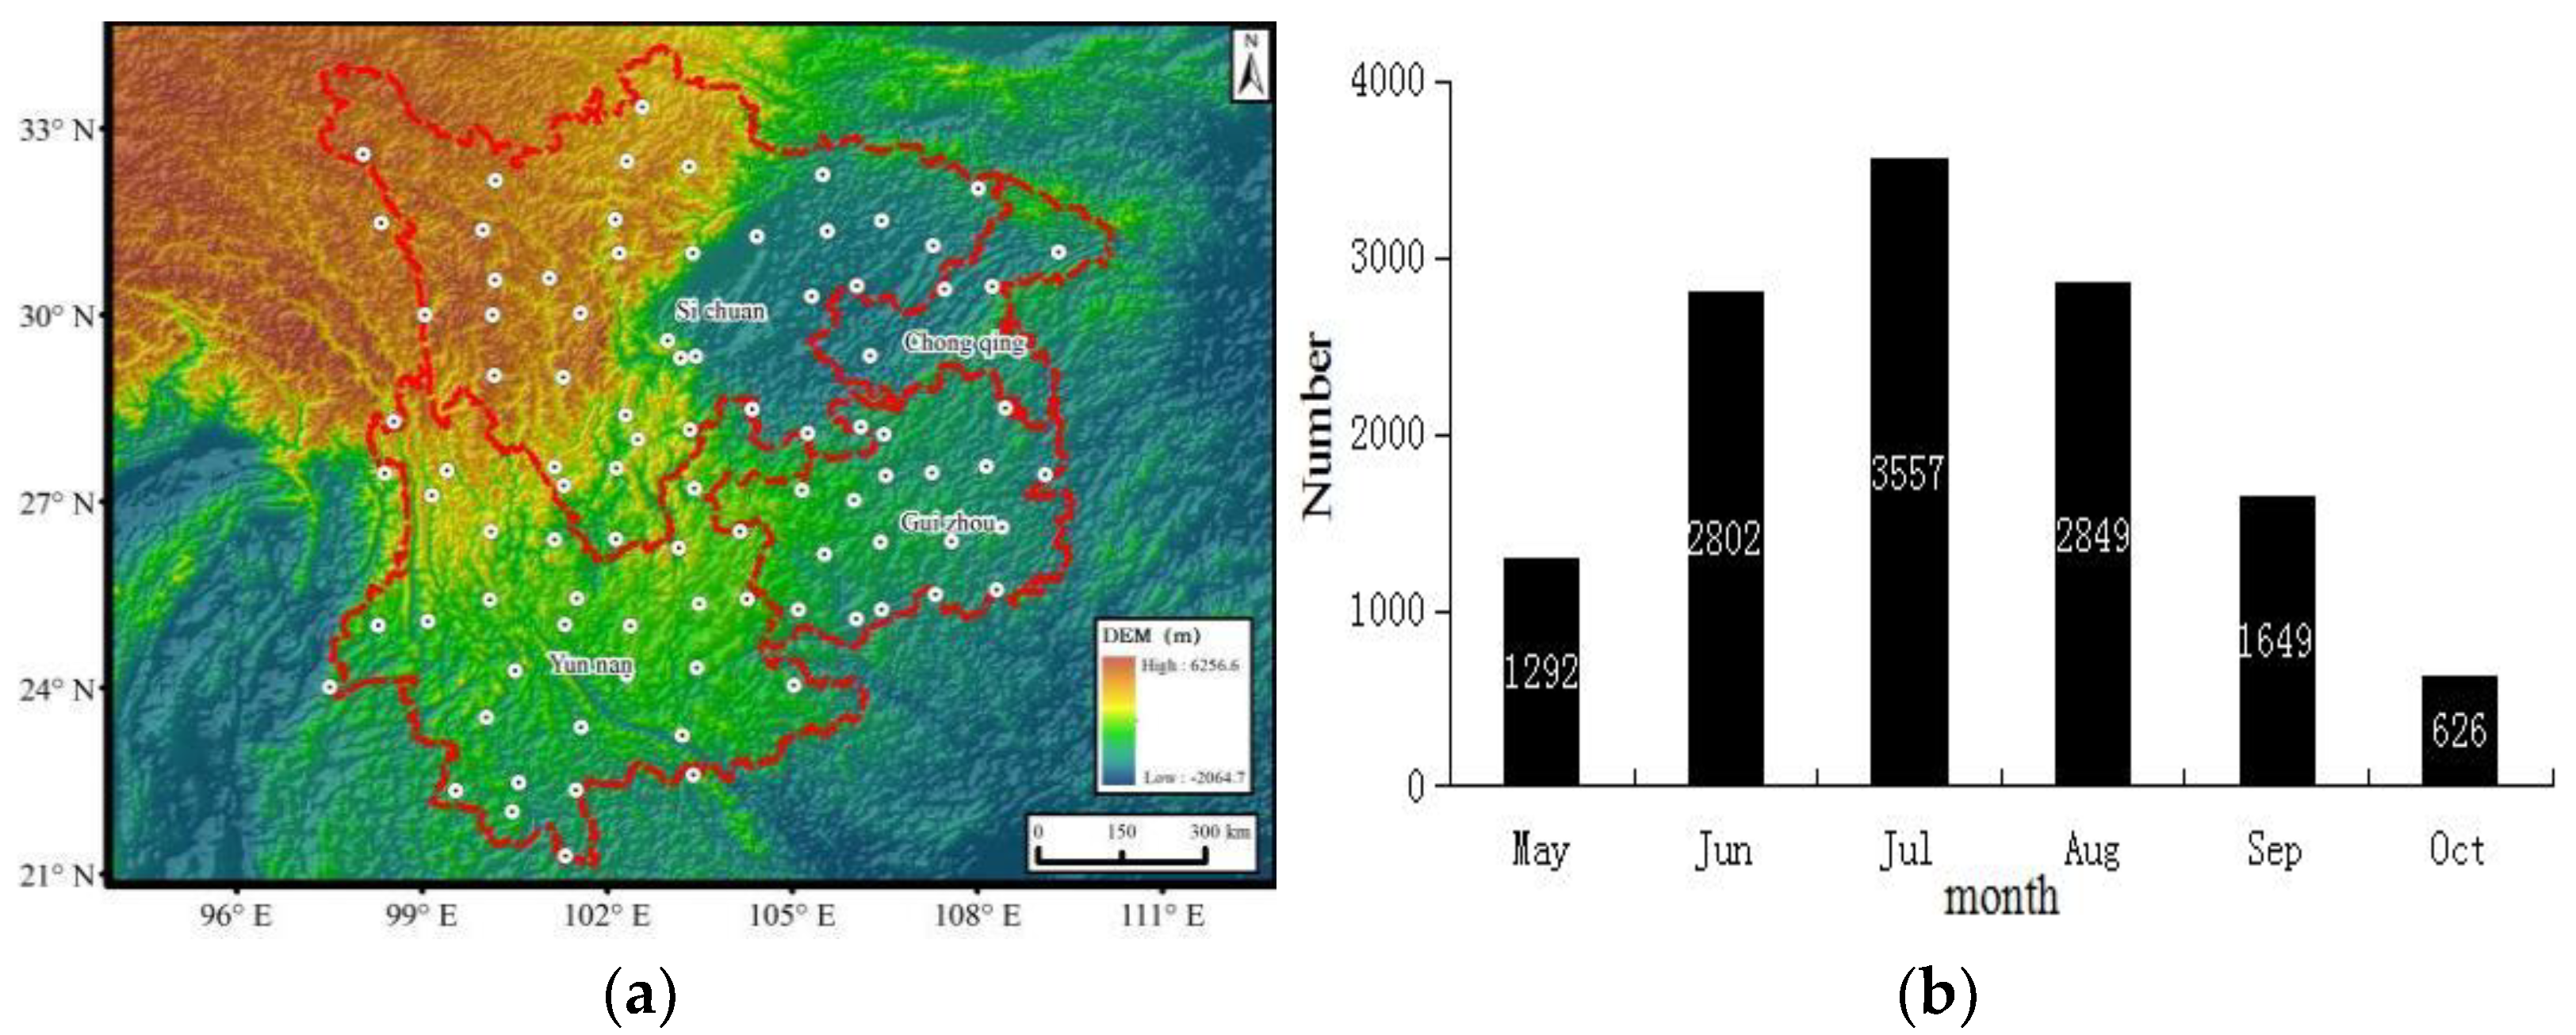
25] at a resolution of 2.5° × 2.5°. The daily precipitation was sourced from 90 surface meteorological observation stations in Southwest China (
Figure 1a).
Feng and Luo [
3] found that 95% of rainstorm and flooding disasters were flood disasters caused by rainstorms in Southwest China. As short-term rainstorms are the main cause of rainstorm and flood disasters, the daily precipitation in Southwest China (Sichuan, Guizhou, Yunnan, and Chongqing) was chosen to define and discuss the rainstorms and floods.
According to previous studies on rainstorms and floods in Southwest China (Ye [
18] and Yu [
26]), a rainstorm or flood disaster occurs when the daily rainfall is greater than or equal to 50 mm or the cumulative rainfall is equal to or greater than 80 mm for three consecutive days in Sichuan and Chongqing. Guizhou and Yunnan are located on the Yunnan–Guizhou plateau. For the entire southwest region, a rainstorm or flood is defined as daily rainfall greater than or equal to 50 mm or cumulative rainfall greater than or equal to 100 mm for three consecutive days. Using the above criteria, we plotted the cumulative rainstorm and flood values from May to October of 1961–2021 for Southwest China. It is shown that most rainstorms and floods occur in the summer (June to August) (
Figure 1b), and July has the most rainstorms and floods.
First, we used the Mann–Kendall method [
27] and moving
t-test [
27] to discuss the time mutation points of rainstorms and floods, and we discussed its periodic variation using wavelet analysis [
27]. Then, we used EOF (analysis of eigenvectors and time coefficients) [
27] to discuss the spatial distribution. Lastly, we calculated the correlation coefficients between rainstorms and floods and atmospheric circulation to discuss the dynamic mechanisms of rainstorms and floods.
2.1. Mann–Kendall Method
The Mann–Kendall method [
27] is a non-parametric statistical test method that can detect not only the trend change of a sequence but also the turning points in the sequence. For a time series x
1, x
2, …, x
n, S
k represents the cumulative count of the sample x
i greater than x
j (1≤ j≤ i). Under the assumption of independence of random time series, we define UF
k as follows:
Here, UF
1 = 0, and E(S
k), var(S
k) are the mean and variance of the cumulative counts; they are calculated as follows:
Given the significance level α, Uα is a normal distribution. If |UFi|> Uα, it indicates that there is an obvious trend change in the sequence. In the reverse order of time series x, xn, xn−1, …, x1, we repeat the above process while ensuring that UBk = -UFk (k = n, n − 1,…, 1), UB1= 0. We draw a graph of UBk and UFk. If the two curves intersect, and the intersection is between the critical boundary, then the time corresponding to the intersection is the time at which the mutation begins.
2.2. Moving T-Test
The moving
t-test [
27] aims to test whether the mean values of two segments in a climate sequence are significantly different. If the mean difference between the two sequences exceeds a certain significance level, it can be considered that the mean has undergone qualitative change and a trend change has occurred.
For a time series x with n samples, a certain point is artificially set as the reference point, and the samples of the two sub-sequences before and after the reference point are n
1 and n
2, the mean value of the two sub-sequences is x
1 and x
2, and the variance is s
1 and s
2, respectively. We define the statistics as follows:
The expression follows the t distribution of freedom v = n1 + n1 − 2.
3. Spatial–Temporal Variation
3.1. Temporal Variation
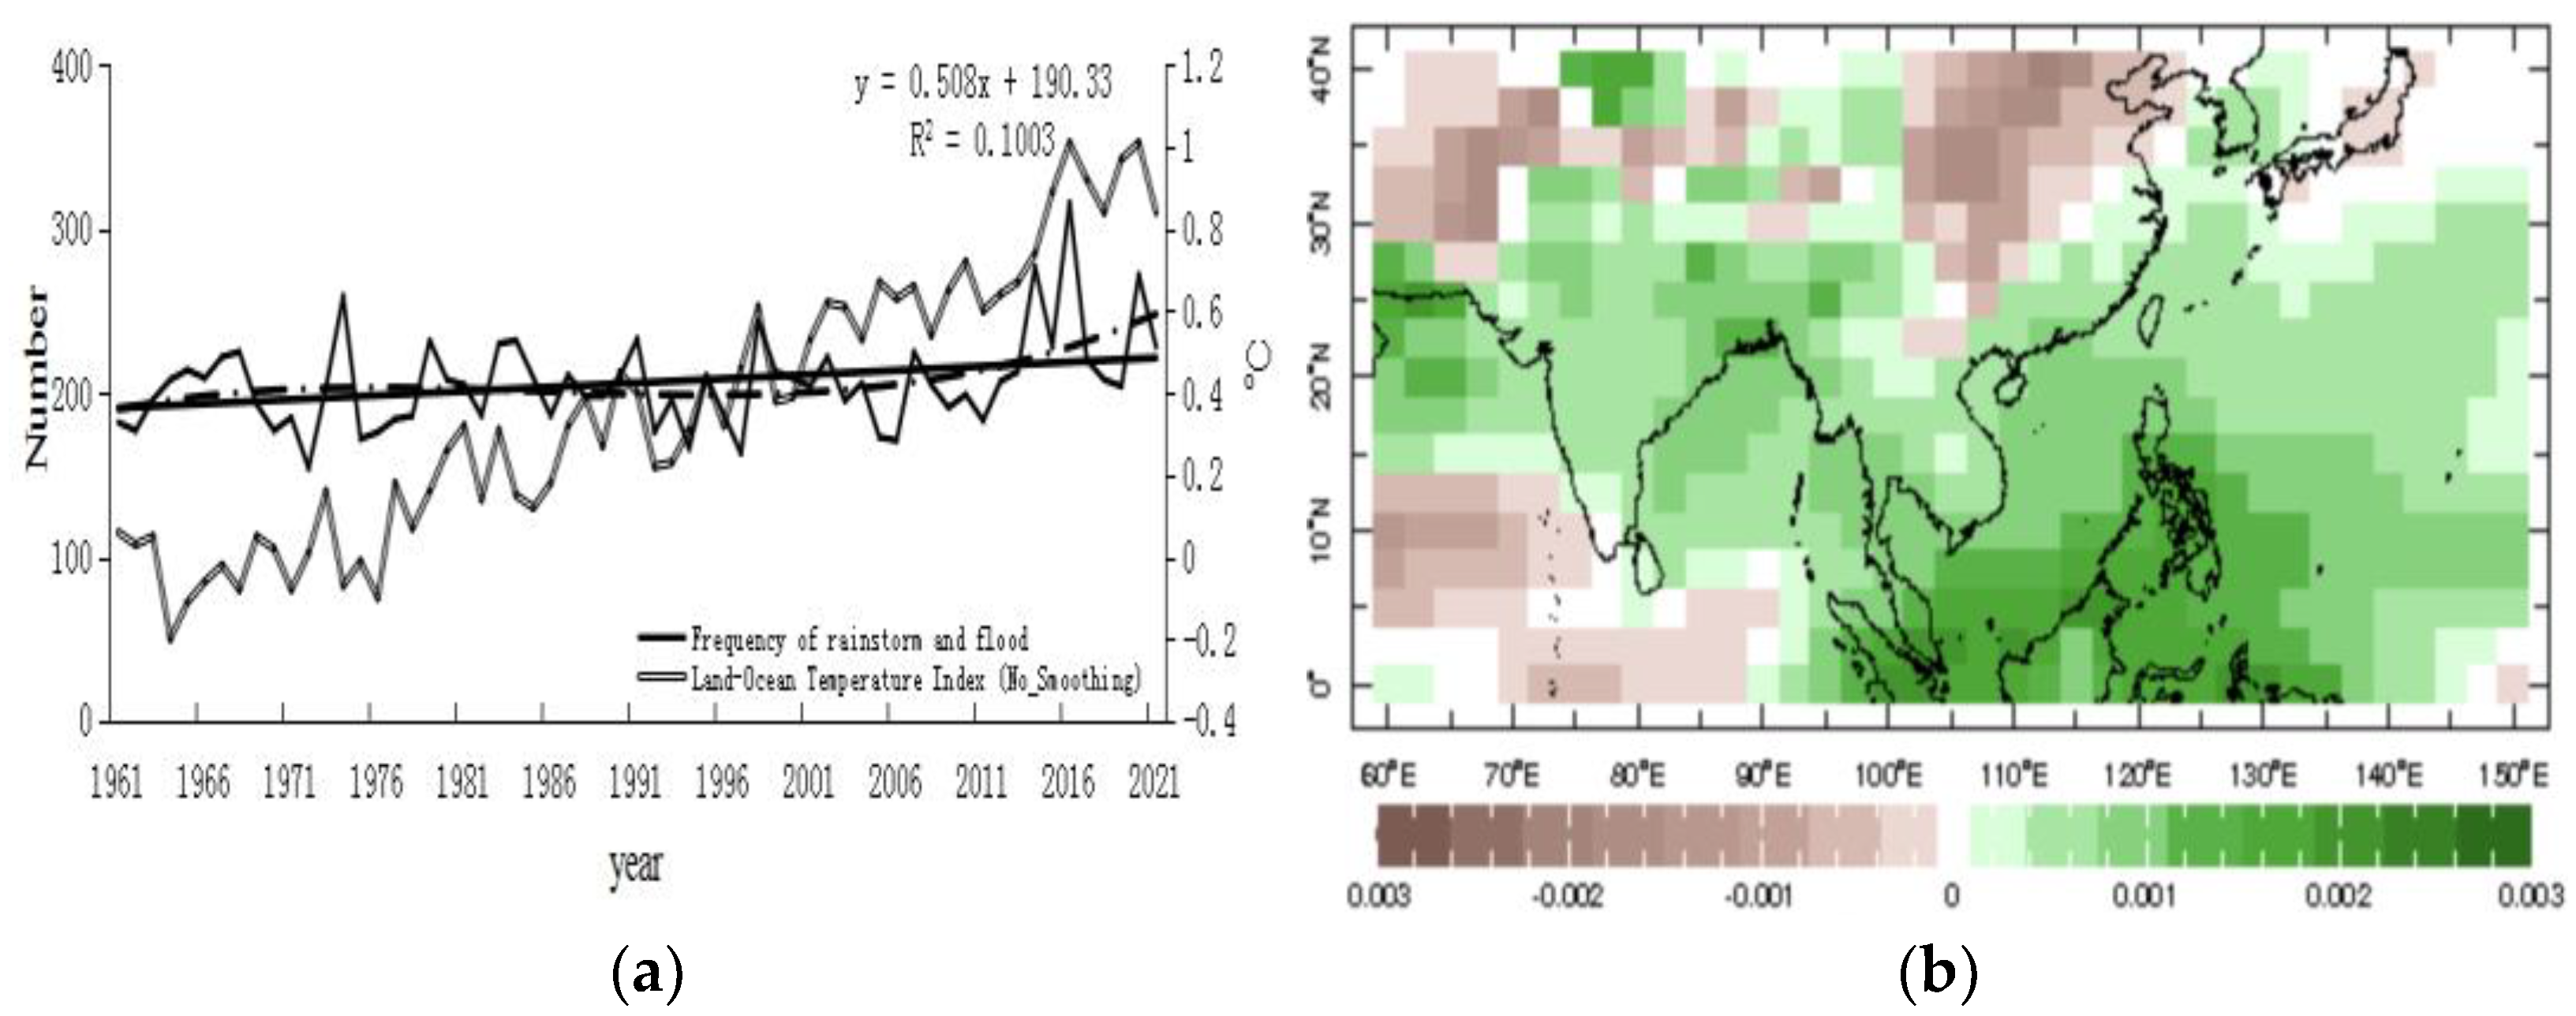
Time series analysis (
Figure 2a) shows that in the past 61 years, there has been a significant upward trend in the number of rainstorms and floods, with a trend coefficient of approximately 0.5. The year with the highest frequency (rainstorms and floods per year) is 2016, followed by 2014 and 2020. The year with the lowest frequency is 1972. The polynomially fitted curves indicate that rainstorms and floods slightly increased from the 1960s to the 1980s, decreased in the 1990s, and then rapidly increased in the early 2000s.
A linear correlation is found between the global Land−Ocean Temperature Index (No_Smoothing,
https://climate.nasa.gov/vital-signs/global-temperature/, accessed on 10 March 2022) and the number of rainstorms and floods in Southwest China, which is shown in
Figure 2a. The Global Land–Ocean Temperature Index shows the change in global surface temperature compared to the long-term average from 1951 to 1980. The year 2020 ties with 2016 as the hottest year on record since recordkeeping began in 1880 (source: NASA/GISS). NASA’s analyses generally match independent analyses prepared by the Climatic Research Unit and the National Oceanic and Atmospheric Administration (NOAA). During the same time period, there were a large number of rainstorms and floods in Southwest China. In addition, the linear correlation coefficient of these two data sets is 0.38, passing the 99% significance level. These results show a tight link between global warming and the increase in rainstorms and floods in Southwest China.
Using NCEP/NCAR reanalysis, we calculated the linear trend of specific humidity at 850 hPa for the summer half-year (May–October) from 1961 to 2021 (
Figure 2b). The local water vapor in the eastern part of Southwest China has shown a slight downward trend, but the water vapor values in the upstream, the Bay of Bengal, the South China Sea, and the Western Pacific have increased significantly. Increased water vapor is continuously transported to Southwest China through water vapor channels, which is conducive to the formation of rainstorms. This is clearly a case of atmospheric warming due to ocean areas holding more water vapor, which is a result of global warming.
Table 1 shows the interdecadal anomaly of rainstorms and floods for the summer half-year of 1961 to 2021. The interdecadal anomaly is positive in the 1980s and 2010s and negative in the 1960s, 1970s, and 1990s to the early 2000s. The highest anomaly value is 20.9, obtained in the 2010s, indicating that the storm and flood frequency has increased significantly in the last 10 years. The lowest anomaly value is −11.8, obtained in the 1970s. This is consistent with the time series polynomial fitting analysis (
Figure 2a).
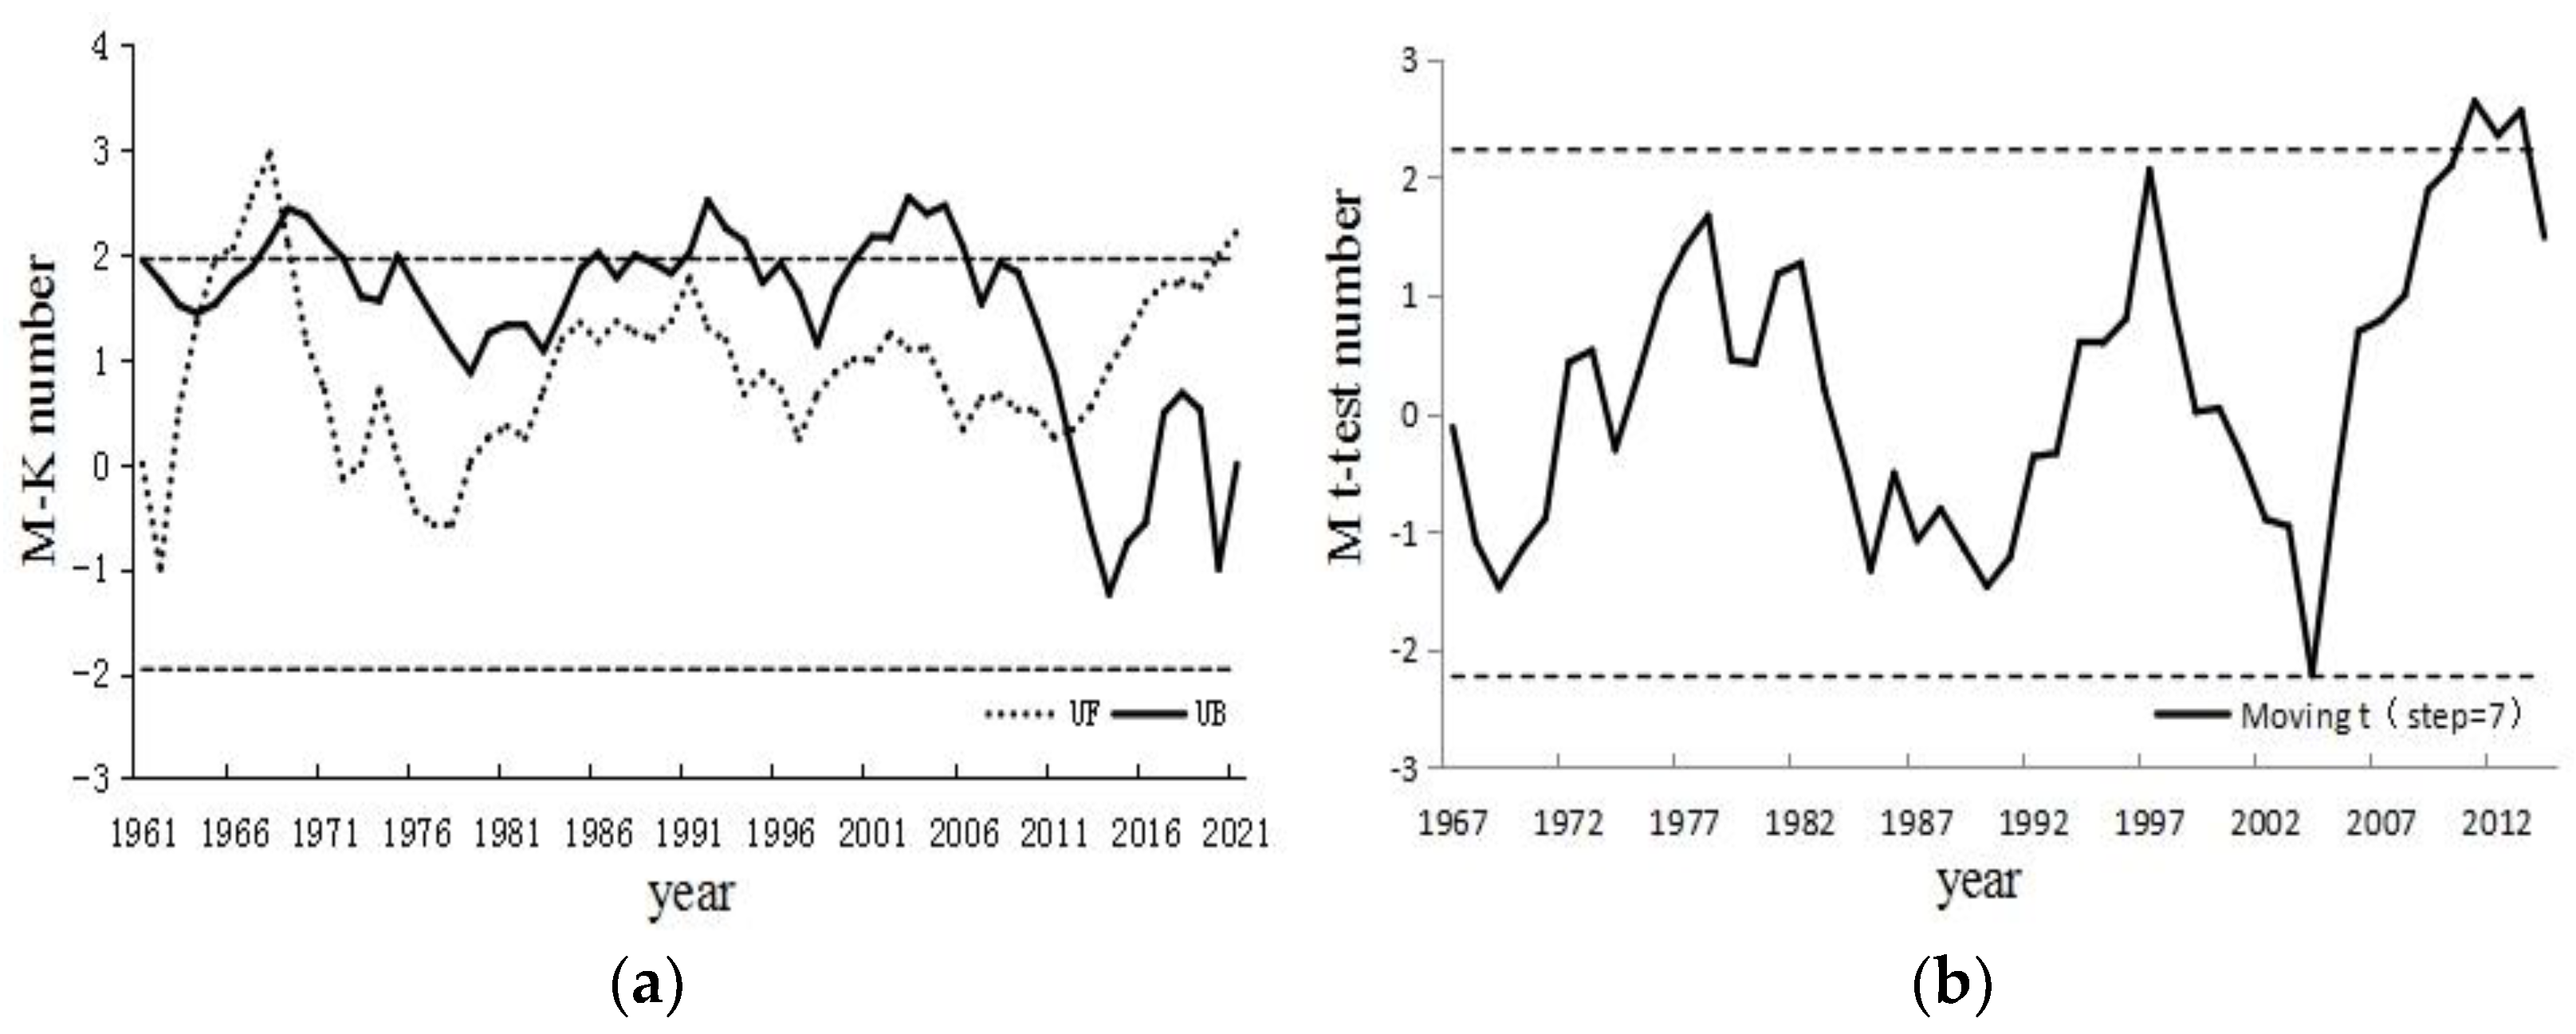
Figure 3a shows the results of the Mann−Kendall [
27] analyses. There are three intersections among the positive and negative series curves in the years 1965 and 2012, indicating that these three years might be the climate change point. To verify the correctness, the moving
t-test [
27] (
Figure 3b) was used. The moving
t-test exceeds the significance interval of 95% reliability only from 2010 to 2014. As a result, the year 2012 was the climate mutation point for rainstorms and floods, changing from low to high frequency in Southwest China.
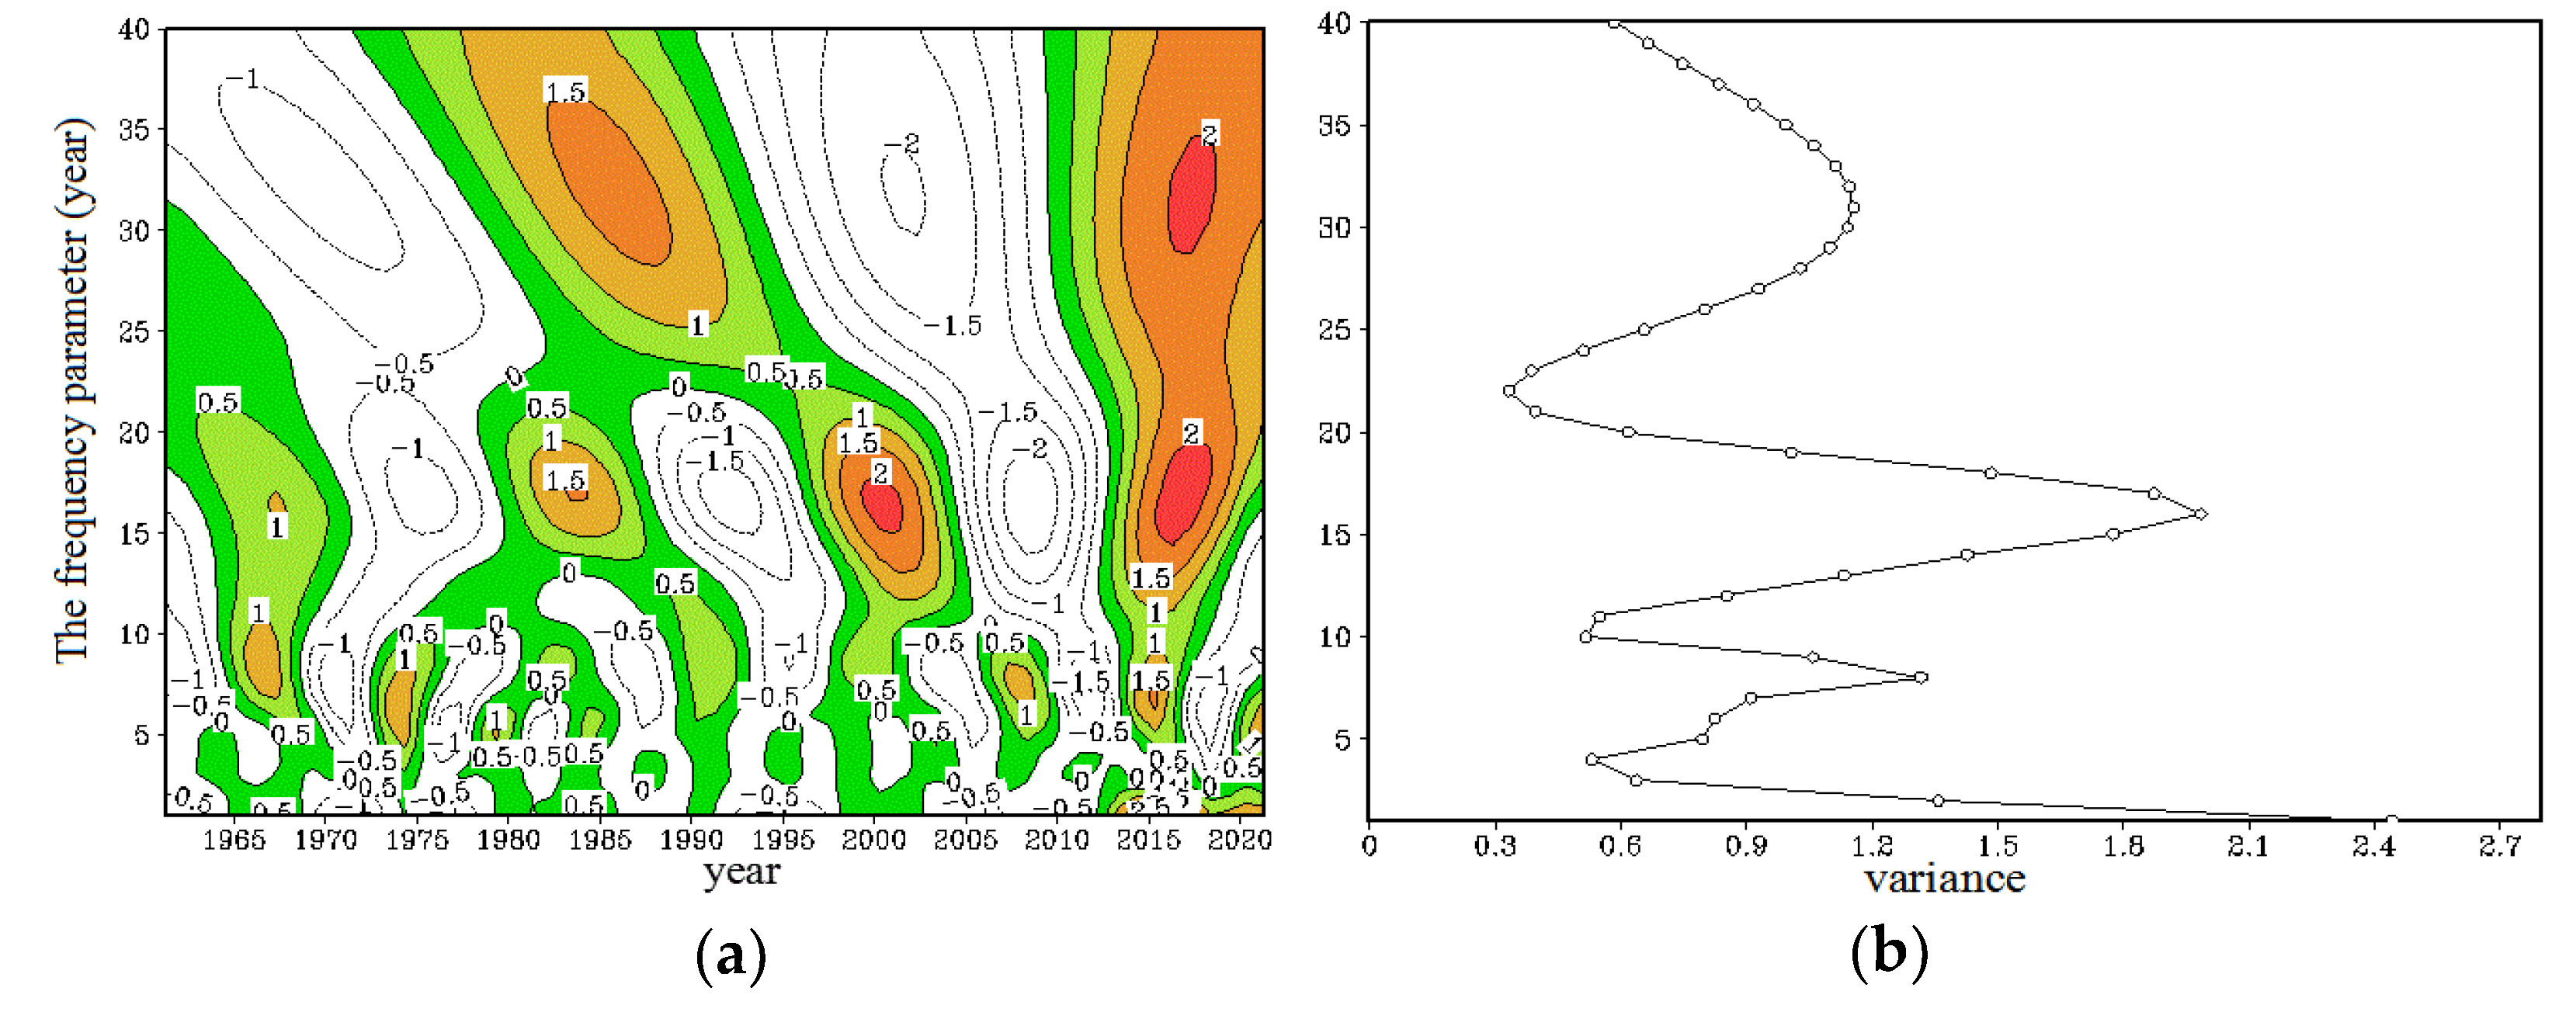
To check if there were any periodic characteristics in the occurrence of rainstorms and floods in Southwest China, we applied wavelet analysis [
27] to the observations.
Figure 4a shows that there was an interannual cycle of 5–10 years and interdecadal cycles of 15–20 years and 30–35 years in rainstorms and floods. For example, the interannual 5–10-year cycle shows there were downward trends before 1980, a gradually increasing trend from 1980 to early 1985, and a downward trend again from 1985 until around 1990. From the wavelet variance diagram (
Figure 4b), we can see that there exist three dominant time scales with period ranges of around 8 years, 16 years, and 31 years in quasi-periodic oscillations.
3.2. Spatial Variation
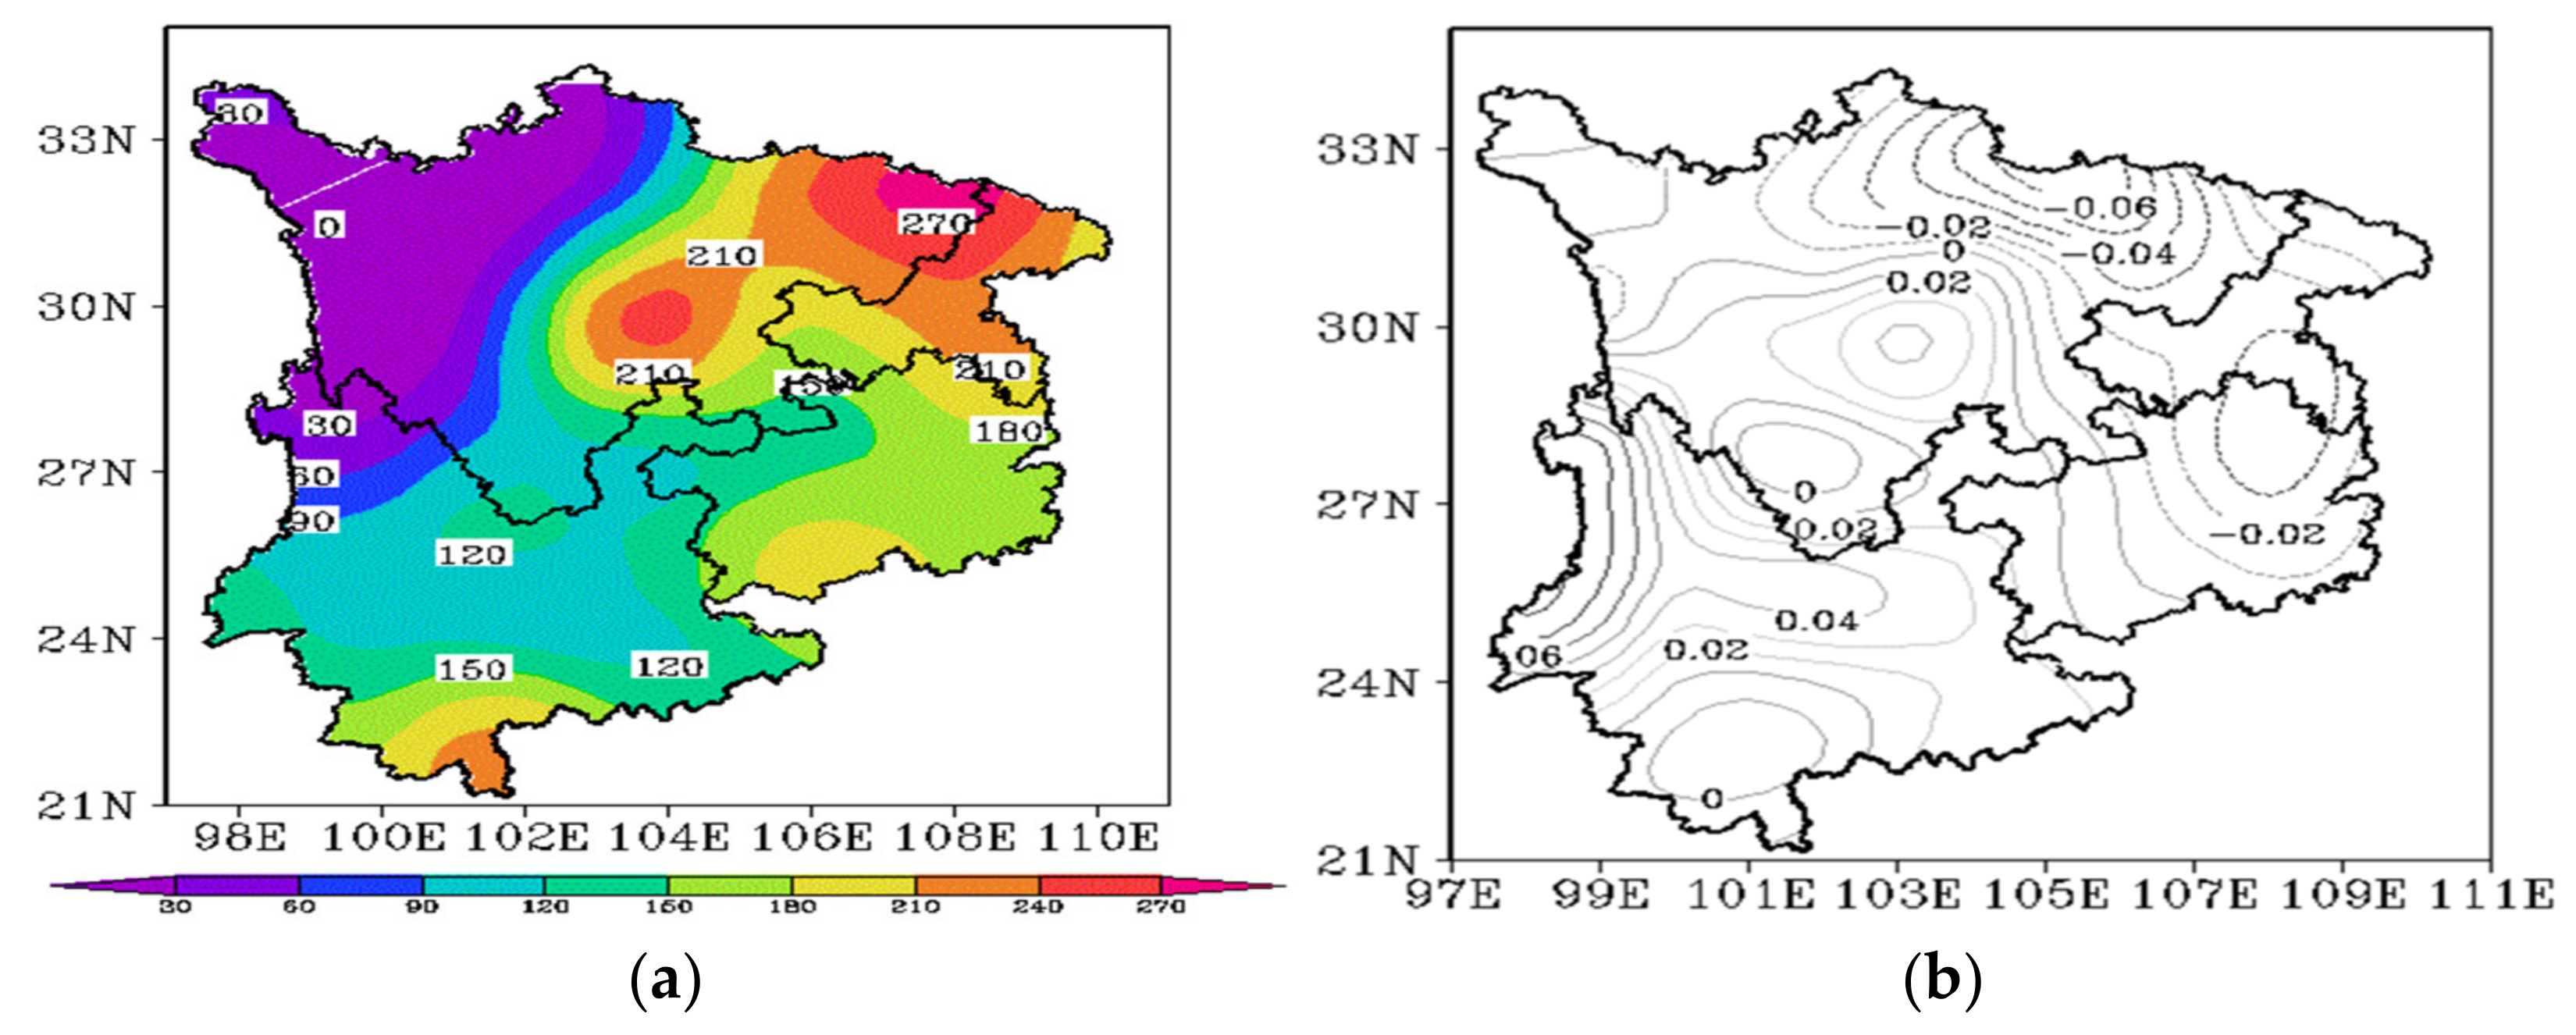
In the past 61 years, the high-incidence areas of rainstorms and floods have been mainly in the east of the Sichuan Basin, to the north of Guizhou, southwest of Guizhou, and the southern edge of Yunnan, while the low-incidence areas were in the northwest region of Southwest China (
Figure 5a).
In the EOF decomposition of the 61-year monthly cumulative rainstorm and flood time series of 90 stations, the variance contribution of the first four modes is 80.9%, with the first mode representing 68.7%. Hence, the first mode is sufficient to describe the main distribution characteristics, and its correlation analysis was performed (
Figure 5b). The spatial distribution map shows a few high-value centers in the eastern and southern parts of the Sichuan Basin and Northern Yunnan, indicating that the inter-annual variation in these areas is larger than in other areas. The time series (figure omitted) shows an obvious upward trend, except for the 1990s, which is basically consistent with the time analysis above.
4. Correlation between Flood and Atmospheric Circulation
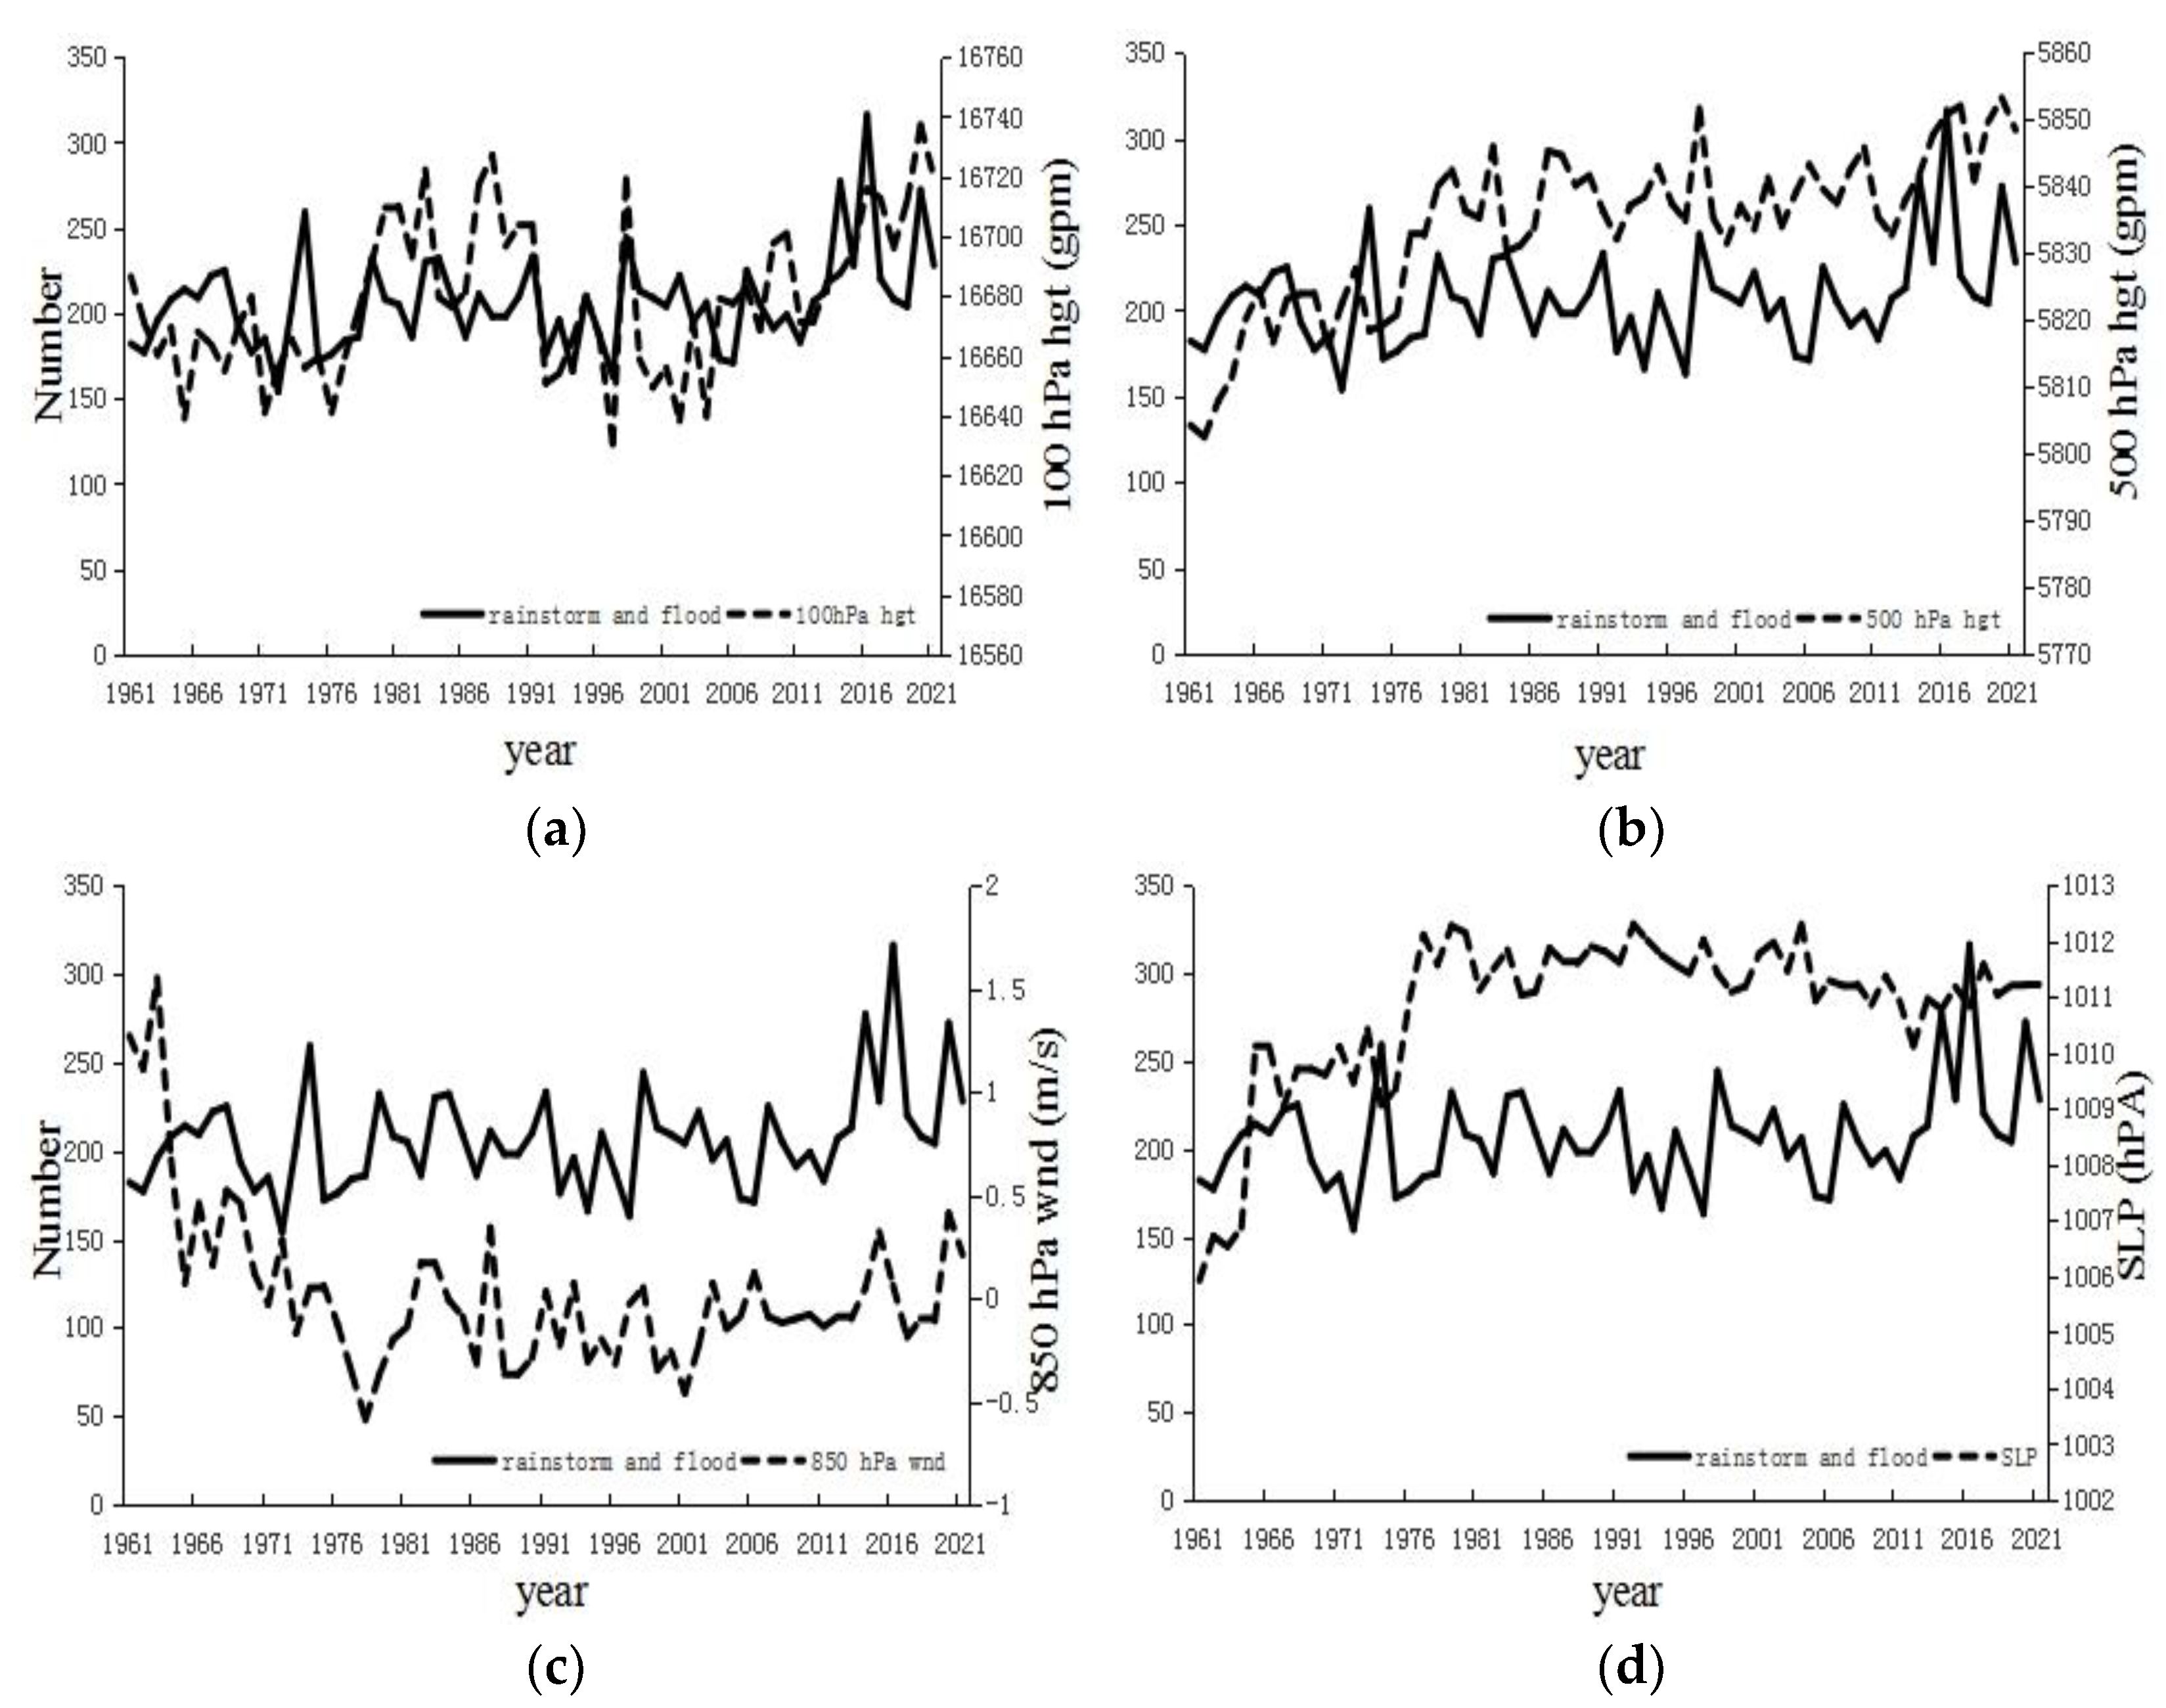
Using averages over the Southwest China region (97.5–110.2° E, 21.2–34.2° N), we analyzed the correlations between the southwest rainstorms and floods, and the NCEP 850 hPa wind speed, 500 hPa and 100 hPa height, and the sea level pressure. Then, the years with high (low) rainstorm and flood values are defined as the years in which the anomaly of rainstorms and floods in Southwest China is larger (smaller) than two times the average number. The years with high rainstorm and flood values are 1967, 1968, 1974, 1979, 1983, 1984, 1991, 1998, 2002, 2007, 2014, 2015, 2016, 2017, 2020, and 2021; the years with low rainstorm and flood values are 1962, 1970, 1972, 1975, 1976, 1992, 1994, 1997, 2005, and 2006. The high/low rainstorm and flood years correspond well with the years with high/low values for 850 hPa wind, 500 hPa and 100 hPa height, and sea level pressure.
Rainstorms and floods have a strong correlation with the 100 hPa (
Figure 6a) and 500 hPa height (
Figure 6b). The correlation coefficients are 0.43 and 0.36, respectively, passing the significance levels of 99% and 95%. The correlation coefficient of rainstorms and floods with the 850 hPa wind speed (
Figure 6c) and sea level pressure field (
Figure 6d) is below the 90% confidence level. However, they still have a positive relationship.
4.1. Sea Level Pressure
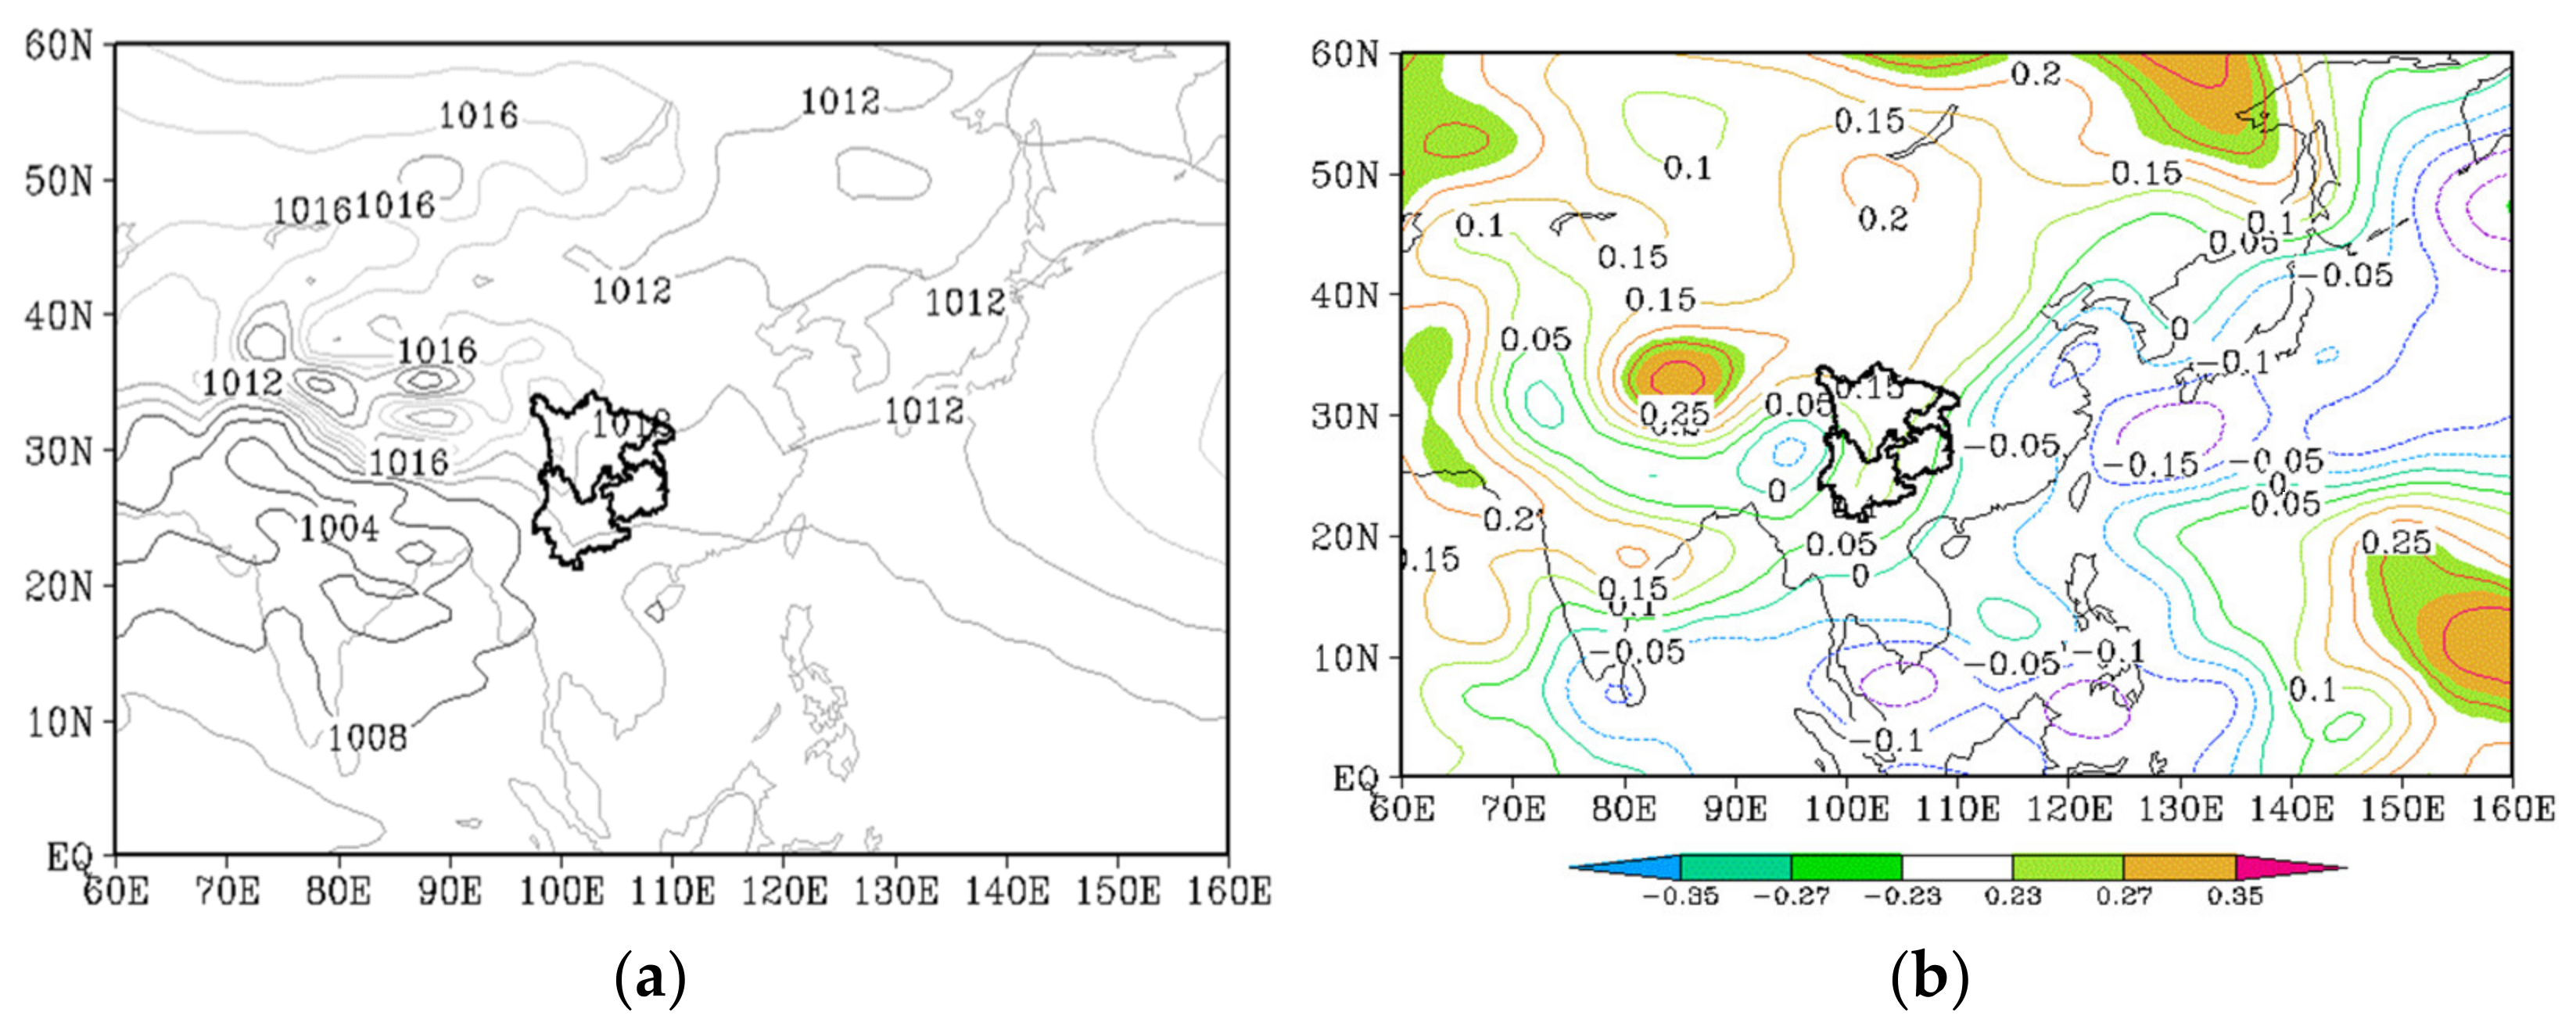
In those years with a high frequency of rainstorms and floods (
Figure 7a), the southwest region and most of the middle and east of China were mainly affected by a uniformed pressure field, and the area from the South China Sea to the Iranian Plateau was affected by low pressure, with the center value of 1004 hPa. From Balkhash Lake to most of the northwest of China, it was mainly controlled by high pressures. Two centers (1018 hPa and 1019 hPa) were located, respectively, in Balkhash Lake–Northwest Xinjiang and South Xinjiang–West Tibet. Additionally, the cold air moved eastward from the plateau to the southwest of China through a northwesterly path and converged with the warm and wet air, which was conducive to the formation of rainstorms and floods. In low rainstorm and flood years, the high pressure over the Qinghai–Tibet Plateau was that in high rainstorm and flood years, and the central value was only 1006 hPa, so the influence of the cold air in the southwest was weaker.
Based on the distribution of correlation coefficients between rainstorms and floods and the sea level pressure field (
Figure 7b), there is a positive correlation distribution in most areas of China. By contrast, it is negative in most areas of Japan, the Philippines, and the Bay of Bengal.
The difference in sea level pressure field in high- and low-value years (figure omitted) and the distribution of correlation coefficients are consistent, indicating that when the southwest region has more rainstorms and flood disasters in the summer half-year, the pressure field at sea level is higher, and vice versa.
4.2. 850 hPa Wind Field
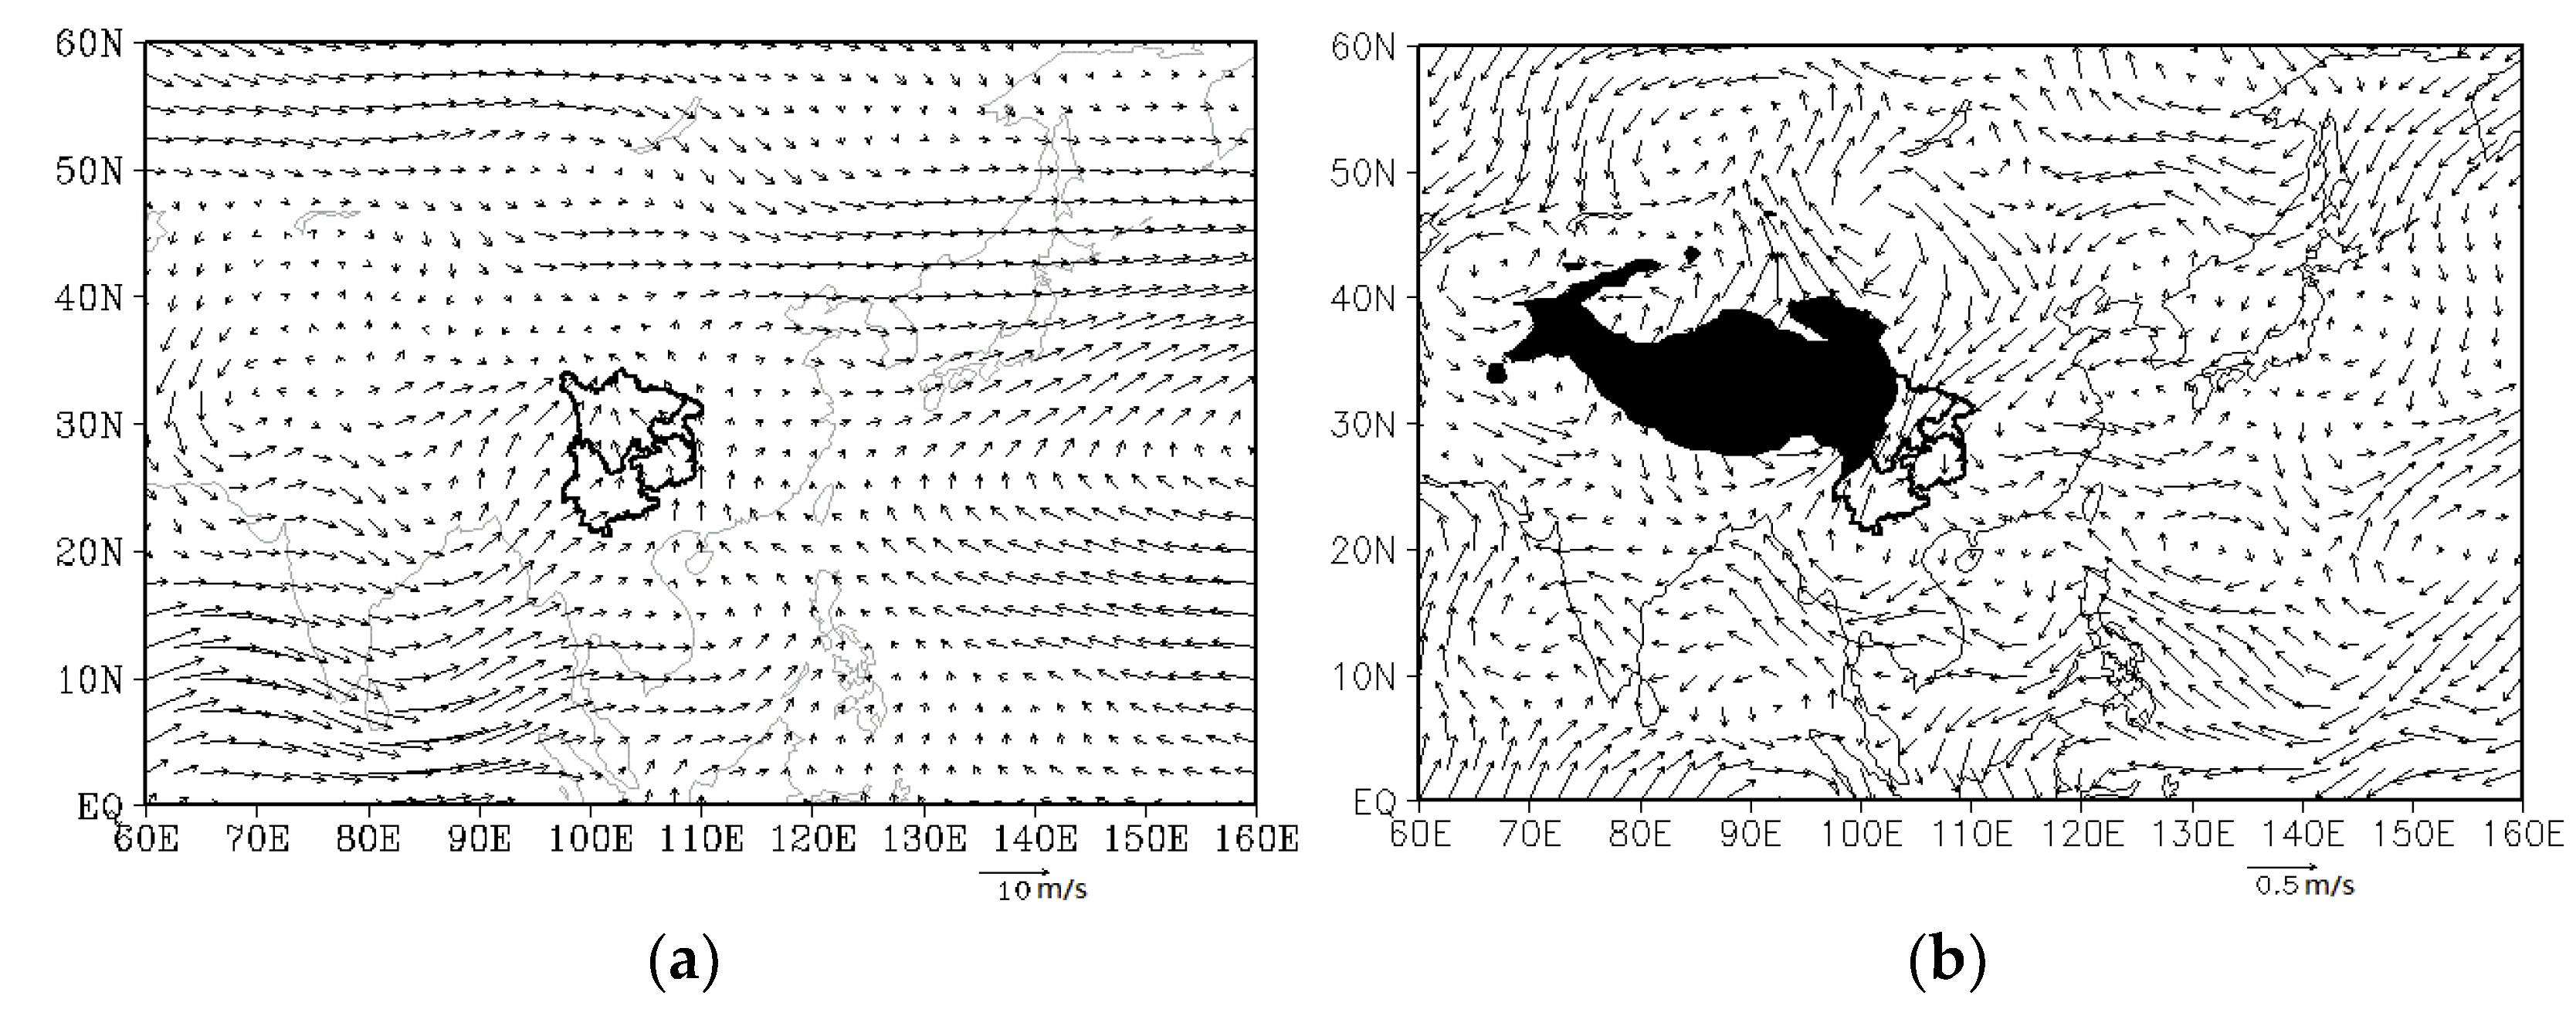
The weather systems in the lower atmosphere, carrying abundant water vapor, provide sufficient power and water vapor for precipitation.
Figure 2b shows the change in water vapor. In years with a high number of rainstorms and flood events, the southerly airflow in Southwest China was the strongest in the country (
Figure 8a). There are three main sources of water vapor. One bypasses the southern side of the Tibetan plateau. It flows through the Bay of Bengal and then moves northward in a southwesterly path, mainly affecting the central and western parts of Southwest China. One crosses the Indochina Peninsula and then moves northward, mainly affecting the central and eastern parts of Southwest China. The last one is the convergence of warm and humid air currents from the Pacific Ocean and Indochina Peninsula through the South China Sea, which mainly affects the central and eastern parts of Southwest China. At high latitudes, there is a general flat westerly airflow, with weak cold air coming down from Northern Xinjiang. The airflow meets the strong, warm, and humid airflow in Southwest China, which is conducive to precipitation. In years with a low number of rainstorms and floods, the southerly airflow affecting the southwest region is weaker than that in high-value years, especially regarding the southwesterly airflow from the Bay of Bengal, so the water vapor and energy brought by it are relatively weak.
From the correlation coefficients of rainstorms and floods and the 850 hPa wind speed (
Figure 8b), the northwesterly air flowing southward from Eastern Mongolia and part of the easterly airflow in the front of the anticyclonic south of Lake Baikal converged in the central part of Inner Mongolia; then, the combined airflow moved southward to North China and the Hetao region. In the left branch, the northeast airflow crossed the Qinling Mountains and arrived at the Sichuan Basin and Chongqing, where it merged with the northward warm and humid airflow from the South China Sea, the Bay of Bengal, and the south side of the plateau. This was conducive to precipitation. In the middle path, the weak northward air flowed directly southward from the middle reaches of the Yangtze River to South China, which is related to the fact that the rainstorms and floods in Guizhou are weaker than those in Eastern Sichuan and Chongqing. The right branch enters the sea after passing through the East China region with the northwest airflow. We can see that the stronger the northerly airflow over the Qinling Mountains, the more the precipitation. The difference in the 850 hPa wind field in the years with a high and low number of rainstorms and floods (Figure omitted) and the distribution of correlation coefficients are consistent.
4.3. 500 hPa Height Field
In the years with a high rainstorm and flood frequency (
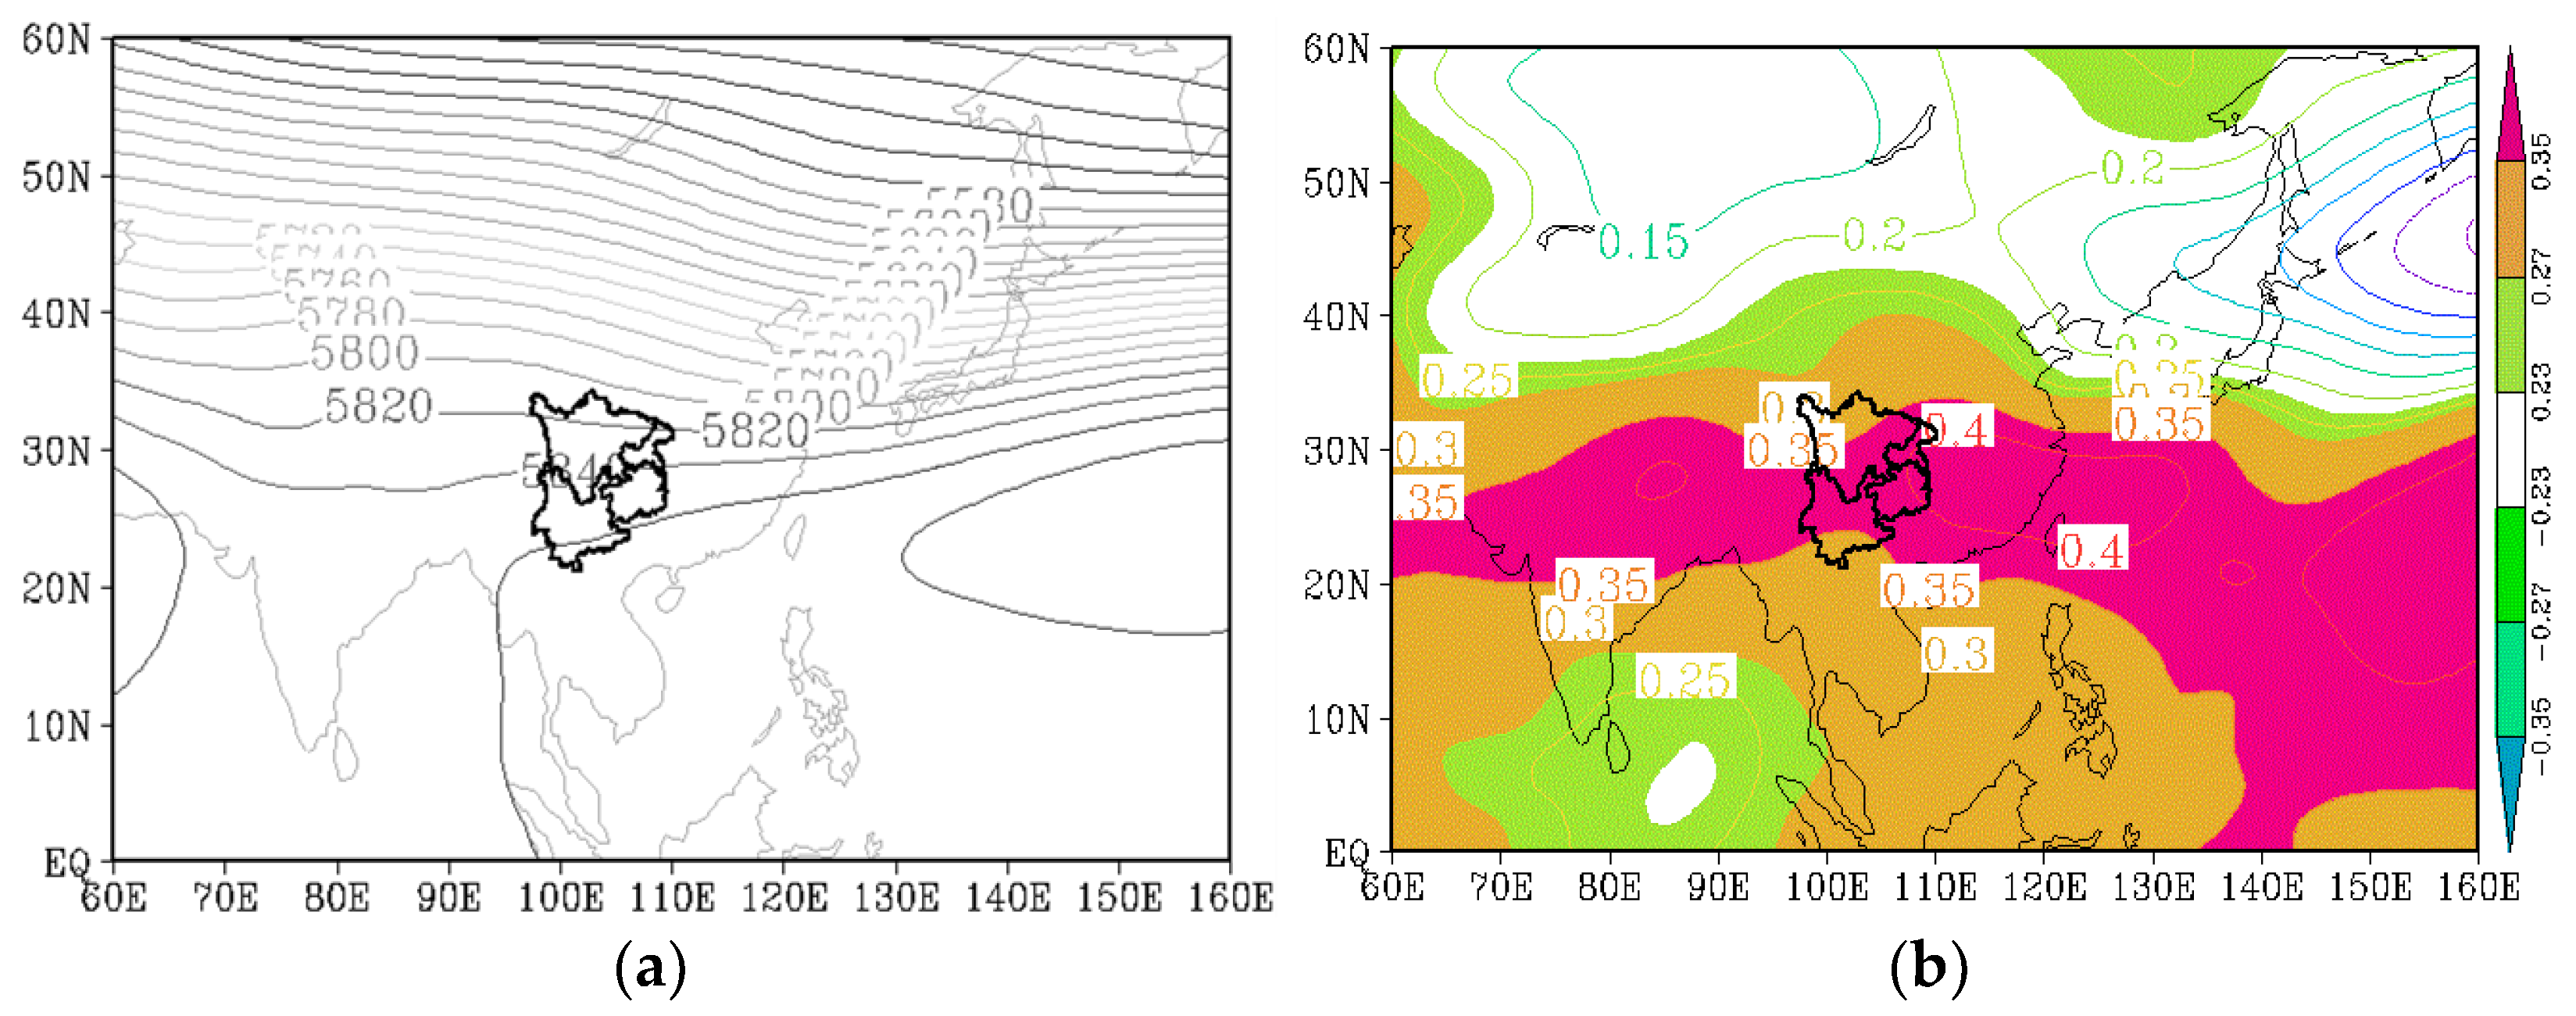
Figure 9a), the westerly trough is located near the eastern coast of Russia to the east coast of China at a 500 hPa height. The southwest region is mainly affected by the westerly airflow in front of the plateau trough near 80° E, ranging from 584 to 586 dagpm, and the western extending point of the Western Pacific subtropical high at 586 dagpm is located near 20° N and 95° E. In addition, the ridge is located on the southern edge of the southwest region, so it is beneficial to the transport of warm and humid air from the southwest for precipitation. In low-value years, the Western Pacific subtropical high is weaker, and its 586 dagpm is located at the South China sea, with a smaller range. Therefore, the southwesterly airflow on the northwest side is weaker than that in high-value years, and thus the rainfall is weaker.
From the correlation coefficients between rainstorms and floods and the 500 hPa height field (
Figure 9b), all of them are positively correlated in China, with a center in the eastern southwest region. The difference in the 500 hPa height field in high- and low-value years (Figure omitted) is consistent with the correlation coefficient distribution, indicating that when the rainstorms and floods are strong, the potential height of 500 hPa significantly increases in most areas of the country, and vice versa.
4.4. 100 hPa Height Field
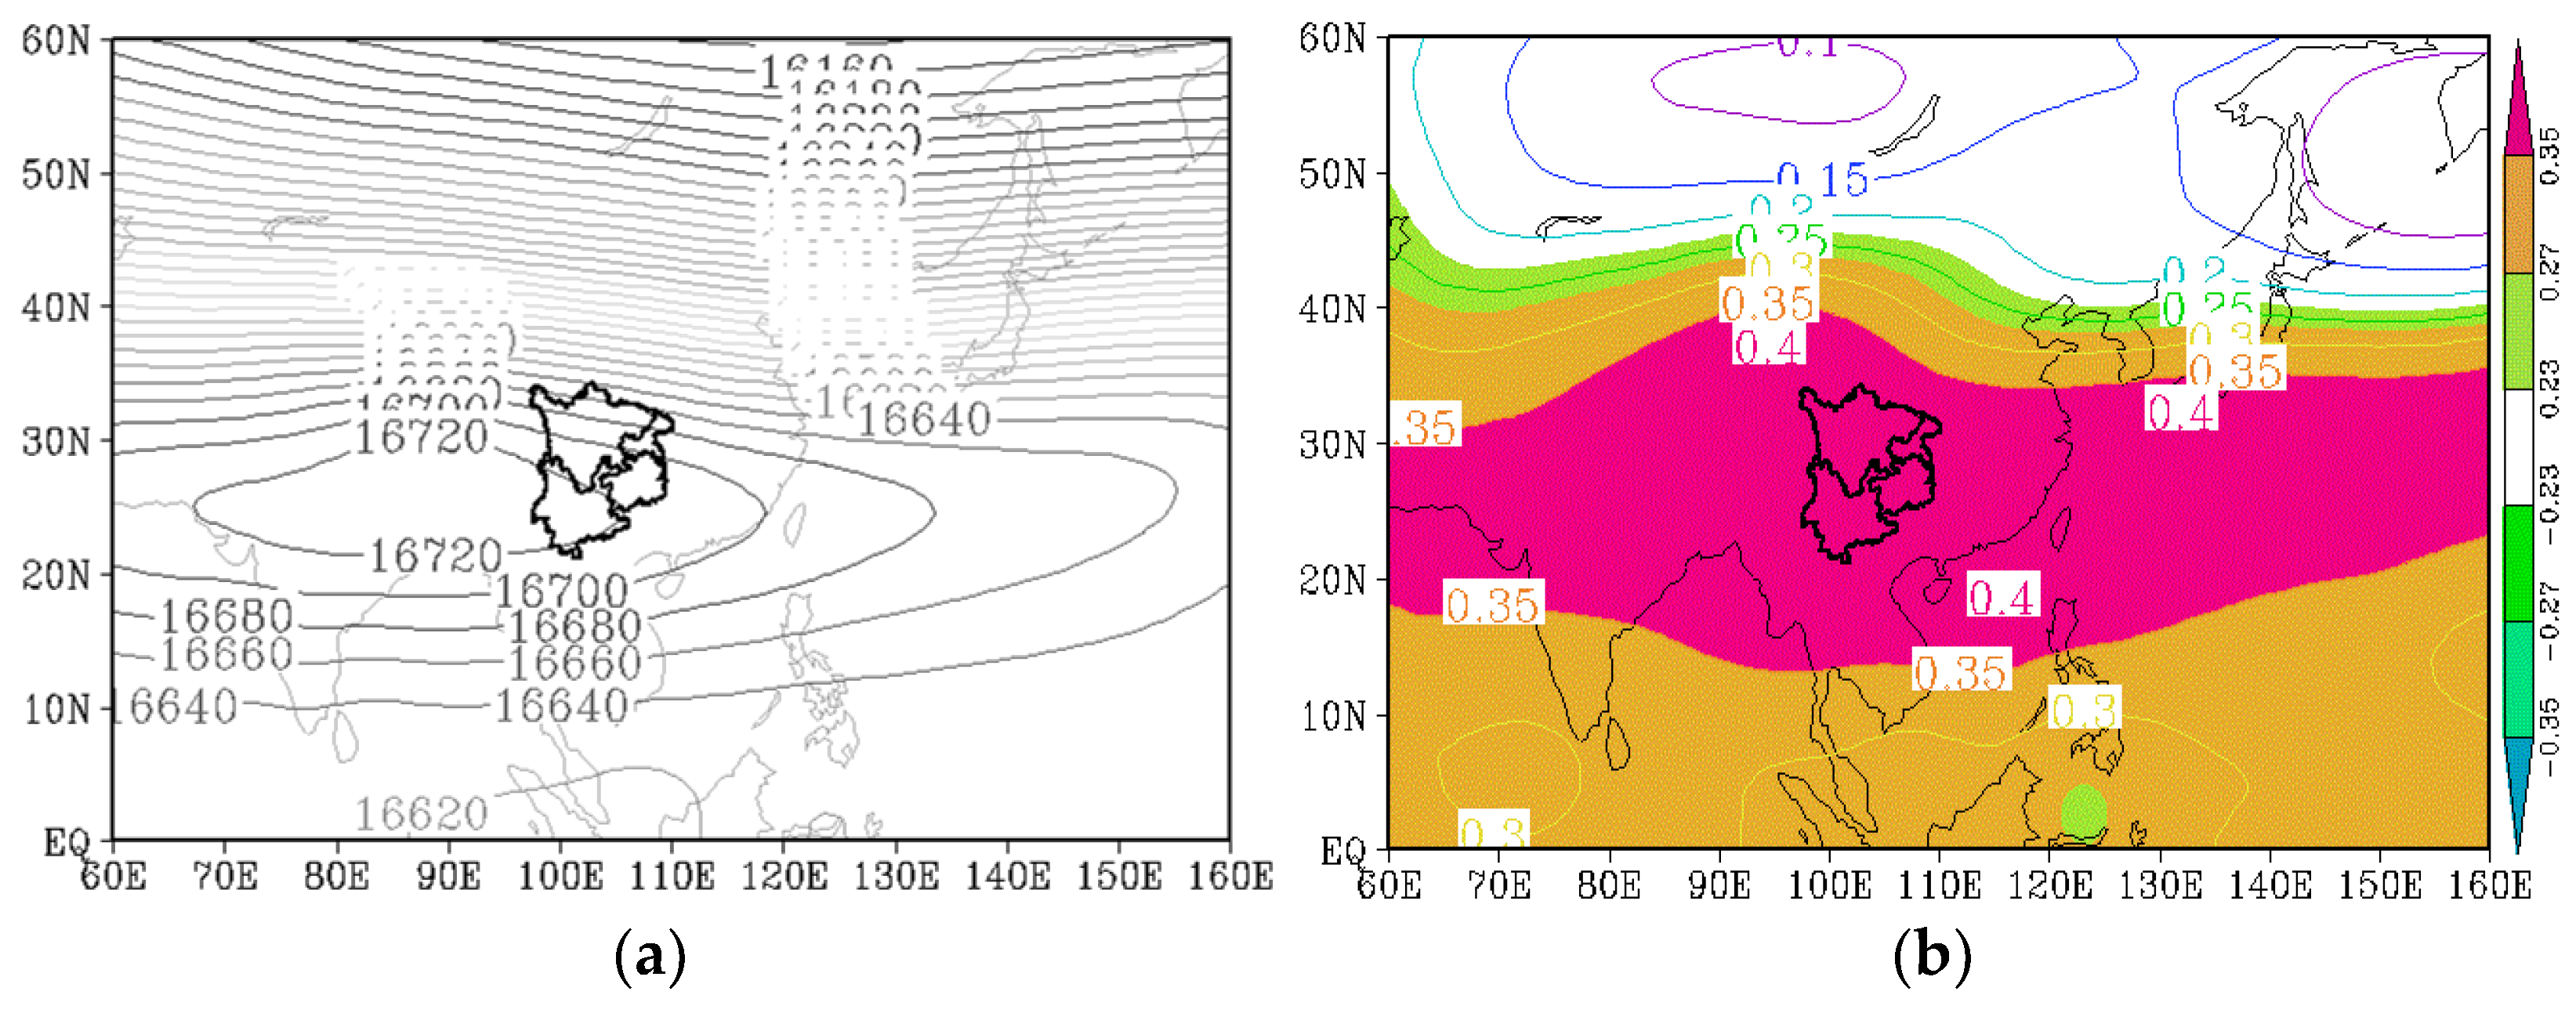
In the years with high rainstorm and flood frequency (
Figure 10a), the South Asian high center in the upper troposphere is located around 25° N and 85° E, and its main body is slightly to the left of the western type. The subtropical long-wave trough is located in the northeastern region to the East China coast, and the southwestern region is located in the right part of the South Asian high center, with a potential height of 16,660–16,720 gpm. Combined with the east–south 588 line of 500 hPa, the rain belt is mostly in the Yangtze River basin, so the southwestern area is most affected by it. In low-value years, the central value of the southern pressure is lower (16,680 gpm), and the range is smaller. The southwestern region is not surrounded by its central line at 16,680 gpm, so the influence is weaker.
A positive correlation distribution was found in China from the correlation coefficient between rainstorms and floods and the 100 hPa height field (
Figure 10b). The majority of areas between 10° N and 40° N were the centers of the positive correlation, and the southwestern area was still in the center of the positive correlation and passed the 90% reliability test. The difference in the 100 hPa height field in high- and low-value years (figure omitted) is consistent with the correlation coefficient distribution, which indicates that when the potential height field increases to 100 hPa, the South Asian high is strong, and the strong center is located in the east of the plateau, where the rainstorms and floods are more frequent, and vice versa.
5. Conclusions
This paper discussed the temporal and spatial variation in rainstorms and floods in Southwest China and its relationship with atmospheric circulation. The main results are as follows:
- (1)
Rainstorms and floods in Southwest China mainly occur from June to August, among which July has the highest number of rainstorms and floods, followed by August. In addition, May and September also have considerable numbers of rainstorms and floods;
- (2)
In the past 61 years, the number of heavy rain events and floods has shown an overall upward trend, and the interdecadal anomaly between the 1980s and the 2010s is positive, especially in the 2010s. The correlation coefficient between rainstorms and floods and the global surface temperature passes the 95% significance level. The year 2012 is the climate mutation point for rainstorms and floods, in which they change from low to high values. There are 5–10 years in the interannual cycle and 16 years and 31 years in the interdecadal cycle;
- (3)
The high-incidence area of rainstorms and floods in Southwest China is mainly from the east of the Sichuan Basin to the north of Guizhou, southwest of Guizhou and the southern edge of Yunnan. The low-value areas are mainly in the northwest part of the southwest region;
- (4)
The rich water vapor conditions are as follows: the combination of the western type of the South Asian high and the Western Pacific subtropical high; the influence of the southwesterly airflow in front of the upper trough; the transport of the warm and humid air in the middle; the lower layers; and the confluence of the cold air from the northwesterly path. Therefore, the atmospheric circulation configuration is conducive to precipitation, which can likely cause rainstorms and floods.
Author Contributions
Conceptualization, Q.X.; methodology, Q.X.; software, Q.X.; validation, Q.X.; formal analysis, Q.X.; investigation, Q.X.; resources, X.G.; data curation, G.L.; writing—original draft preparation, Q.X.; writing—review and editing, X.G.; visualization, Z.L.; supervision, Z.L.; project administration, T.T.; funding acquisition, X.G. All authors have read and agreed to the published version of the manuscript.
Funding
This work was funded by the National Key Research and Development Program of China (2018YFC1507201), Research Team of Key Technologies of Guizhou Meteorological Bureau (GGTD-202212), and National Natural Science Foundation of China “Research on Multi-model Temperature Forecast and Correction Technology in Guizhou under Complex Terrain” (42265001, Guizhou Meteorological Bureau Program (11 September 2021)).
Institutional Review Board Statement
Not applicable.
Informed Consent Statement
Not applicable.
Data Availability Statement
NCEP/NCAR reanalysis I data provided by the NOAA PSL, Boulder, CO, USA, from their website at
https://psl.noaa.gov (accessed on 10 March 2022). The global Land−Ocean Temperature Index provided by the NASA, CO, USA, from their website at
https://climate.nasa.gov/vital-signs/global-temperature (accessed on 10 March 2022) The daily precipitation data provided by the National Data Center for Meteorological Sciences of China, from their website at
http://data.cma.cn/ (accessed on 10 March 2022).
Conflicts of Interest
The authors declare no conflict of interest.
References
- Li, N.; Reng, Y.; Gu, W.; Cheng, Y. GIS based risk evaluation for flood hazard in Shandong Province. J. Chin. Agric. Sci. Bull. 2010, 26, 313–317. [Google Scholar]
- Feng, Q.; Tao, S.; Wang, A.; Li, J.; Xu, L. Analysis of the influence of heavy-rain and flood disaster on social economy and human life. J. Catastrophol. 2001, 16, 44–48. [Google Scholar]
- Feng, S.; Luo, D. Division of flood-waterlogging hazard in Southwest China. J. Mt. Res. 1995, 13, 255–260. [Google Scholar]
- Yu, X.; Ma, Y. Spatial and Temporal Analysis of Extreme Climate Events over Northeast China. Atmosphere 2022, 13, 1197. [Google Scholar] [CrossRef]
- Gu, J.; Cui, X.; Hong, H. A Statistical-Based Model for Typhoon Rain Hazard Assessment. Atmosphere 2022, 13, 1172. [Google Scholar] [CrossRef]
- Cheng, S.; Xie, J.; Ma, N.; Liang, S.; Guo, J.; Fu, N. Variations in Summer Precipitation According to Different Grades and Their Effects on Summer Drought/Flooding in Haihe River Basin. Atmosphere 2022, 13, 1246. [Google Scholar] [CrossRef]
- Di Giustino, G.; Bonora, A.; Federico, K.; Reho, M.; Lucertini, G. Spatial Analysis of the Vulnerability to Flooding in the Rural Context: The Case of the Emilia Romagna Region. Atmosphere 2022, 13, 1181. [Google Scholar] [CrossRef]
- Cheng, W.; Chen, J.; Liu, D. Review on flood risk assessment. J. Yangtze River Sci. Res. Inst. 2010, 9, 17–24. [Google Scholar]
- Li, C. A Statistical analysis of the storm flood disasters in China. J. Catastrophol. 1996, 11, 59–63. [Google Scholar]
- Wang, X.; Leng, C.; Feng, X.; Zhou, Y.; Ma, S. Risk analysis of flood disaster in the middle reaches of the Yangtze River. J. Sci. Technol. Rev. 2008, 26, 61–62. [Google Scholar]
- Werritty, A. Use of Multi-proxy Flood Records to Improve Estimates of Flood Risk: Lower River Tay, Scotland. J. Catena 2006, 66, 107–119. [Google Scholar] [CrossRef]
- Li, J.; Feng, Q.; Wang, A. Risk Assessment of Heavy Rain and Flood Disasters in China: Typhoon and Rainstorm Disaster Weather Monitoring, Forecasting Technology Research; China Meteorological Press: Beijing, China, 1996. [Google Scholar]
- Huang, C.; Liu, X.; Zhou, G.; Li, X. Agricultural natural disaster risk assessment method according to the historical disaster data. J. Nat. Disasters 1998, 7, 1–8. [Google Scholar]
- Wan, J.; Zhou, Y.; Wang, Y. Flood disaster and risk evaluation approach based on the GIS in Hubei Province. J. Torrential Rain Disasters 2007, 26, 328–333. [Google Scholar]
- Gong, Q.; Huang, G.; Guo, M. GIS-based risk zoning of flood hazard in Guangdong Province. J. Nat. Disasters 2009, 18, 58–63. [Google Scholar]
- Jiang, Q.; You, Z. GIS-Based Natural Hazard Regionalization in Nantong. J. Catastrophol. 2005, 20, 110–143. [Google Scholar]
- Tian, H.; Lu, W.; Wu, B. Integrated system for meteorological disaster monitoring and loss evaluation based on GIS. J. Sci. Meteorol. Sin. 2002, 22, 482–487. [Google Scholar]
- Ye, Z. A Study on the Flood Disaster of Chongqing. Master’s Thesis, Southwest China Normal University, Chongqing, China, 2001. [Google Scholar]
- Lu, R. Analysis of Climate Characteristic of Rainstorm in Guizhou Province. Master’s Thesis, Lanzhou University, Lanzhou, China, 2010. [Google Scholar]
- He, H.; Sun, J. The role of upper and lower tropospheric jet in Yunnan rainstorm occurrence and their common characteristics. J. Plateau Meteorol. 2004, 23, 29–34. [Google Scholar]
- Liu, Y.; Shegn, Y. Chuxiong “2013.8.29” heavy precipitation process analysis. J. Yunnan Univ. Nat. Sci. 2014, 36, 95–102. [Google Scholar]
- Chen, X.; Li, H.; He, Y.; Yang, K. An analysis on the characteristics of an extreme torrential rain in Huaping and Changning on 15–16 September 2015. J. Yunnan Univ. Nat. Sci. 2017, 39, 225–234. [Google Scholar]
- Xiong, W.; Luo, X.; Zhou, M. Comparison diagnosis and discussion of trigger mechanism of two MCC heavy rain systems in Guizhou. J. Yunnan Univ. Nat. Sci. Ed. 2014, 36, 66–78. [Google Scholar]
- Zhao, Y.; Liu, K. Diagnostic analysis of moist potential vorticity for a heavy rain in Guizhou. J. Yunnan Univ. Nat. Sci. 2012, 34, 386–389. [Google Scholar]
- Kalnay, E.; Kanamitsu, M.; Kistler, R.; Collins, W.; Deaven, D.; Gandin, L.; Joseph, D. The NCEP/NCAR Reanalysis 40-year Project. Bull. Am. Meteorol. Soc. 1996, 77, 437–471. [Google Scholar] [CrossRef]
- Yu, S. Monitoring and Forecasting of Flood in Southwest China; China Meteorological Press: Beijing, China, 2004. [Google Scholar]
- Wei, F. Modern Climate Statistical Diagnosis and Prediction Technology, 2nd ed.; China Meteorological Press: Beijing, China, 2007. [Google Scholar]
Figure 1.
Distribution of the 90 surface meteorological observation stations (a) and the monthly cumulative frequency of rainstorms and floods during the 1961–2021 period (b).
Figure 1.
Distribution of the 90 surface meteorological observation stations (a) and the monthly cumulative frequency of rainstorms and floods during the 1961–2021 period (b).
Figure 2.
Trend analysis (thin solid line), polynomial fitting line (thick dashed line), linear trend line (thick solid line) and the Global Land–Ocean Temperature Index (hollow line) (a) and the linear trend of 850 hPa specific humidity (b) in the summer half-year during 1961–2021.
Figure 2.
Trend analysis (thin solid line), polynomial fitting line (thick dashed line), linear trend line (thick solid line) and the Global Land–Ocean Temperature Index (hollow line) (a) and the linear trend of 850 hPa specific humidity (b) in the summer half-year during 1961–2021.
Figure 3.
Mann–Kendall method (a) and moving t-test (b) analyses of rainstorms and floods in the summer half-year of 1961–2021 (horizontal lines are 95% reliability critical value).
Figure 3.
Mann–Kendall method (a) and moving t-test (b) analyses of rainstorms and floods in the summer half-year of 1961–2021 (horizontal lines are 95% reliability critical value).
Figure 4.
The wavelet real part (a) and wavelet variance (b) of the rainstorms and floods in the summer half-year of 1961–2021.
Figure 4.
The wavelet real part (a) and wavelet variance (b) of the rainstorms and floods in the summer half-year of 1961–2021.
Figure 5.
Spatial distribution of rainstorms and floods (a) and EOF (b) of 90 stations in the summer half year of 1961–2021.
Figure 5.
Spatial distribution of rainstorms and floods (a) and EOF (b) of 90 stations in the summer half year of 1961–2021.
Figure 6.
Observed cumulative rainstorm and flood values (solid line), 100 hPa height (a) and 500 hPa height (b), 850 hPa wind speed (c) and sea level pressure field (d), in the summer half-year of 1961–2021 (dashed lines).
Figure 6.
Observed cumulative rainstorm and flood values (solid line), 100 hPa height (a) and 500 hPa height (b), 850 hPa wind speed (c) and sea level pressure field (d), in the summer half-year of 1961–2021 (dashed lines).
Figure 7.
The sea level pressure field of rainstorms and floods in high-value years (a), the correlation coefficient (b) of rainstorms and floods and sea level pressure field in the summer half-year during 1961–2021. The shaded areas represent those where the correlation passes 90% (Green), 95% (Brown), and 99% (Rose) significance levels.
Figure 8.
The 850 hPa wind field of rainstorms and floods in high-value years (a), the correlation coefficient (b) of rainstorms and floods and 850 hPa wind field in the summer half-year of 1961–2021.
Figure 8.
The 850 hPa wind field of rainstorms and floods in high-value years (a), the correlation coefficient (b) of rainstorms and floods and 850 hPa wind field in the summer half-year of 1961–2021.
Figure 9.
The 500 hPa height field of rainstorms and floods in high-value years (a), the correlation coefficient (b) of rainstorms and floods, and 500 hPa height field in the summer half-year during 1961–2021. The shaded areas represent those where the correlation passes 90% (Green), 95% (Brown), and 99% (Rose) significance levels.
Figure 10.
The 100 hPa height field of rainstorms and floods in high-value years (a), the correlation coefficient (b) of rainstorms and floods, and 100 hPa height field in the summer half-year during 1961–2021. The shaded areas represent those where the correlation passes 90% (Green), 95% (Brown), and 99% (Rose) significance levels.
Table 1.
Interdecadal anomaly of the rainstorms and floods in summer half-year for 1961–2021.
Table 1.
Interdecadal anomaly of the rainstorms and floods in summer half-year for 1961–2021.
| Years | Anomaly | Percentage of Anomaly |
|---|
| 1960–1969 | −1.7 | −0.8% |
| 1970–1979 | −11.8 | −5.8% |
| 1980–1989 | 1.7 | 0.8% |
| 1990–1999 | −4.8 | −2.3% |
| 2000–2009 | −4.5 | −2.1% |
| 2010–2019 | 20.9 | 10.2% |
| Publisher’s Note: MDPI stays neutral with regard to jurisdictional claims in published maps and institutional affiliations. |
© 2022 by the authors. Licensee MDPI, Basel, Switzerland. This article is an open access article distributed under the terms and conditions of the Creative Commons Attribution (CC BY) license (https://creativecommons.org/licenses/by/4.0/).


