
Characteristics of Rainstorm Intensity and Its Future Risk Estimation in the Upstream of Yellow River Basin

 ,
,  ,
, 
Abstract
:1. Introduction
2. Data and Methods
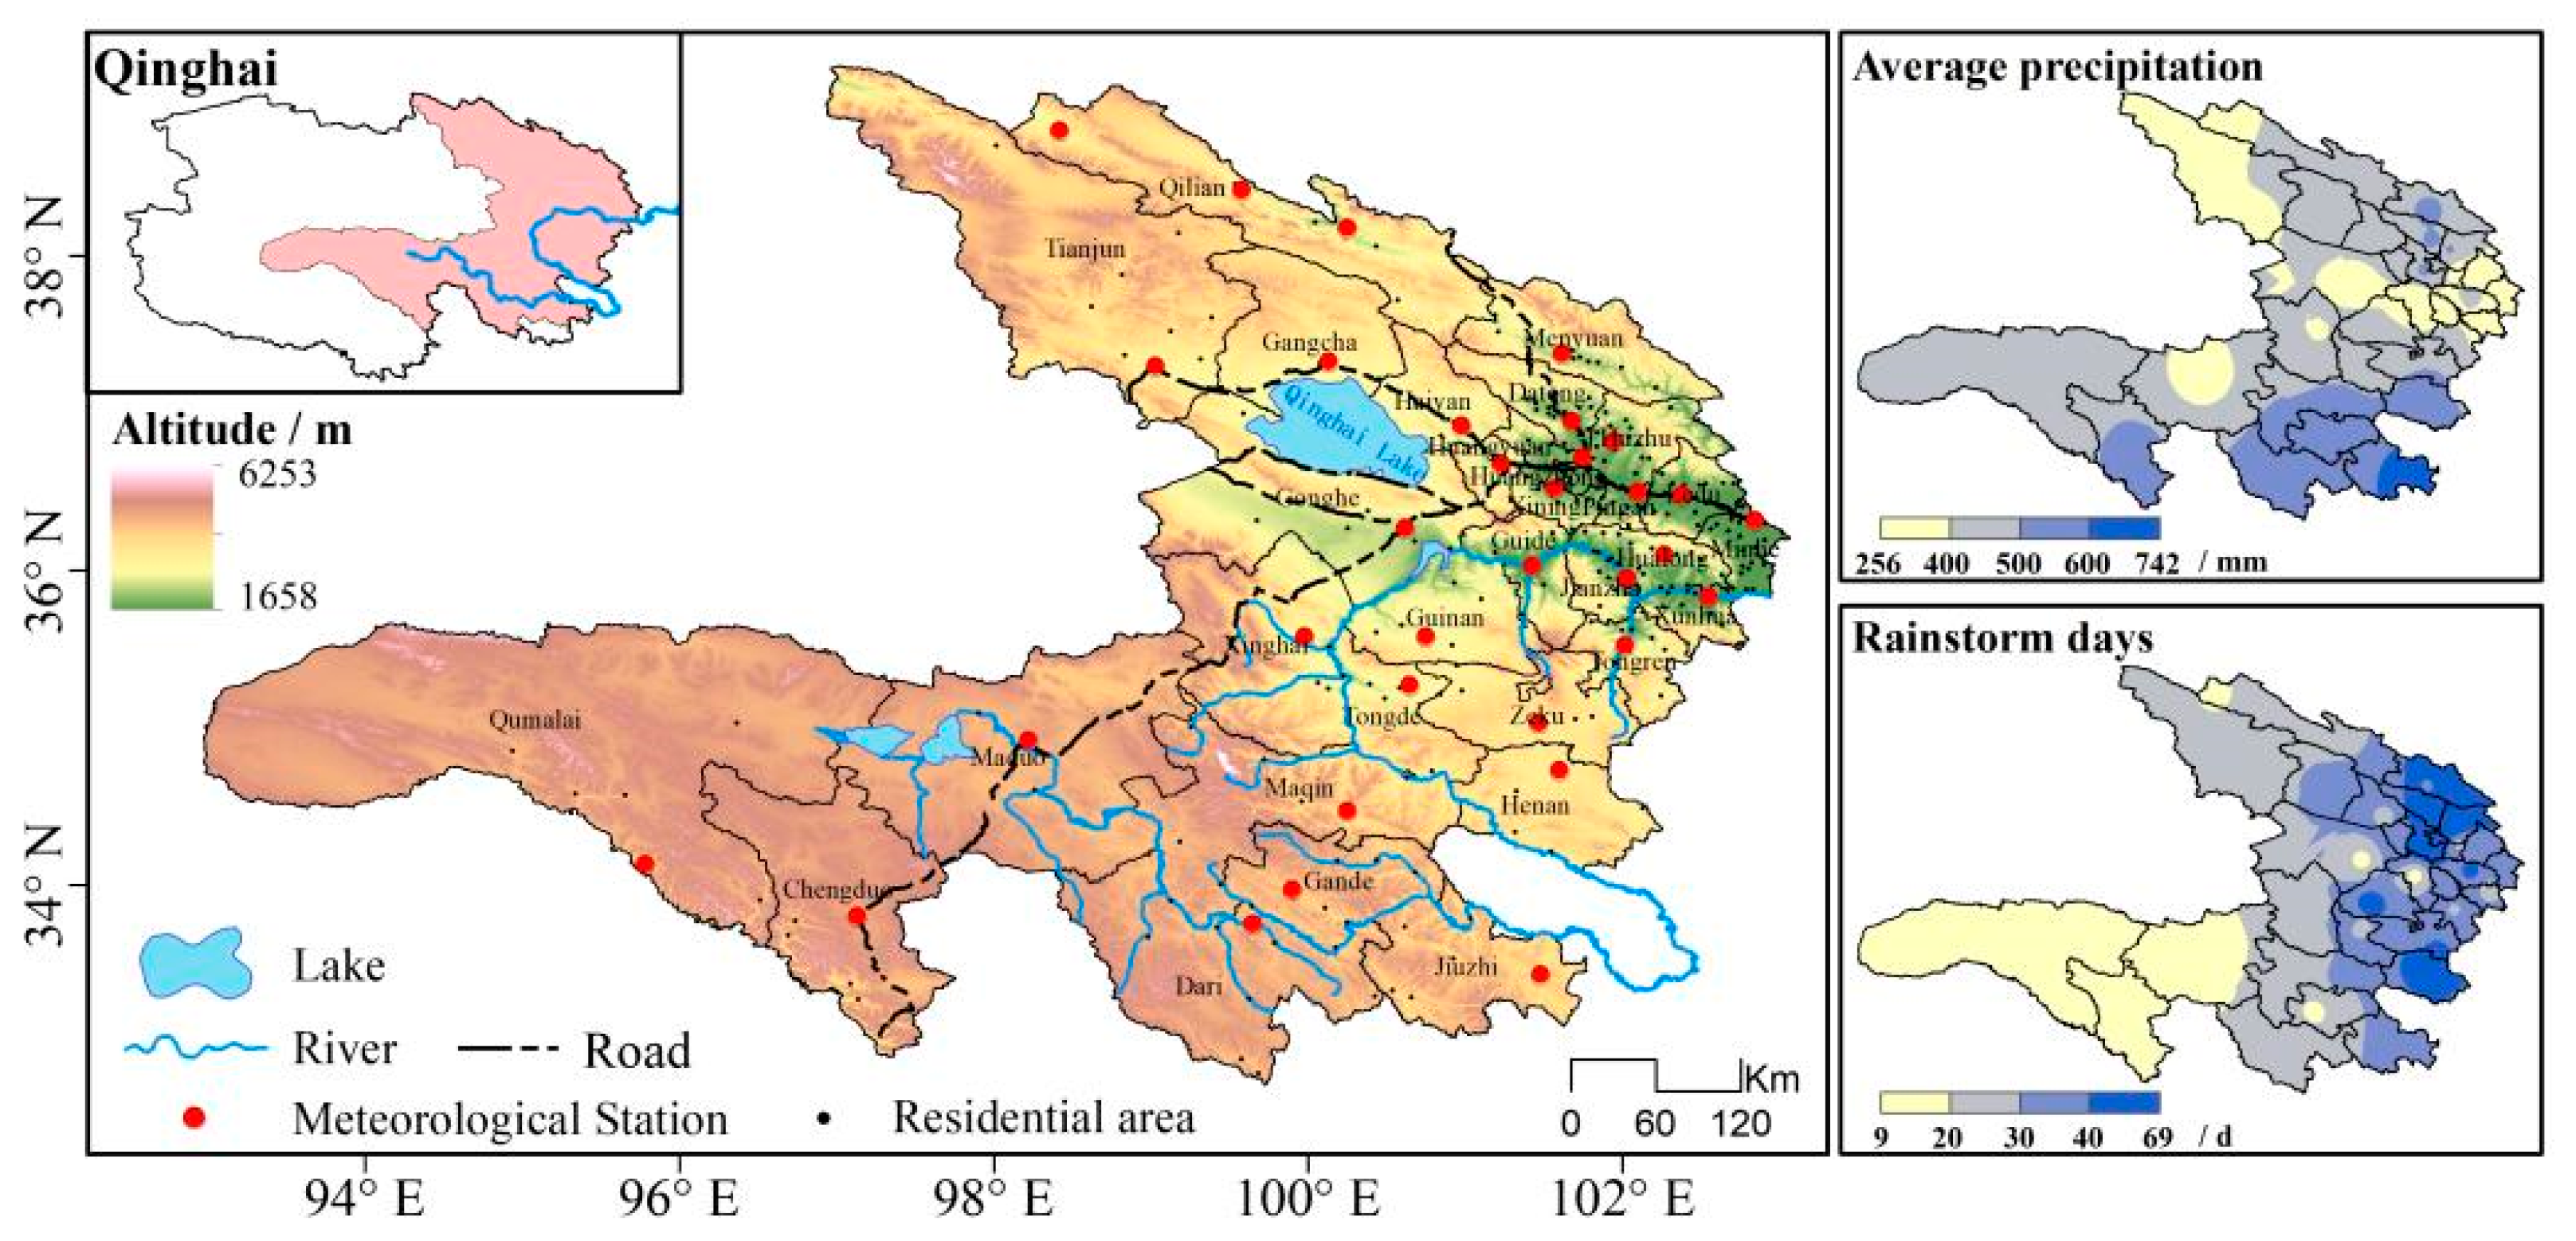
2.1. Study Area
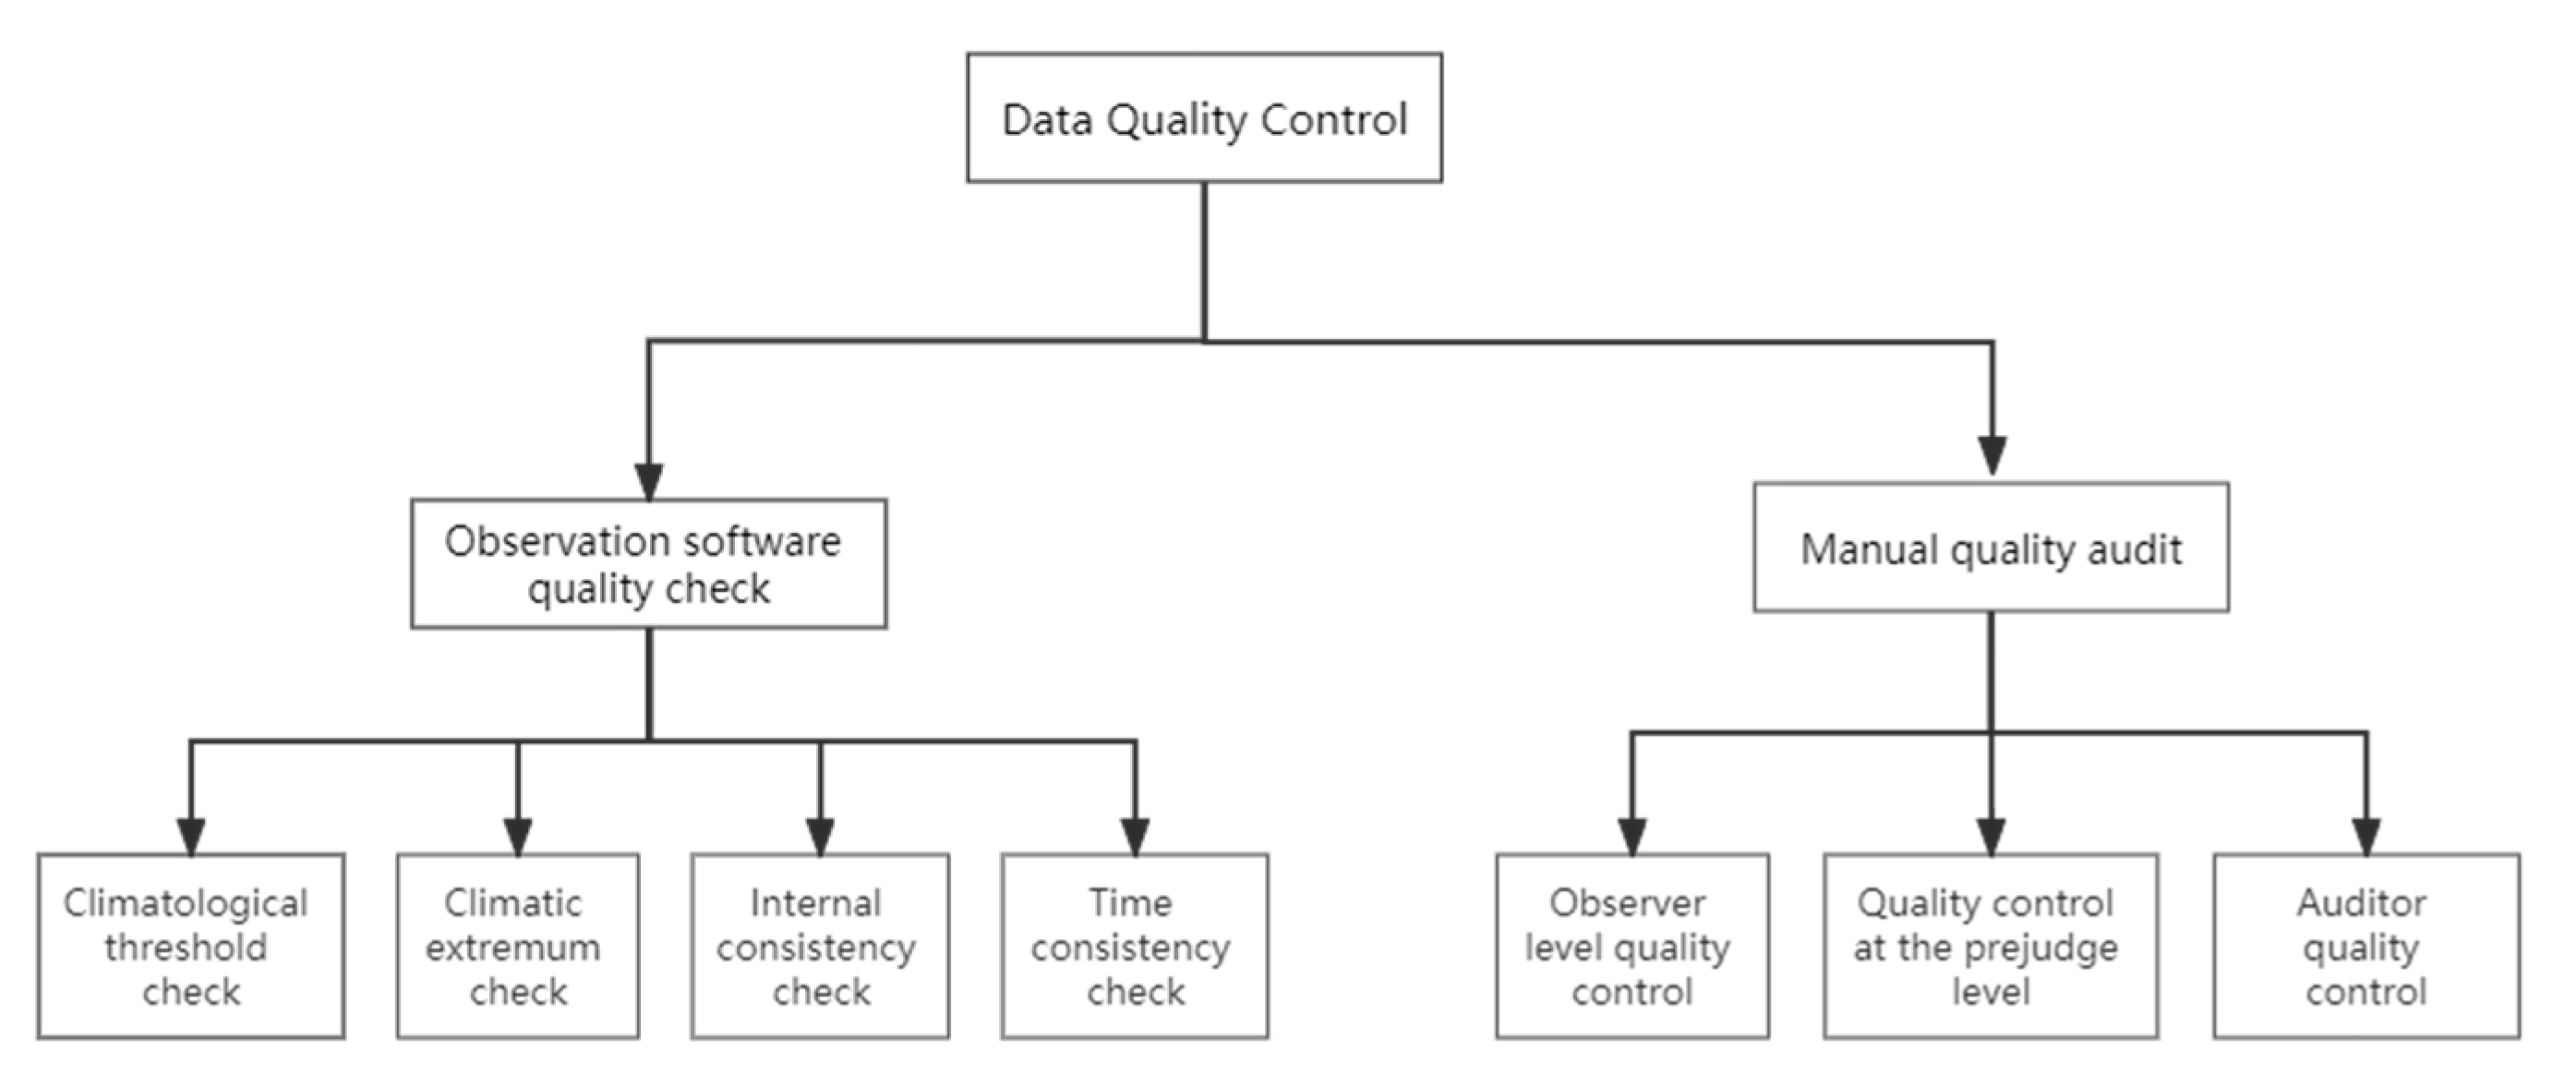
2.2. Data Sources
2.3. Methods
3. Characteristics of the Intensity Change of the Rainstorm Process
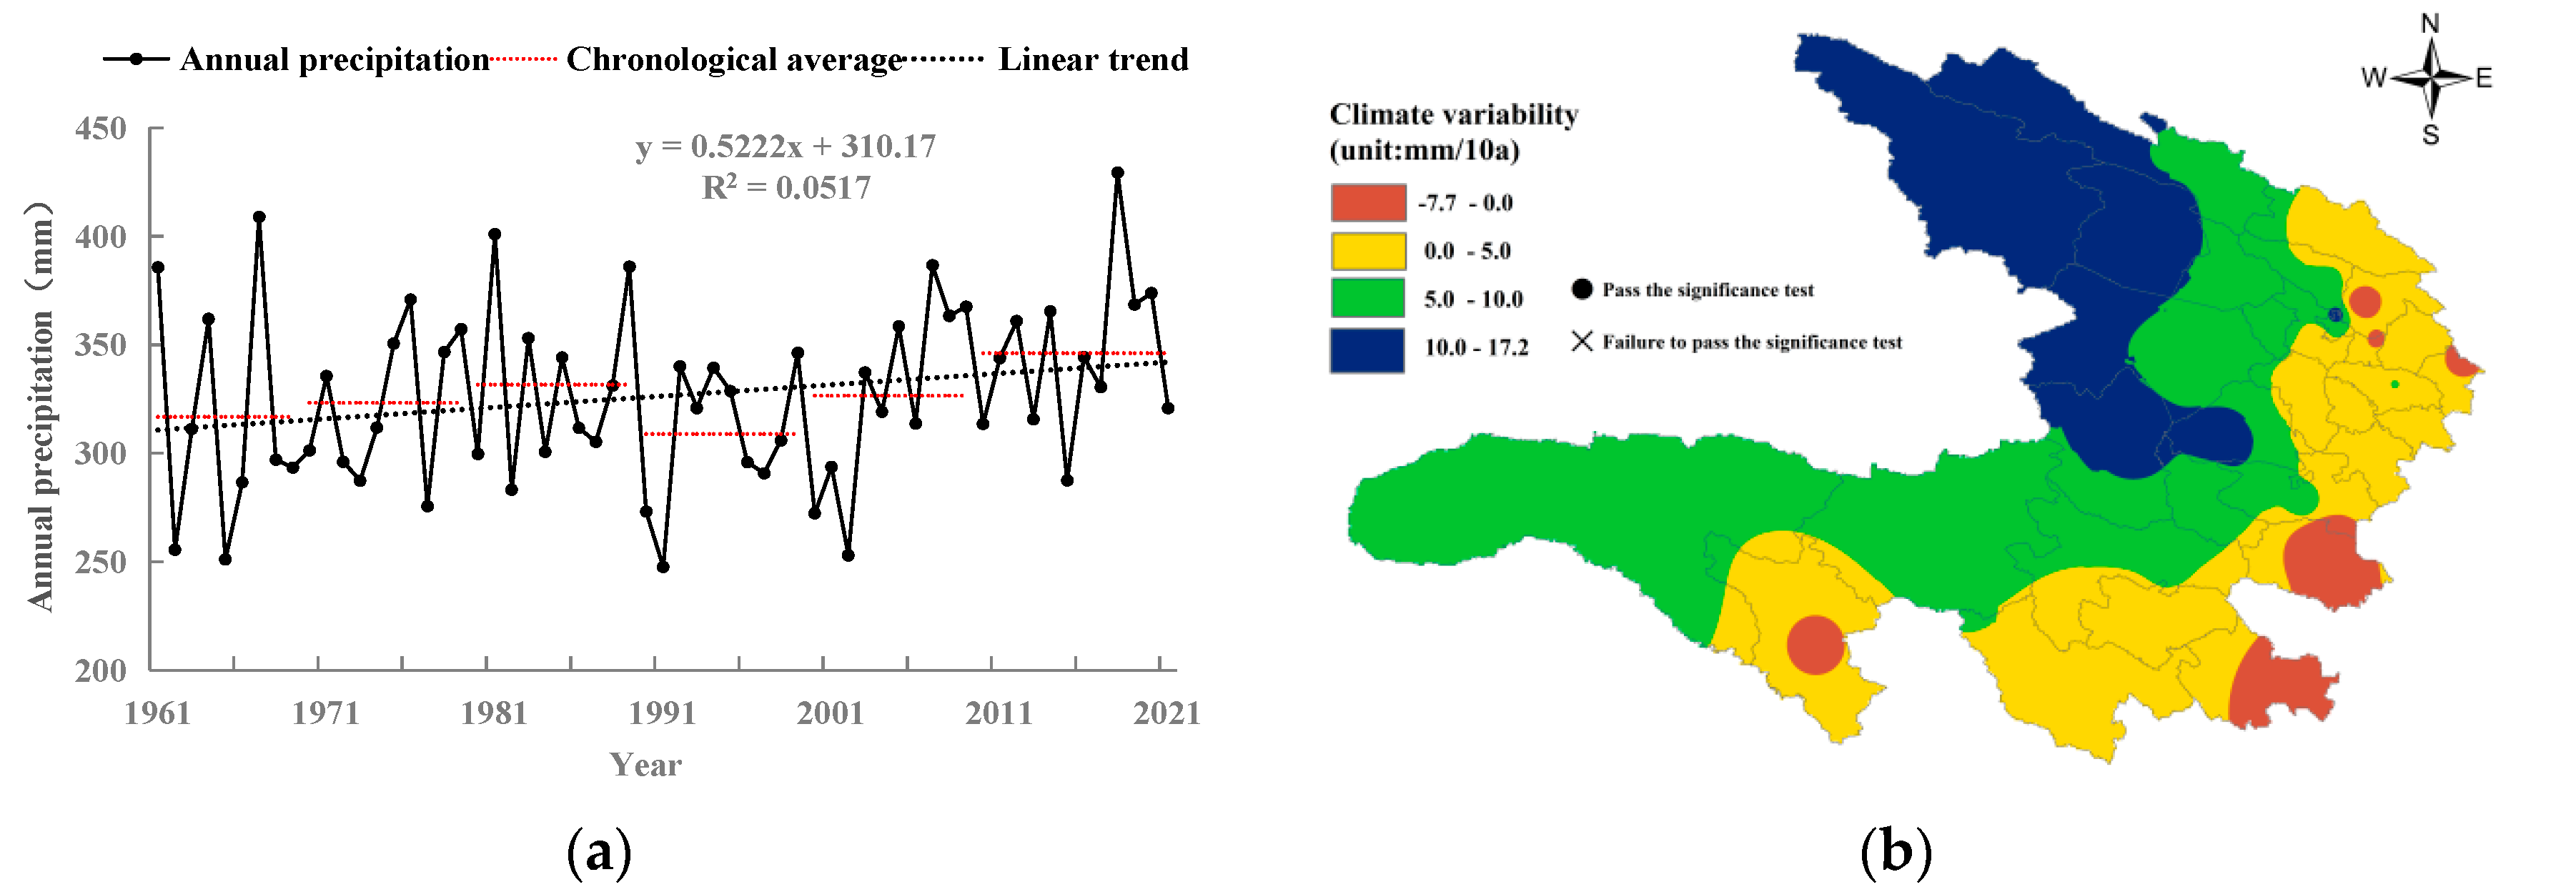
3.1. Precipitation Variation Characteristics
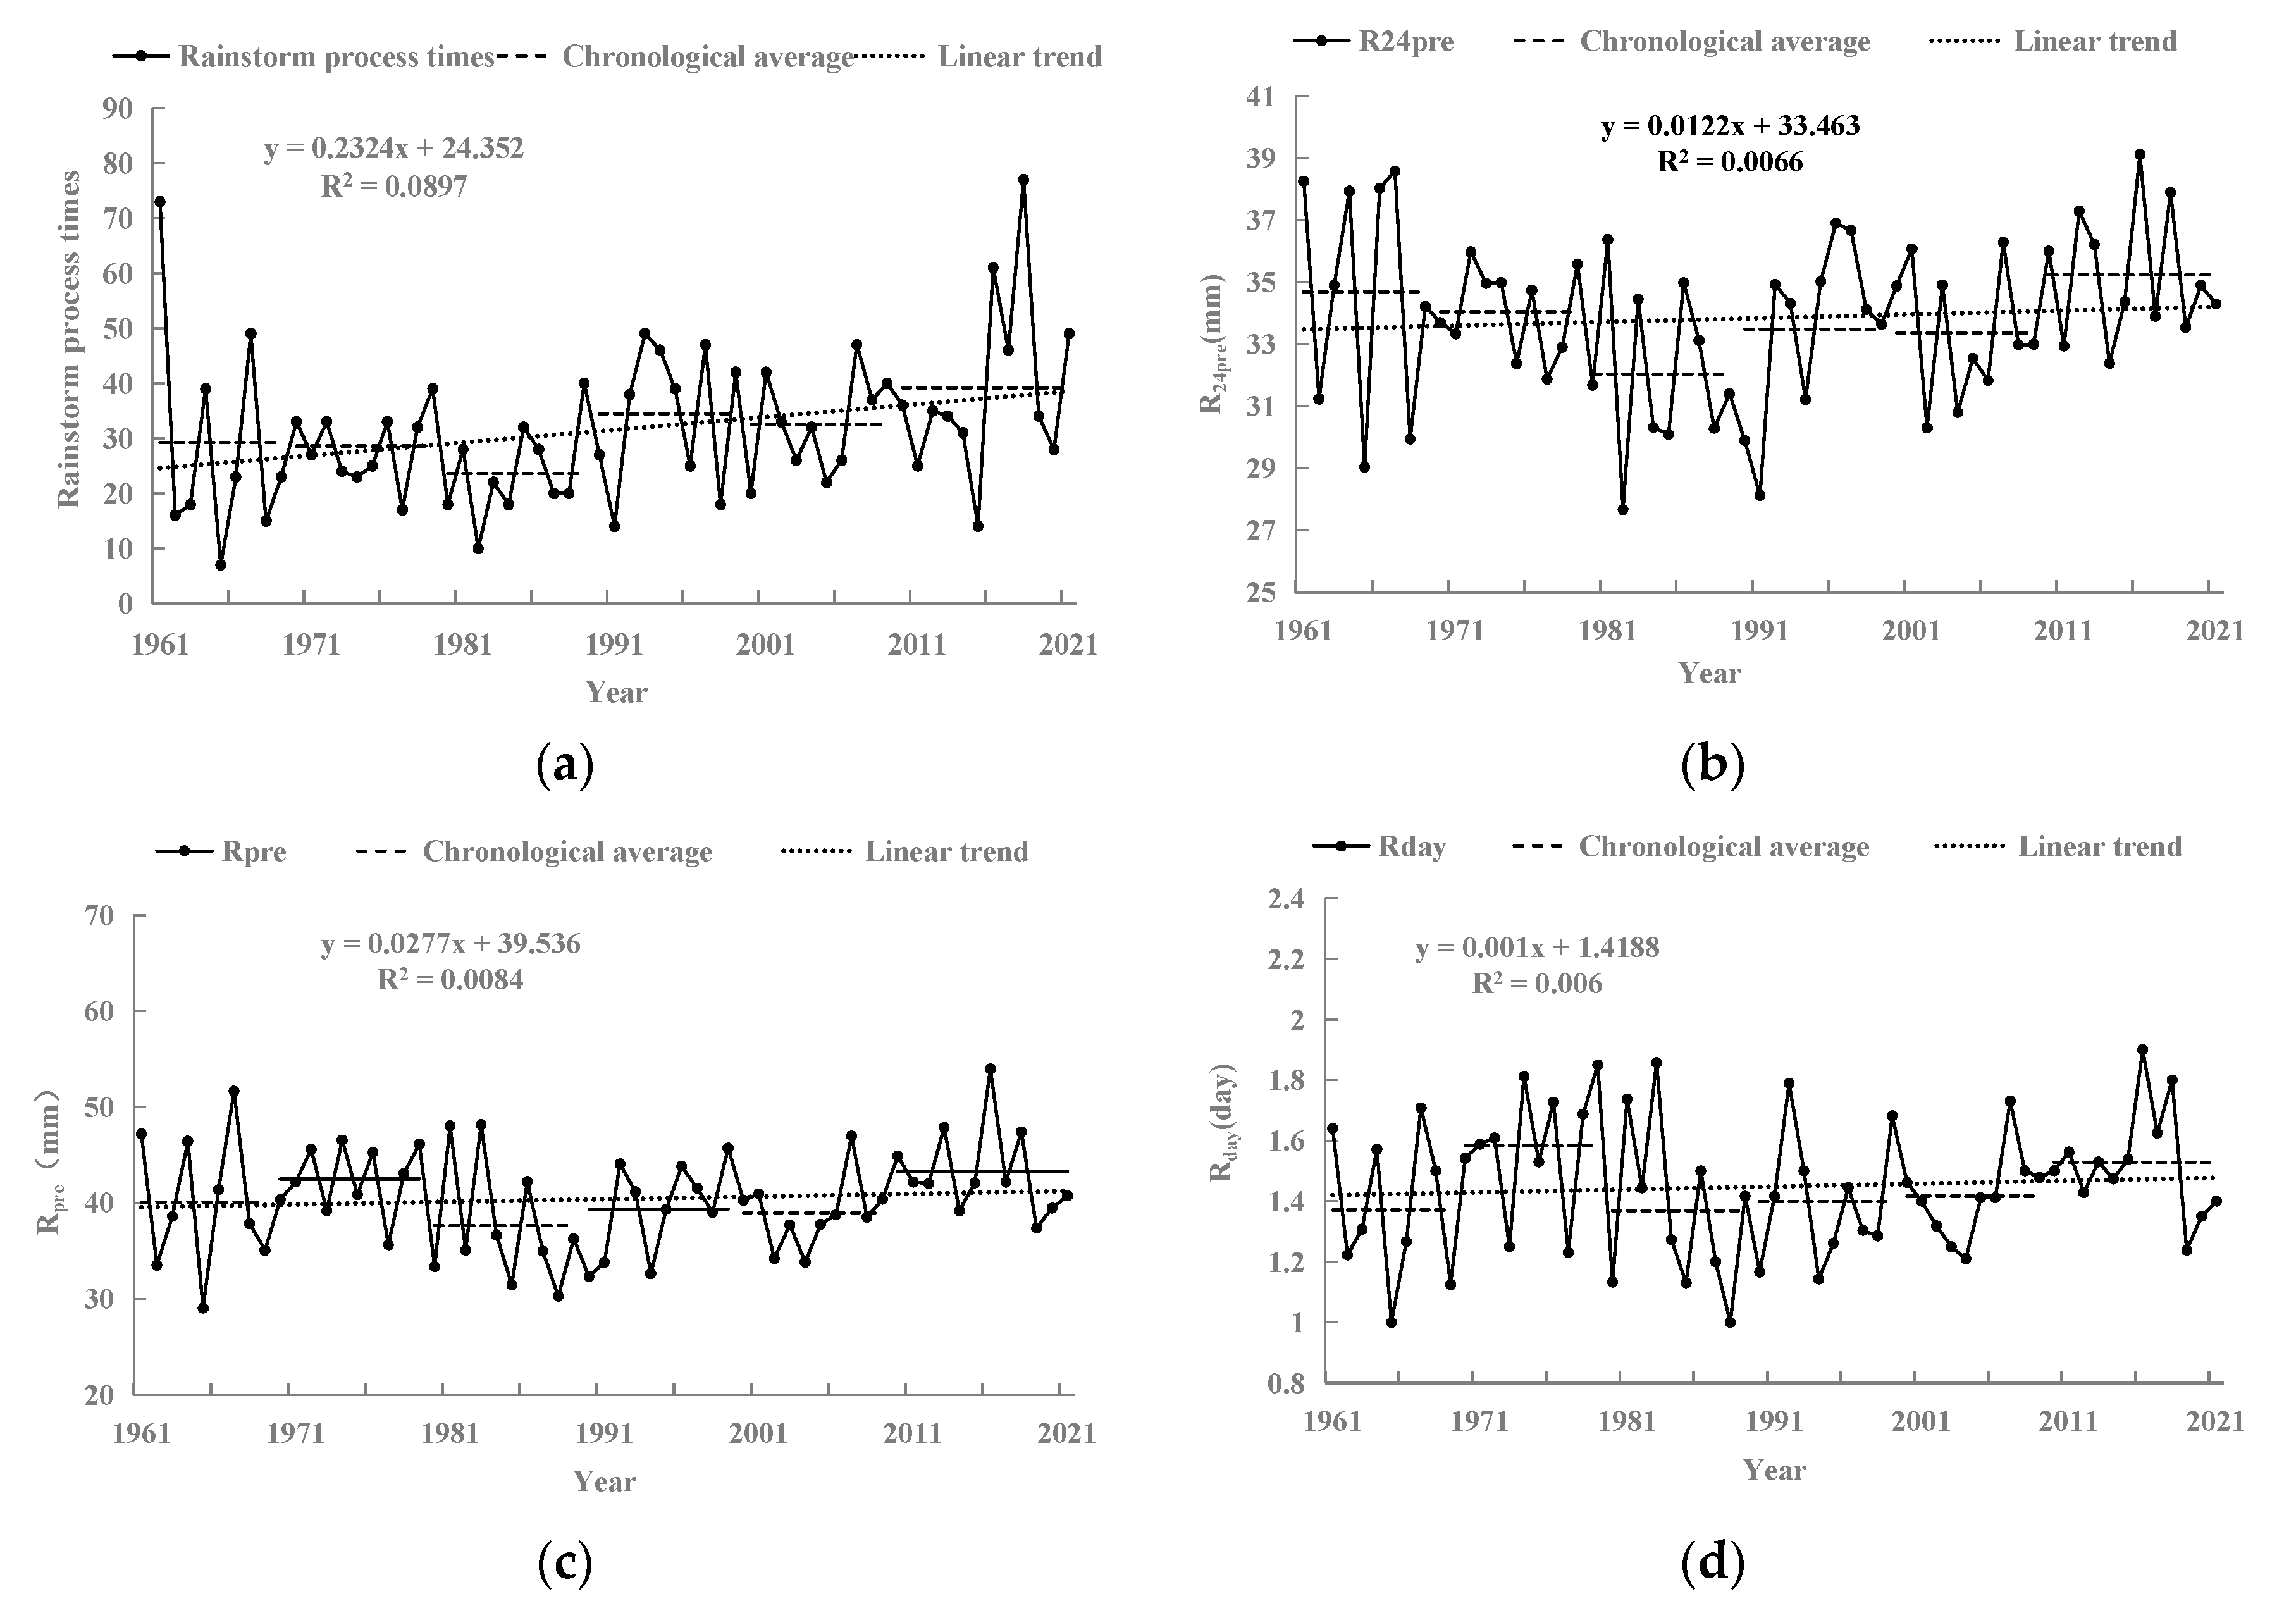
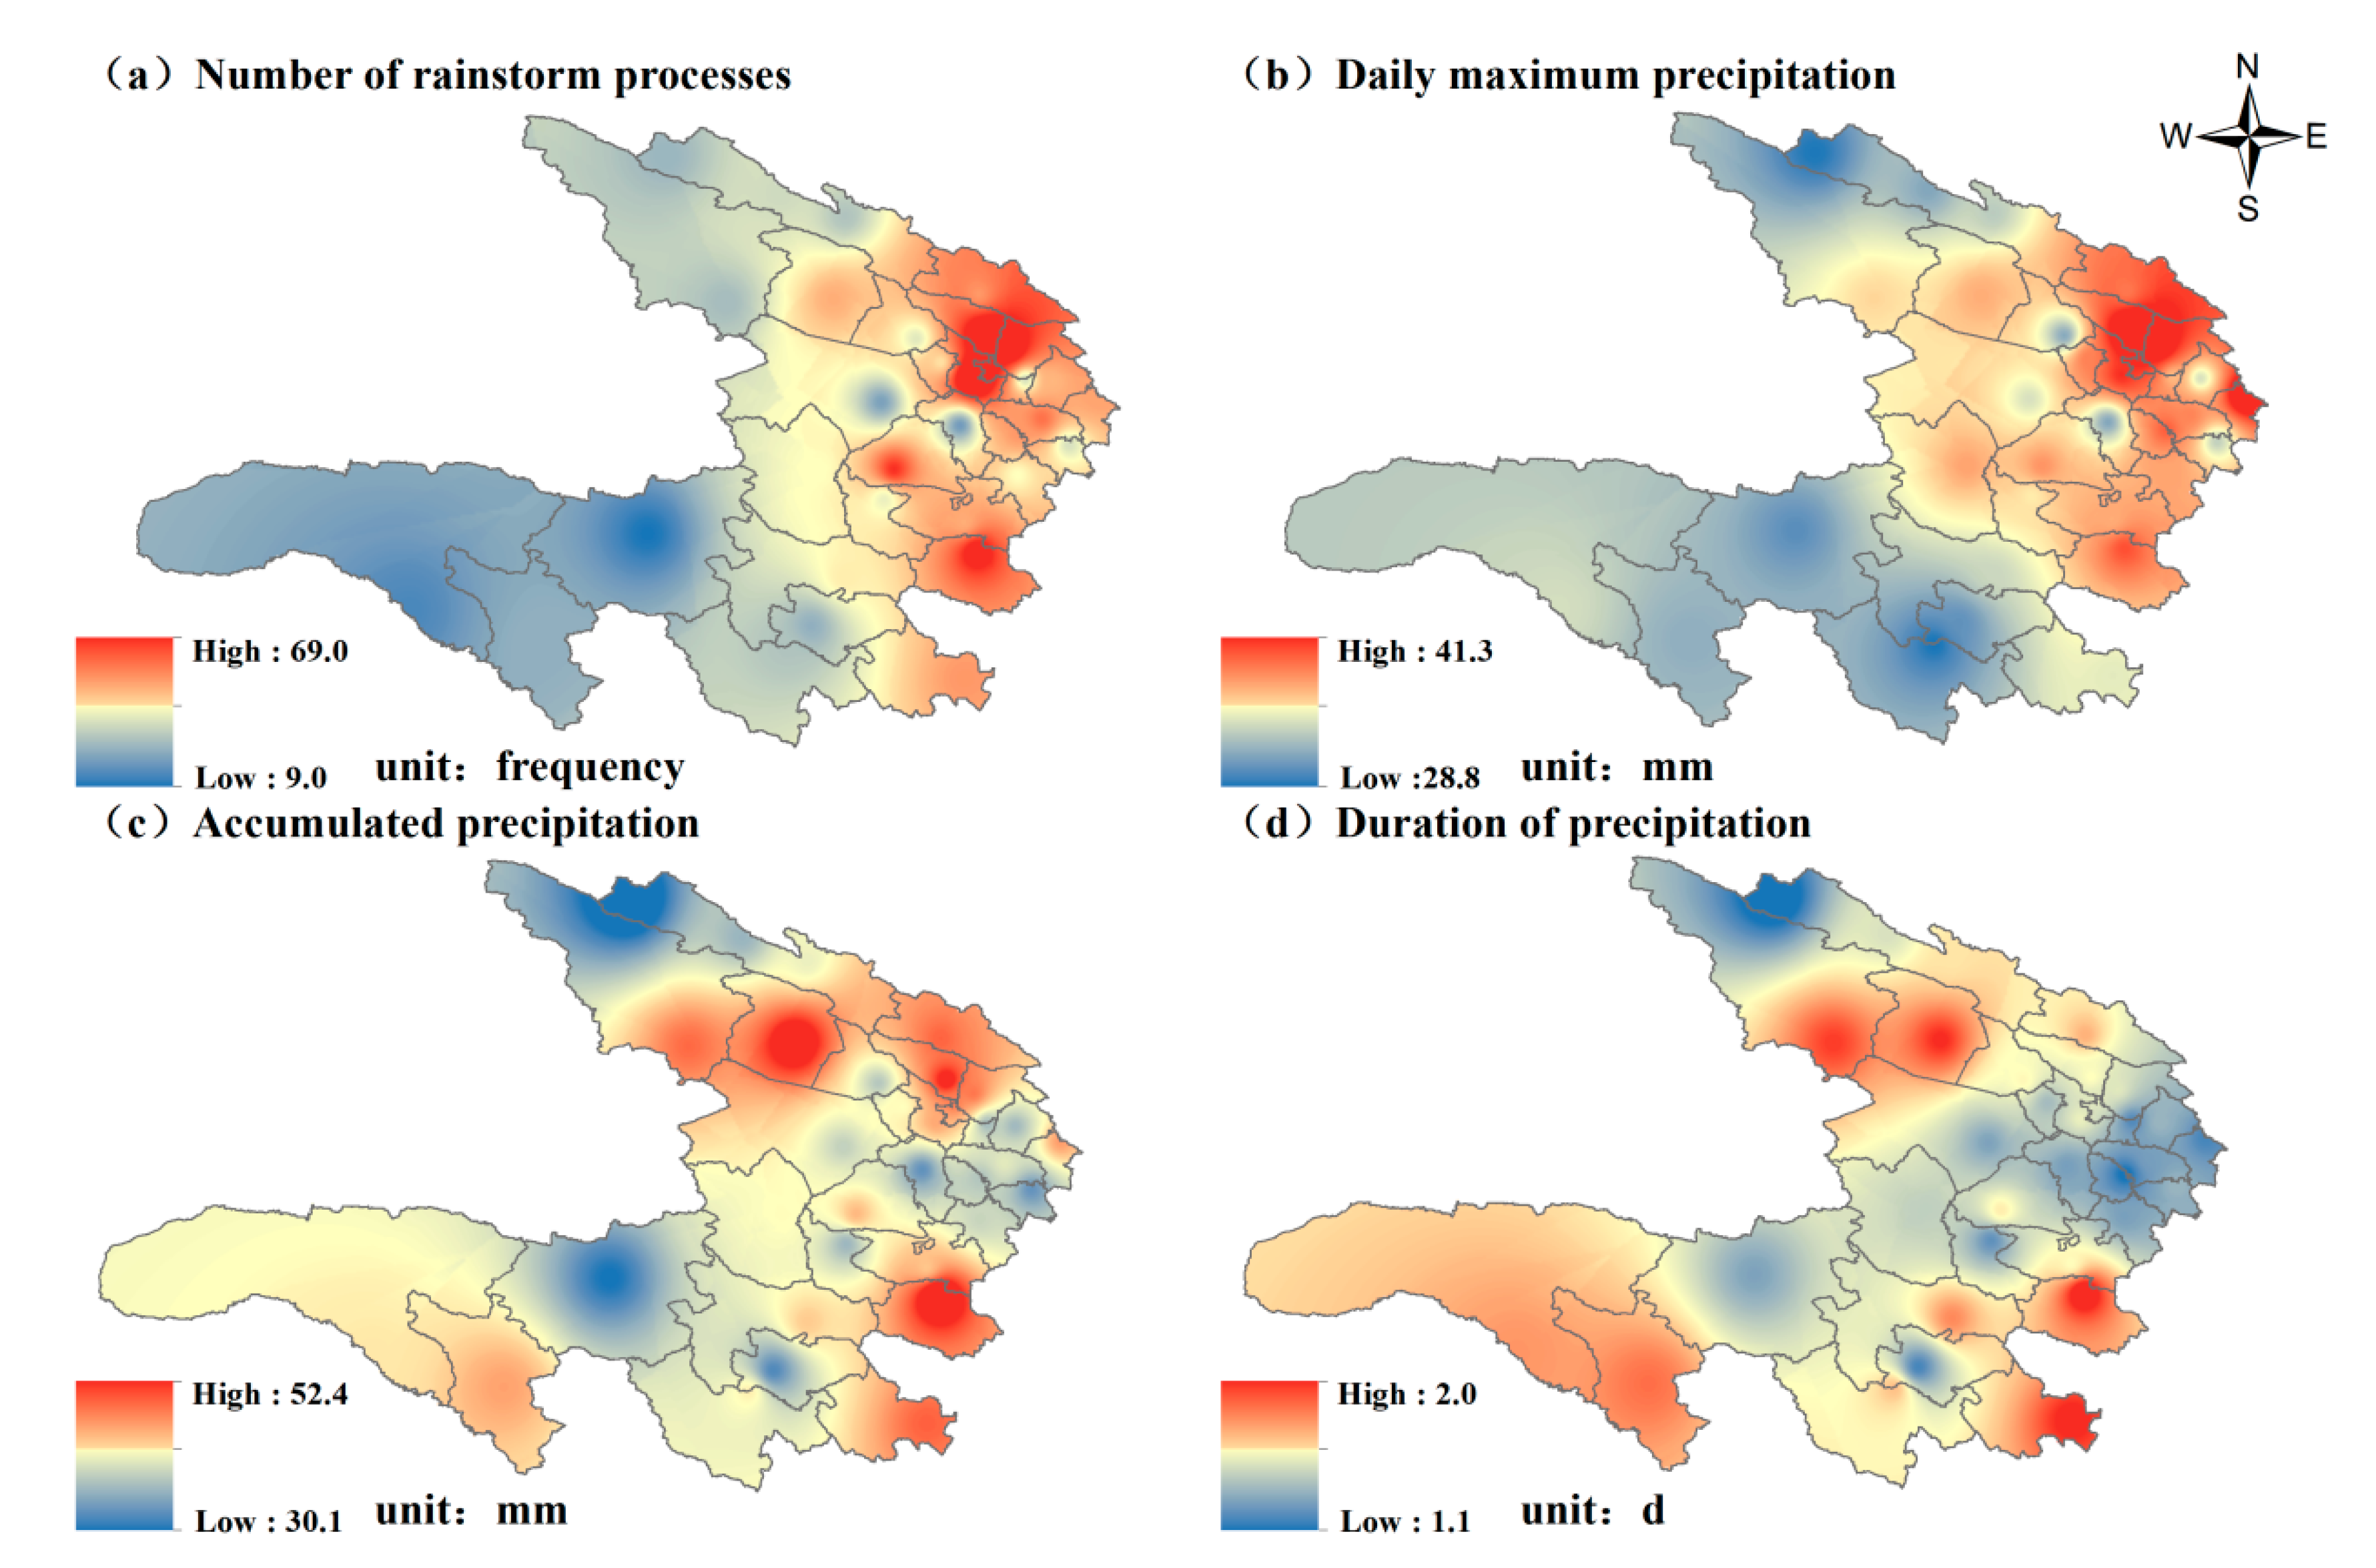
3.2. Index Characteristics of the Rainstorm Process
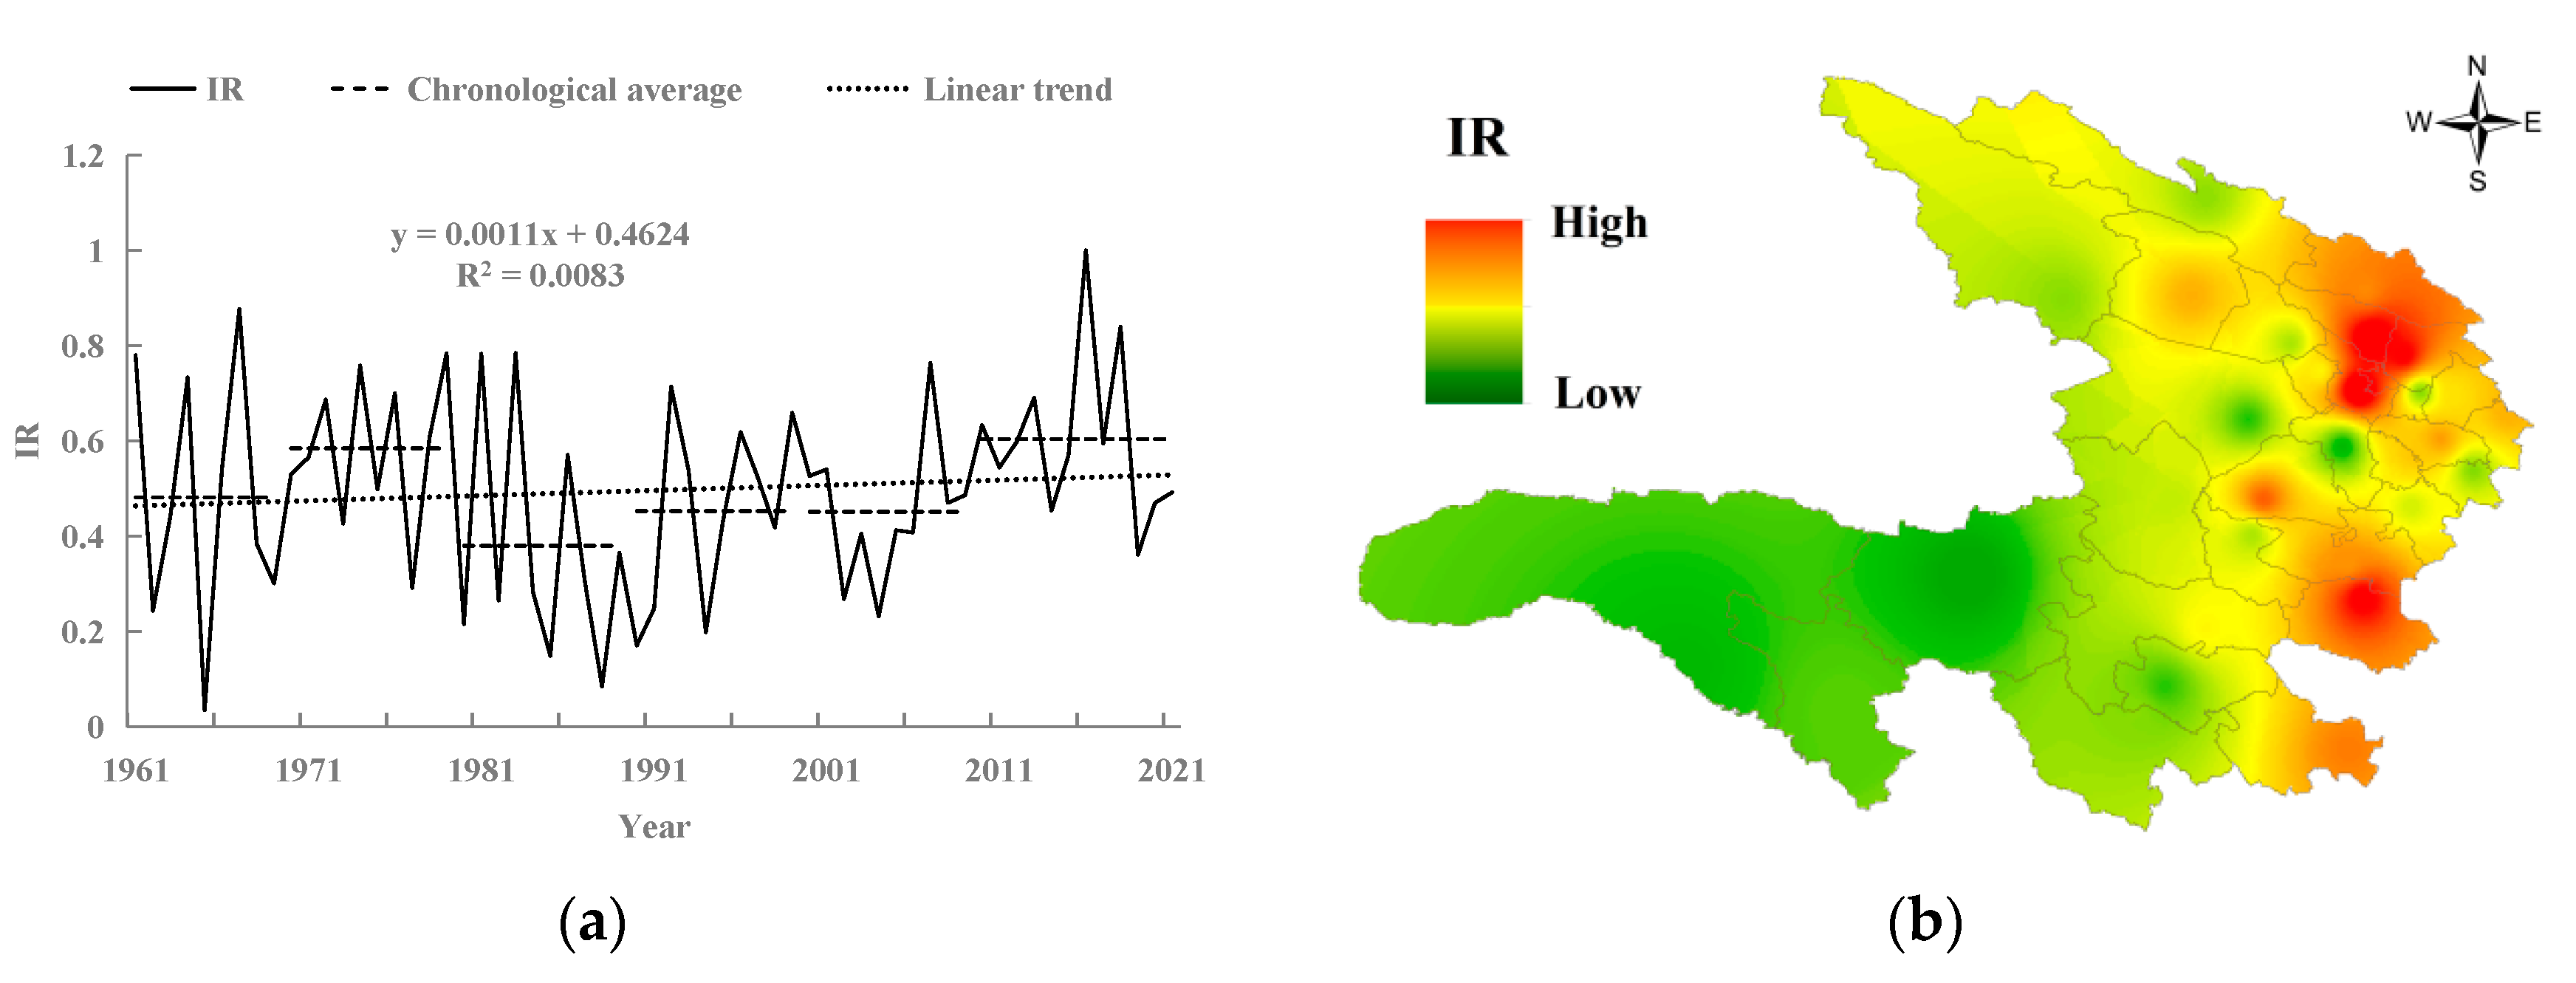
3.3. Intensity Characteristics of the Rainstorm Process
4. Future Climate Risk Estimation for Rainstorm Disasters
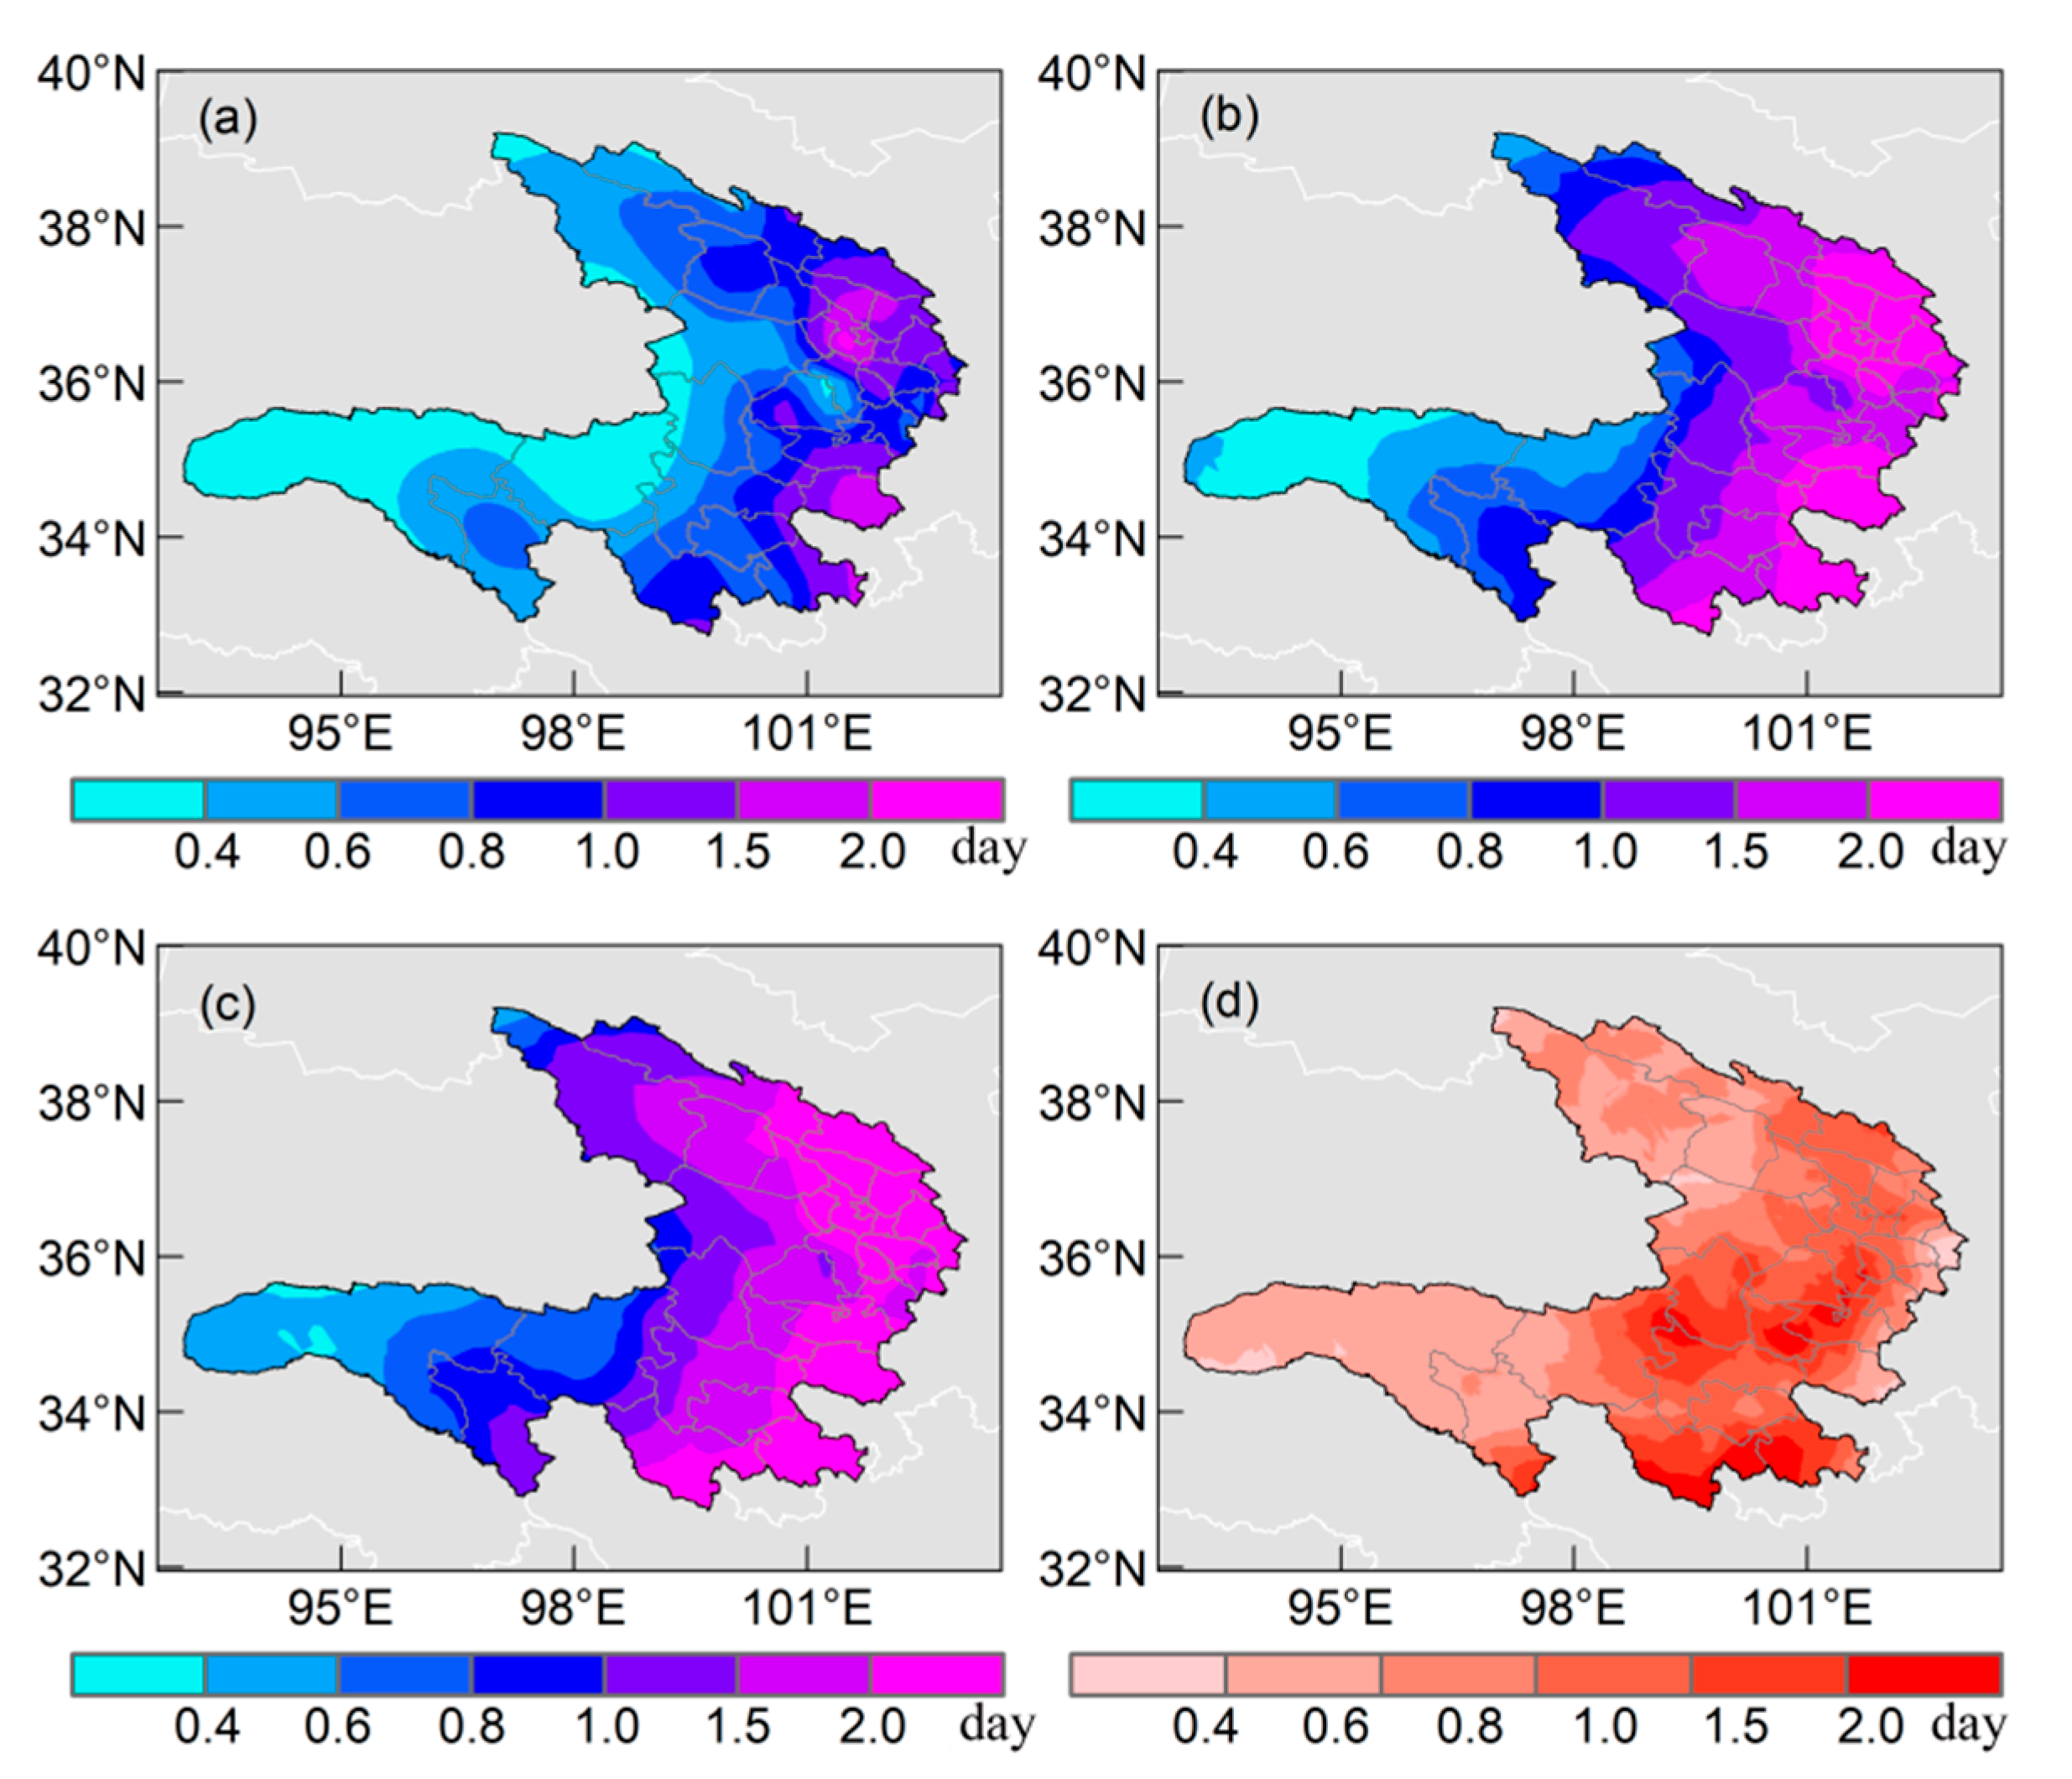
4.1. Estimated Number of Days of Rainstorms in Future Scenarios
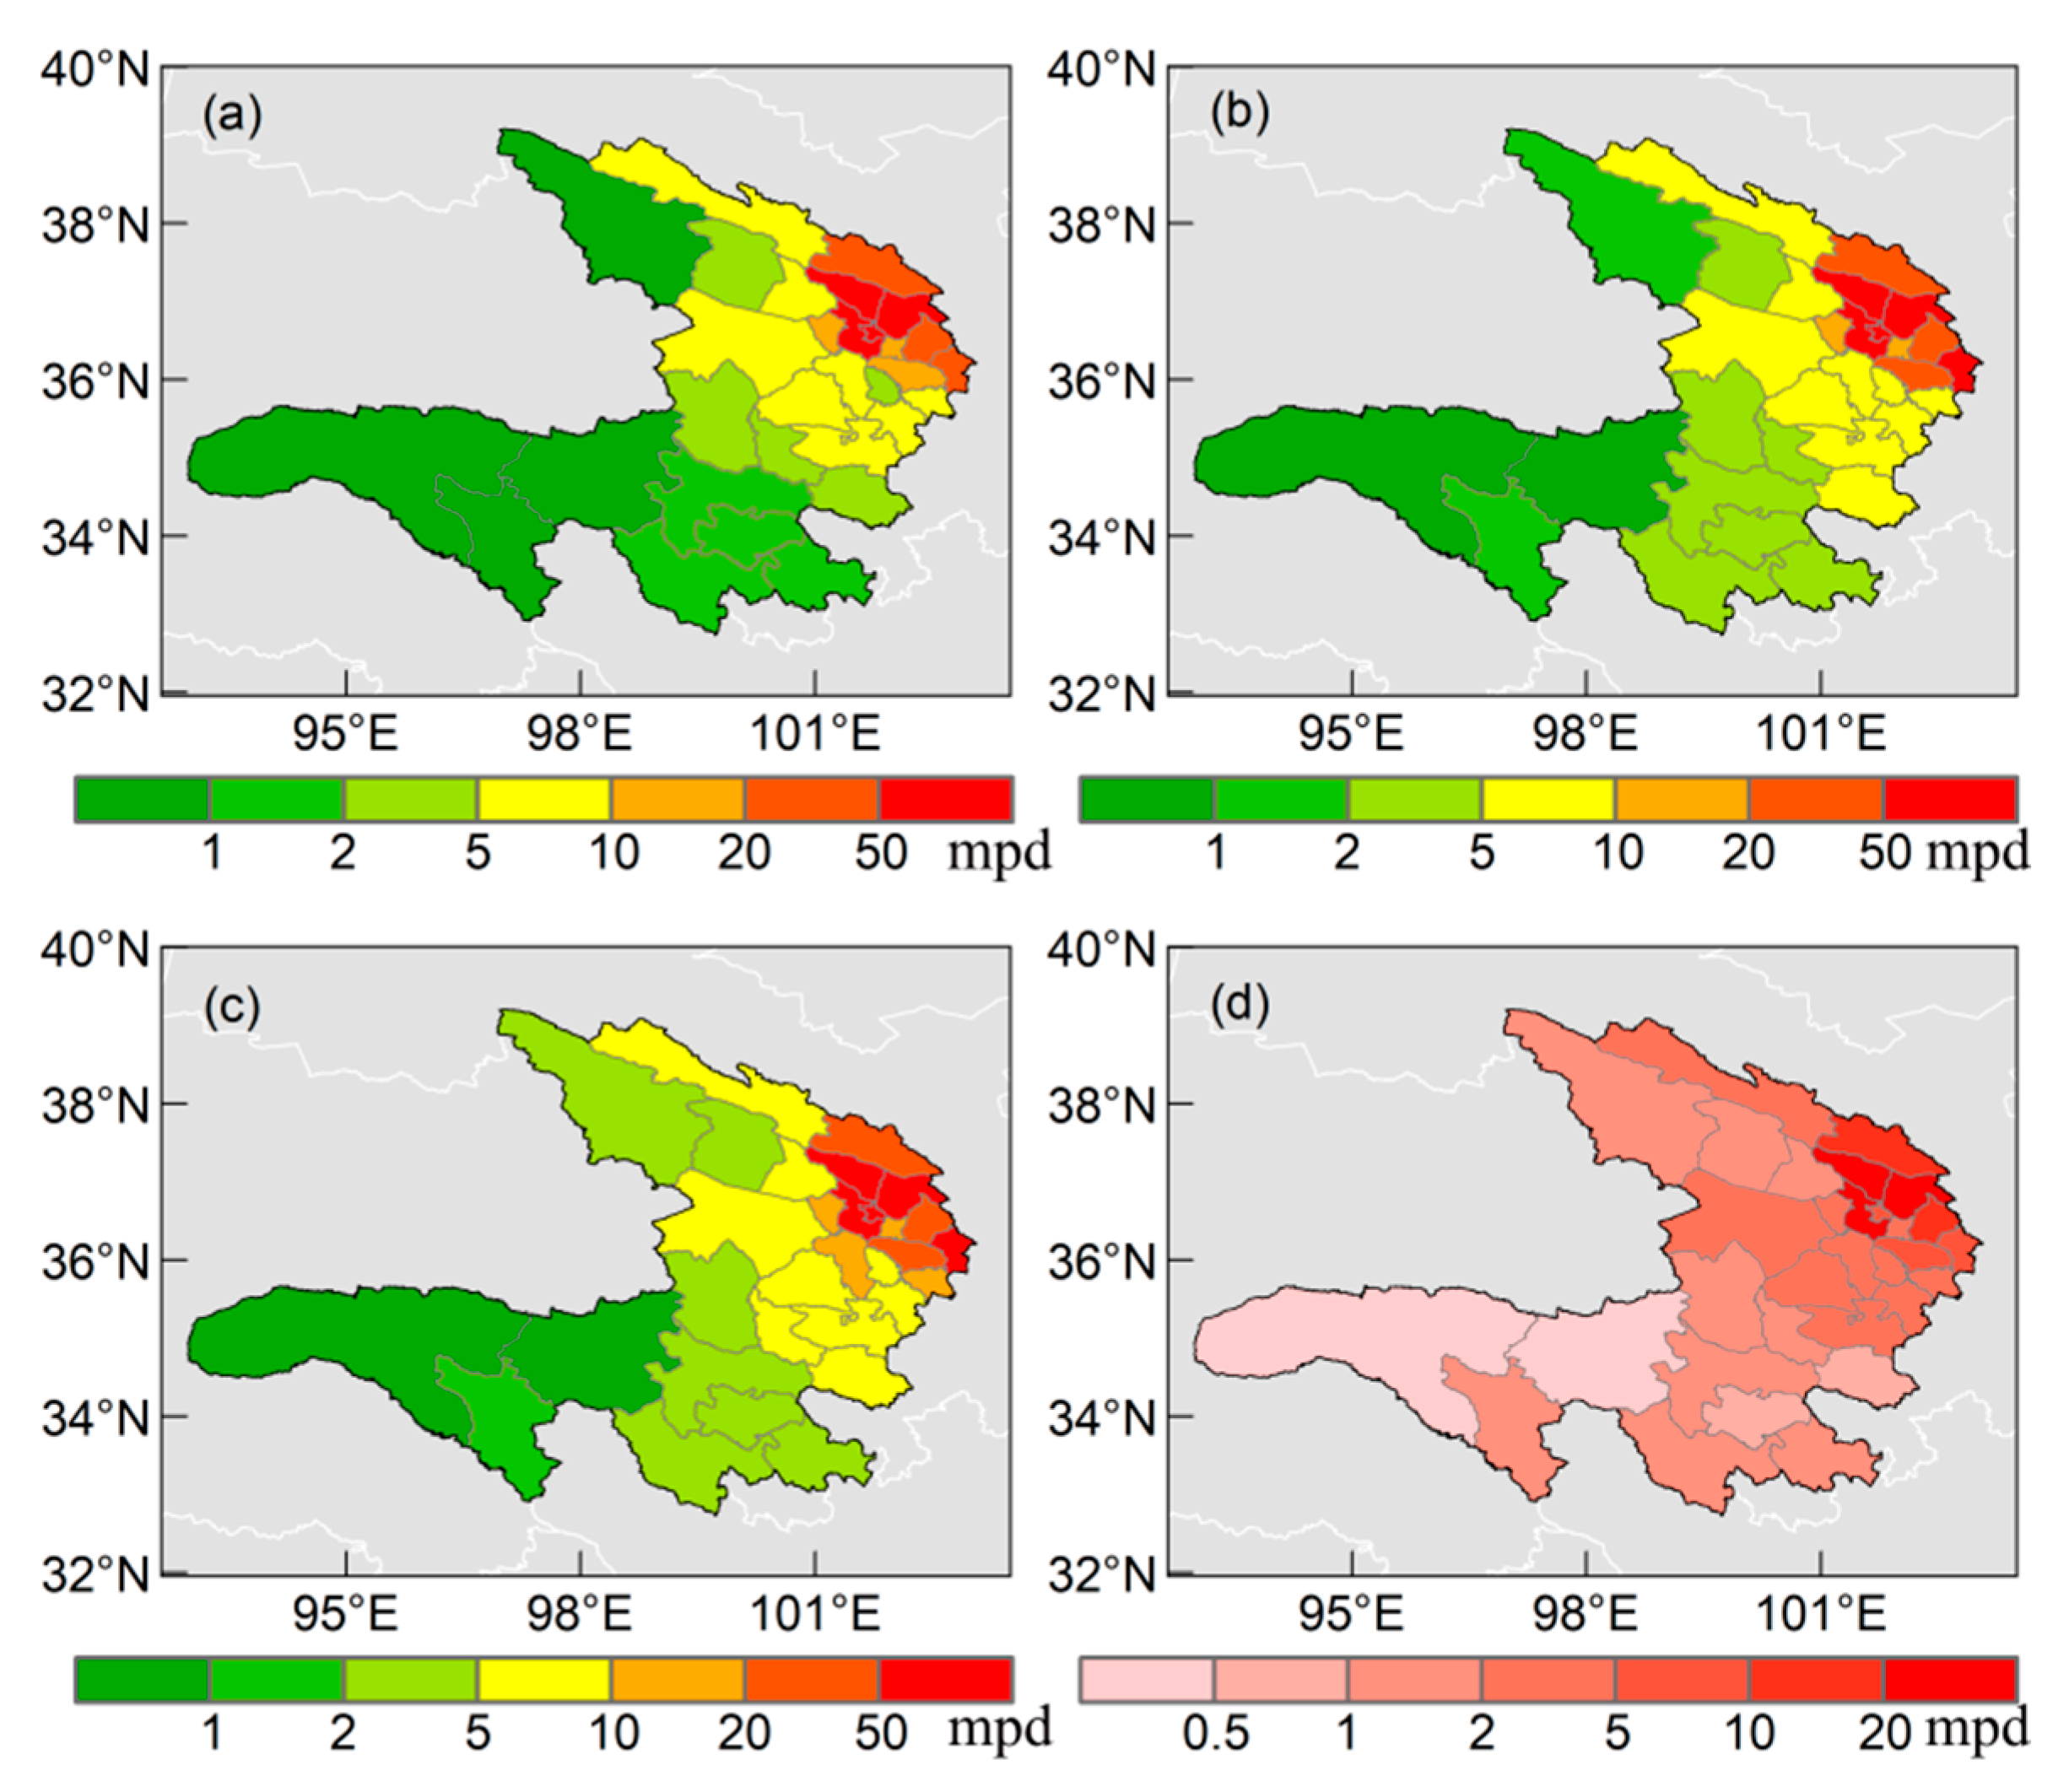
4.2. Population Exposure Risk Estimation for Future Scenarios
5. Discussion and Conclusions
- From 1961 to 2021, rainfall upstream of the Yellow River Basin showed an overall increasing trend, with an increased rate of 8.1 mm/10a. In the 21st century, the rising annual rainfall trend is becoming particularly significant. The maximum daily rainfall, accumulated rainfall, and the number of days of duration during rainstorms all show a rising trend, and the extremity of rainfall increases;
- From 1961 to 2021, the intensity index of the rainstorm process showed an increasing trend. The increase has become pronounced since the beginning of the 21st century, which is the period with the highest value of the intensity index of the rainstorm process. Most of the administrative districts where the high-value areas are located are the most economically and population-concentrated areas in Qinghai Province. The risk of rainstorm disasters and possible damages will also increase;
- The low-, medium-, and high- emission scenarios are all expected to show an increasing trend in the number of rainstorm days by around 2050 (2036–2065). Among them, the low-emission scenario will lead to at least a 60% increase in social risk. The medium-emission scenario will lead to a 67% increase in the socioeconomic risk index. In contrast, the high-emission scenario will lead to a doubling of the socioeconomic risk index from the historical base period.
- As the hazards increase, the population exposure to the rainstorm hazards will also rise. If no measures are taken, the population exposure will rise to 7.316 million per day around 2050. This has more than doubled compared to the base period, with the increase being particularly significant in the northeast.
Author Contributions
Funding
Institutional Review Board Statement
Informed Consent Statement
Data Availability Statement
Acknowledgments
Conflicts of Interest
References
- Diffenbaugh, N.S.; Singh, D.; Mankin, J.S.; Horton, D.E.; Swain, D.L.; Touma, D.; Charland, A.; Liu, Y.; Haugen, M.; Tsiang, M.; et al. Quantifying the influence of global warming on unprecedented extreme climate events. Proc. Natl. Acad. Sci. USA 2017, 114, 4881–4886. [Google Scholar] [CrossRef] [PubMed] [Green Version]
- Coumou, D.; Rahmstorf, S. A decade of weather extremes. Nat. Clim. Change 2012, 2, 491–496. [Google Scholar] [CrossRef]
- Toreti, A.; Naveau, P.; Zampieri, M.; Schindler, A.; Scoccimarro, E.; Xoplaki, E.; Dijkstra, H.A.; Gualdi, S.; Luterbacher, J. Projections of global changes in precipitation extremes from coupled model intercomparison project phase 5 models. Geophys. Res. Lett. 2013, 40, 4887–4892. [Google Scholar] [CrossRef] [Green Version]
- Lipczynska-Kochany, E. Effect of climate change on humic substances and associated impacts on the quality of surface water and groundwater: A review. Sci Total Environ. 2018, 640–641, 1548–1565. [Google Scholar] [CrossRef] [PubMed]
- Jiang, T.; Su, B.; Huang, J.; Zhai, J.; Kundzewicz, Z.W. Each 0.5 °C of warming increases annual flood losses in china by more than US$60 Billion. Bull. Am. Meteorol. Soc. 2020, 101, E1464–E1474. [Google Scholar] [CrossRef] [Green Version]
- Cai, T.; Li, X.; Ding, X.; Wang, J.; Zhan, J. Flood risk assessment based on hydrodynamic model and fuzzy comprehensive evaluation with GIS technique. Int. Disaster Risk Reduct. 2019, 35, 101077. [Google Scholar] [CrossRef]
- Wang, G.; Li, X.; Wu, X.; Yu, J. The rainstorm comprehensive economic loss assessment based on CGE model: Using a July heavy rainstorm in Beijing as an example. Nat. Hazards. 2015, 76, 839–854. [Google Scholar] [CrossRef]
- Xu, Y.; Zhang, B.; Zhou, B.T.; Dong, S.Y.; Yu, L.; Li, R.K. Projected risk of flooding disaster in China based on CMIP5 models. Clim. Change Res. 2014, 10, 268–275. [Google Scholar] [CrossRef]
- Xu, L.; Wang, A.; Wang, D.; Wang, H. Hot spots of climate extremes in the future. J. Geophys. Res. Atmos. 2019, 124, 3035–3049. [Google Scholar] [CrossRef]
- Chen, Y.; Sun, J.; Xu, J.; Yang, S.; Sheng, J. Analysis and thinking on the extremes of the 21 July 2012 torrential rain in Beijing partⅠ: Observation and thinking. Meteor. Mon. 2012, 38, 1255–1266. [Google Scholar] [CrossRef]
- Fu, J.L.; Ma, X.K.; Chen, T.; Zhang, F.; Zhang, X.D.; Sun, J.; Quan, W.Q.; Yang, S.N.; Shen, X.L. Characteristics and synoptic mechanism of the July 2016 extreme precipitation event in North China. Meteor. Mon. 2017, 43, 528–539. [Google Scholar] [CrossRef]
- Zhao, X.T.; Wang, X.f.; Wang, J.; Wang, X.K.; Xiao, Y.J.; Leng, L.; Fu, Z.K. Analysis of mesoscale characteristics of torrential rainfall in Hubei Province during 18–20 July 2016. Meteor. Mon. 2020, 46, 490–502. [Google Scholar] [CrossRef]
- Xu, G.Q.; Zhao, C.Y. Impact of background field in the numerical simulation of extremely severe rainstorm in Guangzhou on 7 May 2017. J. Meteor. Mon. 2019, 45, 1642–1650. [Google Scholar] [CrossRef]
- Wang, Z.Y.; Yao, C.; Dong, J.L.; Yang, H. Precipitation characteristic and urban flooding influence of “7·20” extreme rainstorm in Zhengzhou. J. Hohai Univ. 2022, 50, 17–22. [Google Scholar] [CrossRef]
- Wei, C.; Dong, X.; Yu, D.; Zhang, T.; Zhao, W.; Ma, Y.M. Spatio-temporal variations of rainfall erosivity, correlation of climatic indices and influence on human activities in the Huaihe River Basin, China. CATENA 2022, 217, 106486. [Google Scholar] [CrossRef]
- Matthews, F.; Panagos, P.; Verstraeten, G. Simulating event-scale rainfall erosivity across European climatic regions. CATENA 2022, 213, 106157. [Google Scholar] [CrossRef]
- Diodato, N.; Borrelli, P.P.; Bellocchi, G. Global assessment of storm disaster-prone areas. PLoS ONE 2022, 17, e0272161. [Google Scholar] [CrossRef]
- Ponjiger, T.M.; Lukić, T.; Basarin, B.; Jokic, M.; Wilby, R.L.; Pavić, D.; Mesaroš, M.; Valjarević, A.; Milanovic, M.; Morar, C. Detailed analysis of spatial–temporal variability of rainfall erosivity and erosivity density in the central and southern Pannonian basin. Sustainability 2021, 13, 13355. [Google Scholar] [CrossRef]
- Zhang, J.P.; Ren, Y.L.; Jiao, P.; Xiao, P.Q.; Li, Z. Changes in rainfall erosivity from combined effects of multiple factors in China’s Loess Plateau. CATENA 2022, 216, 106373. [Google Scholar] [CrossRef]
- Bezak, N.; Mikoš, M.; Borrelli, P.; Liakos, L.; Panagos, P. An in-depth statistical analysis of the rainstorms erosivity in Europe. Catena. CATENA 2021, 206, 105577. [Google Scholar] [CrossRef]
- Yang, Y.D.; Xu, Z.R.; Zheng, W.W.; Wang, S.H.; Kang, Y.B. Rain belt and flood peak: A study of the extreme precipitation event in the Yangtze river basin in 1849. Water 2021, 13, 2677. [Google Scholar] [CrossRef]
- Jia, L.; Li, Z.B.; Li, P.; Zhang, J.Z.; Wang, A.N.; Ma, L.; Xu, G.C.; Zhang, X. Temporal and spatial variation of rainfall erosivity in the Loess Plateau of China and its impact on sediment load. CATENA 2022, 210, 105931. [Google Scholar] [CrossRef]
- Wang, L.P.; Wang, X.R.; Wang, W.G. Research and application of comprehensive intensity evaluation method for regional rainfall process in China. J. Nat. Disasters 2015, 24, 186–194. [Google Scholar] [CrossRef]
- Zou, Y.; Ye, D.X.; Lin, Y.; Liu, A.M. A quantitative method for assessment of regional rainstorm intensity. J Appl. Meteor. Sci. 2014, 25, 360–364. [Google Scholar]
- Han, X.J.; Sum, X.W.; Li, S.; Wang, M.H.; Li, G.X.; Chen, Y.; Wang, G.C. Disaster-causing index of rainstorm and preassessment of disaster effect in Liaoning province. J. Meteorol. Environ. 2014, 30, 80–84. [Google Scholar] [CrossRef]
- Chen, H. Projected change in extreme rainfall events in China by the end of the 21st century using CMIP5 models. Chin. Sci. Bull. 2013, 58, 1462–1472. [Google Scholar] [CrossRef] [Green Version]
- Chen, H.; Sun, J. Increased population exposure to precipitation extremes in China under global warming scenarios. Atmos. Ocean. Sci. Lett. 2020, 13, 63–70. [Google Scholar] [CrossRef] [Green Version]
- Patricola, C.M.; Wehner, M.F. Anthropogenic influences on majortropical cyclone events. Nature 2018, 563, 339–346. [Google Scholar] [CrossRef] [Green Version]
- Wang, G.; Wang, D.; Trenberth, K.E.; Erfanian, A.; Yu, M.; Bosilovich, M.G.; Parr, D.T. The peak structure and future changes of the relationships between extreme precipitation and temperature. Nat. Clim. Change 2017, 7, 268–274. [Google Scholar] [CrossRef]
- Scoccimarro, E.; Gualdi, S.; Bellucci, A.; Zampieri, M.; Navarra, A. Heavy precipitation events in a warmer climate: Results from CMIP5 models. J. Clim. 2013, 26, 7902–7911. [Google Scholar] [CrossRef]
- Trenberth, K.E.; Fasullo, J.T.; Shepherd, T.G. Attribution of climate extreme events. Nat. Clim. Change 2015, 5, 725–730. [Google Scholar] [CrossRef]
- Liu, Y.; Li, L.; Zhang, W.; Chan, P.; Liu, Y. Rapid identification of rainstorm disaster risks based on an artificial intelligence technology using the 2DPCA method. Atmos. Res. 2019, 227, 157–164. [Google Scholar] [CrossRef]
- Gao, T.; Wang, H. Trends in precipitation extremes over theYellow River Basin in North China: Changing properties and causes. Hydrol. Process. 2017, 31, 2412–2428. [Google Scholar] [CrossRef]
- Omer, A.; Elagib, N.A.; Zhuguo, M.; Saleem, F.; Mohammed, A. Water scarcity in the Yellow River Basin under future climate change and human activities. Sci. Total Environ. 2020, 749, 141446. [Google Scholar] [CrossRef] [PubMed]
- Yuan, Z.; Yan, D.; Yang, Z.; Xu, J.; Huo, J.; Zhou, Y.; Zhang, C. Attribution assessment and projection of natural runoff change in theYellow River Basin of China. Mitig. Adapt. Strateg. Glob. Change 2016, 23, 27–49. [Google Scholar] [CrossRef]
- Li, C.; Jian, T.; Wang, Y.J.; Miao, L.J.; Li, S.Y.; Chen, Z.Y.; Lü, Y.R. Simulation and estimation of future air temperature in upper basin of the Yellow River based on CMIP6 models. J. Glaciol. Geocryol. 2022, 44, 171–178. [Google Scholar] [CrossRef]
- Chen, H.P.; Sun, J.Q.; Lin, W.Q.; Xu, H.W. Comparison of CMIP6 and CMIP5 models in simulating climate extremes. Sci. Bull. 2020, 65, 1415–1418. [Google Scholar] [CrossRef]
- Zhai, J.; Mondal, S.K.; Fischer, T.; Wang, Y.; Su, B.; Huang, J.; Tao, H.; Wang, G.; Ullah, W.; Uddin, J. Future drought characteristics through a multi-model ensemble from CMIP6 over South Asia. Atmos. Res. 2020, 246, 105111. [Google Scholar] [CrossRef]
- Sui, X.; Qi, Y. Dynamic assessment of ecological carrying capacity of Yellow River Basin in Qinghai province. Chin. J. Ecol. 2007, 26, 406–412. [Google Scholar]
- Taylor, K.E.; Stouffer, R.J.; Meehl, G.A. An overview of CMIP5 and the experiment design. Bull. Am. Meteorol. Soc. 2012, 93, 485–498. [Google Scholar] [CrossRef] [Green Version]
- Sillmann, J.; Kharin, V.; Zwiers, F.W.; Zhang, X.; Bronaugh, D. Climate extremes indices in the CMIP5 multimodel ensemble: Part 2. future climate projections. JGR Atmos. 2013, 118, 2473–2493. [Google Scholar] [CrossRef]
- Kharin, V.V.; Zwiers, F.W.; Zhang, X.; Wehner, M. Changes in temperature and precipitation extremes in the CMIP5 ensemble. Clim. Change 2013, 119, 345–357. [Google Scholar] [CrossRef]
- O’Neill, B.C.; Kriegler, E.; Ebi, K.L.; Benedict, E.K.; Riahi, K.; Rothman, D.S.; van Ruijven, B.J.; van Vuuren, D.P.; Birkmann, J.; Kok, K.; et al. The roads ahead: Narratives for shared socioeconomic pathways describing world futures in the 21st century. Glob. Environ. Change 2017, 42, 169–180. [Google Scholar] [CrossRef] [Green Version]
- Gao, J. Global 1-km Downscaled Population Base Year and Projection Grids Based on the Shared Socioeconomic Pathways; NASA Socioeconomic Data and Applications Center (SEDAC): Palisades, NY, USA, 2020. [Google Scholar] [CrossRef]
- Administration for Market Regulation of Qinghai Province. Classification Index of Meteorological Disasters (DB63/T372-2018); Administration for Market Regulation of Qinghai Province: Xining, China, 2018; p. 9.
- Zhou, B.T.; Yu, L. Managing climate disaster risks and promoting climate change adaptation. Disaster Reduct. China 2012, 174, 18–19. [Google Scholar]
- Rupp, D.E.; Abatzoglou, J.T.; Hegewisch, K.C.; Mote, P.W. Evaluation of CMIP5 20th century climate simulations for the Pacific Northwest USA. Geophys. Res. Atmos. 2013, 118, 10884–10906. [Google Scholar] [CrossRef]
- Delgado, A.; Romero, I. Environmental conflict analysis using an integrated grey clustering and entropy-weight method: A case study of a mining project in Peru. Environ. Model. Softw. 2016, 77, 108–121. [Google Scholar] [CrossRef]
- Wei, F.Y. Modern Techniques of Statistical Diagnosis and Prediction of Climate, 2nd ed.; Meteorological Press: Beijing, China, 2007. [Google Scholar]
- Yue, S.; Pilon, P.; Phinney, B.; Cavadias, G. The influence of autocorrelation on the ability to detect trends in hydrological series. Hydrol. Process. 2002, 16, 1807–1829. [Google Scholar] [CrossRef]
- Sun, S.; Dai, T.L.; Wang, Z.Y.; Ming, C.J.; Chao, Q.C.; Shi, P.J. Projected increases in population exposure of daily climate extremes in eastern China by 2050. Adv. Clim. Change Res. 2021, 12, 804–813. [Google Scholar] [CrossRef]
- Su, X.; Shao, W.W.; Liu, J.H.; Jiang, Y.Z.; Wang, K.B. Dynamic Assessment of the Impact of Flood Disaster on Economy and Population under Extreme Rainstorm Events. Remote Sens. 2021, 13, 3924. [Google Scholar] [CrossRef]


Publisher’s Note: MDPI stays neutral with regard to jurisdictional claims in published maps and institutional affiliations. |
© 2022 by the authors. Licensee MDPI, Basel, Switzerland. This article is an open access article distributed under the terms and conditions of the Creative Commons Attribution (CC BY) license (https://creativecommons.org/licenses/by/4.0/).
Share and Cite
Li, W.; Chen, R.; Sun, S.; Yu, D.; Wang, M.; Liu, C.; Qi, M. Characteristics of Rainstorm Intensity and Its Future Risk Estimation in the Upstream of Yellow River Basin. Atmosphere 2022, 13, 2082. https://doi.org/10.3390/atmos13122082
Li W, Chen R, Sun S, Yu D, Wang M, Liu C, Qi M. Characteristics of Rainstorm Intensity and Its Future Risk Estimation in the Upstream of Yellow River Basin. Atmosphere. 2022; 13(12):2082. https://doi.org/10.3390/atmos13122082
Chicago/Turabian StyleLi, Wanzhi, Ruishan Chen, Shao Sun, Di Yu, Min Wang, Caihong Liu, and Menziyi Qi. 2022. "Characteristics of Rainstorm Intensity and Its Future Risk Estimation in the Upstream of Yellow River Basin" Atmosphere 13, no. 12: 2082. https://doi.org/10.3390/atmos13122082