Article

Assessment of Long-Term Rainfall Variability and Trends Using Observed and Satellite Data in Central Punjab, Pakistan

1
School of Ecological and Environmental Sciences, East China Normal University, Shanghai 200241, China
2
State Key Laboratory of Cryospheric Sciences, Northwest Institute of Eco-Environment and Resources, Chinese Academy of Sciences, Donggang West Rd. 318, Lanzhou 730000, China
3
Department of Environmental and Conservation Sciences, University of Swat, Mingora Swat 19130, Pakistan
4
School of Geographic and Oceanographic Sciences, Nanjing University, Nanjing 210023, China
5
Department of Geography, GC University Lahore, Lahore 54000, Pakistan
6
Department of Plant Pathology, College of Plant Protection, China Agricultural University, Beijing 100193, China
*
Authors to whom correspondence should be addressed.
Atmosphere 2023, 14(1), 60; https://doi.org/10.3390/atmos14010060
Submission received: 11 November 2022 / Revised: 22 December 2022 / Accepted: 23 December 2022 / Published: 28 December 2022

Abstract

:
This study explores the spatio-temporal distribution and trends on monthly, seasonal, and annual scales of rainfall in the central Punjab districts of Punjab province in Pakistan by using observation and satellite data products. The daily observed data was acquired from the Pakistan Metrological Department (PMD) between 1983 and 2020, along with one reanalysis, namely the Climate Hazard Infrared Group Precipitation Station (CHIRPS) and one satellite-based daily Precipitation Estimation from Remotely Sensed Information Using Artificial Neural Networks climate data record (PERSIANN-CDR) using the Google Earth Engine (GEE) web-based API platform to investigate the spatio-temporal fluctuations and inter-annual variability of rainfall in the study domain. Several statistical indices were employed to check the data similarity between observed and remotely sensed data products and applied to each district. Moreover, non-parametric techniques, i.e., Mann–Kendall (MK) and Sen’s slope estimator were applied to measure the long-term spatio-temporal trends. Remotely sensed data products reveal 422.50 mm (CHIRPS) and 571.08 mm (PERSIANN-CDR) mean annual rainfall in central Punjab. Maximum mean rainfall was witnessed during the monsoon season (70.5%), followed by pre-monsoon (15.2%) and winter (10.2%). Monthly exploration divulges that maximum mean rainfall was noticed in July (26.5%), and the minimum was in November (0.84%). The district-wise rainfall estimation shows maximum rainfall in Sialkot (931.4 mm) and minimum in Pakpattan (289.2 mm). Phase-wise analysis of annual, seasonal, and monthly trends demonstrated a sharp decreasing trend in Phase-1, averaging 3.4 mm/decade and an increasing tendency in Phase-2, averaging 9.1 mm/decade. Maximum seasonal rainfall decreased in phase-1 and increased Phase-2 during monsoon season, averaging 2.1 and 4.7 mm/decade, whereas monthly investigation showed similar phase-wise tendencies in July (1.1 mm/decade) and August (2.3 mm/decade). In addition, as district-wise analyses of annual, seasonal, and monthly trends in the last four decades reveal, the maximum declined trend was in Sialkot (18.5 mm/decade), whereas other districts witnessed an overall increasing trend throughout the years. Out of them, Gujrat district experienced the maximum increasing trend in annual terns (50.81 mm/decade), and Faisalabad (25.45 mm/decade) witnessed this during the monsoon season. The uneven variability and trends have had a crucial imprint on the local environment, mainly in the primary activities.

1. Introduction

Rainfall is a key component and also a significant contributor to the global energy and water cycle for determining the overall hydro-meteorology of any region [1,2]. Rainfall has a various range of impressions on human civilization, agricultural applications [3], regional biodiversity [4], vegetation distribution and growth, local water supply, hydropower projects [5], and the inclusive geo-ecological equilibrium of a particular region [6]. In past decades, global rainfall pattern, distribution and trends have unfortunately witnessed an irregular nature, which resulted in drought [7], immense flooding [8], large-scale cloud burst, and significant damage in terms of property and infrastructure [9]. It is supposed that alterations in rainfall patterns would be linked to global temperature rises [10]. Recent studies suggested a declining annual trend over central Asia in the last few decades [2], whereas Banerjee et al. [11] reported a slightly increasing trend in annual, seasonal, and monthly rainfall over the north-west Himalayan region from 2000 to 2022. Moreover, additional studies have also reported an increasing trend of annual rainfall in the Hindu Kush Himalayan Region [12], while Zhang et al. 2014 [13] found a slightly decreasing tendency of annual and seasonal rainfall in China’s Yellow River Basin. Several current studies in Pakistan found uneven rainfall patterns from 1980 to 2020, where Nawaz et al. [14] noticed an increasing rainfall trend in Punjab province using numerous remotely sensed gridded datasets. On the other hand, Nawaz et al. [15] observed an uneven distribution of trends in Punjab province with increased air temperature in the last 50 years. They further examined the dependency of elevation on rainfall trends and found higher elevation regions experienced decreased amounts of rainfall with increased air temperature, whereas lower elevation regions witnessed increased rainfall. Various other studies have been performed to estimate rainfall distribution and trends in Pakistan and noticed an overall increased trend at annual and seasonal scales in the last four decades [2,16,17]. Ullah et al. [2] reported a declined trend in winter and post-monsoon periods and an increased trend during monsoon periods, pre-monsoon periods, and winter, averaging 0.9 mm/decade from 1980 to 2016. Pakistan is a highly agriculture-dependent country, and Punjab province is the largest agricultural region [14], covering 100% of the nation’s annual food demand. It is a well-established fact that rainfall is very crucial for agricultural productivity and irrigation. Thus, it is identically important to study the rainfall dynamics and their long-term variability in Punjab province, Pakistan. During the last four decades, this region has witnessed uneven alterations of rainfall dynamics and allied agricultural productivity. Decreased rainfall after the 1980s had critically impacted on agricultural production, which further coped with abrupt changes after 2002 [14,15]. The central Punjab region is mostly dominated by the monsoonal rainfall (>70%) [2,16,18], whereas moisture coming from the Bay of Bengal gradually transfers towards the central Punjab region because of the low-pressure zone at the Pamir region due to high temperatures [2,16]. Additionally, winter rainfall in the central Punjab region mainly occurred due to the western disturbances, the presence of jet streams, and the returning monsoon [2]. Ullah et al. [2] reported significant changes in seasonal rainfall, where abrupt decline alteration was reported during the pre-monsoon and winter season before 2000; afterward, a slight increased tendency has been reported using 53 rainfall stations. However, the availability of station-based observed data is very limited throughout Pakistan as well as in Punjab province, so relying on high-resolution remotely sensed data is the best option to cope with the station data scarcity [19,20]. Various satellite observations are obtainable, such as Multi-satellite Precipitation Analysis (TMPA) [21], Tropical Rainfall Measuring Mission (TRMM) [22], Climate Prediction Centre MORPHing product (CMORH) [23], Climate Hazard Group Infrared Precipitation with Stations (CHIRPS) [24], Multi-source Weighted-Ensemble Precipitation (MSWEP) [25], the Precipitation Estimation from Remotely Sensed Information using Artificial Neural Network (PERSIANN-CDR) [26], Global Precipitation Measurement (GPM), and the Asian Precipitation-Highly-Resolved Observational Data Integration Towards Evaluation (APHRODITE) [27]. A few recent studies were carried out in India and Pakistan on the performance checking of gridded datasets using numerous statistical applications and found that CHIRPS and PERSIANN-CDR datasets properly capture the rainfall events as compared to station data [2,6,11,14,15].
By considering the seasonality, variability, long-term trends, and distribution of rainfall in the highest food production region in the country, this exploration aims to study the spatio-temporal and inter-decadal dynamics in the last 38 years of rainfall in 19 districts of central Punjab province.
The objectives of this study are described as follows:
  • Collect, calculate, and analyze the CHIRPS and PERSIANN-CDR gridded rainfall products with surface observatories data from PMD of a chosen region;
  • Map seasonal, annual, and monthly rainfall variability and trends with suitable performance analysis with in situ data;
  • Determine long-term inter-decadal district-wise distribution and trends of rainfall on monthly, seasonal, and annual scales for the period of 1983–2020 by using non-parametric tests.
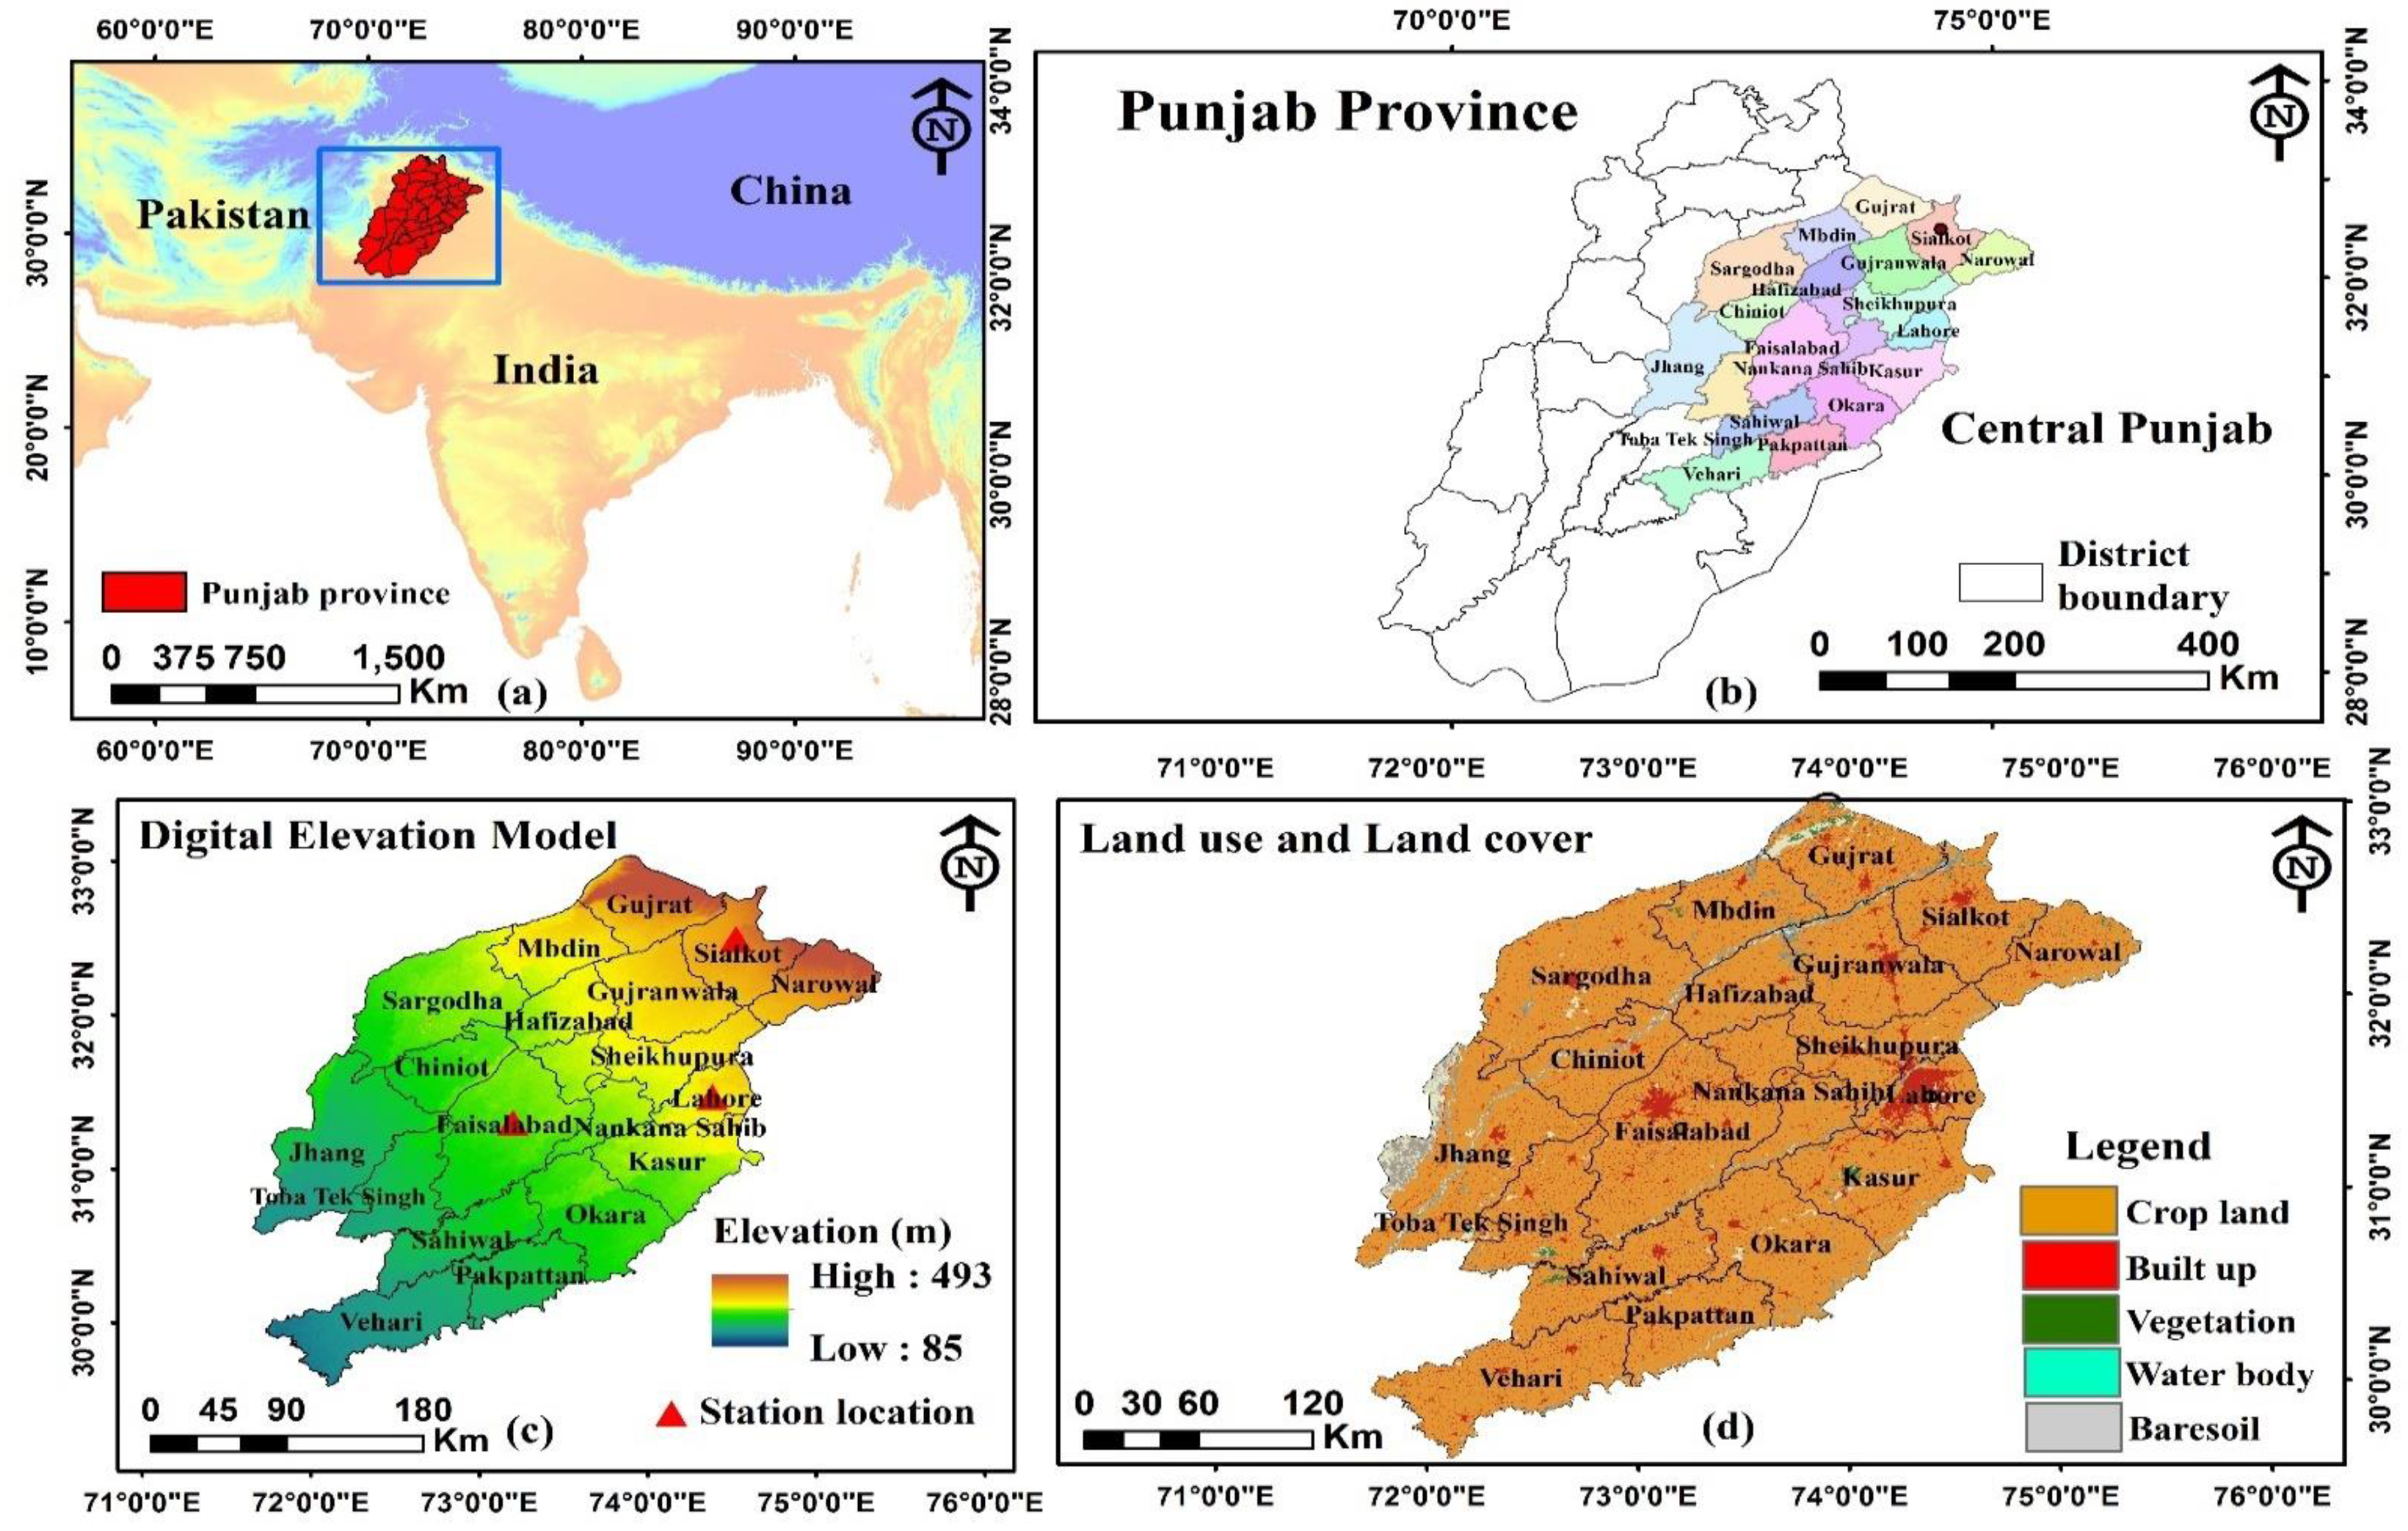
2. Study Area

With a total area of 205,344 sq. km, Punjab is the most populous and second largest province in Pakistan after Baluchistan, with geographical coordinates of 31.17° N and 72.70° E (Figure 1). From the total area of Punjab province, the 19 districts of central Punjab consist of 68,577 sq. km, which is 33.39% of the total. Of 110.01 million people live in Punjab province, and 63.67 million live in 19 districts of central Punjab, which is 58% of the total. Due to canal irrigation and rainfall, especially in summer, a significant part of agricultural products is produced in central Punjab [28,29,30]. In Punjab province, central Punjab districts produced 45% of wheat, 69% of corn, and 83% of rice in 2019–2020. Climatologically, this area is located in the subtropical dry region, having mean annual temperature ranges between 16.3 °C to 29.3 °C. Rainfall of this region varies from south–central to north-eastern, whereas it reaches its maximum during the monsoon season (50–75%) [31]. The monsoon system provides the majority of rainfall, filling yearly agricultural needs in the central Punjab region [32]. Recent increased frequency of unpredictable occurrences of rainfall impacted rice, maize, wheat, sugarcane, and cotton production along with other minor crops, such as millet, vegetables, and tree fruits, including citrus and mango in the central Punjab districts, including Nankana Sahib, Sialkot, Gujranwala, Hafizabad, Sheikhupura, and Sargodha [33]. This region is fairly vulnerable to climate change because of the large variety and intense events that occur during the summer and winter monsoon precipitation seasons [34,35,36,37,38]. Spatial and temporal evaluation of the GPPs (gridded satellite precipitation products) is vital to examine in-depth hydro-meteorological scenarios across the study region, where observed data are inadequate.

3. Materials and Methods

3.1. Observed Data

Daily rainfall surface observatory data of three selected stations were obtained from the Climate Data Processing Centre (CPCD) of the Pakistan Meteorological Department (PMD) for the period of 38 years (1983–2020) (Table 1). Station-observed data is already quality-controlled and has been situated at the same place for the last four decades by PMD (except in Sargodha where PMD handed over the task to the Pakistan Air Force in 2016) for calculating long-term variability [2,14]. Therefore, our prime considerations to select the data were (i) recent time and long-term data availability, and (ii) fewer data gaps, as seen in Table 1.

3.2. Remotely Sensed Data

Two different sources of precipitation datasets were obtained and used; one was the CHIRPS, and the second was the PERSIANN-CDR satellite-based data. Both were extracted through the Google Earth Engine (GEE) web-based remote sensing platform for the period of 1983–2020 (Table 1). The CHIRPS data is a combination of in situ, satellite and global precipitation prediction system (https://www.chc.ucsb.edu, accessed at 10 November 2022), which was taken from the Climate Hazard Group website with the help of GEE [6]. The PERSIANN-CDR dataset is available via the NOAA National Centers for Environmental Information (NCEI) program (https://www.ncdc.noaa.gov/cdr, accessed at 10 November 2022) and was also taken from GEE via the CHRS data portal (http://chrsdata.eng.uci.edu, accessed at 10 November 2022) [39].

3.3. Data Processing and Statistical Application

Monthly, seasonal, and annual gridded rainfall products were assimilated from the GEE platform through the use of the ‘ee.ImageCollection’ algorithm and complete request of filter command (ee.Filter.calendarRange) for the study period (1983–2020) for this research. Subsequently, the ‘clip’ function was used to limit the study region and to extract the actual data as per the study domain. For matching similar spatial information with station data, the nearest point-pixel rainfall values of the gridded dataset were derived in GEE in accordance with station locations using GEE algorithms (the code can be found at Banerjee et al.) [6]. Afterward, pixel-based long-term spatio-temporal trends for gridded data sets were achieved in GEE by the use of the ‘ee.Reducer.senSlope’ algorithm. The gridded daily rainfall records were then aggregated to seasonal totals, namely pre-monsoon, monsoon, post-monsoon, and winter, and also on annual scale. As per recommendations by the Pakistan Meteorological Department (PMD), the season was considered in the following way: winter = January and February; pre-monsoon = March, April, and May; monsoon = June, July, August, and September; post-monsoon = October, November, and December [36,40,41]. To calculate the long-term trend, the serial auto-correlation technique has been employed to check the data similarity of a particular time-series, and then non-parametric techniques i.e., Mann–Kendall (MK) and Sen’s slope estimator were applied to check the statistical significance and actual amount of alteration throughout the decades for two distinctive phases (1983–2001 and 2002–2022) at the 95% significance level [6,11], as per the status of long-term rainfall distribution and observed abrupt changes after 2001 due to the remarkable presence of the EL Nino (1998) and subsequent rapid increase in temperature and decreased rainfall pattern throughout the country [40]. Previous studies in this region also highlighted changing pattern of rainfall after 2002, so that we divide the entire study period into two phases to investigate inter-decal rainfall variability and trends (Figure S1) [14,15,40]. All of the significance tests and trend calculations at annual, seasonal, and monthly scales were performed using the GEE web-based API platform and MATLAB programming language.
The observed rainfall of three stations in central Punjab on a daily scale were obtained from the PMD archive for the period of 1983 to 2020. The missing values of possible stations were filled by taking long-term daily averages [6]. Observed rainfall records in a region, such as central Punjab, are scarce and unobtainable, because most of the rainfall data stations were established after 2004, so accessing long-term observed empirical data is still a big challenge for the research community. To ensure that high-quality satellite rainfall data concerning the station-observed data could be used for further investigation, several descriptive statistics were then applied to check data distribution and the relative performance of the gridded datasets. The statistical indices include (a) bias, (b) multiplicative bias (MBias), (c) relative bias (RBias), (d) mean error (ME), (e) mean absolute error (MAE), (f) root mean square error (RMSE), and (g) correlation coefficient (CC). To measure the uncertainty and assess the level of inaccuracy in an averaging of large-scale estimates, the following approaches were used: (i) cumulative distribution frequency (CDF) and (j) the Taylor diagram; all of the mathematical equations can be found in Banerjee et al. [6].

4. Results

4.1. The Outcome from Descriptive Statistics

Descriptive statistics revealed a blend of under- (PERSIANN-CRD) and over-estimation (CHIRPS) (Table 2) of rainfall counts as per the observed data. The ME value showed that both CHIRPS (−0.19 mm) and PERSIANN-CDR (−0.12 mm) slightly underestimate the daily rainfall at the Lahore and Sialkot stations, while at the Faisalabad station CHIRPS (−0.11 mm) closely underestimated the rainfall, and PERSIANN-CDR (0.08 mm) overestimated the rainfall (Table 2) at daily scales. The lower value of RMSE at three stations indicates a good spatial association between in situ and remotely sensed data products. The MAE value of both datasets is in the range of 1.64 mm to 2.82 mm, which indicates that gridded data is finely fitted with observed data with the least mean absolute error. A very small or negligible parentage spatial bias for three stations was observed through CHIRPS (0.23 mm to 0.28 mm) and PERSIANN-CDR (−0.1 to 0.155 mm) data. The low values of MBias (−0.61 to −1.5) indicate the less systematic errors within the datasets. The correlation coefficient (CC) and linear regression for both the gridded and station data showed a strong association (Figure 2) in terms of monthly rainfall distribution. The association of CHIRPS (r = 0.78) is relatively better as compared to PERSIANN-CDR (r = 0.76). The maximum correlation coefficient value was noticed at the Lahore station, followed by Faisalabad and Sialkot (Table 2). Additionally, the cumulative distribution frequency (CDF) graph shows the spatial distribution for average monthly rainfall (Figure 2e), which presents that more than 90% of mean monthly rainfall is evenly distributed among CHIRPS, PERSIANN-CDR, and surface observatories.

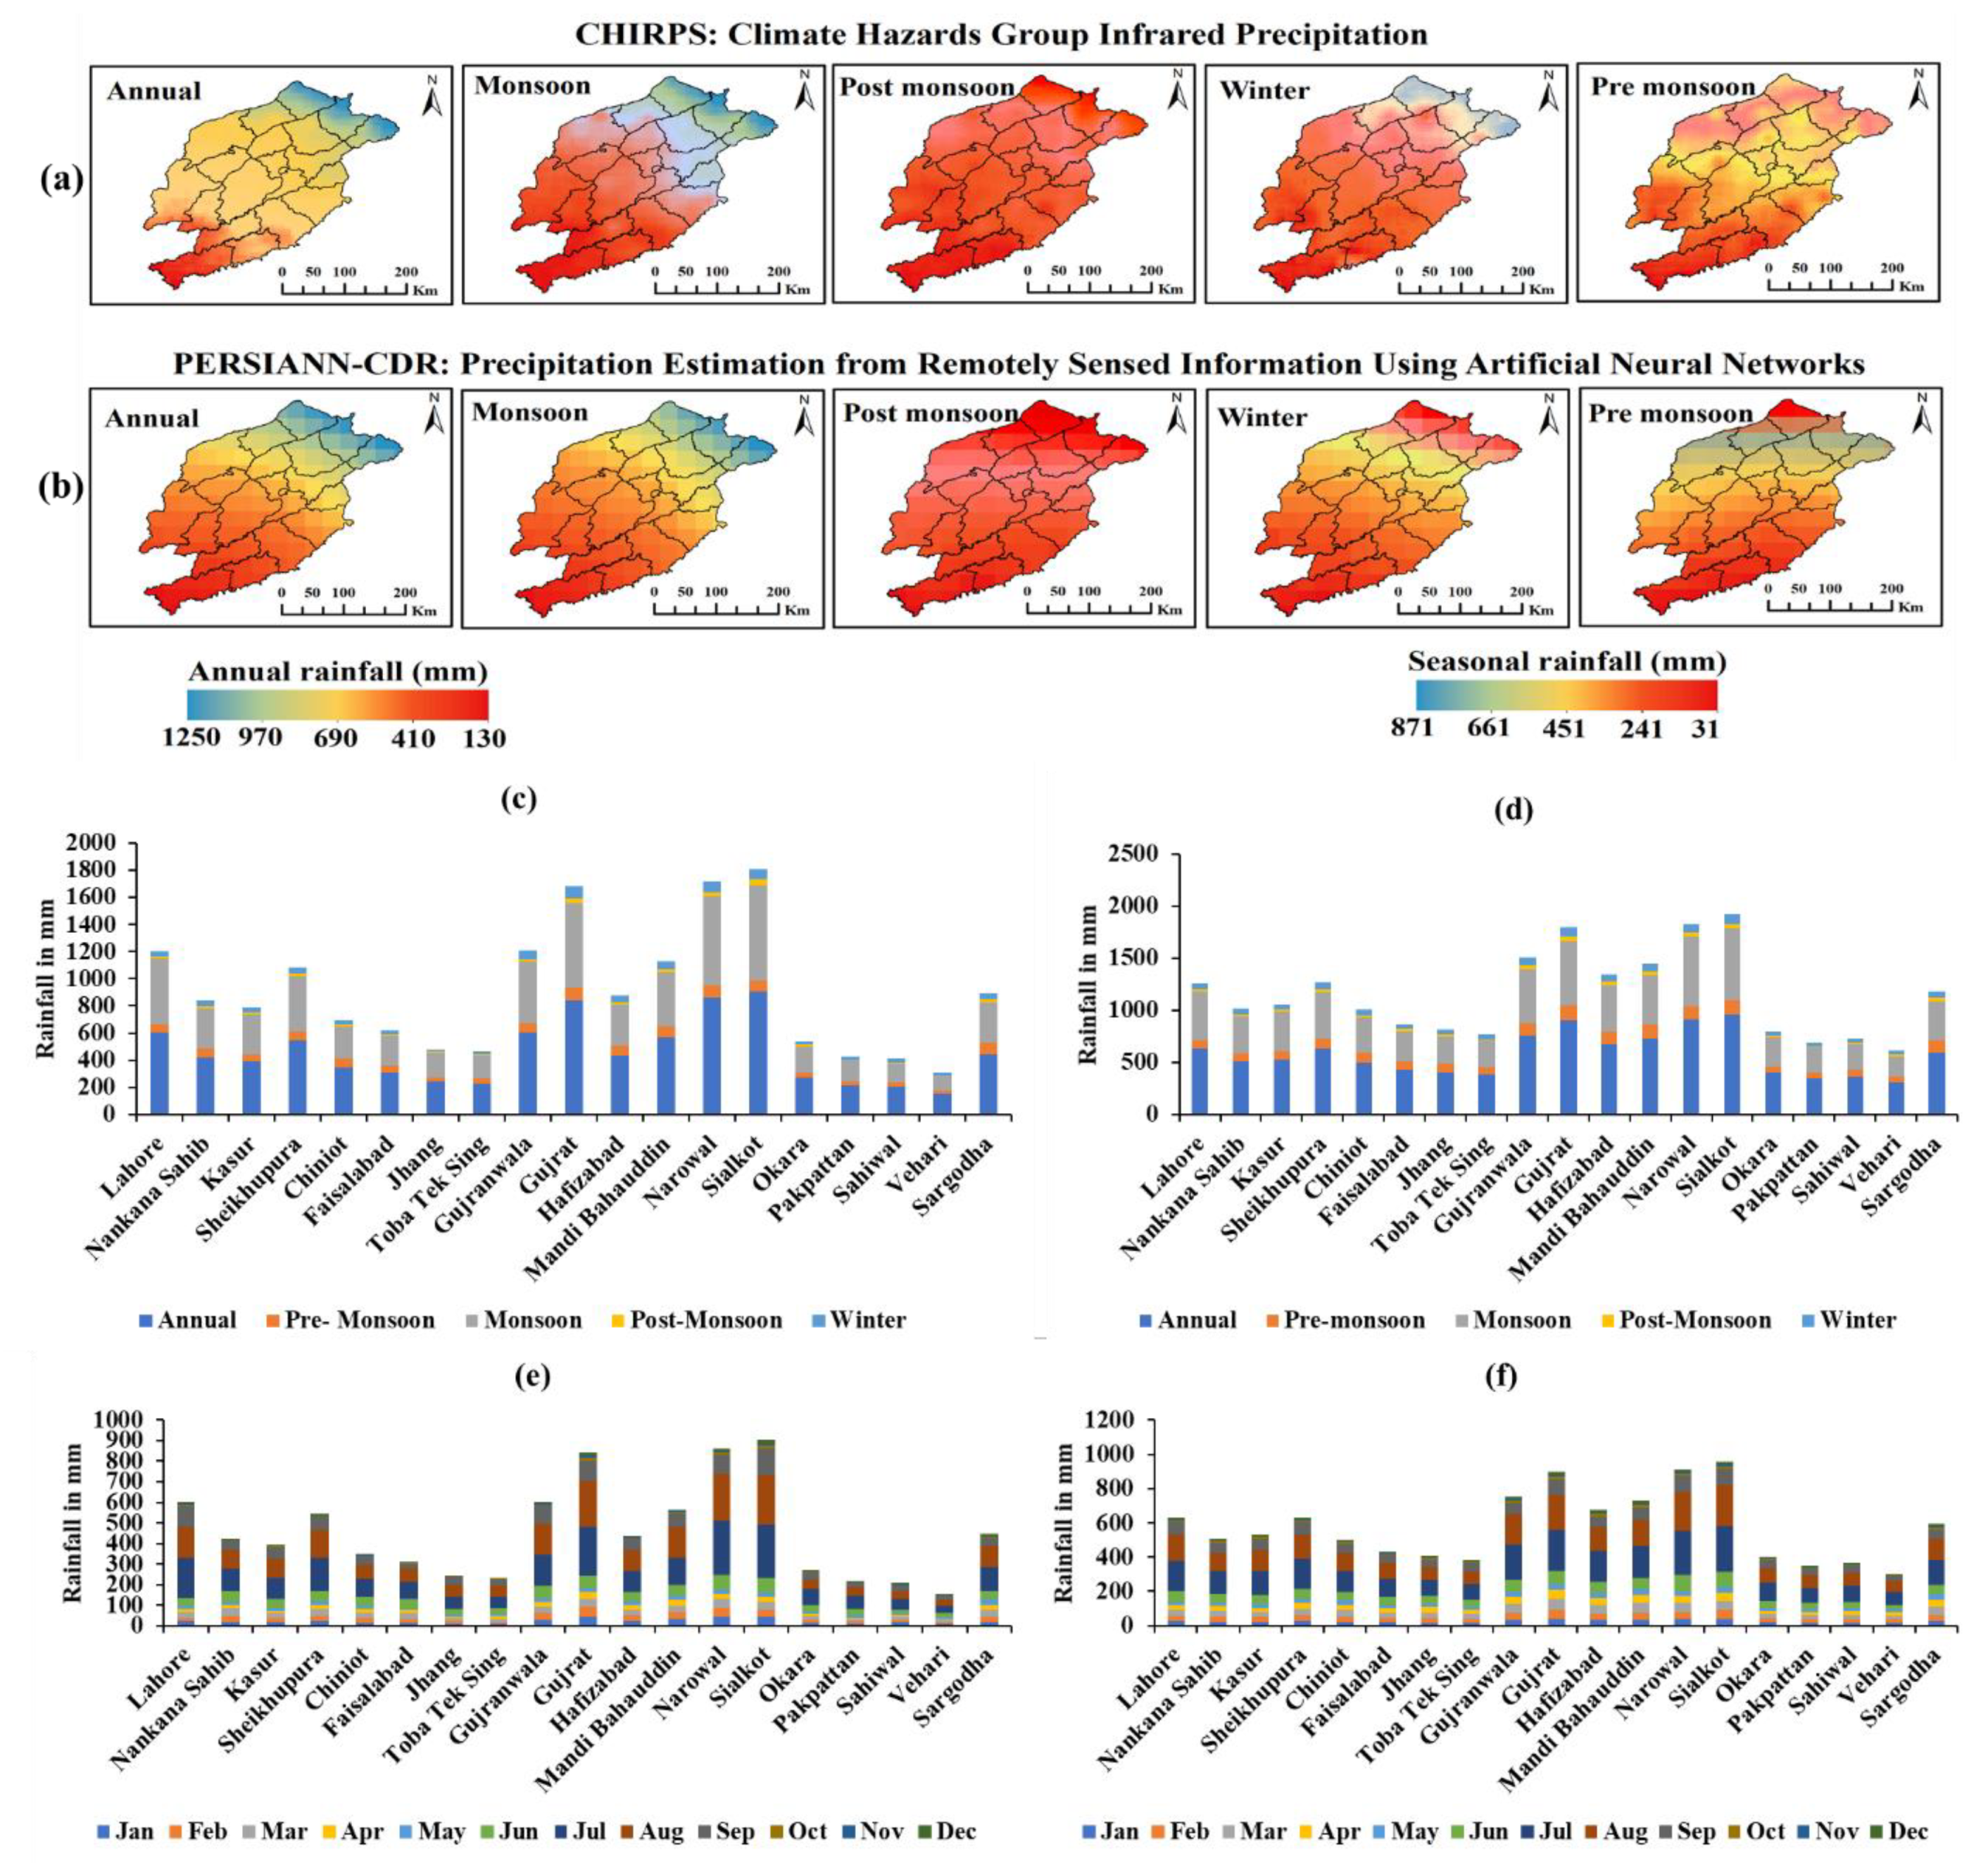
4.2. Phase-Wise Annual, Seasonal and Monthly Distribution of Rainfall in Central Punjab (CHIRPS, PERSIANN-CDR)

Phase-wise annual, seasonal, and monthly distribution of rainfall in central Punjab have been determined using CHIRPS and PERSIANN-CDR (Figure 3) datasets. The mean annual investigation as per the CHIRPS data shows comparatively inferior rainfall in Phase-1 (385.8 mm) compared to Phase-2 (459.2 mm), whereas PERSIANN-CDR reveals relatively higher rainfall in the last four decades (Figure S2). The seasonal average of two distinctive phases shows that the maximum rainfall is during monsoon season (70.5%), followed by pre-monsoon (12.5%), and winter (9.6%) (Figure 3a,b). In addition to this, the mean monthly investigation exhibits maximum rainfall in July, August, and September, followed by January and February (Figure 3c,d).
Out of the two phases, maximum rainfall is observed in Phase-2, whereas dispersal of the PERSIANN-CDR exhibits relatively higher rainfall as compared to the CHIRPS data (Figure 3a–d).

4.3. District-Wise Distributions of Annual, Seasonal, and Monthly Rainfall (CHIRPS, PERSIANN-CDR)

District-wise distribution of mean annual, seasonal, and monthly rainfall has been carried out using CHIRPS and PERSIANN-CDR datasets for 38 years (1983–2020) in central Punjab (Figure 4). Maximum mean annual rainfall was experienced in Sialkot (904.2 mm), followed by Narowal (860.36 mm), and Gujrat (840.9 mm) as per the CHIRPS data, whereas PERSIANN-CDR data show the maximum rainfall as being in the Sialkot (958.46 mm), Narowal (912.9 mm), and Gujrat (898.78 mm) districts (Figure S2). Concurrently, the seasonal assessment reveals that maximum rainfall occurs in Sialkot (702.40 mm), followed by Narowal (656.7 mm), and Gujrat (618.00 mm), with the CHIRPS dataset during monsoon season (71.24% out of the total rainfall in central Punjab) (Table 3). Moreover, PERSIANN-CDR shows maximum rainfall during the same season in Sialkot (690.5 mm), Narowal (670.48 mm), and Gujrat (608.7 mm) districts (Figure 4a,b). Apart from the monsoon season, the pre-monsoon and winter seasons also received a significant amount of rain throughout the years; CHIRPS shows maximum rainfall in Gujrat (95.6 mm), followed by Sargodha (88.18 mm), and Narowal (87.4 mm) during the pre-monsoon season (14.74% out of the total rainfall in central Punjab), while PERSIANN-CDR highlights the maximum, albeit lower, rainfall as compared to CHIRPS in Gujrat (151.9 mm), Mandi Bahauddin (135.7 mm), and Sialkot (133.9 mm) (Figure 4c,d). Furthermore, maximum rainfall during winter season (9.96% out of the total rainfall in central Punjab) as per CHIRPS occurs in Gujrat (89.5 mm), Narowal (88.2 mm), and Sialkot (74.5 mm), where similar distribution pattern has been noticed in PERSIANN-CDR also. Furthermore, monthly exploration reveals maximum rainfall in June (43.6 mm), July (123.1 mm), August (109.9 mm), and September (56.7 mm) in CHIRPS data, while PERSIANN-CDR exhibits maximum rainfall in June (56.3 mm), July (151.9 mm), August (128.4 mm) and September (59.5 mm) (Figure 4e,f).
Monthly scale investigation revealed that maximum rainfall was noticed in June to September, averaging 19.5% of the total (Figure 4e,f), whereas December and January also experience remarkable rainfall throughout the years.

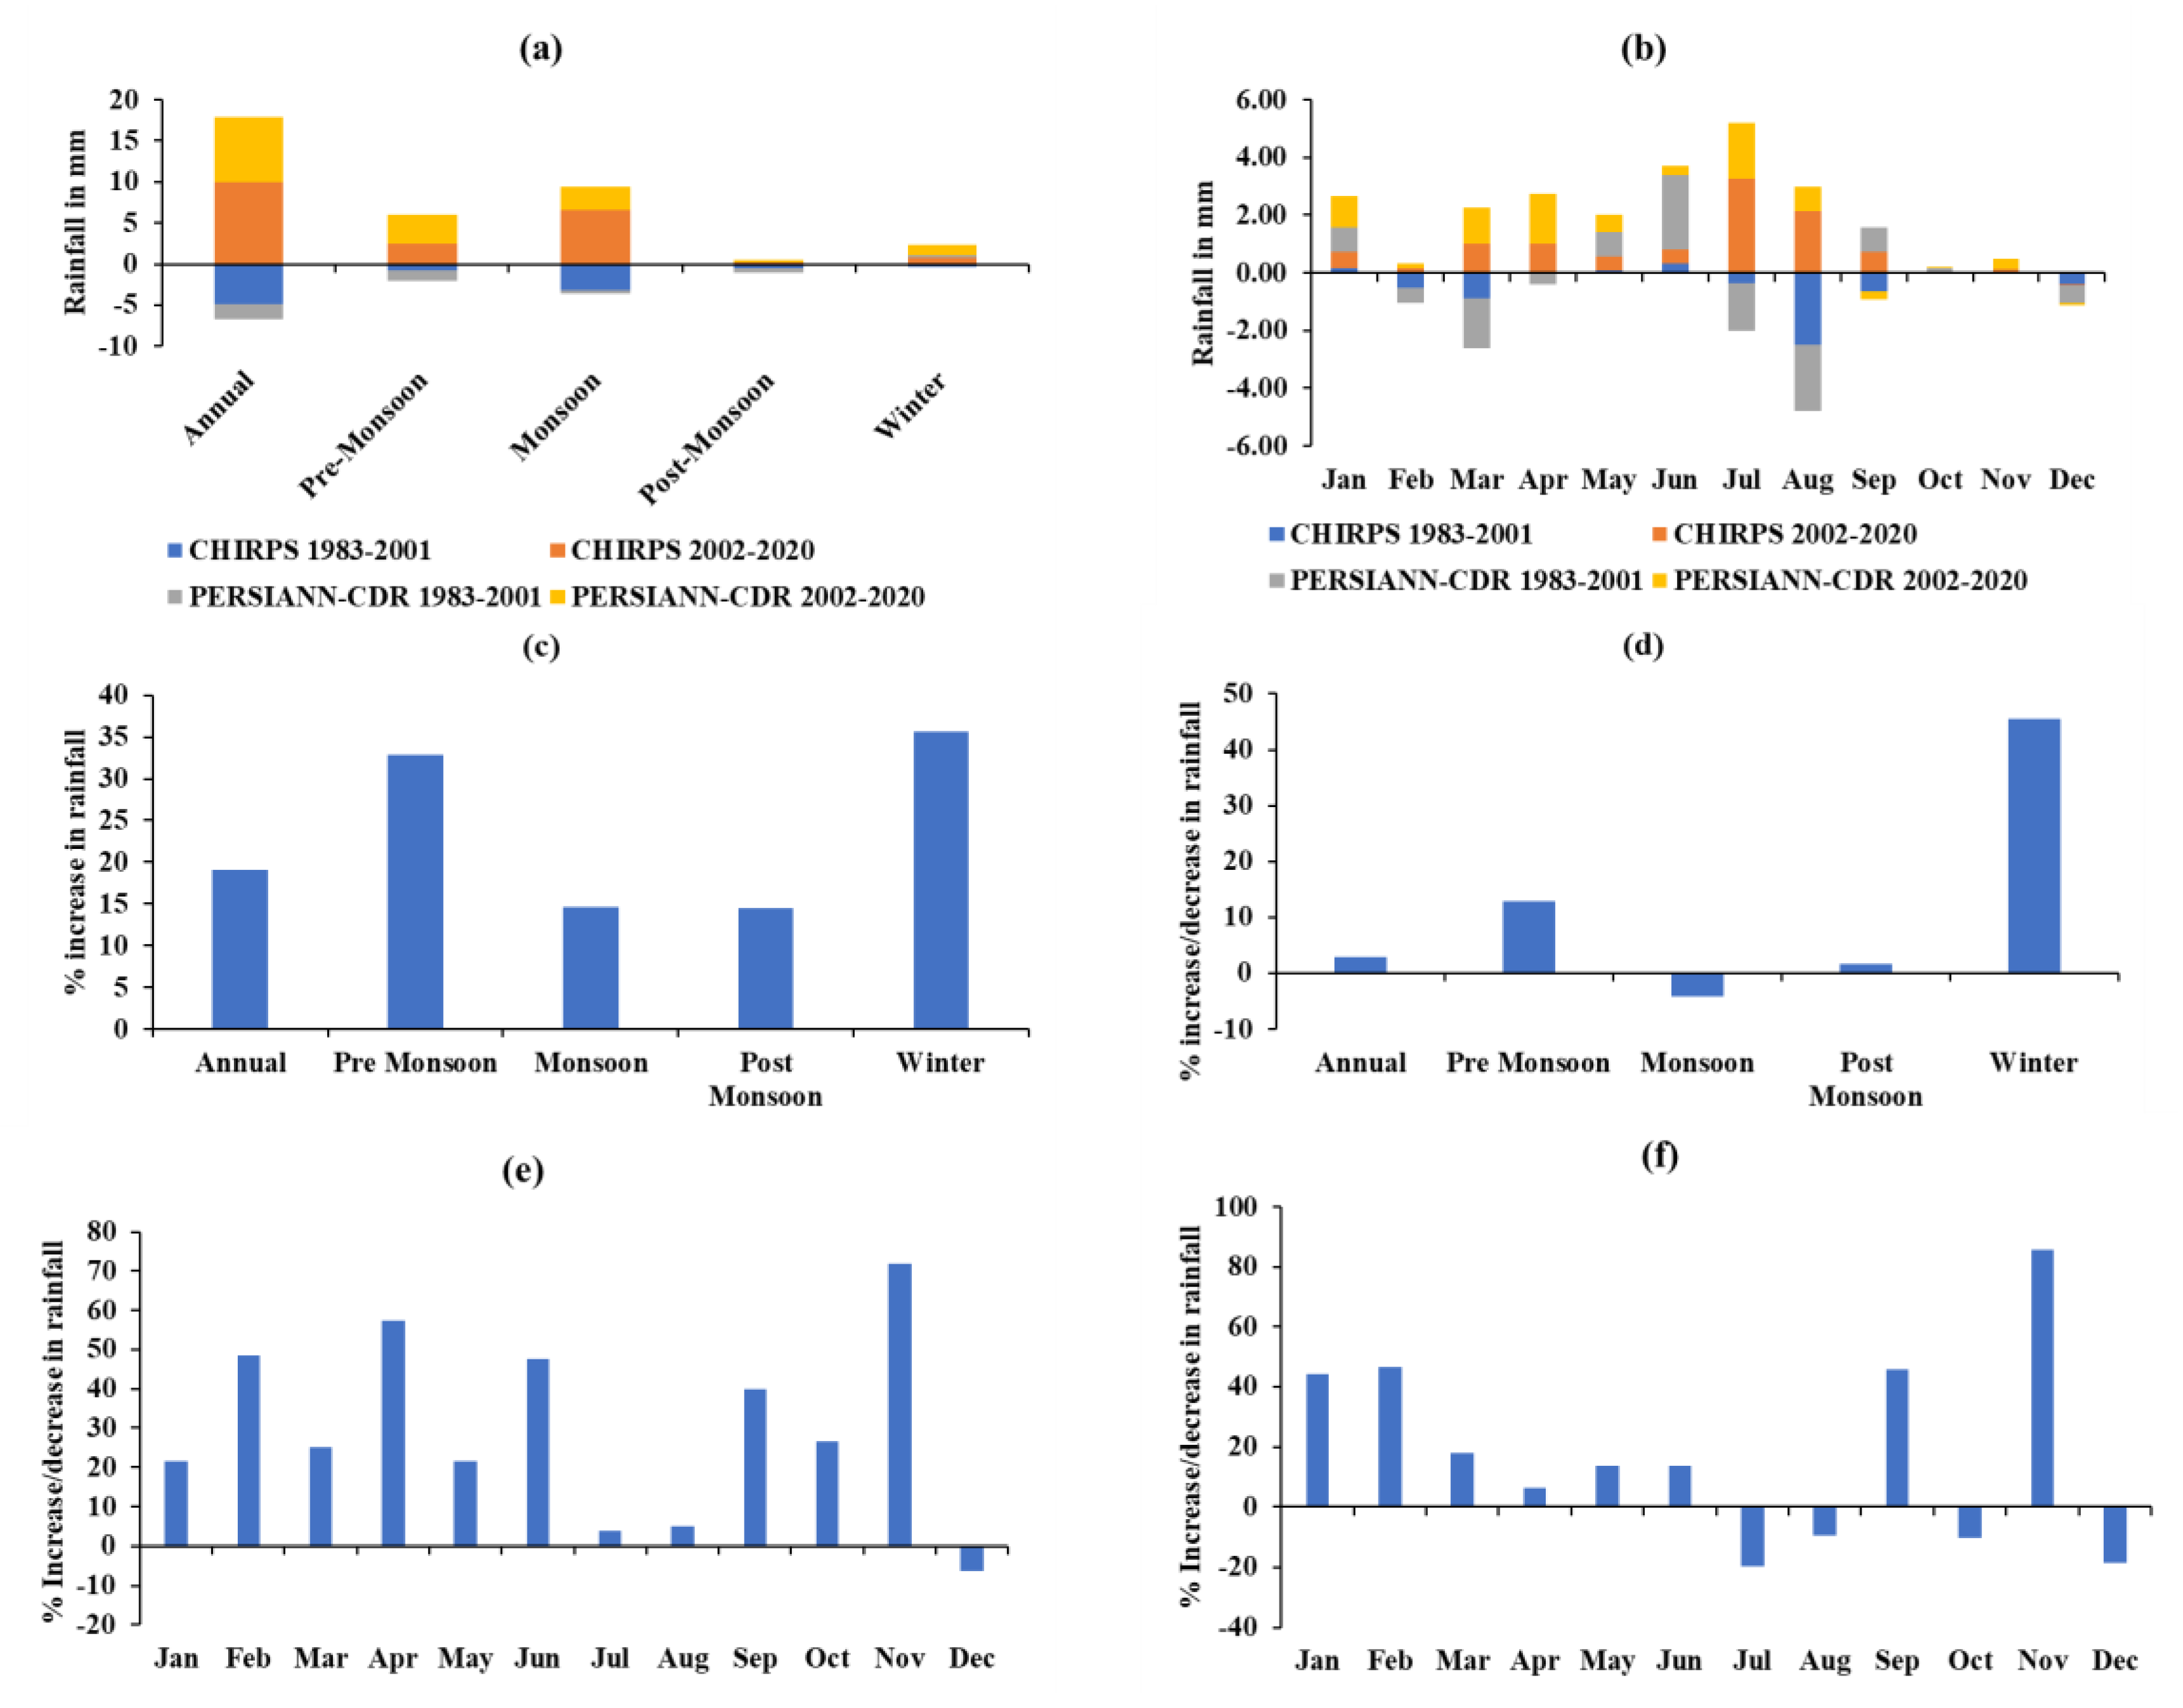
4.4. Phase-Wise Annual, Seasonal, and Monthly Trends of Rainfall in Central Punjab (CHIRPS, PERSIANN-CDR)

Phase-wise annual, seasonal, and monthly trends and also percentage change in rainfall in central Punjab using CHIRPS and PERSIANN-CDR datasets have been achieved (Figure 5). Both distinctive phases show a versatile temporal tendency, where Phase-1, annually detecting a statistically insignificant decreasing trend in both datasets, is an average of 5%/decade. Moreover, Phase-2 experiences a statistically significant increasing tendency in both datasets, around 19%/decade (Figure S2). Seasonal investigation exhibits an overall insignificant decreasing trend, averaging 14.3%/decade, except during post-monsoon season (−4.2%/decade) and winter (0.49 mm/decade). On the other hand, Phase-2 witnessed an overall statistically significant increasing trend in both the datasets, averaging 10.5 mm/decade (Figure 5a,b). Maximum seasonal trends occurred during monsoon season, followed by pre-monsoon and winter seasons (Figure 5a). Additionally, monthly exploration exhibits the uneven distribution of trend, where CHIRPS observed a maximum statistically significant reduction in Phase-1 in March (−28.5%/decade), followed by September, February, and December (Figure S2). Along with this, CHIRPS data during Phase-2 experienced an overall increasing trend, where the maximum statistically significant tendencies were observed in July (37.4%/decade) and April (13.3%/decade) (Figure 5e,f). However, PERSIANN-CDR witnessed relatively higher statistically significant changes in the month of April (31.4%/decade) and slightly lesser ones in June (26.8%/decade), as compared to CHIRPS data (Table S1).

4.5. District-Wise Trend of Annual, Seasonal and Monthly Rainfall (CHIRPS, PERSIANN-CDR)

The present study further investigates the district-wise rainfall trend of two gridded datasets for the last four decades. Out of 19 districts, CHIRPS showed a maximum annual statistically significant trend in Gujrat (50.8 mm/decade), followed by Narowal (47.9 mm/decade), Mandi Bahauddin (41.7 mm), Sarghoda (39.5 mm), and Sialkot (37.2 mm/decade) (Table S2). Contrary to this, PERSIANN-CDR demonstrated a relatively low tendency, where the maximum trend was observed in Chiniot (29.5 mm/decade). Seasonal investigation illustrates a significant increase during monsoon season in both datasets, where Gujrat witnessed a higher increasing trend (29.4 mm/decade) (Figure 6a,b). However, PERSIANN-CDR showed a moderately low seasonal tendency during the monsoon period, where maximum changes were noticed in Jhang (23.5 mm/decade) (Table S3). Additionally, pre-monsoon and winter seasons also experienced a statistically significant increasing trend throughout the years. Maximum changes were observed in Chiniot (10.2 mm/decade), followed by Faisalabad (10.1 mm/decade) and Toba Tek Singh (9.6 mm/decade), during pre-monsoon season. On the other hand, Gujrat witnessed the maximum changes during the winter season (11.8 mm/decade), followed by Sialkot (9.9 mm/decade), and Narowal (9.4 mm/decade).
In addition, the study further explores long-term monthly alteration using both the gridded datasets. Maximum significant increasing changes were noticed in Gujrat district in September (9.6 mm/decade), June (8.9 mm/decade), and July (7.3 mm/decade) based on CHIRPS data. On the other hand, PERSIANN-CDR showed maximum alteration in Kasur district (13.1 mm/decade), trailed by Nankana Sahib (12.4 mm/decade), and Okara (10.6 mm/decade) in September.

5. Discussion

In places where in-situ data is scarce, the use of remotely sensed rainfall data is critical for assimilation, estimation, and forecasting, as well as enhancing model simulation performance to well understand the land–atmosphere interactions [42,43]. In this study, we intensively examined the performance of gridded datasets using two surface observatories by employing several statistical indices and found more than 90% similar rainfall counts in the last 38 years (1983–2020). Investigations of monthly, seasonal (winter, pre-monsoon, monsoon, and post-monsoon), and annual distribution, and trends of rainfall, using non-parametric statistical techniques revealed 9.59 mm/decade to 50.81 mm/decade increase in rainfall annually in central Punjab districts in the last 38 years at the 95% confidence level.

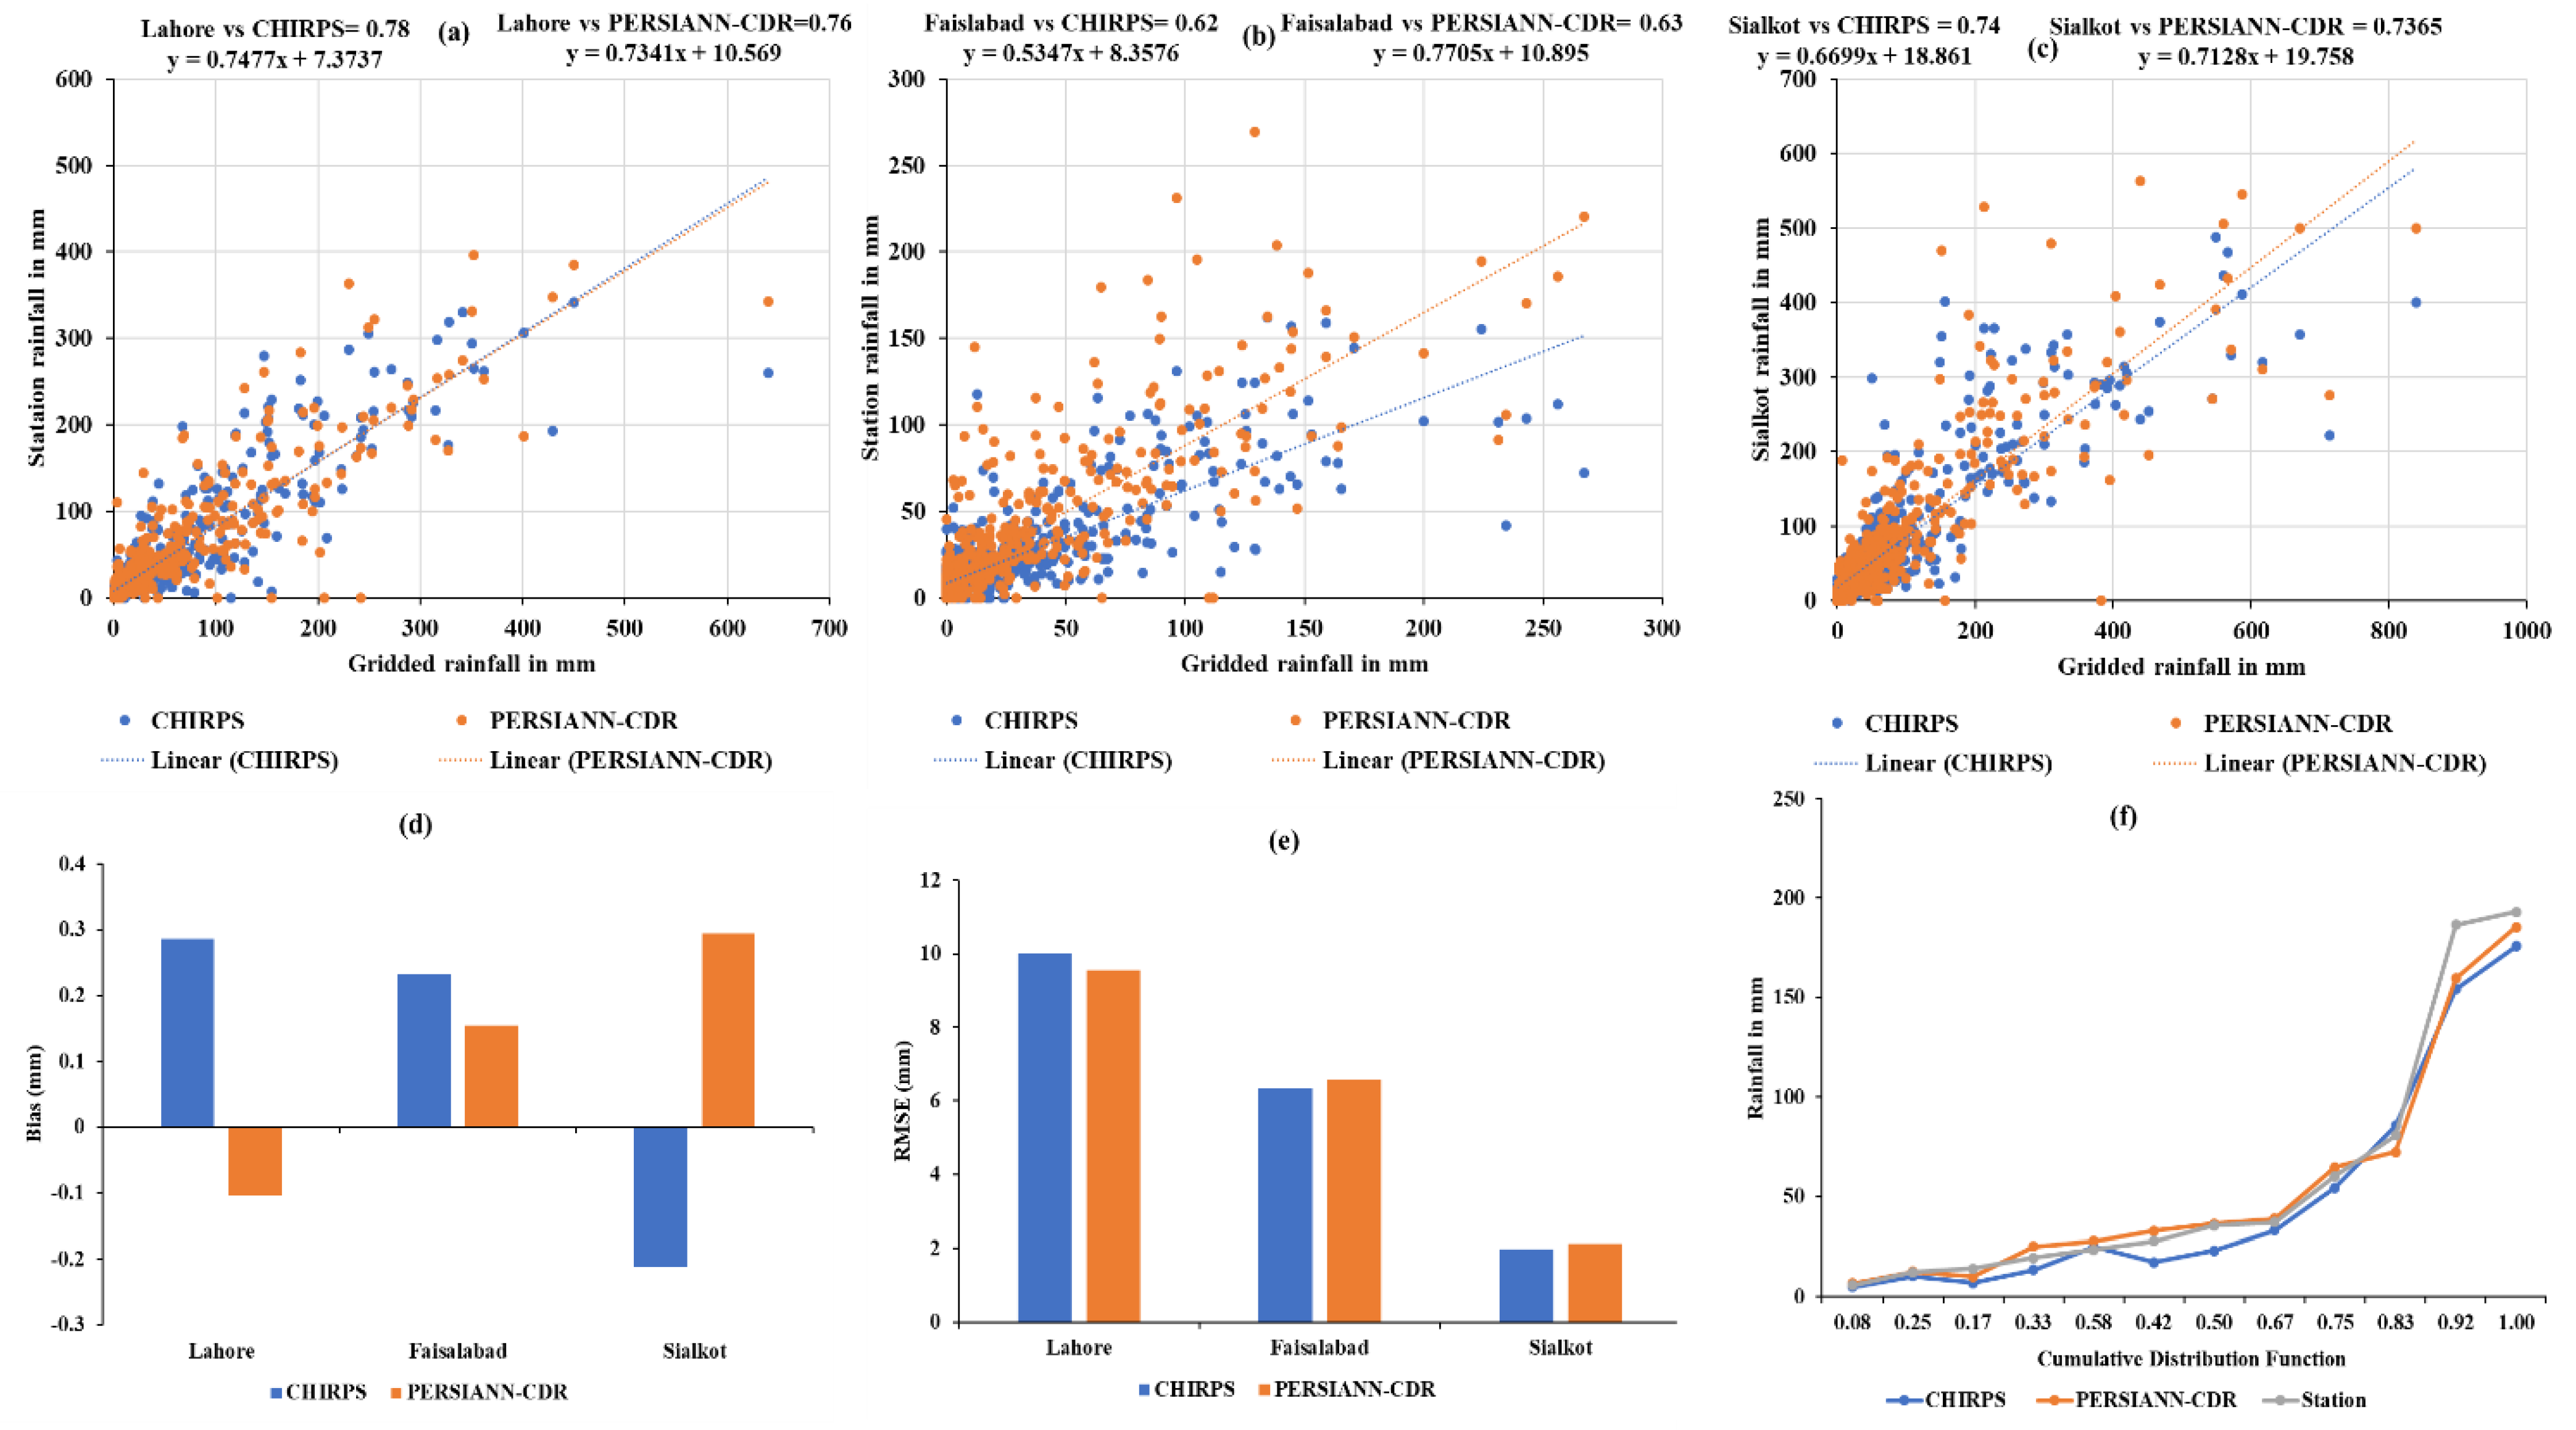
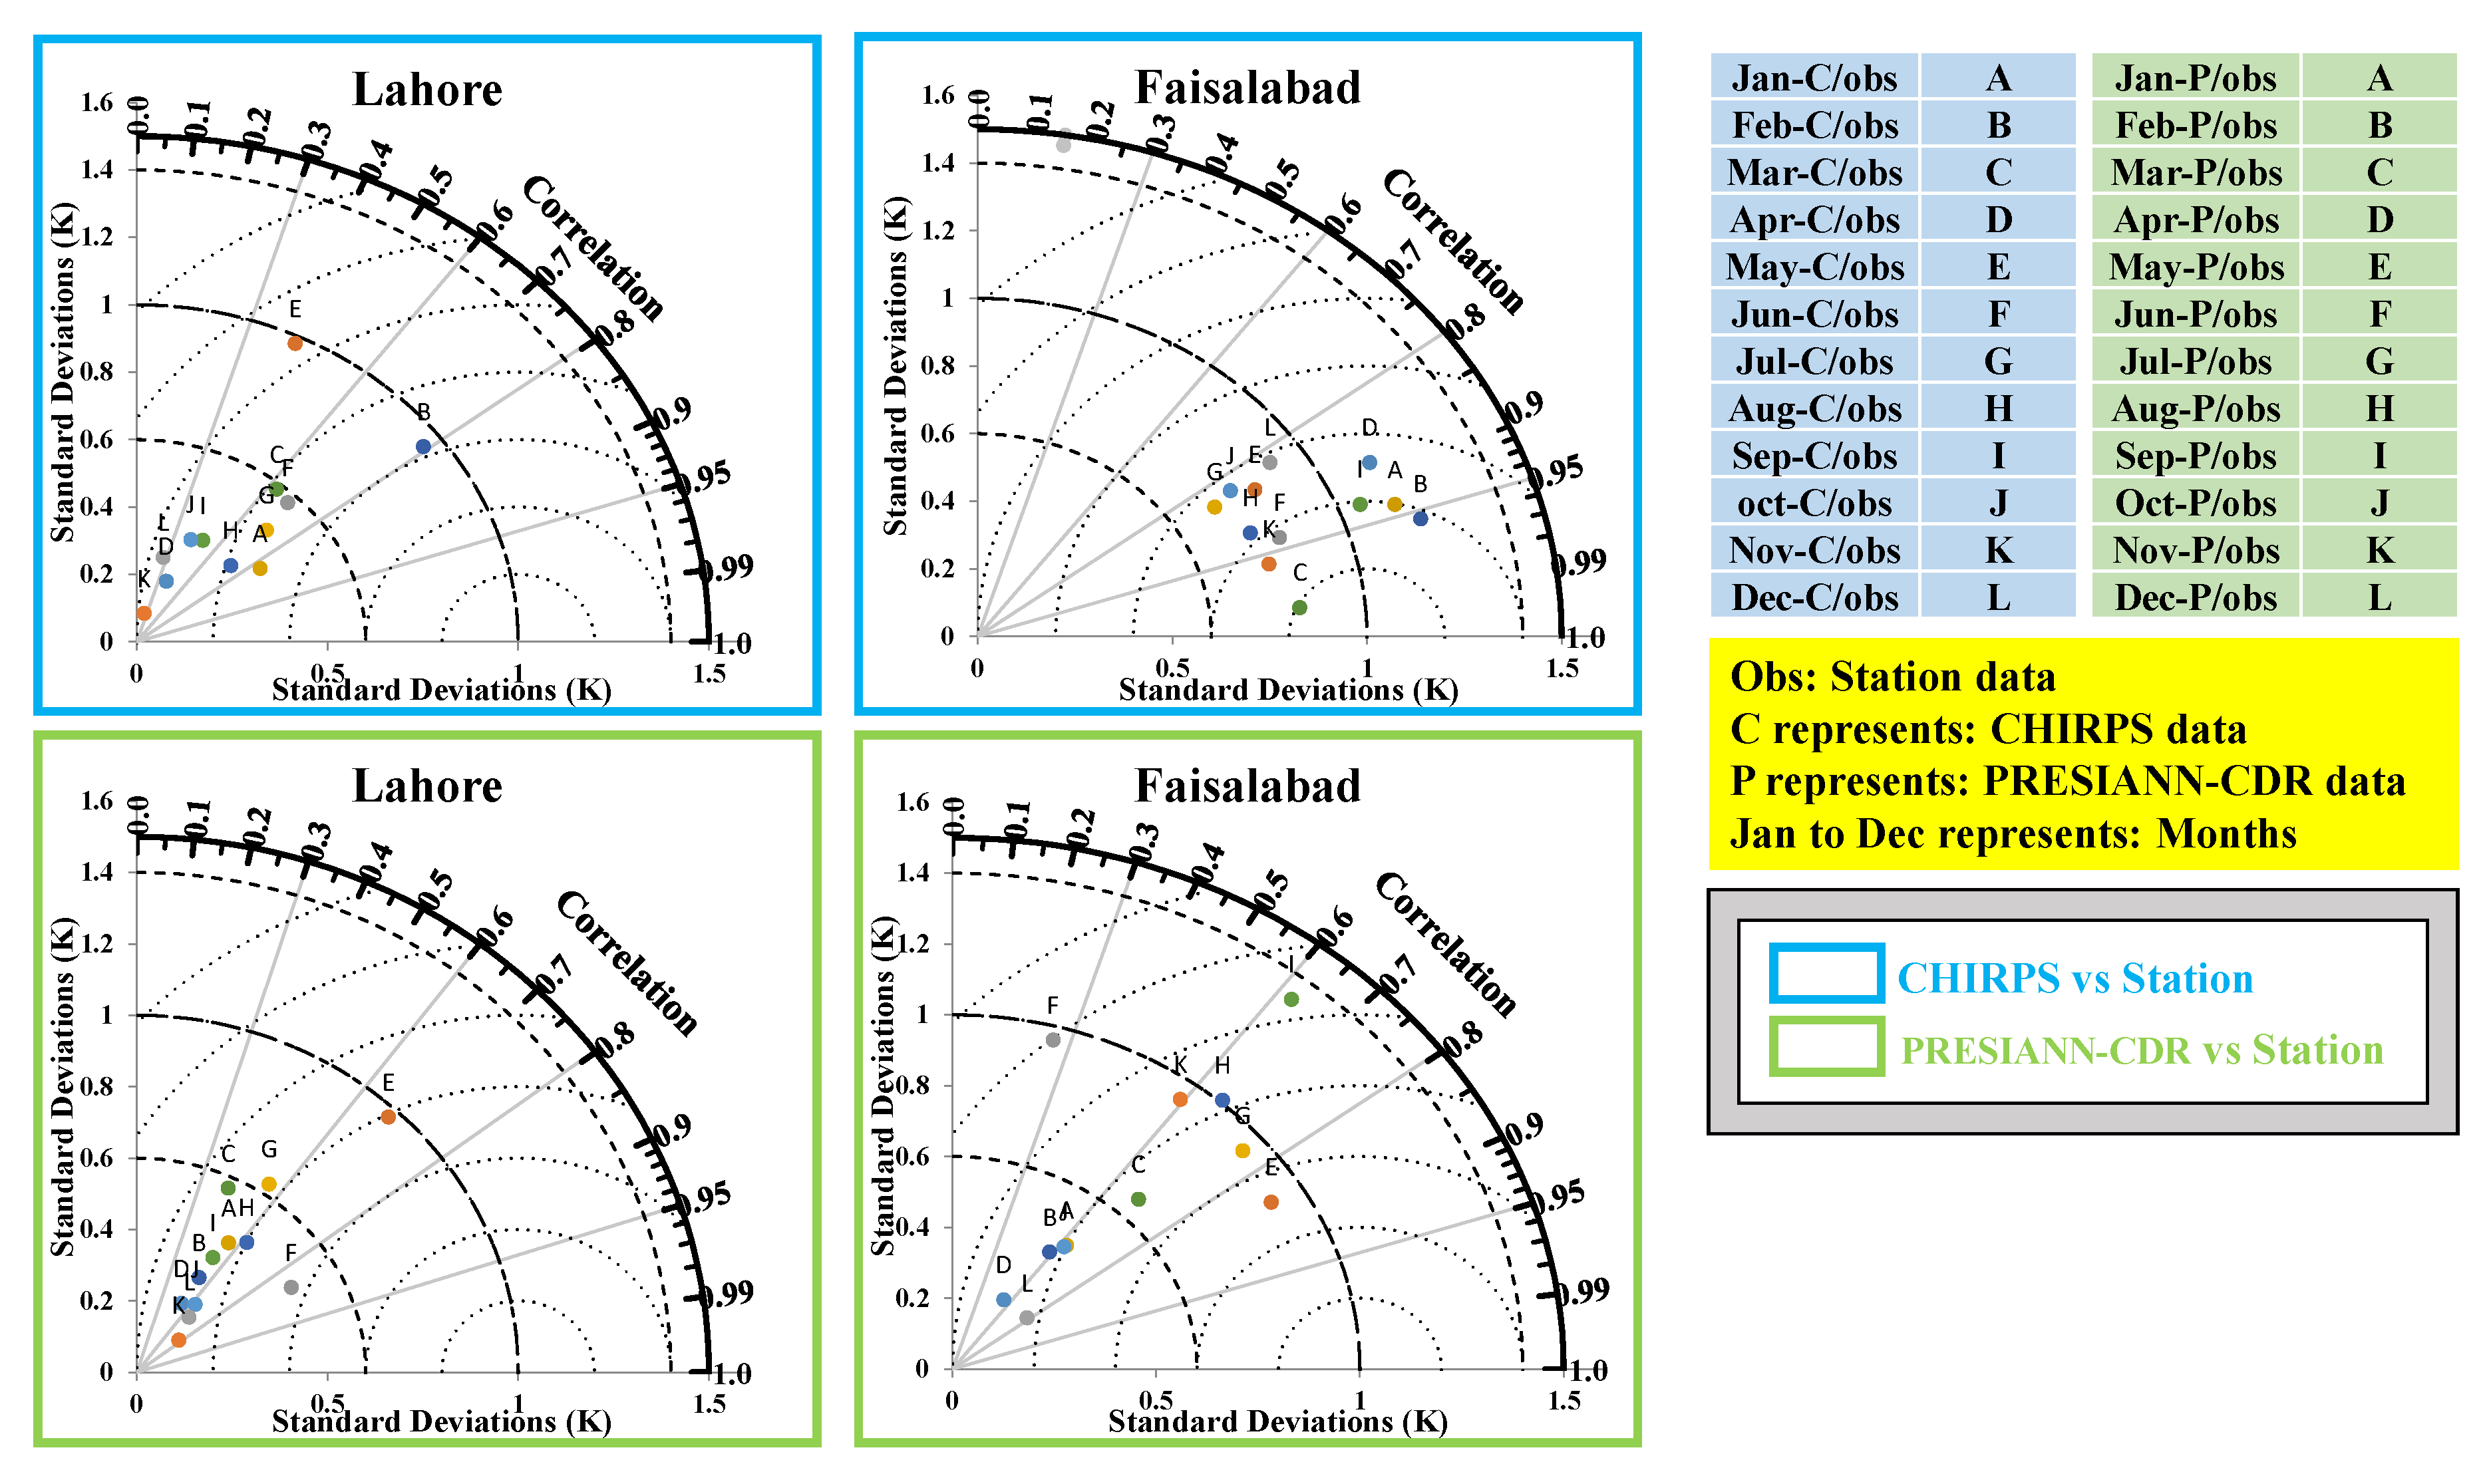
5.1. Validation of Gridded Data in Comparison to In-Situ Data (1983–2020)

There have always been concerns regarding the availability of long-term climate data, especially due to the missing surface observatory data in crucial regions, such as central Punjab in Pakistan. Due to unreachability, long-term observation stations are an exception and, hence, we relied on remotely sensed and reanalysis products to estimate uncertainties that cannot be handled with station rainfall data. Reanalysis (CHIRPS) and satellite-derived (PERSIANN-CDR) rainfall outputs can be compared and statistically assessed in terms of relative performance versus limited observational data using the GEE cloud computing capability. So far, limited research has been conducted for the validity of the CHIRPS and PERSIANN-CDR in Pakistan against the in situ data, but none so far provide deep insight at a regional level, such as central Punjab [19,44].
Because of the presence of cold clouds, ice, and snow, satellite products are inadequate in their capability to predict rainfall in mountainous locations [45]. The CHIRPS sometimes under- or overestimates in situ data in different parts of the world [46,47]. On a daily scale, CHIRPS performance was noted as being subpar; however, it was better evaluated across West Africa on a monthly, seasonal, and annual scale [48]. The dissimilarity is due to orographic features, different climate zones, and composite surface topography [47,49]. The performance of the CHIRPS was found to be satisfactory over the upper Blue Nile basin in Ethiopia and over the Central Andes of Argentina [50,51]. The CHIRPS performs relatively well in India and China as compared to other products [6,52]. In our study, however, CHIRPS slightly underestimates the rainfall in both stations, but it has ample capability to count rainfall as compared to observed data. A very low bias, Mbias, Rbias, and high CC is found. The accuracy of CHIRPS is established in Pakistan at monthly and seasonal scales in different climate zones [44]. Another study of CHIRPS in Pakistan found similar results [19].
The PERSIANN-CDR consistently overestimates the rainfall as compared to other rainfall satellite products and in situ data [18,53,54,55]. It underestimates the rainfall on a daily scale and overestimates on a seasonal and annual scale. The inability of infrared-based retrievals to accurately predict rainfall in PERSIANN-CDR may be the cause of overestimation [56,57]. However, the accuracy of PERSIANN-CDR is established in drought and rainfall studies with low error and bias [58,59,60]. Growing number of literatures have examined the effectiveness of the PERSIANN-CDR daily rainfall product in recent years to capture rainfall counts in different parts of the world and estimated its effectiveness in terms of long-term capturing and performance for hydrological modeling [61,62,63]. In our study, the PERSIANN-CDR underestimates the rainfall at Lahore station and overestimated it at Faisalabad station. However, the accuracy of the PERSIANN-CDR is established with high CC, and with low bias and ME. Similar findings are reported in the literature in Pakistan [44].
Our analysis also demonstrates the authenticity of two gridded data sets, with CHIRPS showing better agreement with observatory rainfall than PERSIANN-CDR. Similar temporal trends and patterns are seen in the monthly, yearly, and seasonal distributions from 1983 to 2020 from the two observatories (Figure 7).

5.2. Variability and Trends in Rainfall

The comparison of the spatio-temporal distribution and trends of rainfall between the CHIRPS and PERSIANN-CDR (district-wise) datasets across central Punjab from 1983 to 2020 on a monthly, seasonal, and yearly scale was achieved. Both the datasets showed heavy rainfall in central Punjab during the monsoon season (70.5%), followed by pre-monsoon (15.2%) and winter (10.2%). The heavy monsoonal rainfall occurred due to uneven distribution of pressure gradients in the Pamir region and the Bay of Bengal, which brings sufficient moisture and rainfall throughout the months [11,16,64,65]. Additionally, the pre-monsoon and winter rainfall occurred due to the presence of western disturbances originating from the Mediterranean Sea and bringing more moisture towards southwest regions because of a highly intensified upper air westerly Jetstream [17,18,66]. Less rainfall during the post-monsoon season is a result of an early end of the monsoon season, but the convective systems control rainfall during that season [67,68]. The variability in connective systems can increase or decrease the rainfall in the post-monsoon season. Similar findings are reported in the literature [2,19,69]. District-wise investigation suggests that Sargodha and Faisalabad have experienced a statistically significant increasing trend in the monsoon season due to vast temperature fluctuations, land–ocean interactions, and sufficient moisture from the Arabian Sea and the Bay of Bengal.
Moreover, Narowal and Sialkot have witnessed a decreased tendency throughout the years, which can be attributed by the intense global atmospheric circulation patterns i.e., the El Niño–southern oscillation (ENSO), the Atlantic multi-decadal oscillation (AMO), inter-decadal Pacific oscillation (IPO), and urbanization and climate change [16,65,70]. Another study also found similar results in that region [70].
Additionally, anthropogenic activities, such as industrial growth, infrastructural activities, urbanization, and global increasing air temperature are also liable [38]. In Phase-2, annually, rainfall increased by 19%, which can be ascribed to the increasing tendency towards extreme events and huge temperature gradients, resulting in rapid land-ocean interactions [11,71,72].

5.3. Environmental and Socio-Economic Impacts of Rainfall Changes

Alterations in annual, seasonal, and monthly rainfall have had a critical impact on environment setup, particularly in rain-fed regions, such as central Punjab. Increased inconsistency in rainfall during the summer monsoon season, rising temperatures in arable parts, and severe water stress (such as floods and droughts) all agglomerate to have a negative impression on agricultural practices and productivity [73,74].

5.3.1. Effects of Decreasing Rainfall (Phase-I: 1983–2001)

Long-term trend analysis of central Punjab from 1983 to 2001 (Phase-1) witnessed declining rainfall (averaging 3.4 mm/decade), which resulted in a deterioration of agricultural productivity, averaging 6–18% [75]. Seasonal rainfall in this time phase also experienced a decreasing trend, averaging 0.09 mm/decade. This can be attributed to the El Niño–southern Oscillation (ENSO), the Atlantic multi-decadal oscillation (AMO), the inter-decadal Pacific oscillation (IPO), as well as urbanization and climate change [76,77,78,79].
Insufficient rainfall also resulted in less productivity of good quality cotton [80], which further caused fluctuations in the local economy [81]. Adequate rainfall during the wheat growing season also resulted from less production and growing, which troubled the country’s food supply [82]. Massive reductions in livestock due to decreasing patterns of rainfall in central Punjab districts have been reported, which leads to poverty in rural areas [83]. Nevertheless, approximately 3 million people were impacted by the severe drought that occurred from 1998 to 2002, which also affected the national economy overall, and ecology and the agricultural industry in particular [84,85,86]. Recent studies have reported that the severe drought between 2000 and 2001 had an undesirable impact on the green sector’s growth rate (−2.6%) as equated to subsequent years [87]. This declining pattern of rainfall also impacted the national water availability (a 51% reduction) and lessened river discharge from 162 billion m3 to 109 billion m3, which triggered a lowering GDP growth to 4.7% instead of the preliminary objective of 5.2% [88,89], as a significant proportion of population throughout the years directly or indirectly depended on water supply and allied primary activities. In rain-fed area, such as central districts of Punjab province, farm households are surrounded by uncertainty, which causes a reduction in livestock yield due to decreasing patterns of rainfall. It also increases the challenges of water availability and leads to poverty in rural areas [83]. More than 3 million people were impacted by the drought from 1998 to 2002, which also crippled the national economy [84]. Thus, it significantly affected the ecology and the agricultural industry [85,86]. In Pakistan, the severe drought between 2000 and 2001 harmed the green sector’s growth rate (−2.6%), as compared to 2001 to 2002 [87]. Pakistan had a 51% increase in water shortage from the previous year, decreasing water flows in main rivers to 109 billion m3 from 162 billion m3, and lowering GDP growth to 4.7% instead of the preliminary objective of 5.2% [88,89]. As a result, a significant portion of the population’s food security and way of life was seriously impacted, along with agricultural and animal productivity.

5.3.2. Effects of Increasing Rainfall (Phase-II: 2002–2020)

An annual increasing trend has been observed in Phase-2, according to CHIRPS data, by 10.01 mm/decade, whereas PERSIANN-CDR shows a relatively lower trend (7.94 mm/decade), which has adverse effects on the local economy, mainly in primary activities. This increased effect of rainfall meaningfully impacted on agricultural productivity in central Punjab [90]. Recent growing investigators have looked into the enlarged impacts of rainfall on harvest and yield variation and found a decreased tendency from 5% to 15% throughout September and October in rice yield in the districts of Lahore, Gujranwala, and Sheikhupura due to unnecessary heavy rainfall on mature crops [88,89]. Increased rainfall also resulted in floods in Punjab, mainly in the Dera Ghazi Khan, Rajanpur, and Rahim Yar Khan districts in 2010 and 2011, which had a massive impact on local primary production [91]. Contrary to this, a heavy increase in rainfall during the monsoon season (4.5 mm/decade in Phase-2) occasioned enormous infrastructure and property loss and also damaged about 150,000 tons of upright settled wheat crops.

6. Summary and Conclusions

The foremost intention of this study was to examine the spatio-temporal long-term phase-wise distributions and trends of annual, seasonal, and monthly rainfall in the central Punjab region, Pakistan, by using both observed and gridded (CHIRPS and PERSIANN-CDR) datasets. Several descriptive statistics and non-parametric statistical trend estimations were utilized to check the data performance and durable alterations by employing advanced web-based cloud platform computing (GEE) and MATLAB programming language. The key findings can be summarized as follows.
  • The present study initially dealt with the performance checking of remotely sensed gridded datasets (CHIRPS and PERSIANN-CDR) using station-observed data by employing numerous statistical indices and found CHIRPS has a higher spatio-temporal association with station-observed data (r2 = 0.76) than PERSIANN-CDR (r2 = 0.63), along with comparatively low bias and RMSE;
  • Long-term annual, seasonal, and monthly distribution of this study highlights maximum rainfall in Sialkot (904.24 mm), followed by the Narowal (860.36 mm) and Gujrat (840.99 mm) districts. In seasonal and monthly scales, monsoon season contributes 71.24% of rainfall, whereas highest rainfall observed in the month of July (26.79%). In addition, out of the 19 districts, the maximum annual statistically significant increasing trend was noticed in Gujrat (50.8 mm/decade), whereas seasonal dynamics show that the maximum increased during the monsoon season in Jhang (23.5 mm/decade). Furthermore, the maximum monthly change was observed in Gujrat district in the month of September (9.6 mm/decade);
  • The present study intensively investigated phase-wise long-term alteration in central Punjab and found a statistically decreasing trend in Phase-1 (3.5 mm/decade) and increasing in Phase-2 (7.5 mm/decade). Maximum seasonal changes were noticed during the monsoon season. Furthermore, the maximum statistically significant tendency was observed in July (3.3 mm/decade) and April (1.0 mm/decade) in Phase-2, whereas Phase-1 witnessed a statistically significant reduction in March (0.9 mm/decade);
  • This uneven nature of inter-annual long-term rainfall has had a crucial imprint on the local infrastructure and property as well as primary activities (mainly agriculture). Less rainfall in Phase-1 critically accelerated remarkable loss in agricultural productivity pf 4.7%, whereas the increased rainfall scenario in Phase-2 resulted in massive loss of mature standing crops of about 150,000 tons and damage to property due to unpredicted floods;
  • The foremost lacuna of this study is the availability of maximum ground rainfall records; however, only three observational stations were available as per the study period (1983–2020). That is why relying on remotely sensed data is identically significant in this case to exhibit overall spatial variations throughout the study domain. To achieve this aim, the applications and usefulness of a cloud computing system, such as GEE, is more efficient to gather a large quantity of datasets in a single platform with higher computational capacity.

Supplementary Materials

The following supporting information can be downloaded at: https://www.mdpi.com/article/10.3390/atmos14010060/s1, Figure S1: Annual distribution of rainfall of CHIRPS, PERSIANN-CDR and Observed datasets.; Figure S2: Seasonal distribution of rainfall of CHIRPS, PERSIANN-CDR and Observed datasets; Table S1: Distributions of mean annual, seasonal, and monthly rainfall in central Punjab districts (1983–2020); Table S2: District-wise annual, seasonal, and monthly trends of rainfall of gridded datasets (mm/decade, 1983–2020); Table S3: Phase-wise annual, seasonal, and monthly trends of rainfall in central Punjab (CHIRPS, PERSIANN-CDR).

Author Contributions

All the authors had different contribution in this research work and are mentioned here accordingly. Conceptualization, K.A. and A.B.; methodology, K.A.; software, Z.X. and M.A.; validation, K.A., S.K. and M.A.; formal analysis, K.A. and A.B.; investigation, A.B. and K.A.; resources, K.A.; data curation, K.A.; writing—original draft preparation, A.B. and K.A.; writing—review and editing, A.B., K.A. and W.R.; visualization, W.R.; supervision, A.B. and S.K.; project administration, S.K.; funding acquisition, K.A. All authors have read and agreed to the published version of the manuscript.

Funding

All the authors are equally contributed to pay the Article Processing Charge (APC) from their monthly stipend from the Shanghai Government Scholarship and Chinese Academy of Sciences.

Institutional Review Board Statement

Not applicable.

Informed Consent Statement

Not applicable.

Data Availability Statement

All the data are presented in the paper.

Acknowledgments

The authors affectionately thank the Pakistan Meteorological Department (PMD) for providing long-term station observation rainfall data. We are also thankful to the NOAA, NCDC, UCSB, and Climate Hazard Group for providing long-term high-resolution rainfall data.

Conflicts of Interest

The authors declare no conflict of interest.

References

  1. Fortin, V.; Roy, G.; Stadnyk, T.; Koenig, K.; Gasset, N.; Mahidjiba, A. Ten years of science based on the Canadian precipitation analysis: A CaPA system overview and literature review. Atmos.-Ocean 2018, 56, 178–196. [Google Scholar] [CrossRef]
  2. Ullah, S.; You, Q.; Ullah, W.; Ali, A. Observed changes in precipitation in China-Pakistan economic corridor during 1980–2016. Atmos. Res. 2018, 210, 1–14. [Google Scholar] [CrossRef]
  3. Tian, L.; Yuan, S.; Quiring, S.M. Evaluation of six indices for monitoring agricultural drought in the south-central United States. Agric. For. Meteorol. 2018, 249, 107–119. [Google Scholar] [CrossRef]
  4. Kishore, P.; Jyothi, S.; Basha, G.; Rao, S.; Rajeevan, M.; Velicogna, I.; Sutterley, T.C. Precipitation climatology over India: Validation with observations and reanalysis datasets and spatial trends. Clim. Dyn. 2016, 46, 541–556. [Google Scholar] [CrossRef] [Green Version]
  5. Gaddam, V.K.; Kulkarni, A.V.; Gupta, A.K. Assessment of snow-glacier melt and rainfall contribution to stream runoff in Baspa Basin, Indian Himalaya. Environ. Monit. Assess. 2018, 190, 1–11. [Google Scholar] [CrossRef]
  6. Banerjee, A.; Chen, R.; Meadows, M.E.; Singh, R.; Mal, S.; Sengupta, D. An analysis of long-term rainfall trends and variability in the uttarakhand himalaya using google earth engine. Remote Sens. 2020, 12, 709. [Google Scholar] [CrossRef] [Green Version]
  7. Shukla, S.; McNally, A.; Husak, G.; Funk, C. A seasonal agricultural drought forecast system for food-insecure regions of East Africa. Hydrol. Earth Syst. Sci. 2014, 18, 3907–3921. [Google Scholar] [CrossRef] [Green Version]
  8. Toté, C.; Patricio, D.; Boogaard, H.; Van der Wijngaart, R.; Tarnavsky, E.; Funk, C. Evaluation of satellite rainfall estimates for drought and flood monitoring in Mozambique. Remote Sens. 2015, 7, 1758–1776. [Google Scholar] [CrossRef] [Green Version]
  9. Allen, S.K.; Rastner, P.; Arora, M.; Huggel, C.; Stoffel, M. Lake outburst and debris flow disaster at Kedarnath, June 2013: Hydrometeorological triggering and topographic predisposition. Landslides 2016, 13, 1479–1491. [Google Scholar] [CrossRef]
  10. Kumar, V.; Jain, S.K. Trends in seasonal and annual rainfall and rainy days in Kashmir Valley in the last century. Quat. Int. 2010, 212, 64–69. [Google Scholar] [CrossRef]
  11. Banerjee, A.; Chen, R.; Meadows, M.E.; Sengupta, D.; Pathak, S.; Xia, Z.; Mal, S. Tracking 21st century climate dynamics of the Third Pole: An analysis of topo-climate impacts on snow cover in the central Himalaya using Google Earth Engine. Int. J. Appl. Earth Obs. Geoinf. 2021, 103, 102490. [Google Scholar] [CrossRef]
  12. Ren, Y.-Y.; Ren, G.-Y.; Sun, X.-B.; Shrestha, A.B.; You, Q.-L.; Zhan, Y.-J.; Rajbhandari, R.; Zhang, P.-F.; Wen, K.-M. Observed changes in surface air temperature and precipitation in the Hindu Kush Himalayan region over the last 100-plus years. Adv. Clim. Chang. Res. 2017, 8, 148–156. [Google Scholar] [CrossRef]
  13. Zhang, Q.; Peng, J.; Singh, V.P.; Li, J.; Chen, Y.D. Spatio-temporal variations of precipitation in arid and semiarid regions of China: The Yellow River basin as a case study. Glob. Planet. Chang. 2014, 114, 38–49. [Google Scholar] [CrossRef]
  14. Nawaz, Z.; Li, X.; Chen, Y.; Nawaz, N.; Gull, R.; Elnashar, A. Spatio-Temporal Assessment of Global Precipitation Products over the Largest Agriculture Region in Pakistan. Remote Sens. 2020, 12, 3650. [Google Scholar] [CrossRef]
  15. Nawaz, Z.; Li, X.; Chen, Y.; Guo, Y.; Wang, X.; Nawaz, N. Temporal and spatial characteristics of precipitation and temperature in Punjab, Pakistan. Water 2019, 11, 1916. [Google Scholar] [CrossRef] [Green Version]
  16. Asmat, U.; Athar, H. Run-based multi-model interannual variability assessment of precipitation and temperature over Pakistan using two IPCC AR4-based AOGCMs. Theor. Appl. Climatol. 2017, 127, 1–16. [Google Scholar] [CrossRef]
  17. Dimri, A.; Niyogi, D.; Barros, A.; Ridley, J.; Mohanty, U.; Yasunari, T.; Sikka, D. Western disturbances: A review. Rev. Geophys. 2015, 53, 225–246. [Google Scholar] [CrossRef]
  18. Iqbal, M.F.; Athar, H. Validation of satellite based precipitation over diverse topography of Pakistan. Atmos. Res. 2018, 201, 247–260. [Google Scholar] [CrossRef]
  19. Nawaz, M.; Iqbal, M.F.; Mahmood, I. Validation of CHIRPS satellite-based precipitation dataset over Pakistan. Atmos. Res. 2021, 248, 105289. [Google Scholar] [CrossRef]
  20. Arshad, M.; Ma, X.; Yin, J.; Ullah, W.; Liu, M.; Ullah, I. Performance evaluation of ERA-5, JRA-55, MERRA-2, and CFS-2 reanalysis datasets, over diverse climate regions of Pakistan. Weather Clim. Extrem. 2021, 33, 100373. [Google Scholar] [CrossRef]
  21. Huffman, G.J.; Bolvin, D.T.; Nelkin, E.J.; Wolff, D.B.; Adler, R.F.; Gu, G.; Hong, Y.; Bowman, K.P.; Stocker, E.F. The TRMM multisatellite precipitation analysis (TMPA): Quasi-global, multiyear, combined-sensor precipitation estimates at fine scales. J. Hydrometeorol. 2007, 8, 38–55. [Google Scholar] [CrossRef]
  22. Huffman, G.; Bolvin, D.; Braithwaite, D.; Hsu, K.; Joyce, R.; Kidd, C.; Nelkin, E.; Sorooshian, S.; Tan, J.; Xie, P. NASA Global Precipitation Measurement (GPM) Integrated Multi-Satellite Retrievals for GPM (IMERG); Algorithm Theoretical Basis Document (ATBD), Version 06; National Aeronautics and Space Administration (NASA): Washington, DC, USA, 2019. [Google Scholar]
  23. Joyce, R.J.; Janowiak, J.E.; Arkin, P.A.; Xie, P. CMORPH: A method that produces global precipitation estimates from passive microwave and infrared data at high spatial and temporal resolution. J. Hydrometeorol. 2004, 5, 487–503. [Google Scholar] [CrossRef]
  24. Funk, C.; Peterson, P.; Landsfeld, M.; Pedreros, D.; Verdin, J.; Shukla, S.; Husak, G.; Rowland, J.; Harrison, L.; Hoell, A. The climate hazards infrared precipitation with stations—A new environmental record for monitoring extremes. Sci. Data 2015, 2, 150066. [Google Scholar] [CrossRef] [PubMed] [Green Version]
  25. Beck, H.E.; Van Dijk, A.I.; Levizzani, V.; Schellekens, J.; Miralles, D.G.; Martens, B.; De Roo, A. MSWEP: 3-hourly 0.25 global gridded precipitation (1979–2015) by merging gauge, satellite, and reanalysis data. Hydrol. Earth Syst. Sci. 2017, 21, 589–615. [Google Scholar] [CrossRef] [Green Version]
  26. Ashouri, H.; Hsu, K.-L.; Sorooshian, S.; Braithwaite, D.K.; Knapp, K.R.; Cecil, L.D.; Nelson, B.R.; Prat, O.P. PERSIANN-CDR: Daily precipitation climate data record from multisatellite observations for hydrological and climate studies. Bull. Am. Meteorol. Soc. 2015, 96, 69–83. [Google Scholar] [CrossRef] [Green Version]
  27. Yatagai, A.; Kamiguchi, K.; Arakawa, O.; Hamada, A.; Yasutomi, N.; Kitoh, A. APHRODITE: Constructing a long-term daily gridded precipitation dataset for Asia based on a dense network of rain gauges. Bull. Am. Meteorol. Soc. 2012, 93, 1401–1415. [Google Scholar] [CrossRef]
  28. Badar, H.; Ghafoor, A.; Adil, S.A. Factors affecting agricultural production of Punjab (Pakistan). Pak. J. Agri. Sci. 2007, 44, 506–510. [Google Scholar]
  29. Statistics, S. Statistical Yearbook; Statistics: Copenhagen, Denmark, 2012. [Google Scholar]
  30. Abid, M.; Ashfaq, M.; Khalid, I.; Ishaq, U. An economic evaluation of impact of soil quality on Bt (Bacillus thuringiensis) cotton productivity. Soil Env. 2011, 30, 78–81. [Google Scholar]
  31. Shahid, M.A.; Boccardo, P.; García, W.C.; Albanese, A.; Cristofori, E. Evaluation of TRMM satellite data for mapping monthly precipitation in Pakistan by comparison with locally available data. In Proceedings of the III CUCS Congress-Imagining Cultures of Cooperation; Universities Working to Face the New Developemnt Challenges: Torino, Italy, 2013. [Google Scholar]
  32. Cheema, S.; Hanif, M. Seasonal precipitation variation over Punjab province. Pak. J. Meteorol. 2013, 10, 61–82. [Google Scholar]
  33. Bokhari, S.; Rasul, G.; Ruane, A.; Hoogenboom, G.; Ahmad, A. The past and future changes in climate of the rice-wheat cropping zone in Punjab, Pakistan. Pak. J. Meteorol. 2017, 13, 9–23. [Google Scholar]
  34. Mubeen, M.; Ahmad, A.; Wajid, A.; Khaliq, T.; Bakhsh, A. Evaluating CSM-CERES-Maize Model for Irrigation Scheduling in Semi-arid Conditions of Punjab, Pakistan. Int. J. Agric. Biol. 2013, 15, 1–10. [Google Scholar]
  35. Nasim, W.; Belhouchette, H.; Tariq, M.; Fahad, S.; Hammad, H.M.; Mubeen, M.; Munis, M.F.H.; Chaudhary, H.J.; Khan, I.; Mahmood, F. Correlation studies on nitrogen for sunflower crop across the agroclimatic variability. Environ. Sci. Pollut. Res. 2016, 23, 3658–3670. [Google Scholar] [CrossRef]
  36. Iqbal, M.A.; Penas, A.; Cano-Ortiz, A.; Kersebaum, K.C.; Herrero, L.; del Río, S. Analysis of recent changes in maximum and minimum temperatures in Pakistan. Atmos. Res. 2016, 168, 234–249. [Google Scholar] [CrossRef]
  37. Nasim, W.; Ahmad, A.; Belhouchette, H.; Fahad, S.; Hoogenboom, G. Evaluation of the OILCROP-SUN model for sunflower hybrids under different agro-meteorological conditions of Punjab—Pakistan. Field Crops Res. 2016, 188, 17–30. [Google Scholar] [CrossRef]
  38. Nawaz, Z.; Li, X.; Chen, Y.; Wang, X.; Zhang, K.; Nawaz, N.; Guo, Y.; Meerzhan, A. Spatiotemporal assessment of temperature data products for the detection of warming trends and abrupt transitions over the largest irrigated area of Pakistan. Adv. Meteorol. 2020, 2020, 3584030. [Google Scholar] [CrossRef]
  39. Nguyen, P.; Shearer, E.J.; Tran, H.; Ombadi, M.; Hayatbini, N.; Palacios, T.; Huynh, P.; Braithwaite, D.; Updegraff, G.; Hsu, K. The CHRS Data Portal, an easily accessible public repository for PERSIANN global satellite precipitation data. Sci. Data 2019, 6, 180296. [Google Scholar] [CrossRef] [Green Version]
  40. Rasul, G. Climate Data and Modelling Analysis of the Indus Region; World Wide Fund for Nature: Gland, Switzerland, 2012. [Google Scholar]
  41. Amin, A.; Nasim, W.; Mubeen, M.; Kazmi, D.H.; Lin, Z.; Wahid, A.; Sultana, S.R.; Gibbs, J.; Fahad, S. Comparison of future and base precipitation anomalies by SimCLIM statistical projection through ensemble approach in Pakistan. Atmos. Res. 2017, 194, 214–225. [Google Scholar] [CrossRef]
  42. Ahmed, K.; Shahid, S.; Ismail, T.; Nawaz, N.; Wang, X.-J. Absolute homogeneity assessment of precipitation time series in an arid region of Pakistan. Atmósfera 2018, 31, 301–316. [Google Scholar] [CrossRef]
  43. Ahmed, K.; Shahid, S.; Nawaz, N. Impacts of climate variability and change on seasonal drought characteristics of Pakistan. Atmos. Res. 2018, 214, 364–374. [Google Scholar] [CrossRef]
  44. Ullah, W.; Wang, G.; Ali, G.; Tawia Hagan, D.F.; Bhatti, A.S.; Lou, D. Comparing multiple precipitation products against in-situ observations over different climate regions of Pakistan. Remote Sens. 2019, 11, 628. [Google Scholar] [CrossRef] [Green Version]
  45. Hussain, Y.; Satgé, F.; Hussain, M.B.; Martinez-Carvajal, H.; Bonnet, M.-P.; Cárdenas-Soto, M.; Roig, H.L.; Akhter, G. Performance of CMORPH, TMPA, and PERSIANN rainfall datasets over plain, mountainous, and glacial regions of Pakistan. Theor. Appl. Climatol. 2018, 131, 1119–1132. [Google Scholar] [CrossRef]
  46. Paredes Trejo, F.J.; Alves Barbosa, H.; Peñaloza-Murillo, M.A.; Moreno, M.A.; Farias, A. Intercomparison of improved satellite rainfall estimation with CHIRPS gridded product and rain gauge data over Venezuela. Atmósfera 2016, 29, 323–342. [Google Scholar] [CrossRef] [Green Version]
  47. Le, A.M.; Pricope, N.G. Increasing the accuracy of runoff and streamflow simulation in the Nzoia Basin, Western Kenya, through the incorporation of satellite-derived CHIRPS data. Water 2017, 9, 114. [Google Scholar] [CrossRef]
  48. Dembélé, M.; Zwart, S.J. Evaluation and comparison of satellite-based rainfall products in Burkina Faso, West Africa. Int. J. Remote Sens. 2016, 37, 3995–4014. [Google Scholar] [CrossRef] [Green Version]
  49. Prakash, S. Performance assessment of CHIRPS, MSWEP, SM2RAIN-CCI, and TMPA precipitation products across India. J. Hydrol. 2019, 571, 50–59. [Google Scholar] [CrossRef]
  50. Ayehu, G.T.; Tadesse, T.; Gessesse, B.; Dinku, T. Validation of new satellite rainfall products over the Upper Blue Nile Basin, Ethiopia. Atmos. Meas. Tech. 2018, 11, 1921–1936. [Google Scholar] [CrossRef] [Green Version]
  51. Rivera, J.A.; Marianetti, G.; Hinrichs, S. Validation of CHIRPS precipitation dataset along the Central Andes of Argentina. Atmos. Res. 2018, 213, 437–449. [Google Scholar] [CrossRef]
  52. Bai, L.; Shi, C.; Li, L.; Yang, Y.; Wu, J. Accuracy of CHIRPS satellite-rainfall products over mainland China. Remote Sens. 2018, 10, 362. [Google Scholar] [CrossRef] [Green Version]
  53. Katiraie-Boroujerdy, P.-S.; Asanjan, A.A.; Hsu, K.-l.; Sorooshian, S. Intercomparison of PERSIANN-CDR and TRMM-3B42V7 precipitation estimates at monthly and daily time scales. Atmos. Res. 2017, 193, 36–49. [Google Scholar] [CrossRef] [Green Version]
  54. Shrestha, N.K.; Qamer, F.M.; Pedreros, D.; Murthy, M.; Wahid, S.M.; Shrestha, M. Evaluating the accuracy of Climate Hazard Group (CHG) satellite rainfall estimates for precipitation based drought monitoring in Koshi basin, Nepal. J. Hydrol. Reg. Stud. 2017, 13, 138–151. [Google Scholar] [CrossRef]
  55. Shangguan, W.; Dai, Y.; Liu, B.; Zhu, A.; Duan, Q.; Wu, L.; Ji, D.; Ye, A.; Yuan, H.; Zhang, Q. A China data set of soil properties for land surface modeling. J. Adv. Model. Earth Syst. 2013, 5, 212–224. [Google Scholar] [CrossRef]
  56. Li, X.; Zhang, Q.; Xu, C.-Y. Assessing the performance of satellite-based precipitation products and its dependence on topography over Poyang Lake basin. Theor. Appl. Climatol. 2014, 115, 713–729. [Google Scholar] [CrossRef]
  57. Hirpa, F.A.; Salamon, P.; Alfieri, L.; Thielen-del Pozo, J.; Zsoter, E.; Pappenberger, F. The effect of reference climatology on global flood forecasting. J. Hydrometeorol. 2016, 17, 1131–1145. [Google Scholar] [CrossRef] [Green Version]
  58. Lashkari, A.; Salehnia, N.; Asadi, S.; Paymard, P.; Zare, H.; Bannayan, M. Evaluation of different gridded rainfall datasets for rainfed wheat yield prediction in an arid environment. Int. J. Biometeorol. 2018, 62, 1543–1556. [Google Scholar] [CrossRef]
  59. Bhardwaj, A.; Ziegler, A.D.; Wasson, R.J.; Chow, W.T. Accuracy of rainfall estimates at high altitude in the Garhwal Himalaya (India): A comparison of secondary precipitation products and station rainfall measurements. Atmos. Res. 2017, 188, 30–38. [Google Scholar] [CrossRef]
  60. Santos, C.A.G.; Neto, R.M.B.; do Nascimento, T.V.M.; da Silva, R.M.; Mishra, M.; Frade, T.G. Geospatial drought severity analysis based on PERSIANN-CDR-estimated rainfall data for Odisha state in India (1983–2018). Sci. Total Environ. 2021, 750, 141258. [Google Scholar] [CrossRef]
  61. Ashouri, H.; Nguyen, P.; Thorstensen, A.; Hsu, K.-l.; Sorooshian, S.; Braithwaite, D. Assessing the efficacy of high-resolution satellite-based PERSIANN-CDR precipitation product in simulating streamflow. J. Hydrometeorol. 2016, 17, 2061–2076. [Google Scholar] [CrossRef]
  62. Miao, C.; Ashouri, H.; Hsu, K.-L.; Sorooshian, S.; Duan, Q. Evaluation of the PERSIANN-CDR daily rainfall estimates in capturing the behavior of extreme precipitation events over China. J. Hydrometeorol. 2015, 16, 1387–1396. [Google Scholar] [CrossRef] [Green Version]
  63. Sun, S.; Zhou, S.; Shen, H.; Chai, R.; Chen, H.; Liu, Y.; Shi, W.; Wang, J.; Wang, G.; Zhou, Y. Dissecting performances of PERSIANN-CDR precipitation product over Huai River Basin, China. Remote Sens. 2019, 11, 1805. [Google Scholar] [CrossRef] [Green Version]
  64. Ding, Y. The variability of the Asian summer monsoon. J. Meteorol. Soc. Jpn. Ser. II 2007, 85, 21–54. [Google Scholar] [CrossRef] [Green Version]
  65. Latif, M.; Syed, F.; Hannachi, A. Rainfall trends in the South Asian summer monsoon and its related large-scale dynamics with focus over Pakistan. Clim. Dyn. 2017, 48, 3565–3581. [Google Scholar] [CrossRef]
  66. Iqbal, M.F.; Athar, H. Variability, trends, and teleconnections of observed precipitation over Pakistan. Theor. Appl. Climatol. 2018, 134, 613–632. [Google Scholar] [CrossRef]
  67. Guhathakurta, P.; Rajeevan, M. Trends in the rainfall pattern over India. Int. J. Climatol. A J. R. Meteorol. Soc. 2008, 28, 1453–1469. [Google Scholar] [CrossRef]
  68. Hussain, S. Gladiolus production a successful example in the climate of Khanaspur, Ayobia district Hazara, NWF (Province) Pakistan. J. Nat. Geogr. Soc. 2008, 42, 177–181. [Google Scholar]
  69. Hanif, M.; Khan, A.H.; Adnan, S. Latitudinal precipitation characteristics and trends in Pakistan. J. Hydrol. 2013, 492, 266–272. [Google Scholar] [CrossRef]
  70. Ali, N.; Ahmad, I.; Chaudhry, A.; Raza, M. Trend analysis of precipitation data in Pakistan. Sci. Int. 2015, 27, 803–808. [Google Scholar]
  71. Syed, F.; Giorgi, F.; Pal, J.; King, M. Effect of remote forcings on the winter precipitation of central southwest Asia part 1: Observations. Theor. Appl. Climatol. 2006, 86, 147–160. [Google Scholar] [CrossRef]
  72. Baig, M.H.A.; Rasul, G. The effect of Eurasian snow cover on the Monsoon rainfall of Pakistan. Pak. J. Meteorol 2009, 5, 1–11. [Google Scholar]
  73. Chandio, A.A.; Magsi, H.; Ozturk, I. Examining the effects of climate change on rice production: Case study of Pakistan. Environ. Sci. Pollut. Res. 2020, 27, 7812–7822. [Google Scholar] [CrossRef]
  74. Abbas, S.; Kousar, S.; Khan, M.S. The role of climate change in food security; empirical evidence over Punjab regions, Pakistan. Environ. Sci. Pollut. Res. 2022, 29, 53718–53736. [Google Scholar] [CrossRef]
  75. Ullah, S. Climate change impact on agriculture of Pakistan-A leading agent to food security. Int. J. Environ. Sci. Nat. Resour. 2017, 6, 76–79. [Google Scholar]
  76. Kripalani, R.; Oh, J.; Kulkarni, A.; Sabade, S.; Chaudhari, H. South Asian summer monsoon precipitation variability: Coupled climate model simulations and projections under IPCC AR4. Theor. Appl. Climatol. 2007, 90, 133–159. [Google Scholar] [CrossRef]
  77. Priya, P.; Krishnan, R.; Mujumdar, M.; Houze, R.A. Changing monsoon and midlatitude circulation interactions over the Western Himalayas and possible links to occurrences of extreme precipitation. Clim. Dyn. 2017, 49, 2351–2364. [Google Scholar] [CrossRef]
  78. Wang, B.; Liu, J.; Kim, H.-J.; Webster, P.J.; Yim, S.-Y. Recent change of the global monsoon precipitation (1979–2008). Clim. Dyn. 2012, 39, 1123–1135. [Google Scholar] [CrossRef] [Green Version]
  79. Iqbal, Z.; Shahid, S.; Ahmed, K.; Ismail, T.; Nawaz, N. Spatial distribution of the trends in precipitation and precipitation extremes in the sub-Himalayan region of Pakistan. Theor. Appl. Climatol. 2019, 137, 2755–2769. [Google Scholar] [CrossRef]
  80. Abbas, Q.; Ahmad, S. Effect of Different Sowing Times and Cultivars on Cotton Fiber Quality under Stable Cotton-Wheat Cropping System in Southern Punjab, Pakistan. Pak. J. Life Soc. Sci. 2018, 16, 77–84. [Google Scholar]
  81. Arshad, A.; Raza, M.A.; Zhang, Y.; Zhang, L.; Wang, X.; Ahmed, M.; Habib-ur-Rehman, M. Impact of climate warming on cotton growth and yields in China and Pakistan: A regional perspective. Agriculture 2021, 11, 97. [Google Scholar] [CrossRef]
  82. Ashfaq, M.; Zulfiqar, F.; Sarwar, I.; Quddus, M.A.; Baig, I.A. Impact of climate change on wheat productivity in mixed cropping system of Punjab. Soil Environ. 2011, 30, 110–114. [Google Scholar]
  83. Abid, M.; Schilling, J.; Scheffran, J.; Zulfiqar, F. Climate change vulnerability, adaptation and risk perceptions at farm level in Punjab, Pakistan. Sci. Total Environ. 2016, 547, 447–460. [Google Scholar] [CrossRef]
  84. Portal, P.W. History of drought in Pakistan–in detail. 2011.
  85. Barlow, M.; Zaitchik, B.; Paz, S.; Black, E.; Evans, J.; Hoell, A. A review of drought in the Middle East and southwest Asia. J. Clim. 2016, 29, 8547–8574. [Google Scholar] [CrossRef]
  86. Hina, S.; Saleem, F. Historical analysis (1981–2017) of drought severity and magnitude over a predominantly arid region of Pakistan. Clim. Res. 2019, 78, 189–204. [Google Scholar] [CrossRef]
  87. Dahal, P.; Shrestha, N.S.; Shrestha, M.L.; Krakauer, N.Y.; Panthi, J.; Pradhanang, S.M.; Jha, A.; Lakhankar, T. Drought risk assessment in central Nepal: Temporal and spatial analysis. Nat. Hazards 2016, 80, 1913–1932. [Google Scholar] [CrossRef] [Green Version]
  88. Ahmad, S.; Hussain, Z.; Qureshi, A.S.; Majeed, R.; Saleem, M. Drought Mitigation in Pakistan: Current Status and Options for Future Strategies; IWMI: Colombo, Sri Lanka, 2004; Volume 85. [Google Scholar]
  89. Miyan, M.A. Droughts in Asian Least Developed Countries: Vulnerability and sustainability. Weather Clim. Extrem. 2015, 7, 8–23. [Google Scholar] [CrossRef] [Green Version]
  90. Hussain, M.S.; Lee, S. Long-term variability and changes of the precipitation regime in Pakistan. Asia-Pac. J. Atmos. Sci. 2014, 50, 271–282. [Google Scholar] [CrossRef]
  91. Tariq, M.A.U.R.; Van De Giesen, N. Floods and flood management in Pakistan. Phys. Chem. Earth Parts A/B/C 2012, 47, 11–20. [Google Scholar] [CrossRef]
Figure 1. (a) Location of central Punjab, Pakistan; (b) Districts of central Punjab region; (c) Digital elevation model of central Punjab with PMD metrological observatories; (d) District-wise land use and land cover pattern of central Punjab.
Atmosphere 14 00060 g001
Figure 2. (ac) show the relationship between the observed and gridded data (r2), (d) bias, (e) RMSE, and (f) the CDF of gridded data with corresponding observatories from 1983–2020.
Atmosphere 14 00060 g002
Figure 3. Phase-wise distribution of rainfall with error bars in central Punjab (from 1983–2001 and 2002–2020). (a) Mean annual and seasonal rainfall of CHIRPS; (b) mean annual and seasonal rainfall of PERSIAN-CDR; (c) mean monthly rainfall of CHIRPS; (d) mean monthly rainfall of PERSIANN-CDR.
Atmosphere 14 00060 g003
Figure 4. Spatial distribution of mean seasonal and annual rainfall. The upper panel shows (a) CHIRPS, and the lower panel displays (b) PERSIANN-CDR. Middle and lower portions show district-wise distribution of annual, seasonal, and monthly rainfall (1983–2020). (c) Mean annual and seasonal rainfall of CHIRPS; (d) mean annual and seasonal rainfall of PERSIAN-CDR; (e) mean monthly rainfall of CHIRPS; (f) mean monthly rainfall of PERSIANN-CDR.
Atmosphere 14 00060 g004
Figure 5. Phase-wise trends and mean percentage change in rainfall in central Punjab through CHIRPS and PERSIANN-CDR (1983–2001 and 2002–2020). (a) Trends on annual and seasonal scales; (b) trends on a monthly scale; (c) percentage mean annual and seasonal change in CHIRPS from Phase-1 to Phase-2; (d) percentage mean annual and seasonal change in PERSIAN-CDR from Phase-1 to Phase-2; (e) percentage mean monthly change in CHIRPS from Phase-1 to Phase-2; (f) percentage mean monthly change in PERSIANN-CDR from Phase-1 to Phase-2.
Atmosphere 14 00060 g005
Figure 6. Spatial distribution of magnitude of trends in annual and seasonal rainfall. Top panel showing (a) statistical significance level of CHIRPS, (b) statistical significance level of PERSIANN-CDR, (c) magnitude of trend of CHIRPS, (d) magnitude of trend of PERSIANN-CDR, (e) annual and seasonal trends of CHIRPS and PERSIANN-CDR, and (f) monthly trends of CHIRPS and PERSIANN-CDR.
Atmosphere 14 00060 g006
Figure 7. Taylor diagram exhibiting spatial association between station data and satellite data sets.
Atmosphere 14 00060 g007
Table 1. Data utilized to examine the rainfall distribution and trends in central Punjab.
Station-Observed Data (Collected from PMD)
LatitudeLongitudeElevation (in m)PeriodAvailable Observation (in %)
StationsLahore31°33′ N74°20′ E214.001983–2020100
Faisalabad31°26′ N73°08′ E185.61983–202099.99
Sialkot32°31′ N74°32′ E255.11983–202099.99
Gridded Data (Downloaded from Google Earth Engine Platform)
Data TypeSourceYearSpatial Resolution
CHIRPSUCSB/CHG1983–20200.05°
PERSIANN-CDRNOAA/NCDC1983–20200.25°
Table 2. Statistical indices to examine the similarity amid satellite data (CHIRPS and PERSIANN-CDR) and observed datasets.
StationDataME (mm)RMSE (mm)MAE (mm)Bias (mm)MBias (mm)RBias (%)CC
LahoreCHIRPS−0.1910.012.770.29−1.310.000.78
PERSIANN-CDR−0.129.552.830.15−1.570.000.76
FaisalabadCHIRPS−0.116.341.640.23−0.620.000.62
PERSIANN-CDR0.086.571.88−0.10−1.29−0.000.63
SialkotCHIRPS−0.091.991.18−0.210.880.000.74
PERSIANN-CDR0.132.122.970.291.150.000.73
Table 3. Phase-wise annual, seasonal, and monthly distribution of rainfall in central Punjab from gridded datasets (1983–2020).
DataPeriodJanuaryFebruaryMarchAprilMayJuneJulyAugustSeptemberOctoberNovemberDecemberAnnualPre-MonsoonMonsoonPost-MonsoonWinter
CHIRPS1983–200117.6119.2024.1413.3712.7333.45110.6899.6441.484.231.817.51385.8350.23285.2413.5536.81
2002–202021.3928.5130.2121.0315.4849.42115.01104.6258.015.363.107.04459.1966.72327.0615.5149.90
PERSIANN-CDR1983–200119.9827.5634.9831.4422.8951.22166.20134.2047.1510.994.3711.77562.7489.31398.7727.1247.54
2002–202028.8040.3741.2833.3926.0558.24133.79121.2568.709.838.119.60579.44100.73381.9827.5569.18
Disclaimer/Publisher’s Note: The statements, opinions and data contained in all publications are solely those of the individual author(s) and contributor(s) and not of MDPI and/or the editor(s). MDPI and/or the editor(s) disclaim responsibility for any injury to people or property resulting from any ideas, methods, instructions or products referred to in the content.

