First-Principles-Based Simulation of an Industrial Ethanol Dehydration Reactor


Abstract
:
1. Introduction
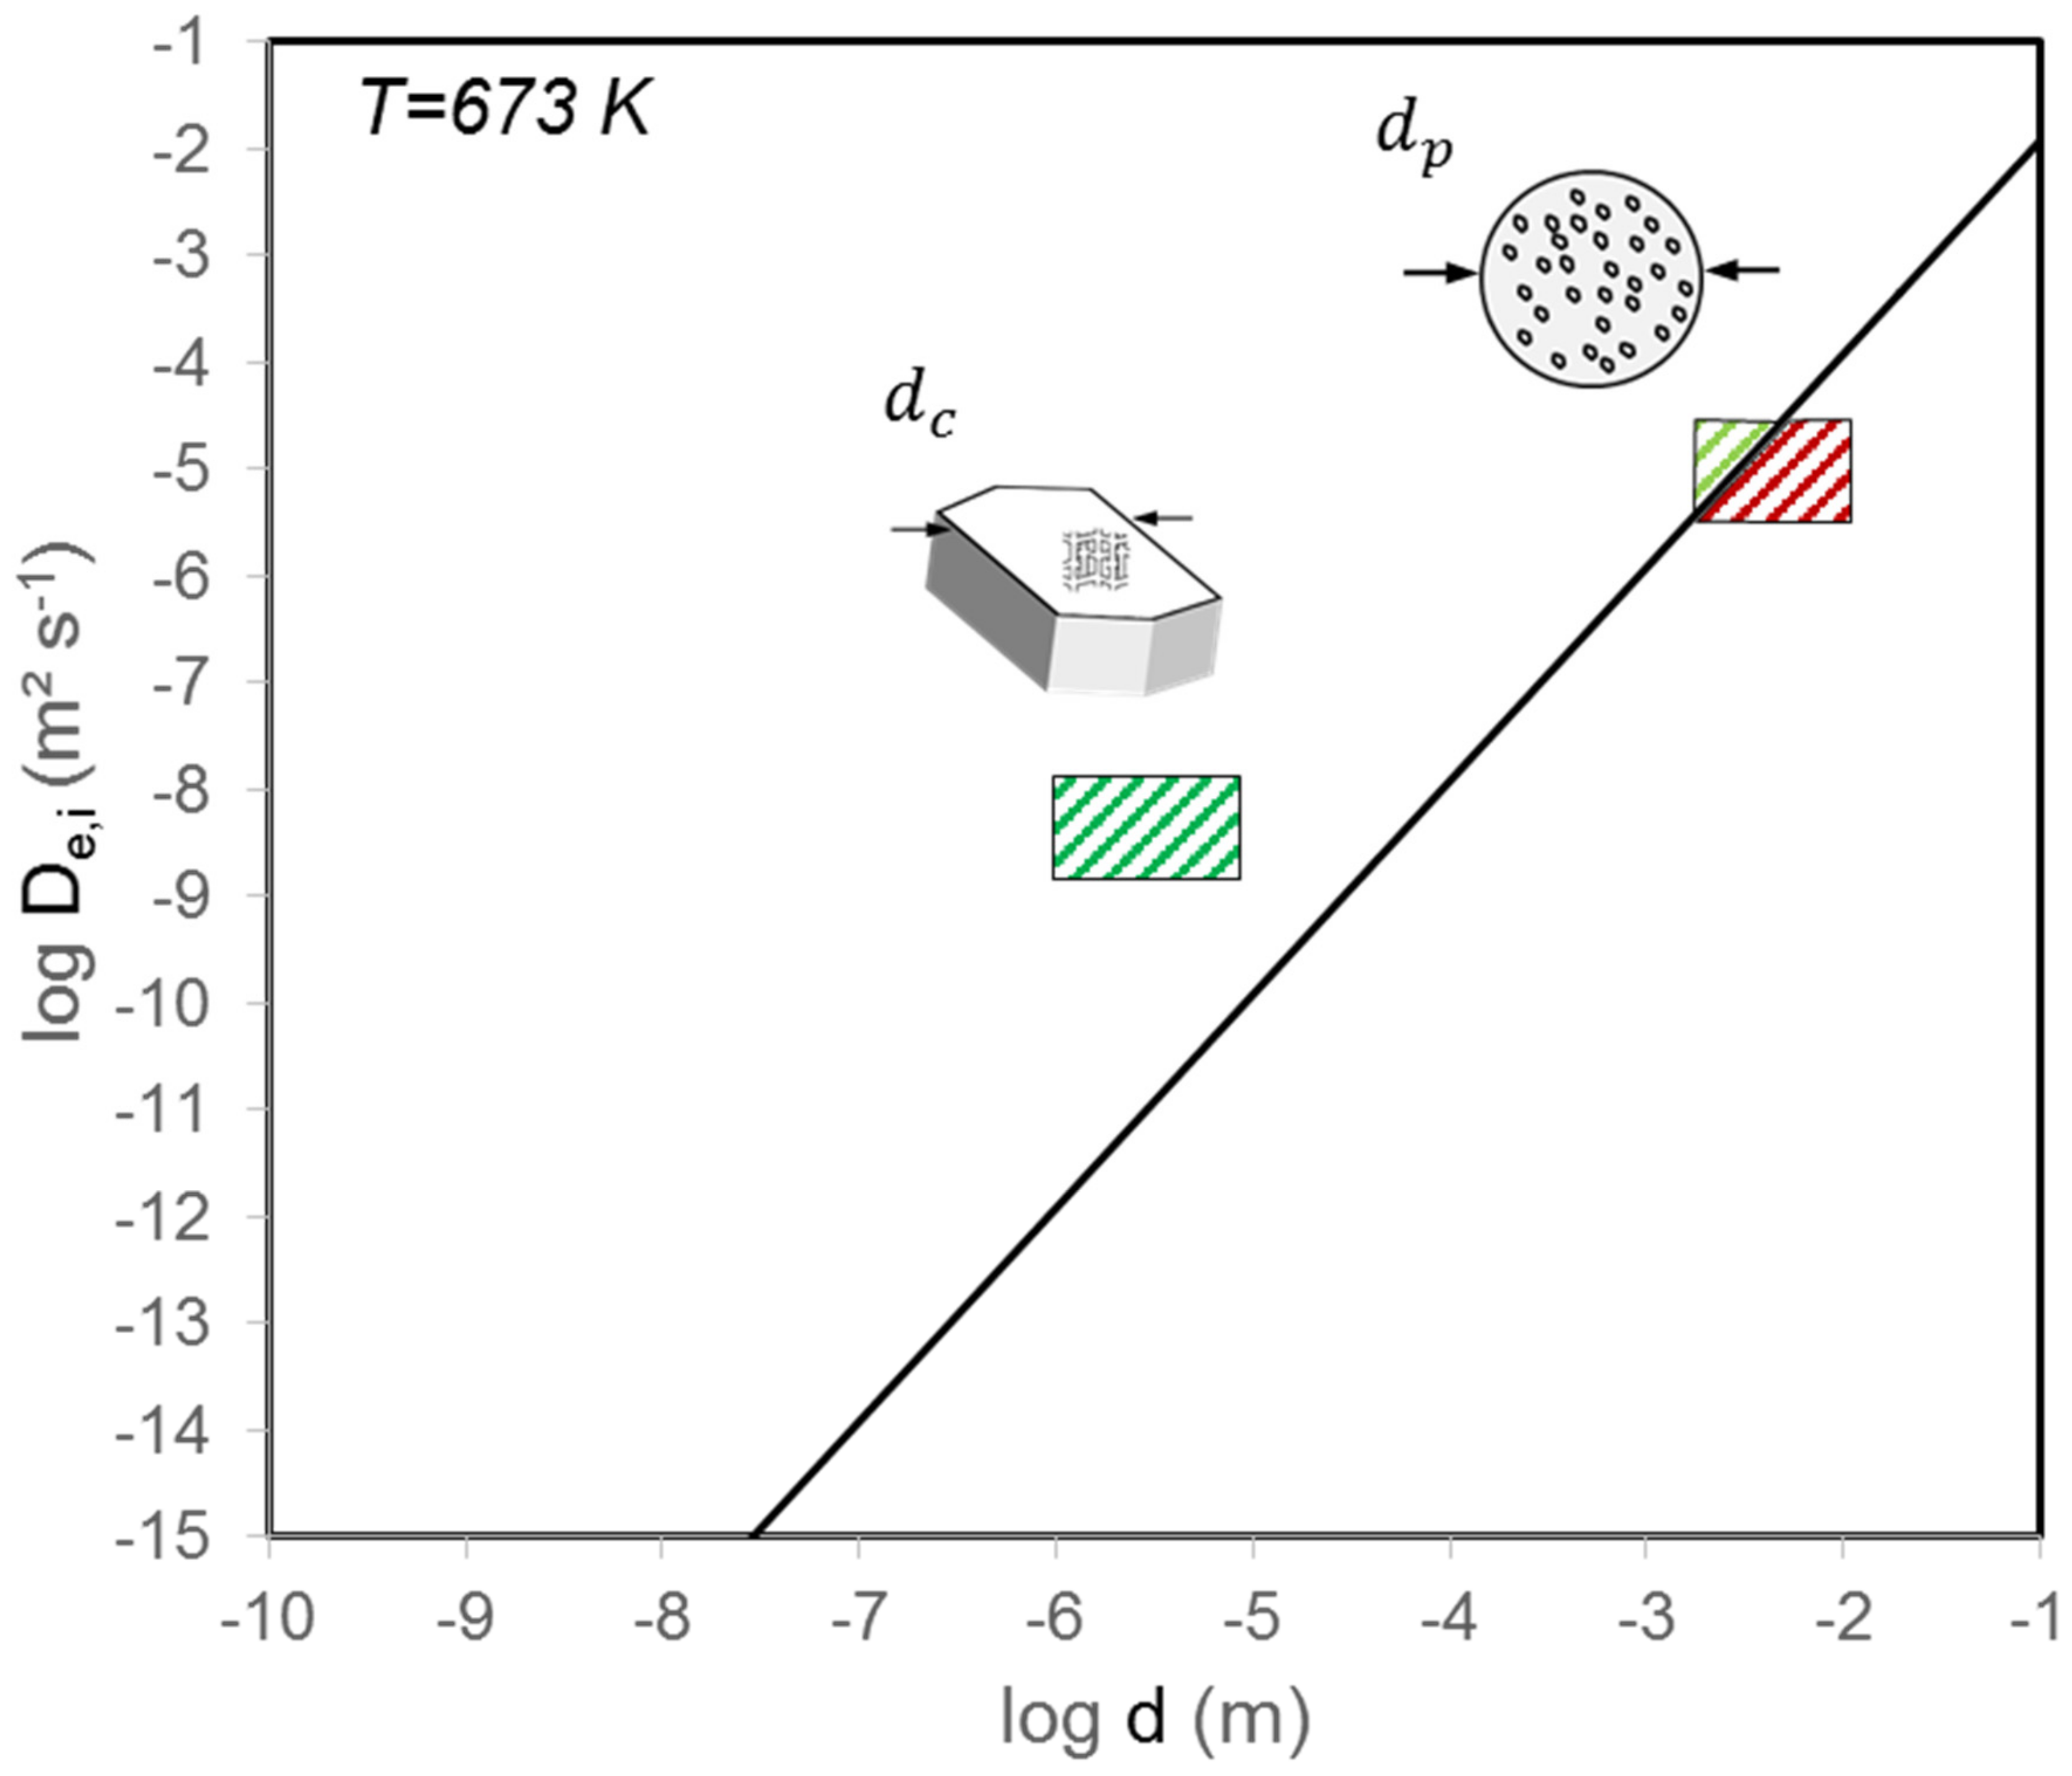
2. Assessment of Internal and External Mass and Heat Transfer Limitations
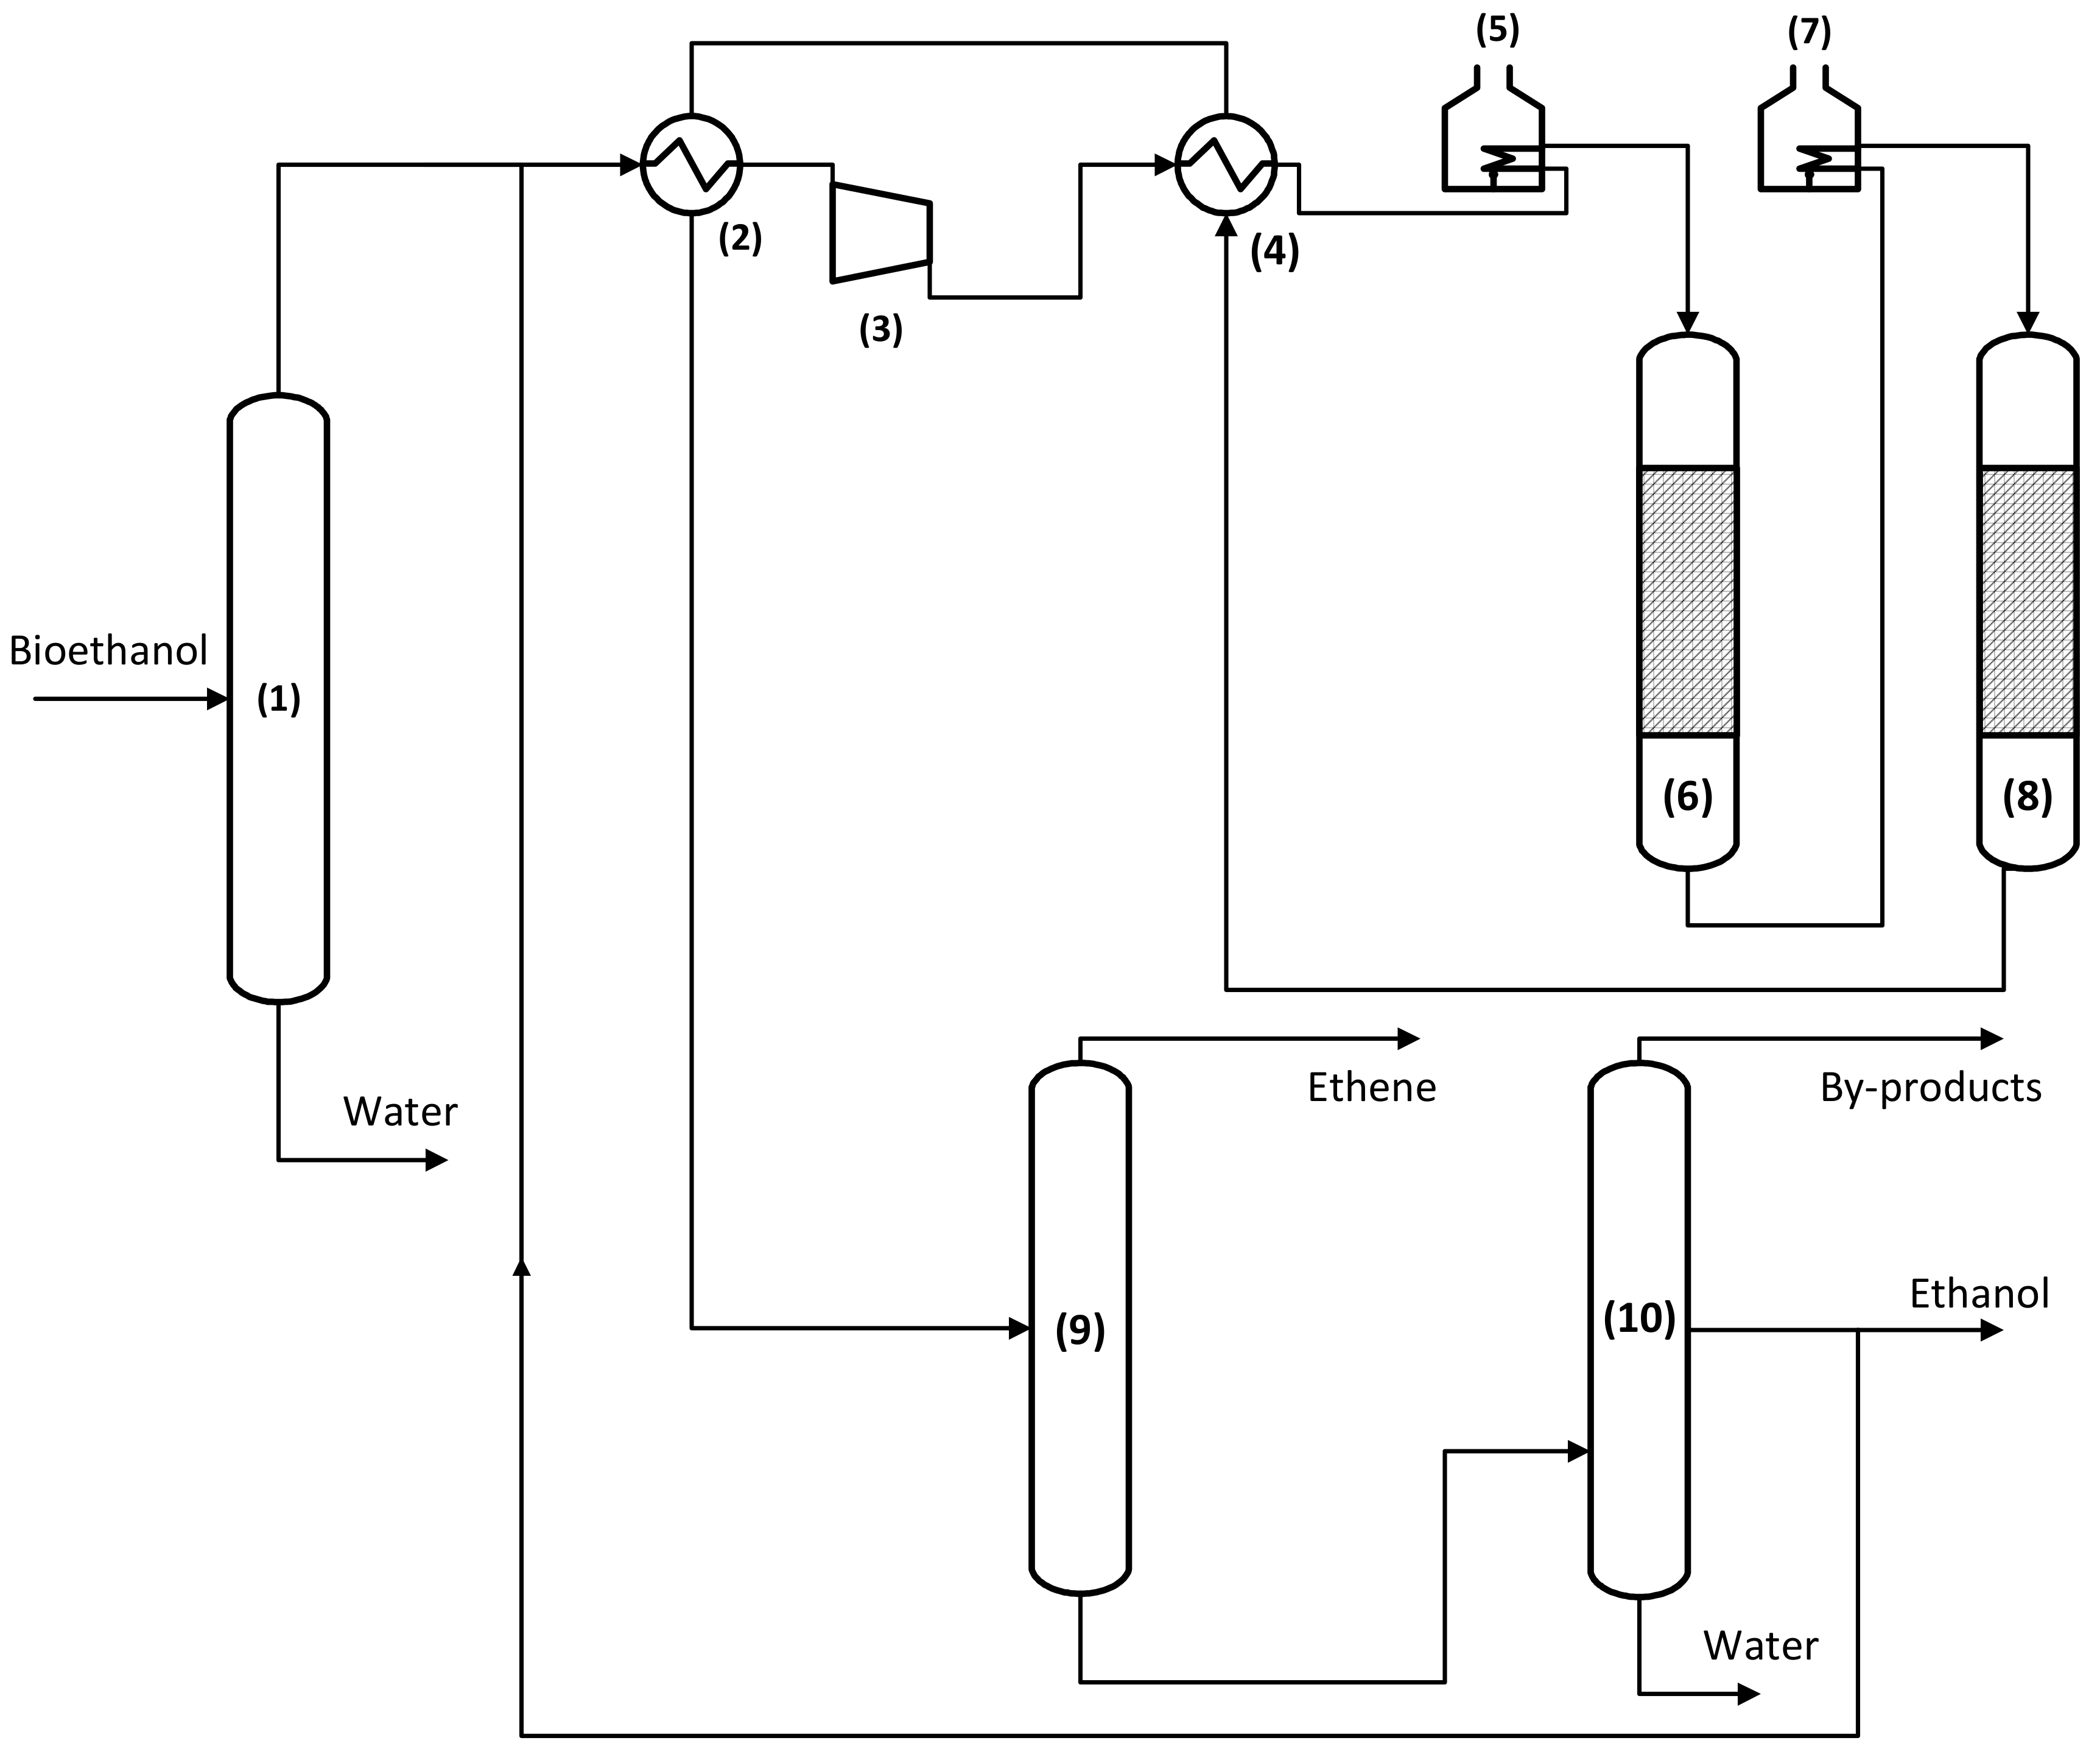
3. Industrial Reactor Model for Ethanol Dehydration
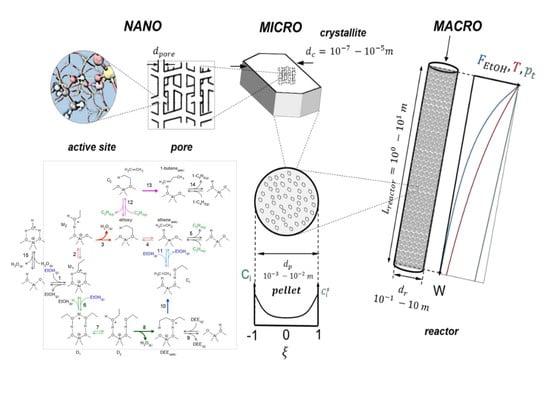
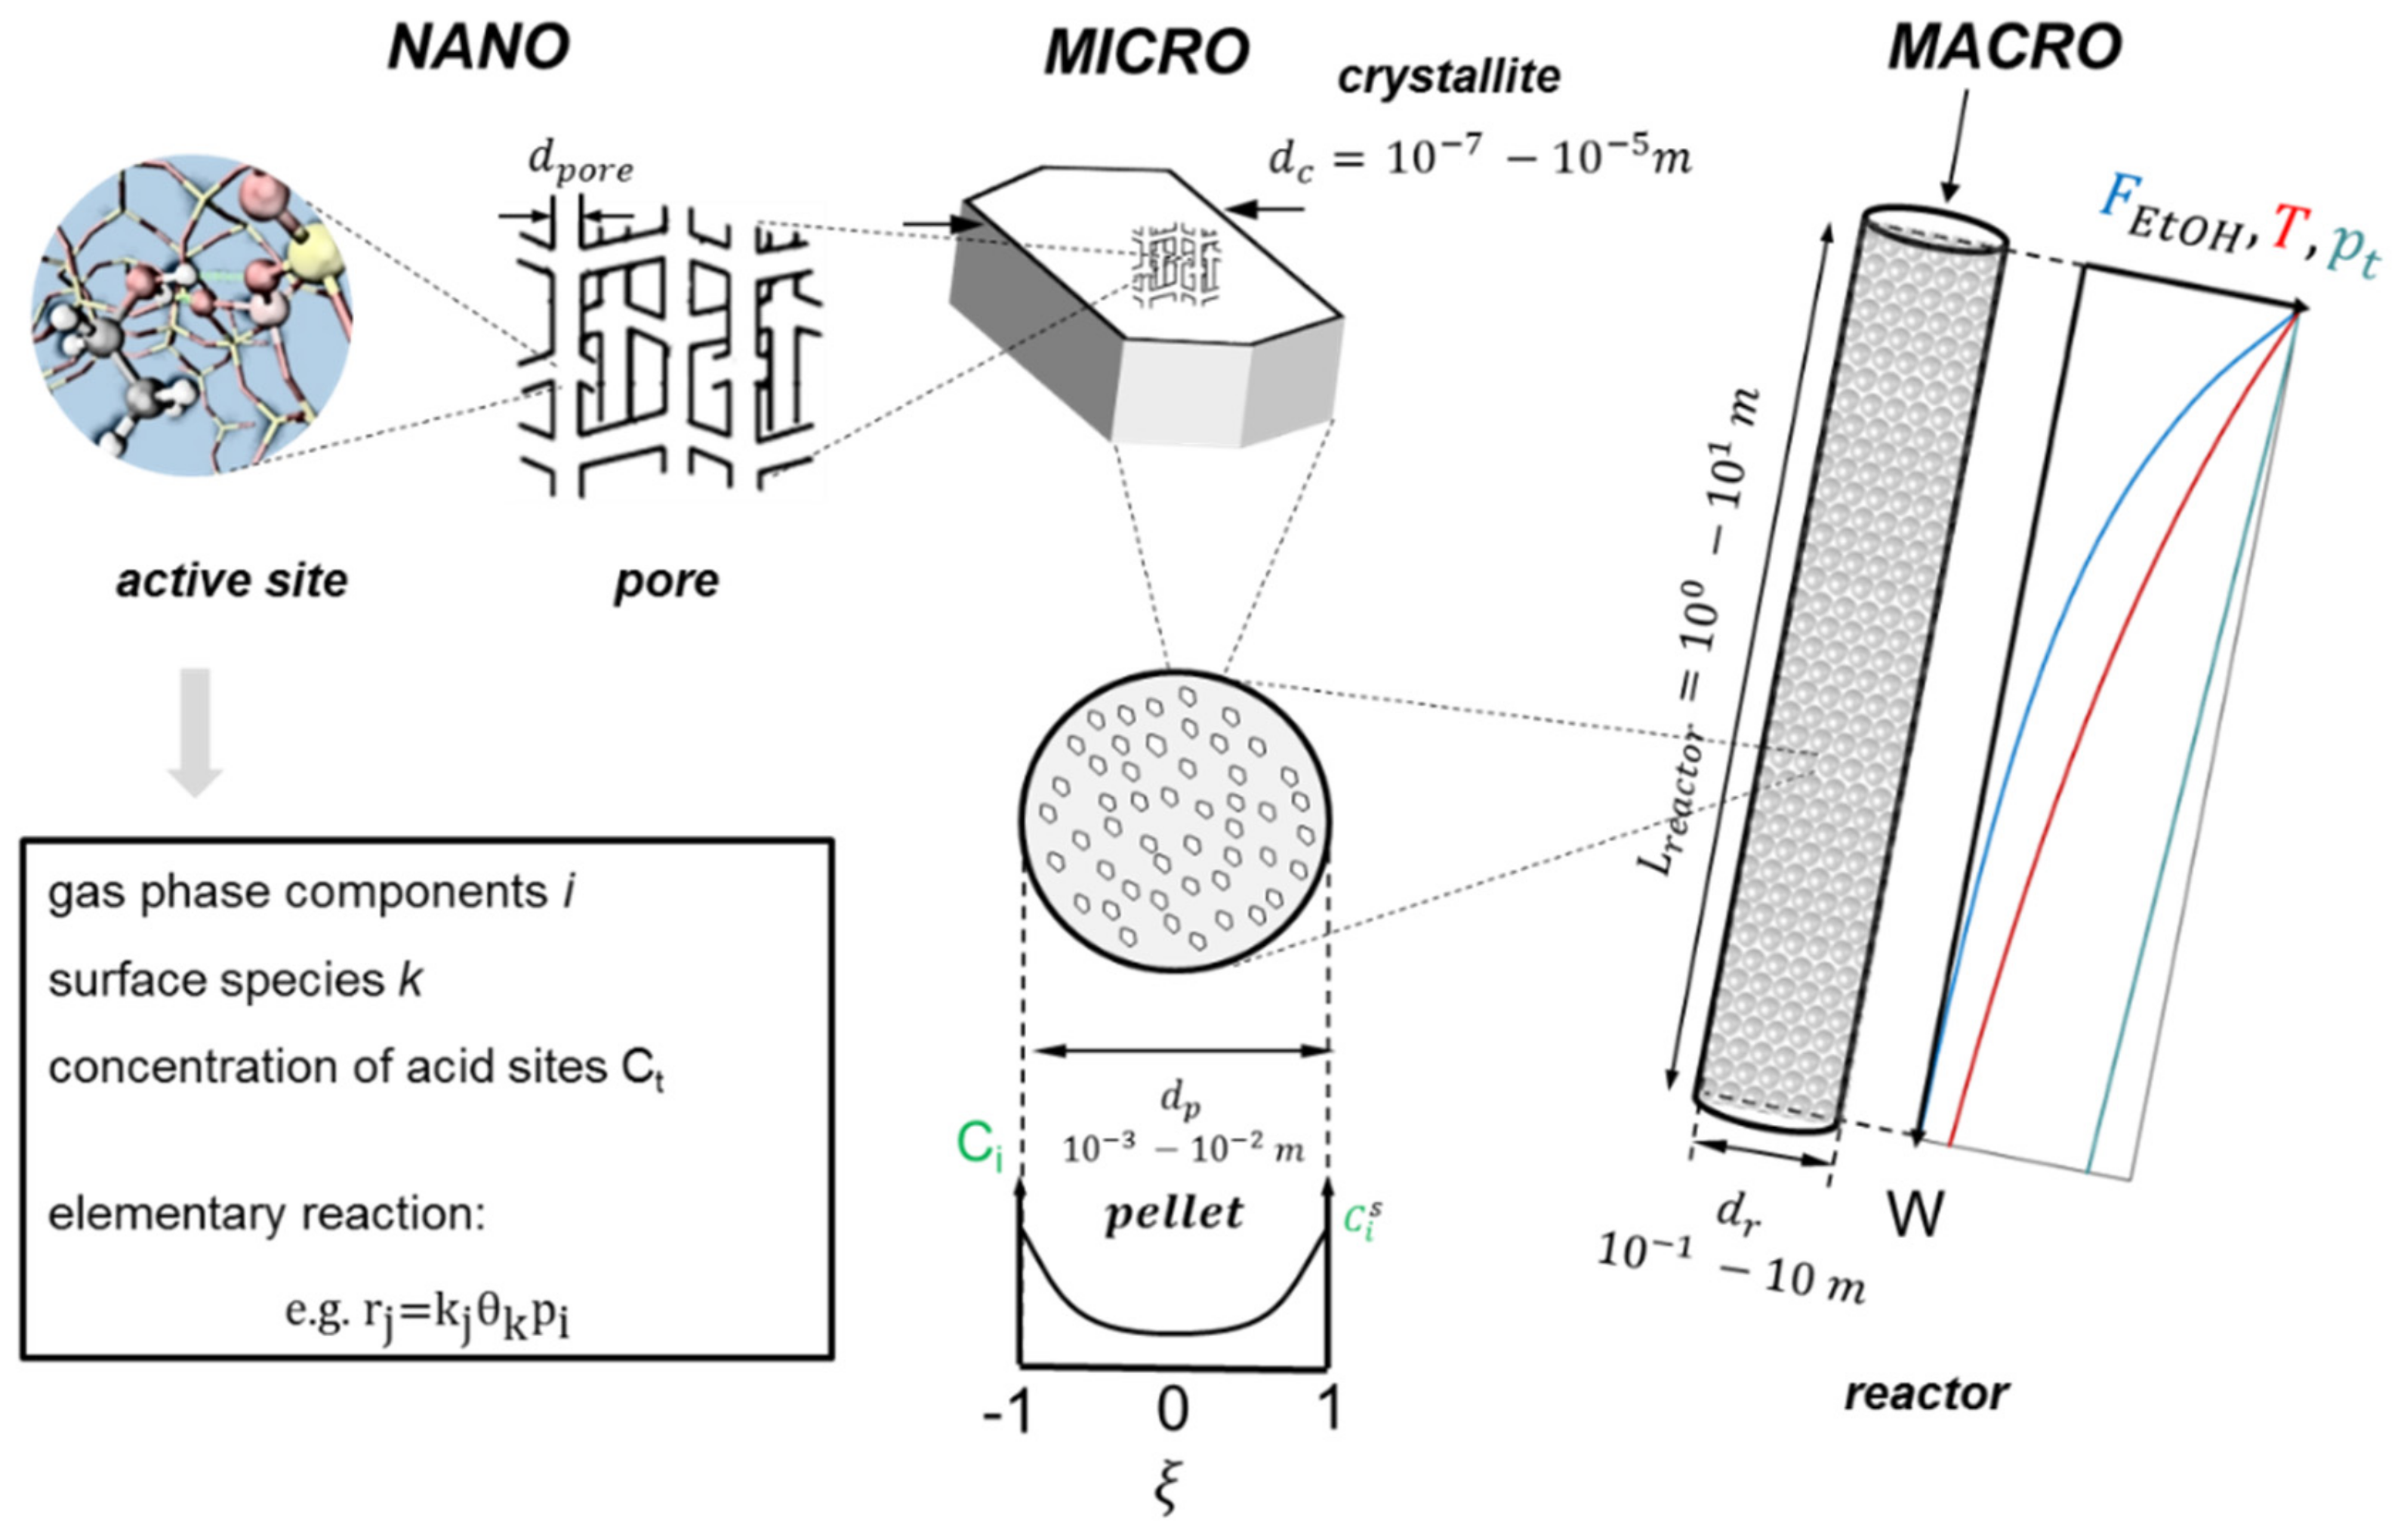
3.1. Reactor Model
3.1.1. Macroscale: The Reactor
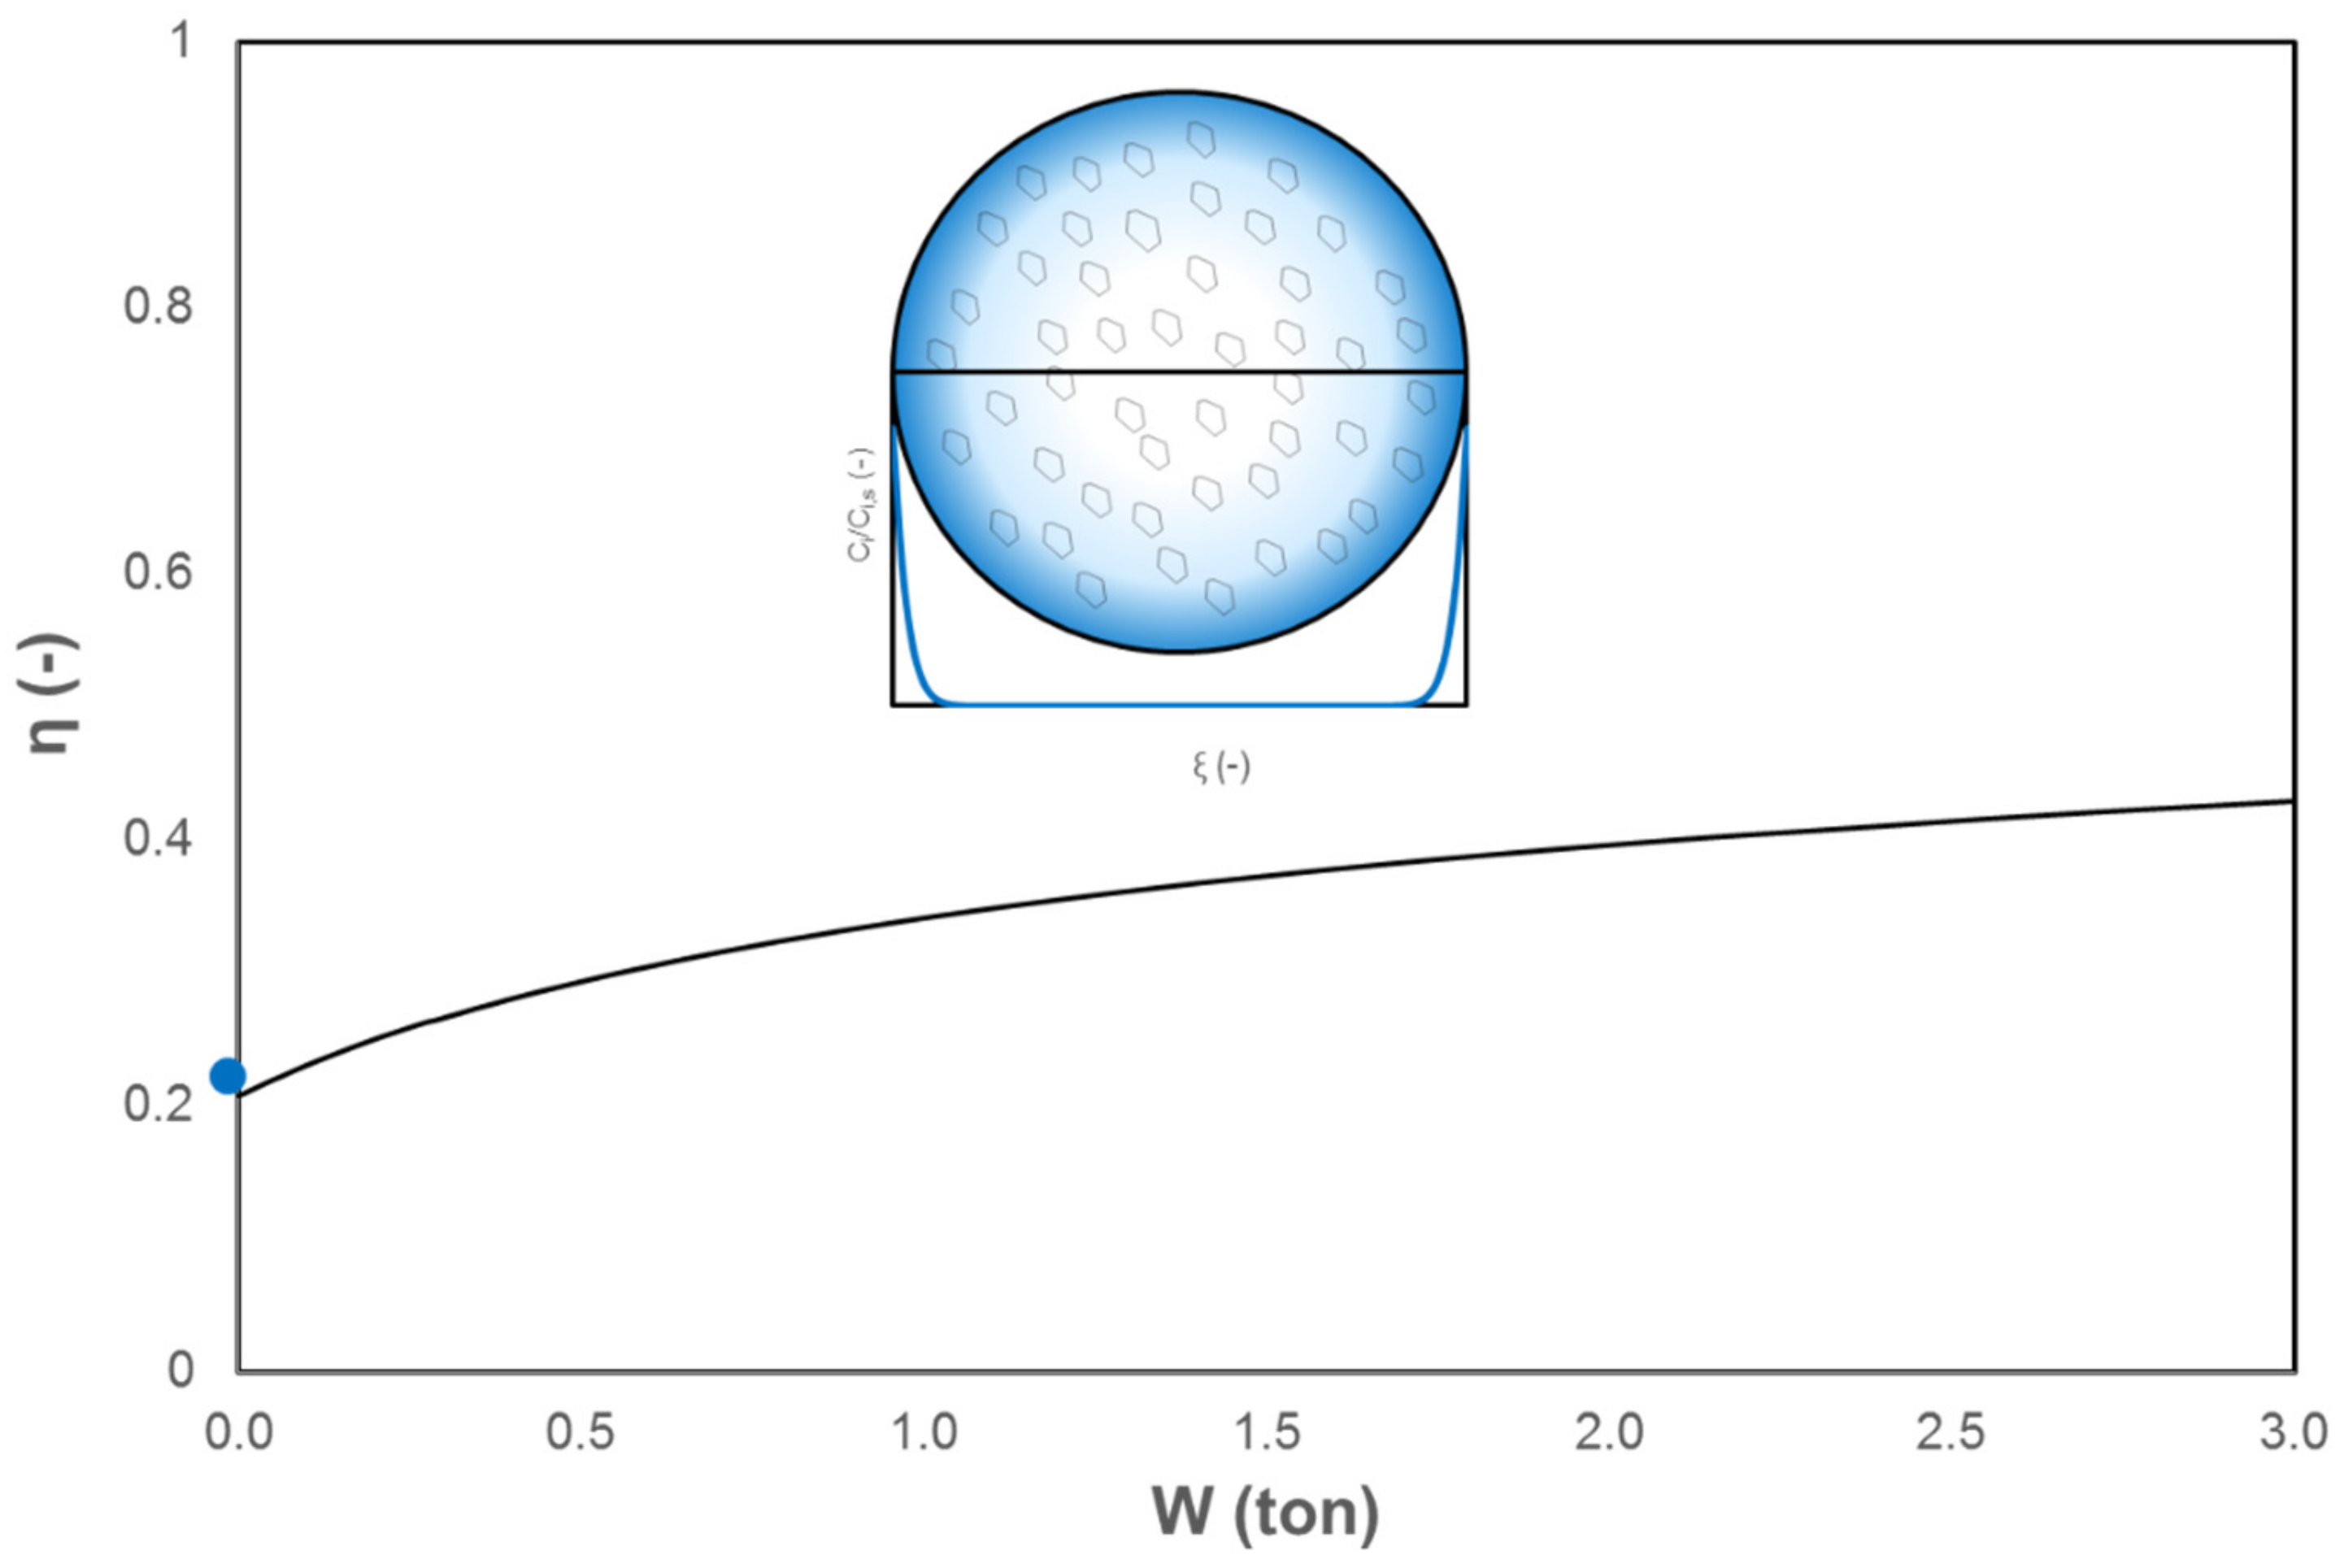
3.1.2. Microscale: The Catalyst Pellet
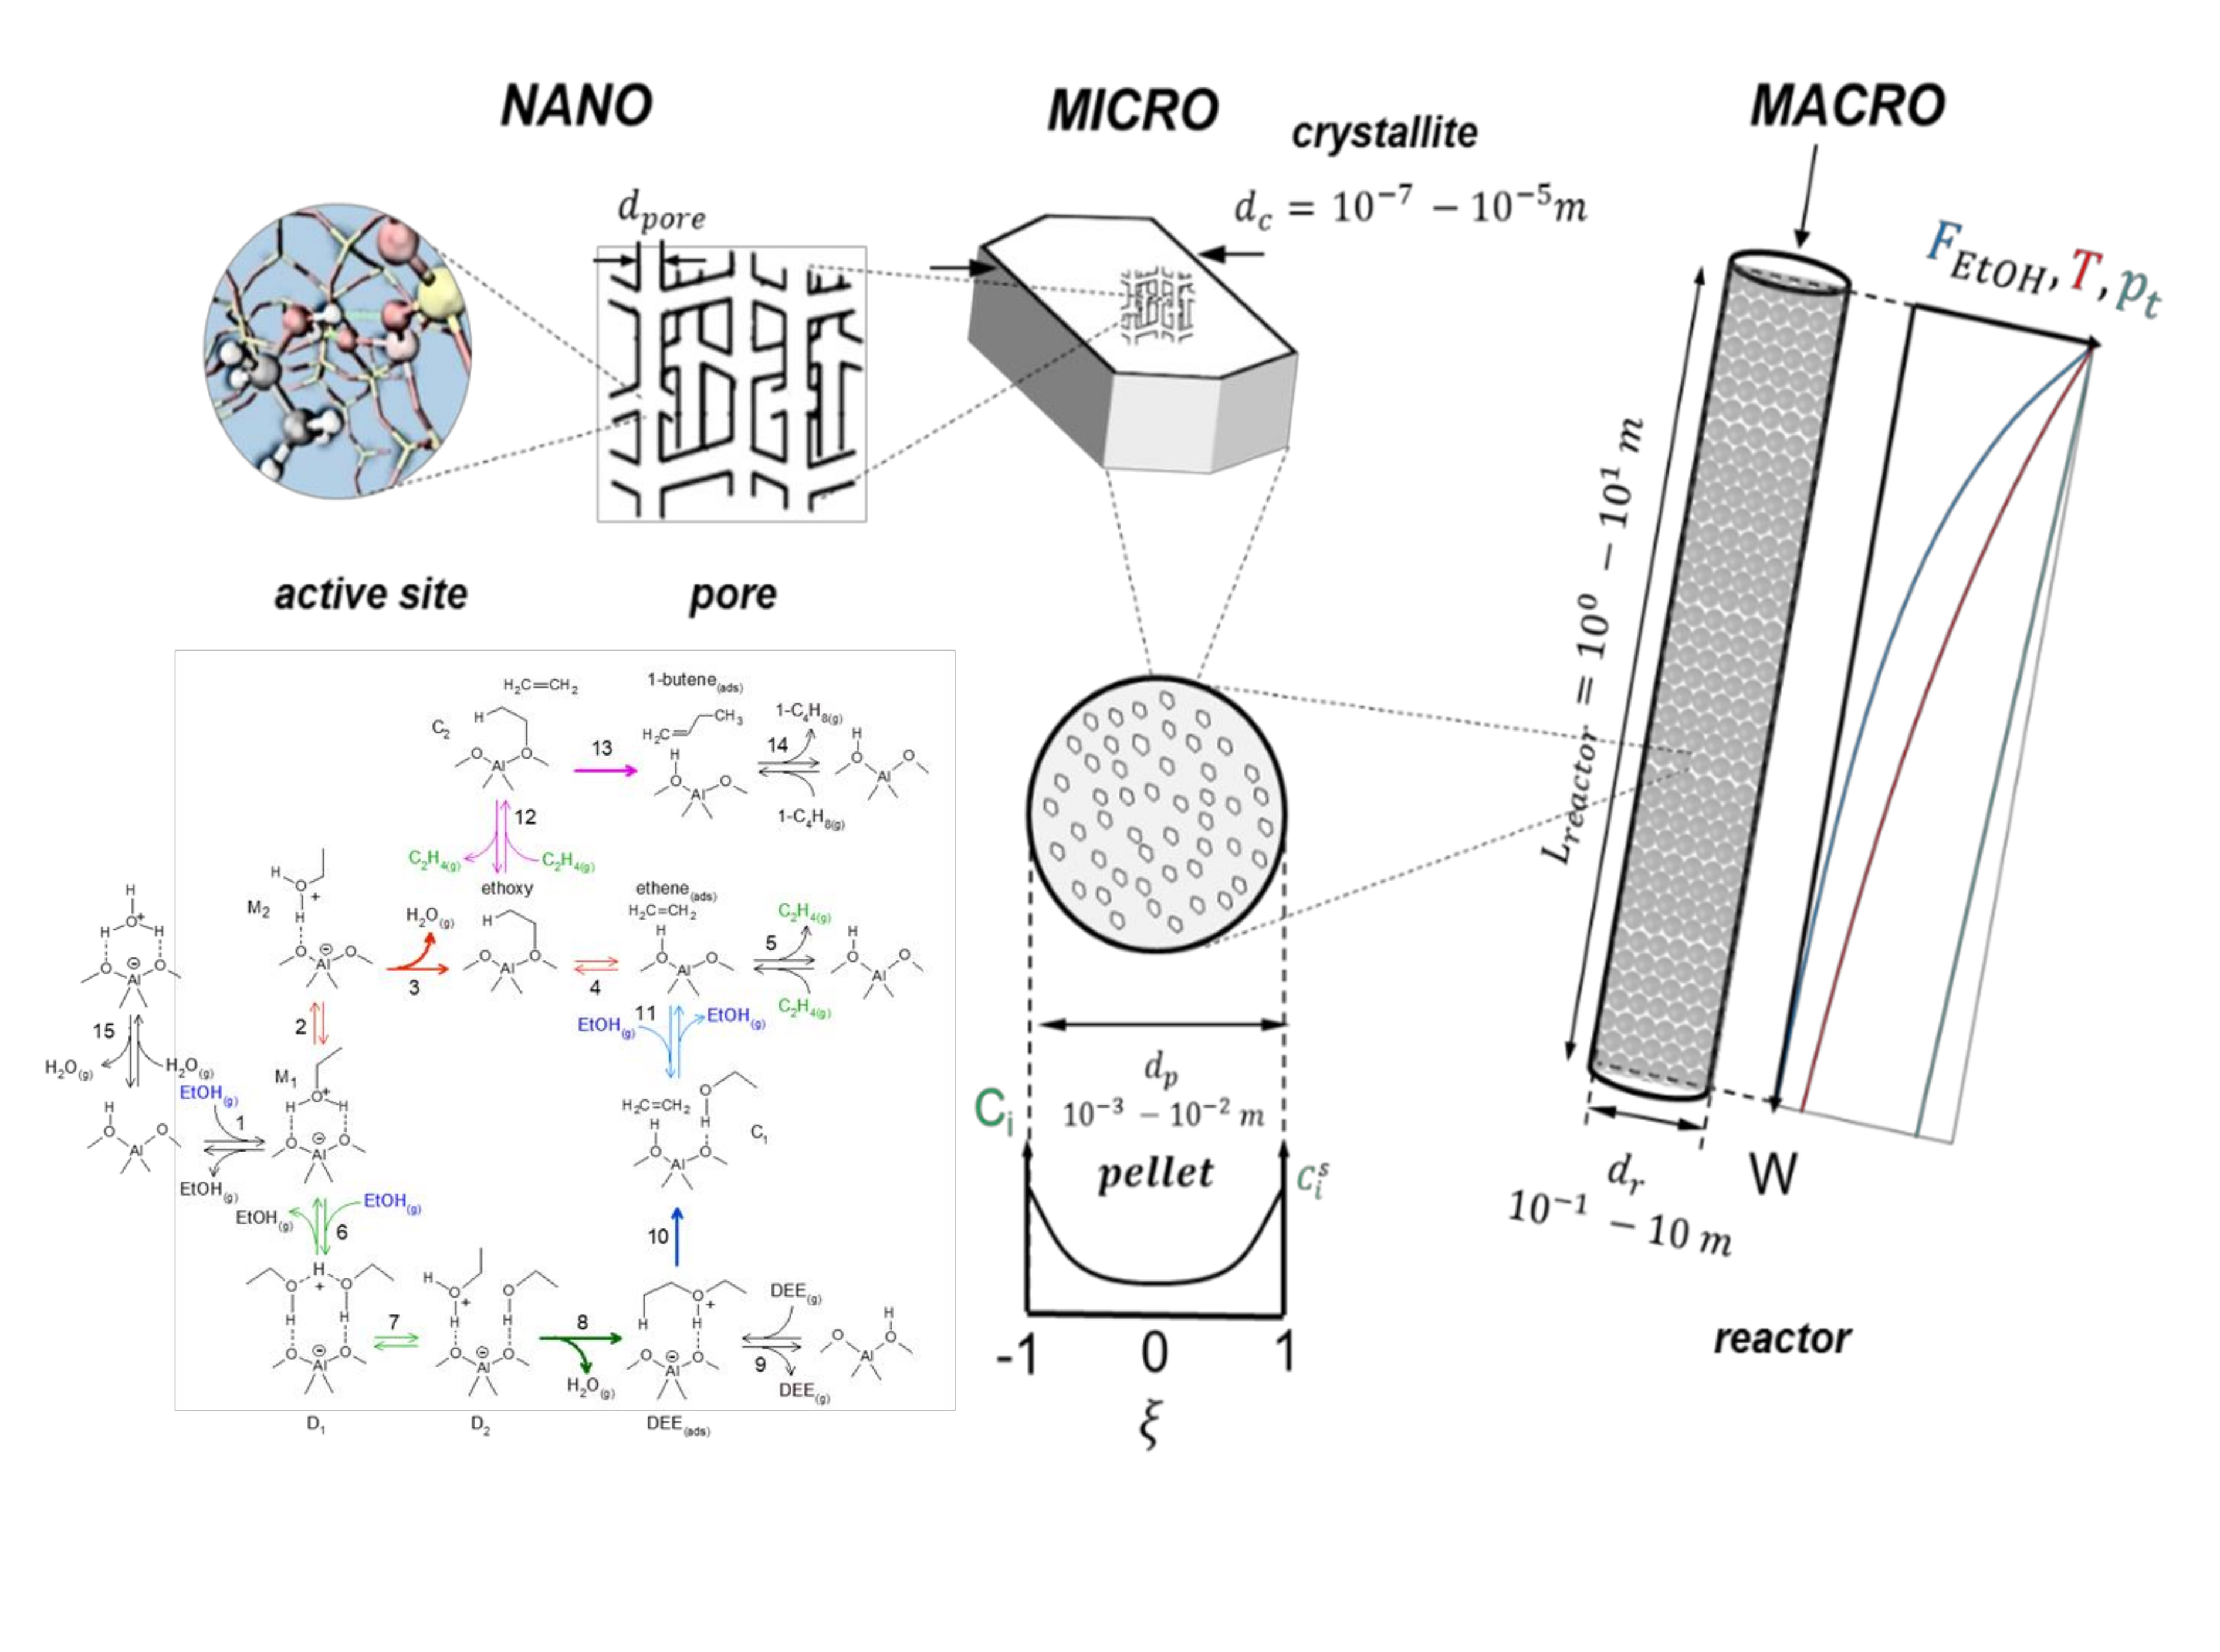
3.1.3. Nanoscale: The Active Site
4. Multi-Scale Reactor Model Validation
5. Optimization of an Industrial Ethanol Dehydration Reactor
- (I).
- Dehydration of pure ethanol, i.e., no additional water added in the feed, which considers ethanol, ethene, di-ethyl ether, and water in the product mixture.
- (II).
- Dehydration of aqueous ethanol, i.e., 90 mol% water contained in the feed, which corresponds to the lower limit of ethanol content obtained via biomass fermentation. This case also considers ethanol, ethene, di-ethyl ether, and water in the product mixture.
- (III).
- Dehydration of aqueous ethanol, i.e., 90 mol% water in the feed, with dimerization of ethene included as a model reaction for the formation of higher hydrocarbons. In addition to the compounds mentioned above, 1-butene was also added to the calculation.
6. Conclusions
Author Contributions
Funding
Conflicts of Interest
List of Symbols
| Roman symbols | |
| * | free acid sitessur |
| Ar | face area of the cross section of the reactor [m2] |
| cp | specific heat capacity [J kg−1 K−1] |
| Cp | specific molar heat capacity [J mol−1 K−1] |
| concentration of component i in the pellet | |
| Ct | acid site concentration [molH+ kg−1] |
| d | diameter [m] |
| effective diffusion coefficient of component i [m2 s−1] | |
| f | friction factor [-] |
| molar flow rate of gas phase component i [mol s−1] | |
| G | mass flow rate [kg s−1] |
| Gibbs free energy of reaction [J mol−1] | |
| h | Planck constant = 6.63. 10−34 m2 kg s−1 |
| enthalpy of reaction [J mol−1] | |
| kB | Boltzmann’s constant = 1.38. 10−23 m2 kg s−2 K−1 |
| kj | rate coefficient of elementary step j [variable] |
| M | molecular mass [kg mol−1] |
| n | apparent order of reaction |
| ncomp | number of components |
| Ni | molar flux of i with respect to a fixed plane [mol m−2 s−1] |
| pi | partial pressure of component i [Pa] |
| pt | total reactor pressure [Pa] |
| us | superficial velocity [m s−1] |
| r | radius of the catalyst pellet [m] |
| R | universal gas constant = 8.31 J mol−1 K−1 |
| Ri | net production rate of component i [mol molH+−1 s−1] |
| Si | selectivity of component i [mol mol−1] |
| entropy of reaction [J mol−1 K−1] | |
| T | temperature [K] |
| v | stoichiometric coefficient |
| V | volume [m³] |
| W | catalyst mass [kg] |
| Xi | conversion of component i [mol mol−1] |
| yi | molar fraction of component i in the gas phase [mol mol−1] |
| Yi | yield of component i [mol mol−1] |
| Greek symbols | |
| porosity [-] | |
| catalyst effectiveness [-] | |
| dynamic viscosity [Pa s] | |
| density [kg m−3] | |
| dimensionless distance [-] | |
| fractional coverage of surface species k [-] | |
| Subscripts | |
| b | catalyst bed |
| bl | bulk |
| f | formation |
| fl | fluid |
| i | gas phase species |
| j | elementary step |
| k | surface species |
| p | catalyst pellet |
| pore | pore |
| m | mixture |
| r | reaction |
| r | reactor |
| s | surface |
| v | volumetric |
| Subscripts | |
| average | |
| ‡ | activation |
| ° | inlet |
| ° | standard |
| C2H4 | ethene |
| EtOH | ethanol |
References
- Derouane, E.G.; Nagy, J.B.; Dejaifve, P.; Vanhooff, J.H.C.; Spekman, B.P.; Vedrine, J.C.; Naccache, C. Elucidation of Mechanism of Conversion of Methanol and Ethanol to Hydrocarbons on a New Type of Synthetic Zeolite. J. Catal. 1978, 53, 40–55. [Google Scholar] [CrossRef]
- Sheldon, R.A. Green and sustainable manufacture of chemicals from biomass: State of the art. Green Chem. 2014, 16, 950–963. [Google Scholar] [CrossRef]
- Donnis, B.; Egeberg, R.G.; Blom, P.; Knudsen, K.G. Hydroprocessing of Bio-Oils and Oxygenates to Hydrocarbons. Understanding the Reaction Routes. Top. Catal. 2009, 52, 229–240. [Google Scholar] [CrossRef]
- Barrocas, H.V.V.; da Silva, J.B.d.M.; de Assis, R.C. Process for Preparing Ethene. U.S. Patent 4232179 A, 4 November 1980. [Google Scholar]
- Phung, T.K.; Hernández, L.P.; Lagazzo, A.; Busca, G. Dehydration of Ethanol over Zeolites, Silica Alumina and Alumina: Lewis Acidity, Brønsted Acidity and Confinement EffectsAppl. Catal. A: General 2015, 493, 77–89. [Google Scholar] [CrossRef]
- Coupard, V.; Touchais, N.; Fleurier, S.; Penas, H.G.; de Smedt, P.; Vermeiren, W.; Adam, C.; Minoux, D. Process for Dehydration of Dilute Ethanol into Ethylene with Low Energy Consumption without Recycling of Water. U.S. Patent 20130090510 A1, 11 April 2013. [Google Scholar]
- Jiang, B.; Feng, X.; Yan, L.; Jiang, Y.; Liao, Z.; Wang, J.; Yang, Y. Methanol to Propylene Process in a Moving Bed Reactor with Byproducts Recycling: Kinetic Study and Reactor Simulation. Ind. Eng. Chem. Res. 2014, 53, 4623–4632. [Google Scholar] [CrossRef]
- Lee, W.L.; Froment, G.F. Ethylbenzene Dehydrogenation into Styrene: Kinetic Modeling and Reactor Simulation. Ind. Eng. Chem. Res. 2008, 47, 9183–9194. [Google Scholar] [CrossRef]
- Froment, G.F.; Depauw, G.A.; Vanrysselberghe, V. Kinetic Modeling and Reactor Simulation in Hydrodesulfurization of Oil Fractions. Ind. Eng. Chem. Res. 1994, 33, 2975–2988. [Google Scholar] [CrossRef]
- Dewachtere, N.V.; Santaella, F.; Froment, G.F. Application of a single-event kinetic model in the simulation of an industrial riser reactor for the catalytic cracking of vacuum gas oil. Chem. Eng. Sci. 1999, 54, 3653–3660. [Google Scholar] [CrossRef]
- Batchu, R.; Galvita, V.V.; Alexopoulos, K.; Glazneva, T.S.; Poelman, H.; Reyniers, M.-F.; Marin, G.B. Ethanol dehydration pathways in H-ZSM-5: Insights from temporal analysis of products. Catal. Today 2019. [Google Scholar] [CrossRef]
- Sabbe, M.K.; van Geem, K.M.; Reyniers, M.F.; Marin, G.B. First Principle-Based Simulation of Ethane Steam Cracking. AiChe J. 2011, 57, 482–496. [Google Scholar] [CrossRef]
- Jacobsen, C.J.H.; Dahl, S.; Boisen, A.; Clausen, B.S.; Topsøe, H.; Logadottir, A.; Nørskov, J.K. Optimal Catalyst Curves: Connecting Density Functional Theory Calculations with Industrial Reactor Design and Catalyst Selection. J. Catal. 2002, 205, 382–387. [Google Scholar] [CrossRef]
- Sabbe, M.K.; Canduela-Rodriguez, G.; Reyniers, M.-F.; Marin, G.B. DFT-based modeling of benzene hydrogenation on Pt at industrially relevant coverage. J. Catal. 2015, 330, 406–422. [Google Scholar] [CrossRef]
- Alwahabi, S.M.; Froment, G.F. Conceptual Reactor Design for the Methanol-to-Olefins Process on SAPO-34. Ind. Eng. Chem. Res. 2004, 43, 5112–5122. [Google Scholar] [CrossRef]
- Park, T.-Y.; Froment, G.F. Analysis of Fundamental Reaction Rates in the Methanol-to-Olefins Process on ZSM-5 as a Basis for Reactor Design and Operation. Ind. Eng. Chem. Res. 2004, 43, 682–689. [Google Scholar] [CrossRef]
- Zhuang, Y.-Q.; Gao, X.; Zhu, Y.-P.; Luo, Z.-H. CFD modeling of methanol to olefins process in a fixed-bed reactor. Powder Technol. 2012, 221, 419–430. [Google Scholar] [CrossRef]
- Zhao, Y.; Li, H.; Ye, M.; Liu, Z. 3D Numerical Simulation of a Large Scale MTO Fluidized Bed Reactor. Ind. Eng. Chem. Res. 2013, 52, 11354–11364. [Google Scholar] [CrossRef]
- Berger, R.J.; Stitt, E.H.; Marin, G.B.; Kapteijn, F.; Moulijn, J.A. Eurokin. Chemical Reaction Kinetics in Practice. CATTECH 2001, 5, 36–60. [Google Scholar] [CrossRef]
- Kokotailo, G.T.; Lawton, S.L.; Olson, D.H.; Olson, D.H.; Meier, W.M. Structure of Synthetic Zeolite ZSM-5. Nature 1978, 272, 437–438. [Google Scholar] [CrossRef]
- Weisz, P.B.; Prater, C.D. Interpretation of Measurements in Experimental Catalysis. In Advances in Catalysis; Frankenburg, V.I.K.W.G., Rideal, E.K., Eds.; Academic Press: New York, NY, USA, 1954; pp. 143–196. [Google Scholar]
- Mears, D.E. Diagnostic Criteria for Heat Transport Limitations in Fixed Bed Reactors. J. Catal. 1971, 20, 127–132. [Google Scholar] [CrossRef]
- Froment, G.F.; de Wilde, J.; Bischoff, K.B. Chemical Reactor Analysis and Design, 3rd ed.; Wiley: Hoboken, NJ, USA, 2011. [Google Scholar]
- Reid, R.C.; Prausnitz, J.M.; Sherwood, T.K. The Properties of Gases and Liquids, 3rd ed.; McGraw-Hill: New York, NY, USA, 1977. [Google Scholar]
- Hicks, R.E. Pressure Drop in Packed Beds of Spheres. Ind. Eng. Chem. Fundam. 1970, 9, 500–502. [Google Scholar] [CrossRef]
- Haughey, D.P.; Beveridge, G.S.G. Structural properties of packed beds—A review. Can. J. Chem. Eng. 1969, 47, 130–140. [Google Scholar] [CrossRef]
- Bosanquet, C.H. British TA Report BR-507; Springer: London, UK, 1944. [Google Scholar]
- Maxwell, J.C. On the Dynamical Theory of Gases. Philos. Trans. R. Soc. Lond. 1867, 157, 49–88. [Google Scholar]
- Stefan, J. Über das Gleichgewicht un die Bewegung, insbesondere die Diffusion von Gasgemengen. Sitzungsberichte Akad Wiss Wien 1871, 63, 63–124. [Google Scholar]
- Wilke, C. Diffusional properties of multicomponent gases. Chem. Eng. Prog. 1950, 46, 95–104. [Google Scholar]
- Solsvik, J.; Jakobsen, H.A. Modeling of multicomponent mass diffusion in porous spherical pellets: Application to steam methane reforming and methanol synthesis. Chem. Eng. Sci. 2011, 66, 1986–2000. [Google Scholar] [CrossRef]
- Solsvik, J.; Jakobsen, H.A. Multicomponent mass diffusion in porous pellets: Effects of flux models on the pellet level and impacts on the reactor level. Application to methanol synthesis. Can. J. Chem. Eng. 2013, 91, 66–76. [Google Scholar] [CrossRef]
- Thybaut, J.W.; Marin, G.B. Single-Event MicroKinetics: Catalyst design for complex reaction networks. J. Catal. 2013, 308, 352–362. [Google Scholar] [CrossRef]
- Fuller, E.N.; Schettle, P.; Giddings, J.C. A New Method for Prediction of Binary Gas-Phase Diffusion Coeffecients. Ind. Eng. Chem. 1966, 58, 19. [Google Scholar]
- Reid, R.C.; Prausnitz, J.M.; Poling, B.E. The Properties of Gases and Liquids, 4th ed.; McGraw-Hill: New York, NY, USA, 1987. [Google Scholar]
- Reyniers, M.-F.; Marin, G.B. Experimental and Theoretical Methods in Kinetic Studies of Heterogeneously Catalyzed Reactions. Annu. Rev. Chem. Biomol. Eng. 2014, 5, 563–594. [Google Scholar] [CrossRef]
- Alexopoulos, K.; John, M.; van der Borght, K.; Galvita, V.; Reyniers, M.-F.; Marin, G.B. DFT-based microkinetic modeling of ethanol dehydration in H-ZSM-5. J. Catal. 2016, 339, 173–185. [Google Scholar] [CrossRef]
- Johansson, R.; Hruby, S.L.; Rass-Hansen, J.; Christensen, C.H. The Hydrocarbon Pool in Ethanol-to-Gasoline over HZSM-5 Catalysts. Catal. Lett. 2009, 127, 1–6. [Google Scholar] [CrossRef]
- Madeira, F.F.; Gnep, N.S.; Magnoux, P.; Vezin, H.; Maury, S.; Cadran, N. Mechanistic insights on the ethanol transformation into hydrocarbons over HZSM-5 zeolite. Chem. Eng. J. 2010, 161, 403–408. [Google Scholar] [CrossRef]
- Aguayo, A.T.; Gayubo, A.G.; Atutxa, A.; Olazar, M.; Bilbao, J. Catalyst deactivation by coke in the transformation of aqueous ethanol into hydrocarbons. Kinetic modeling and acidity deterioration of the catalyst. Ind. Eng. Chem. Res. 2002, 41, 4216–4224. [Google Scholar] [CrossRef]
- Macht, J.; Janik, M.J.; Neurock, M.; Iglesia, E. Mechanistic Consequences of Composition in Acid Catalysis by Polyoxometalate Keggin Clusters. J. Am. Chem. Soc. 2008, 130, 10369–10379. [Google Scholar] [CrossRef] [PubMed]
- Phillips, C.B.; Datta, R. Production of ethylene from hydrous ethanol on H-ZSM-5 under mild conditions. Ind. Eng. Chem. Res. 1997, 36, 4466–4475. [Google Scholar] [CrossRef]
- Zhi, Y.C.; Shi, H.; Mu, L.Y.; Liu, Y.; Mei, D.H.; Camaioni, D.M.; Lercher, J.A. Dehydration Pathways of 1-Propanol on HZSM-5 in the Presence and Absence of Water. J. Am. Chem. Soc. 2015, 137, 15781–15794. [Google Scholar] [CrossRef]


| Heat Transport Limitations | ||||
|---|---|---|---|---|
| External | Equation (3) | 0.012 | <2.35 | |
| Internal | Equation (4) | 0.736 | <2.35 | |
| Mass transport limitations | ||||
| External | Equation (2) | Ca | 0.00764 | <0.05 |
| Internal | Equation (1) | See Figure 2 | ||
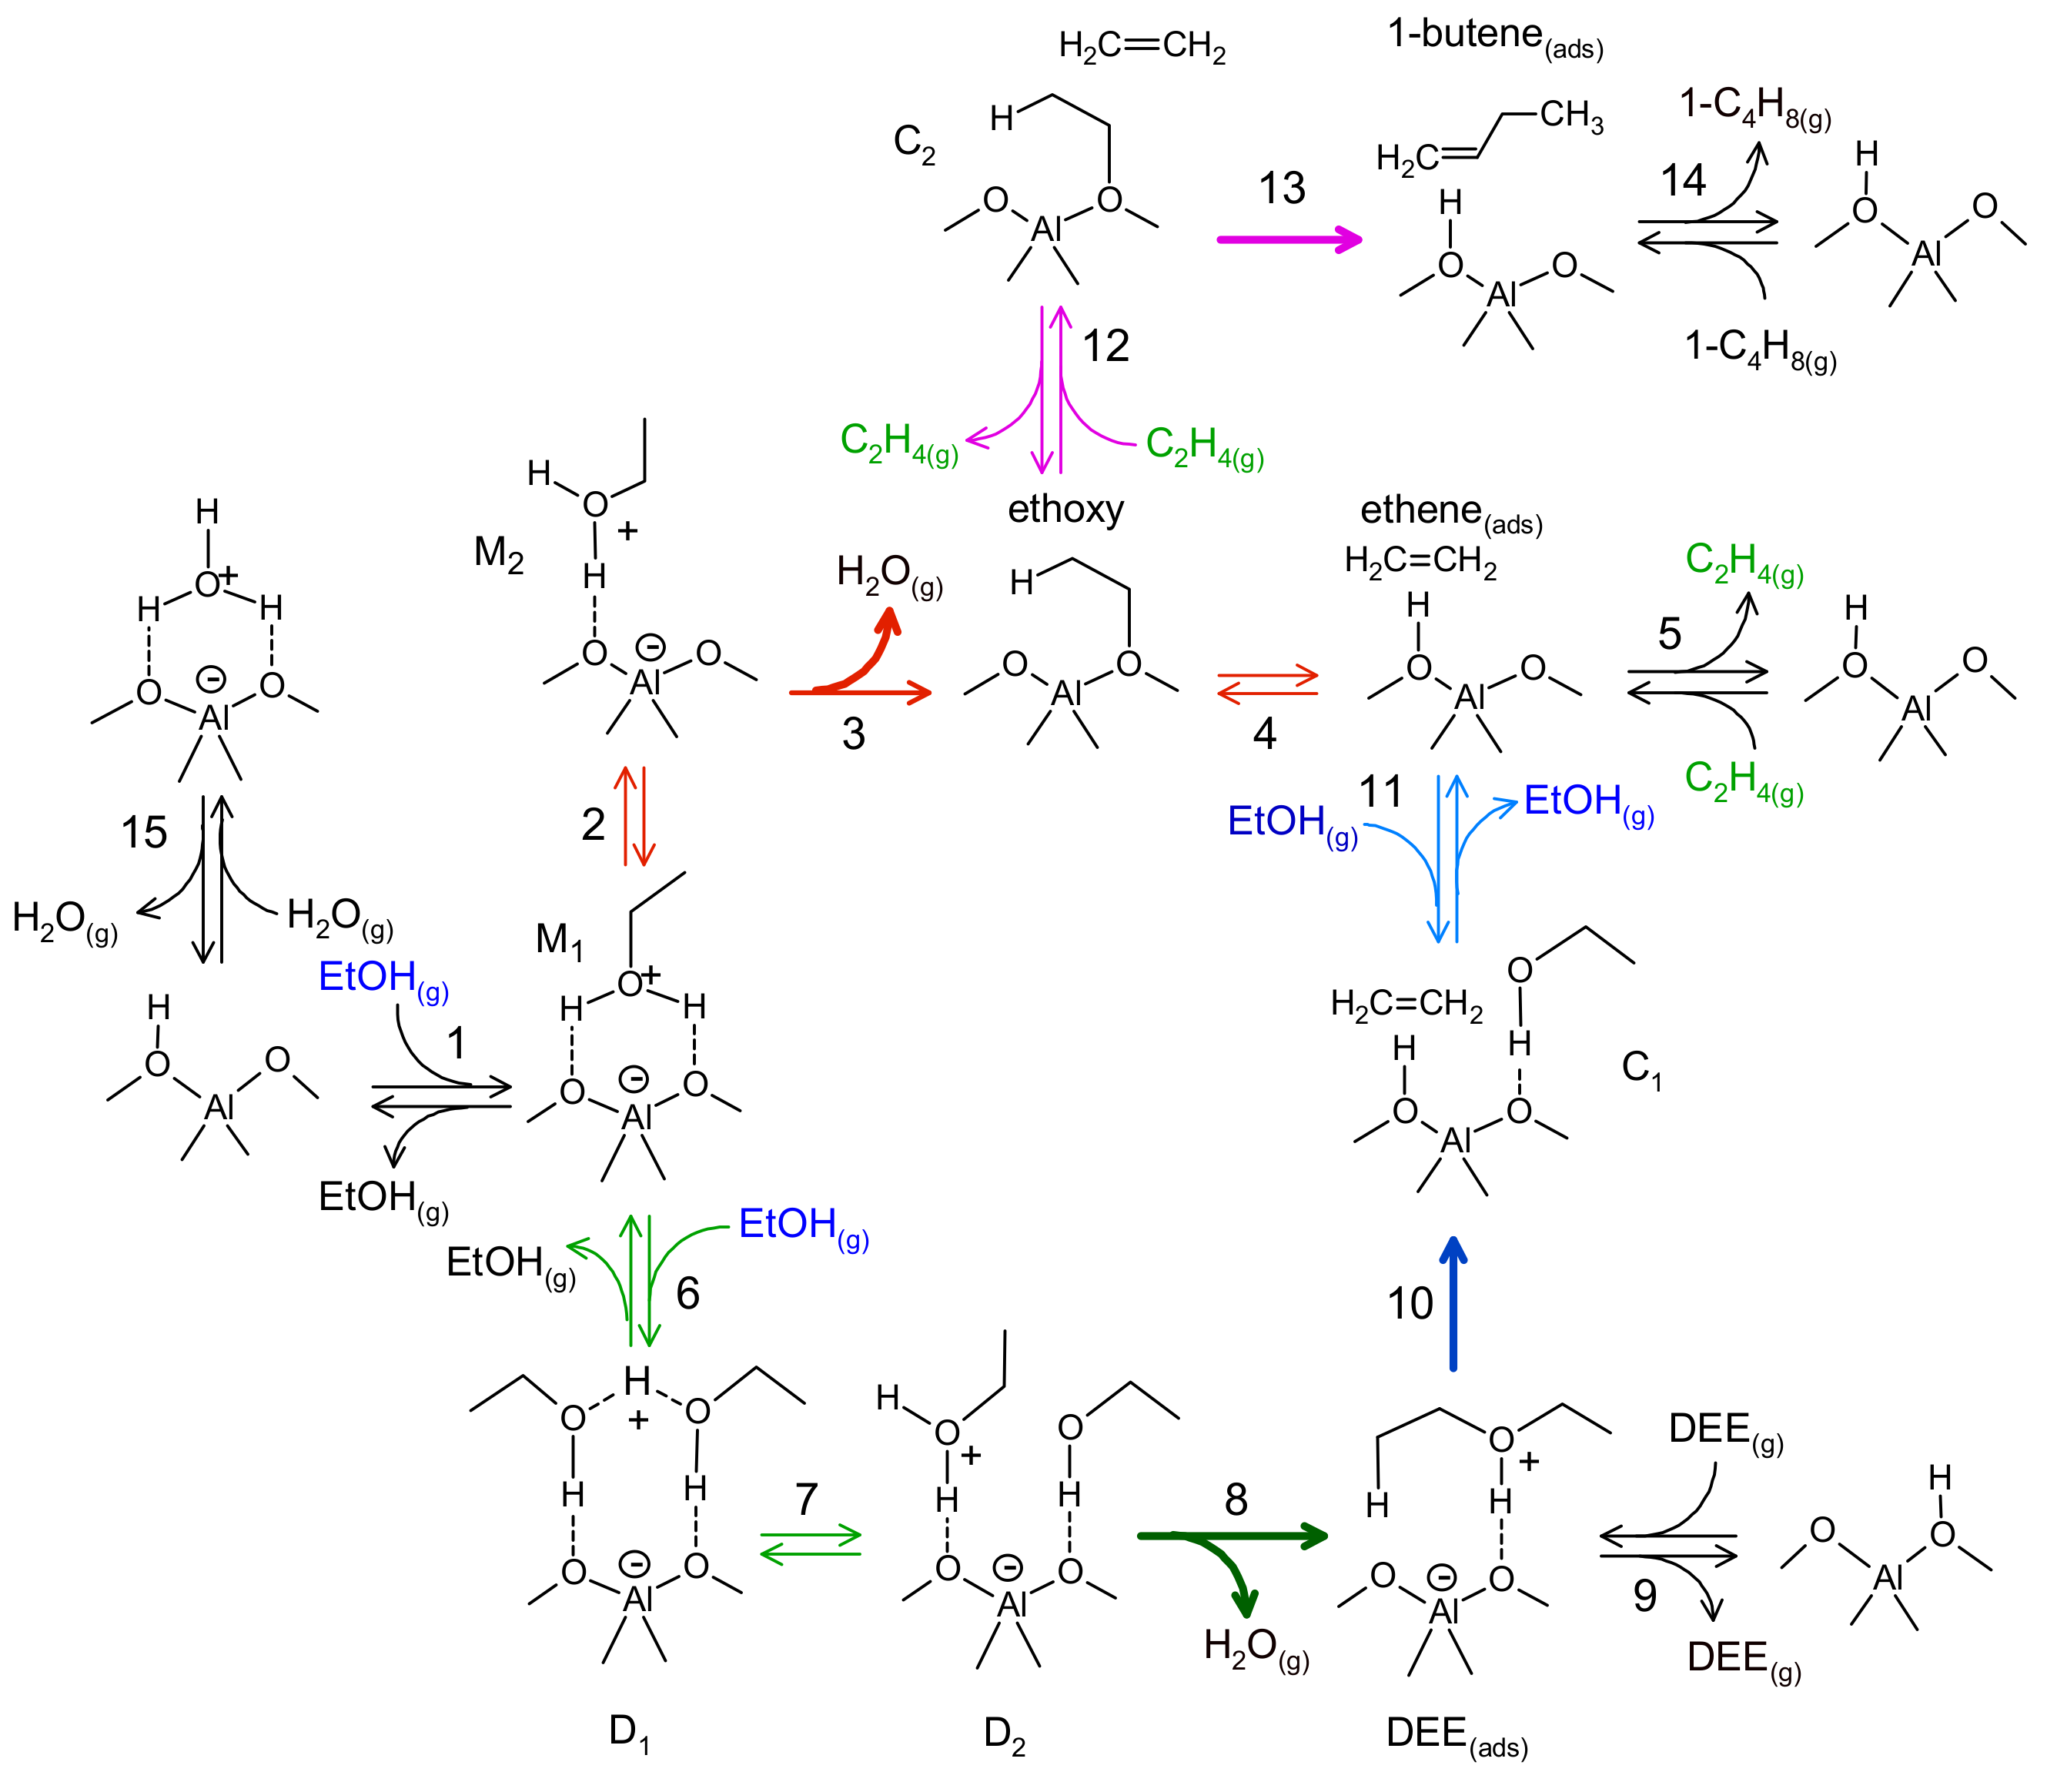
| Elementary Steps | |||||
|---|---|---|---|---|---|
| 1 | EtOH(g) + * ↔ M1 | −122 | −167 | - | - |
| 2 | M1 ↔ M2 | 14 | 7 | - | - |
| 3 | M2 ↔ Ethoxy + H2O(g) | 77 | 146 | 118 | 4.0 1013 |
| 4 | Ethoxy ↔ Ethene(ads) | 44 | 60 | 106 | 9.4 1012 |
| 5 | Ethene(ads) ↔ C2H4(g) + * | 48 | 99 | - | - |
| 6 | M1 + EtOH(g) ↔ D1 | −99 | −162 | - | - |
| 7 | D1 ↔ D2 | 44 | 24 | - | - |
| 8 | D2 ↔ DEE(ads) + H2O(g) | 16 | 125 | 92 | 3.5 1012 |
| 9 | DEE(ads) ↔ DEE(g) | 139 | 165 | - | - |
| 10 | DEE(ads) ↔ C1 | 114 | 51 | 145 | 4.6 1013 |
| 11 | C1 ↔ Ethene* + EtOH(g) | 59 | 175 | - | - |
| 12 | Ethoxy + Ethene ↔ C2 | −33 | −113 | - | - |
| 13 | C2 ↔ 1-butene(ads) | −82 | −25 | 81 | 1.7 1012 |
| 14 | 1-butene(ads) ↔ 1-butene + * | 90 | 159 | - | - |
| 15 | W ↔ H2O(g) + * | 83 | 151 | - | - |
| Operating condition | Reactor 1 | Reactor 2 |
| W (ton) | 3 | 3 |
| T0 (K) | 673 | 679 |
| pt,0 (kPa) | 590 | 530 |
| FC2H5OH,0 (kton y−1) | 360 | |
| xEtOH,0 | 0.26 | |
| Catalyst property | ||
| dp (m) | 4 10−3 | |
| (-) | 0.6 | |
| (-) | 5 | |
| (kg m−3) | 700 | |
| Ct (mol kg−1) | 0.003 | |
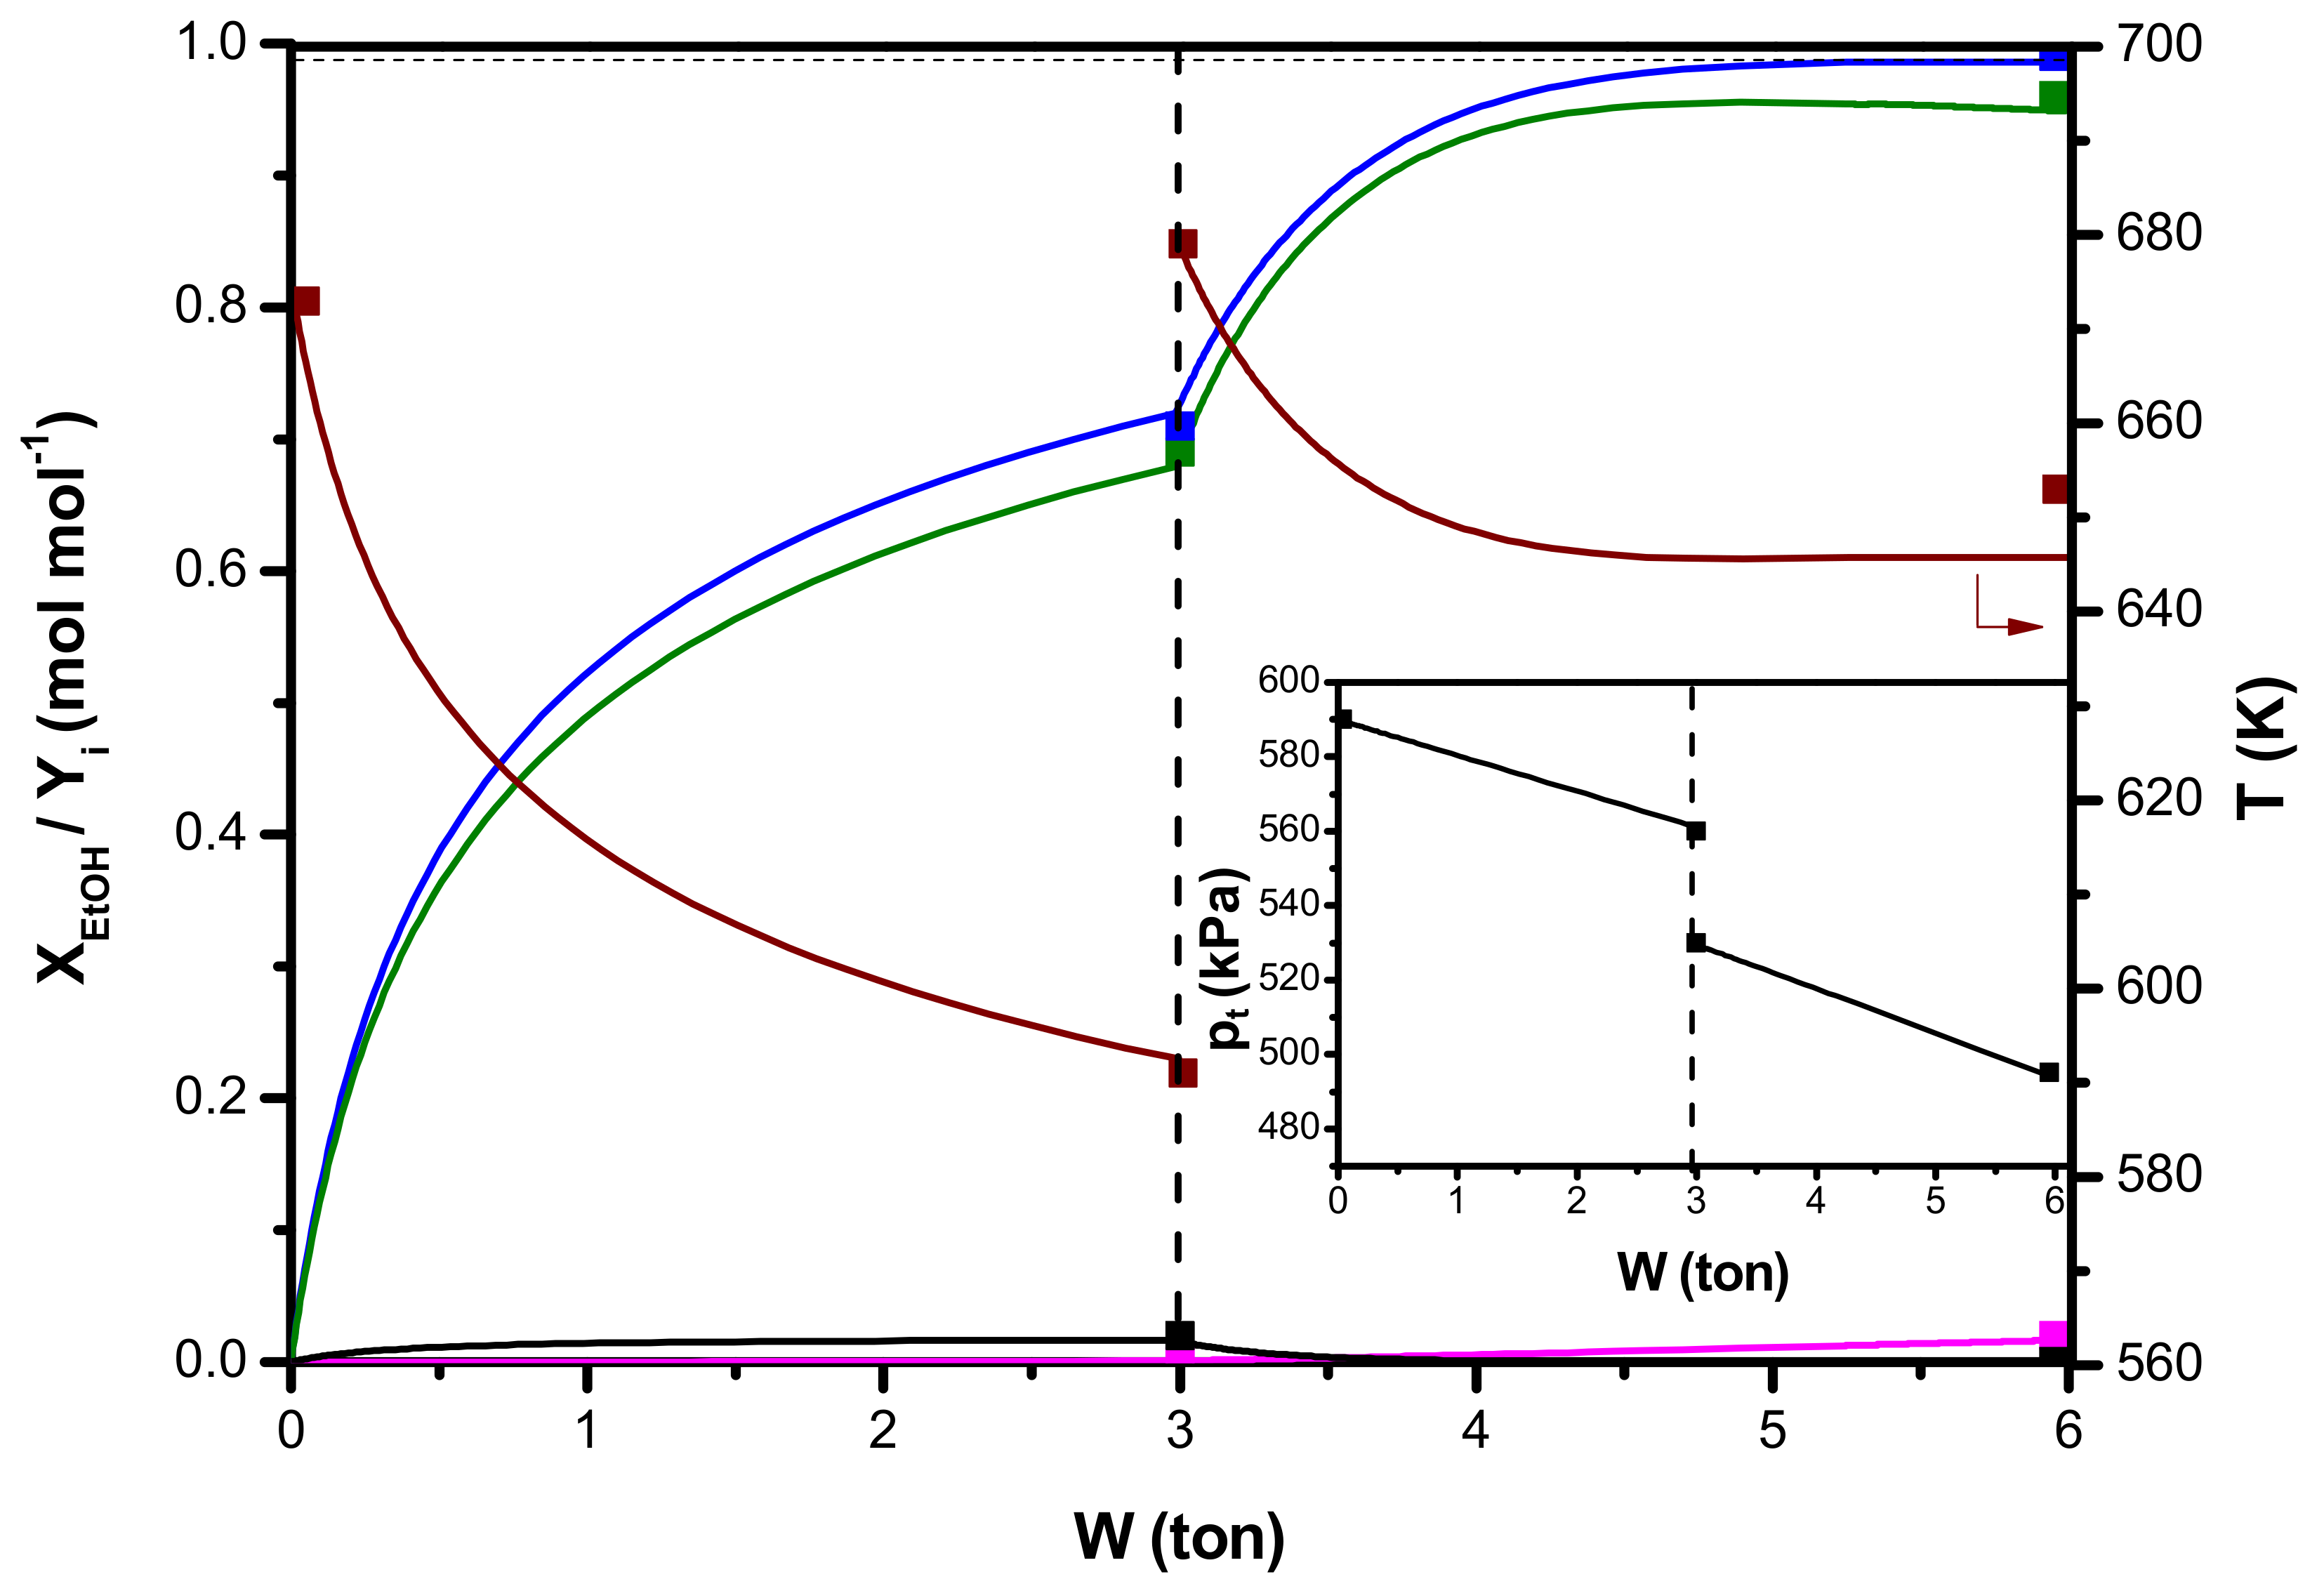
| XEtOH (-) | YC2H4 (-) | Yoxy (-) | Yole(-) | T (K) | pt (kPa) | |
|---|---|---|---|---|---|---|
| Outlet reactor 1 | 0.71 | 0.69 | 0.02 | 0.00 | 591 | 560 |
| Outlet reactor 2 | 0.99 | 0.97 | 0.00 | 0.01 | 653 | 500 |
© 2019 by the authors. Licensee MDPI, Basel, Switzerland. This article is an open access article distributed under the terms and conditions of the Creative Commons Attribution (CC BY) license (http://creativecommons.org/licenses/by/4.0/).
Share and Cite
Van der Borght, K.; Alexopoulos, K.; Toch, K.; Thybaut, J.W.; Marin, G.B.; Galvita, V.V. First-Principles-Based Simulation of an Industrial Ethanol Dehydration Reactor. Catalysts 2019, 9, 921. https://doi.org/10.3390/catal9110921
Van der Borght K, Alexopoulos K, Toch K, Thybaut JW, Marin GB, Galvita VV. First-Principles-Based Simulation of an Industrial Ethanol Dehydration Reactor. Catalysts. 2019; 9(11):921. https://doi.org/10.3390/catal9110921
Chicago/Turabian StyleVan der Borght, Kristof, Konstantinos Alexopoulos, Kenneth Toch, Joris W. Thybaut, Guy B. Marin, and Vladimir V. Galvita. 2019. "First-Principles-Based Simulation of an Industrial Ethanol Dehydration Reactor" Catalysts 9, no. 11: 921. https://doi.org/10.3390/catal9110921