Article

Atomic Layer Deposition ZnO Over-Coated Cu/SiO2 Catalysts for Methanol Synthesis from CO2 Hydrogenation

1
Department of Chemical and Biological Engineering, University of Saskatchewan, Saskatoon, SK S7N 5A9, Canada
2
Canadian Light Source, University of Saskatchewan, Saskatoon, SK S7N 2V3, Canada
*
Author to whom correspondence should be addressed.
Catalysts 2019, 9(11), 922; https://doi.org/10.3390/catal9110922
Submission received: 17 October 2019 / Revised: 2 November 2019 / Accepted: 3 November 2019 / Published: 6 November 2019
(This article belongs to the Special Issue Catalysis for the Production of Sustainable Fuels and Chemicals)

Abstract

:
Cu-ZnO-based catalysts are of importance for CO2 utilization to synthesize methanol. However, the mechanisms of CO2 activation, the split of the C=O double bond, and the formation of C-H and O-H bonds are still debatable. To understand this mechanism and to improve the selectivity of methanol formation, the combination of strong electronic adsorption (SEA) and atomic layer deposition (ALD) was used to form catalysts with Cu nanoparticles surrounded by a non-uniform ZnO layer, uniform atomic layer of ZnO, or multiple layers of ZnO on porous SiO2. N2 adsorption, H2 temperature-programmed reduction (H2-TPR) X-ray diffraction (XRD), transmission electron microscope (TEM), energy-dispersive X-ray spectroscopy (EDX), CO-chemisorption, CO2 temperature-programmed desorption (CO2-TPD), X-ray adsorption near edge structure (XANES), and extended X-ray absorption fine structure (EXAFS) were used to characterize the catalysts. The catalyst activity was correlated to the number of metallic sites. The catalyst of 5 wt% Cu over-coated with a single atomic layer of ZnO exhibited higher methanol selectivity. This catalyst has comparatively more metallic sites (smaller Cu particles with good distribution) and basic site (uniform ZnO layer) formation, and a stronger interaction between them, which provided necessary synergy for the CO2 activation and hydrogenation to form methanol.

1. Introduction

Carbon dioxide (CO2) is considered to be the most severe greenhouse gas by the amount of anthropogenic emission (36 billion tons per year in 2017 [1]), and the prominent free carbon source in the future, on the other hand. Currently, only 0.5% of emitted CO2 can be used for industrial purposes [1]. However, many research efforts have been devoted to converting CO2 into value-added products of commercial importance. CO2 is thermodynamically stable [2] and barely reacts with other chemicals without catalysts and driving energy. Thus, it is important to understand the mechanism of catalytic activation of CO2, especially the relationship between catalysts’ structural properties and catalytic performance such that effective catalyst materials can be developed for a specific reaction, such as CO2 hydrogenation for methanol (MeOH or CH3OH). MeOH is a clean liquid fuel. It is also an important commodity used as feedstock for the production of many other chemicals. Although the hydrogenation of CO2 for MeOH:
CO2 + 3H2 → CH3OH + H2O, ΔH298K = −49.5 kJ mol−1,
is an exothermal reaction, high reaction temperatures favor the activation of CO2 and the formation of methanol. However, high temperatures also contribute to the formation of by-products of CO and hydrocarbons during the reaction [3]. Catalysts are developed in order to minimize or prevent the occurrence of side reactions, among which the Cu-ZnO catalyst for CO2 hydrogenation has been predominantly studied [2].
A literature review observed that some catalysts exhibited high conversion but poor selectivity to MeOH while others showed a prominent selectivity of MeOH but lower CO2 conversion. However, there is no catalyst that yet offers both high CO2 conversion and high MeOH selectivity. On the high conversion and low selectivity side, Duan and coworkers [4] prepared a Cu–ZnO catalyst supported on mesoporous carbon. The catalyst showed a relatively high CO2 conversion of 27%, and high MeOH selectivity of 69% due to the good contact between the Cu/CuO and ZnO particles. The Cu–ZnO catalyst [5] supported by reduced graphene oxide nanosheets also showed a CO2 conversion of 26%, which resulted from the good dispersion of Cu–Zn particles enhanced by the support, but a much lower MeOH selectivity of 5%. Cu/ZnO/ZrO2 catalyst [6] prepared by the precipitation–reduction method showed a CO2 conversion of 23% and selectivity to MeOH of 57%. The study found that CO2 conversion was connected to the surface area of the exposed Cu, and MeOH selectivity was related to the number of basic sites. On the high selectivity and low conversion side, Cu@ZnOx core-shell catalyst [7] prepared by precipitated ZnO on the surface of Cu powders showed 100% selectivity to MeOH and a CO2 conversion of 2%. The excellent selectivity was due to the alloy formation and migration of Zn. Cu–Zn/Al foam catalyst [8] prepared via the hydrothermal method showed a selectivity to MeOH of 83% and CO2 conversion of 10%. Compared with other Cu-based catalysts, Cu–Zn/Al foam catalyst possessed great heat and mass transfer properties and suitable ratio of strong basic sites.
Cu or ZnO alone had little effect on methanol synthesis by an experimental study, as shown by Karelovic and coworkers [9]. However, the combination of Cu and ZnO enhanced the catalyst performance dramatically, as revealed by Gesmanee and Koo-Amornpattana [10]. ZnO was regarded as a structure-directing support to improve the dispersion of metallic Cu particles during reduction and acts as a spacer between the Cu particles [11,12]. ZnO was able to provide the active sites for the spillover of hydrogen [10,13,14,15]. According to the study of Cu-based catalysts modified by ZnO, ZrO2, and MgO, Ren et al. [16] observed that Cu0 sites were the catalytic active centers for hydrogenation of CO2 to MeOH. However, Choi et al. [17] discovered that Cu–Zn sites were the active sites for CO2 hydrogenation to MeOH. Kanai and coworkers [18] found that parts of ZnO migrated onto the surface to form Cu–Zn alloy, and that Cu+ species formed in the vicinity of ZnOx were regarded as active sites for MeOH synthesis. The group of Tisseraud and Le Valant [7,19,20,21] reported that the active sites for CO and MeOH synthesis were different. CO was produced on ZnO sites and MeOH was produced on ZnOx, which were formed on the interface of Cu and ZnO through cross-diffusion of Cu and ZnO. The activity of the catalysts was found to be related to the number of “contact points” of Cu and ZnO.
Although a variety of mechanisms have been proposed and some are debatable, one recognizes that CO2 is activated by one type of site, say ZnO related, and H2 by another type, say metallic Cu or Cu2O/CuO related. Each type alone cannot have the activity to either H2 and CO2; however, they must be next to each other to form the right structures to facilitate the formation of methanol or to form the wrong structures to help the formation of CO. The activated CO2, still in the molecular form, needs assistance from the activated H to pull one O away and to insert H in at the same time to form C-H and O-H bonds. In other words, the right structures must be able to perform two functions at the same time, pulling one O away to form H2O and inserting H atoms in to form methanol. Based on this thinking, we planned to make two extremely different catalysts with the help of the atomic layer deposition (ALD) method. One catalyst contains isolated Cu-related particles, specifically metallic Cu nanoparticles, distributed in a layer of ZnO atoms, on which the activated CO2 lacks surrounding H atoms, thus tending to form CO not methanol during hydrogenation. The other catalyst contains isolated ZnO phases distributed in a layer of Cu or surrounded by sufficient Cu nanoparticles, on which the activated CO2 has enough H to access. In this paper, we prepared the first type of extreme catalysts. Cu was loaded onto a SiO2 support by strong electronic adsorption (SEA) and ZnO was over-coated by ALD. The catalysts were characterized by N2 adsorption, H2 temperature-programmed reduction (H2-TPR) X-ray diffraction (XRD), transmission electron microscope (TEM), energy-dispersive X-ray spectroscopy (EDX), CO-chemisorption, CO2 temperature-programmed desorption (CO2-TPD), X-ray adsorption near edge structure (XANES), and extended X-ray absorption fine structure (EXAFS) and their performance for CO2 hydrogenation to form methanol was tested using a fixed bed reactor.

2. Results and Discussion

2.1. Formation of Cu Particles with a Uniform Distribution

The samples were prepared by impregnation (Imp) and strong electronic adsorption (SEA) methods over SiO2 with certain amount of Cu loading.

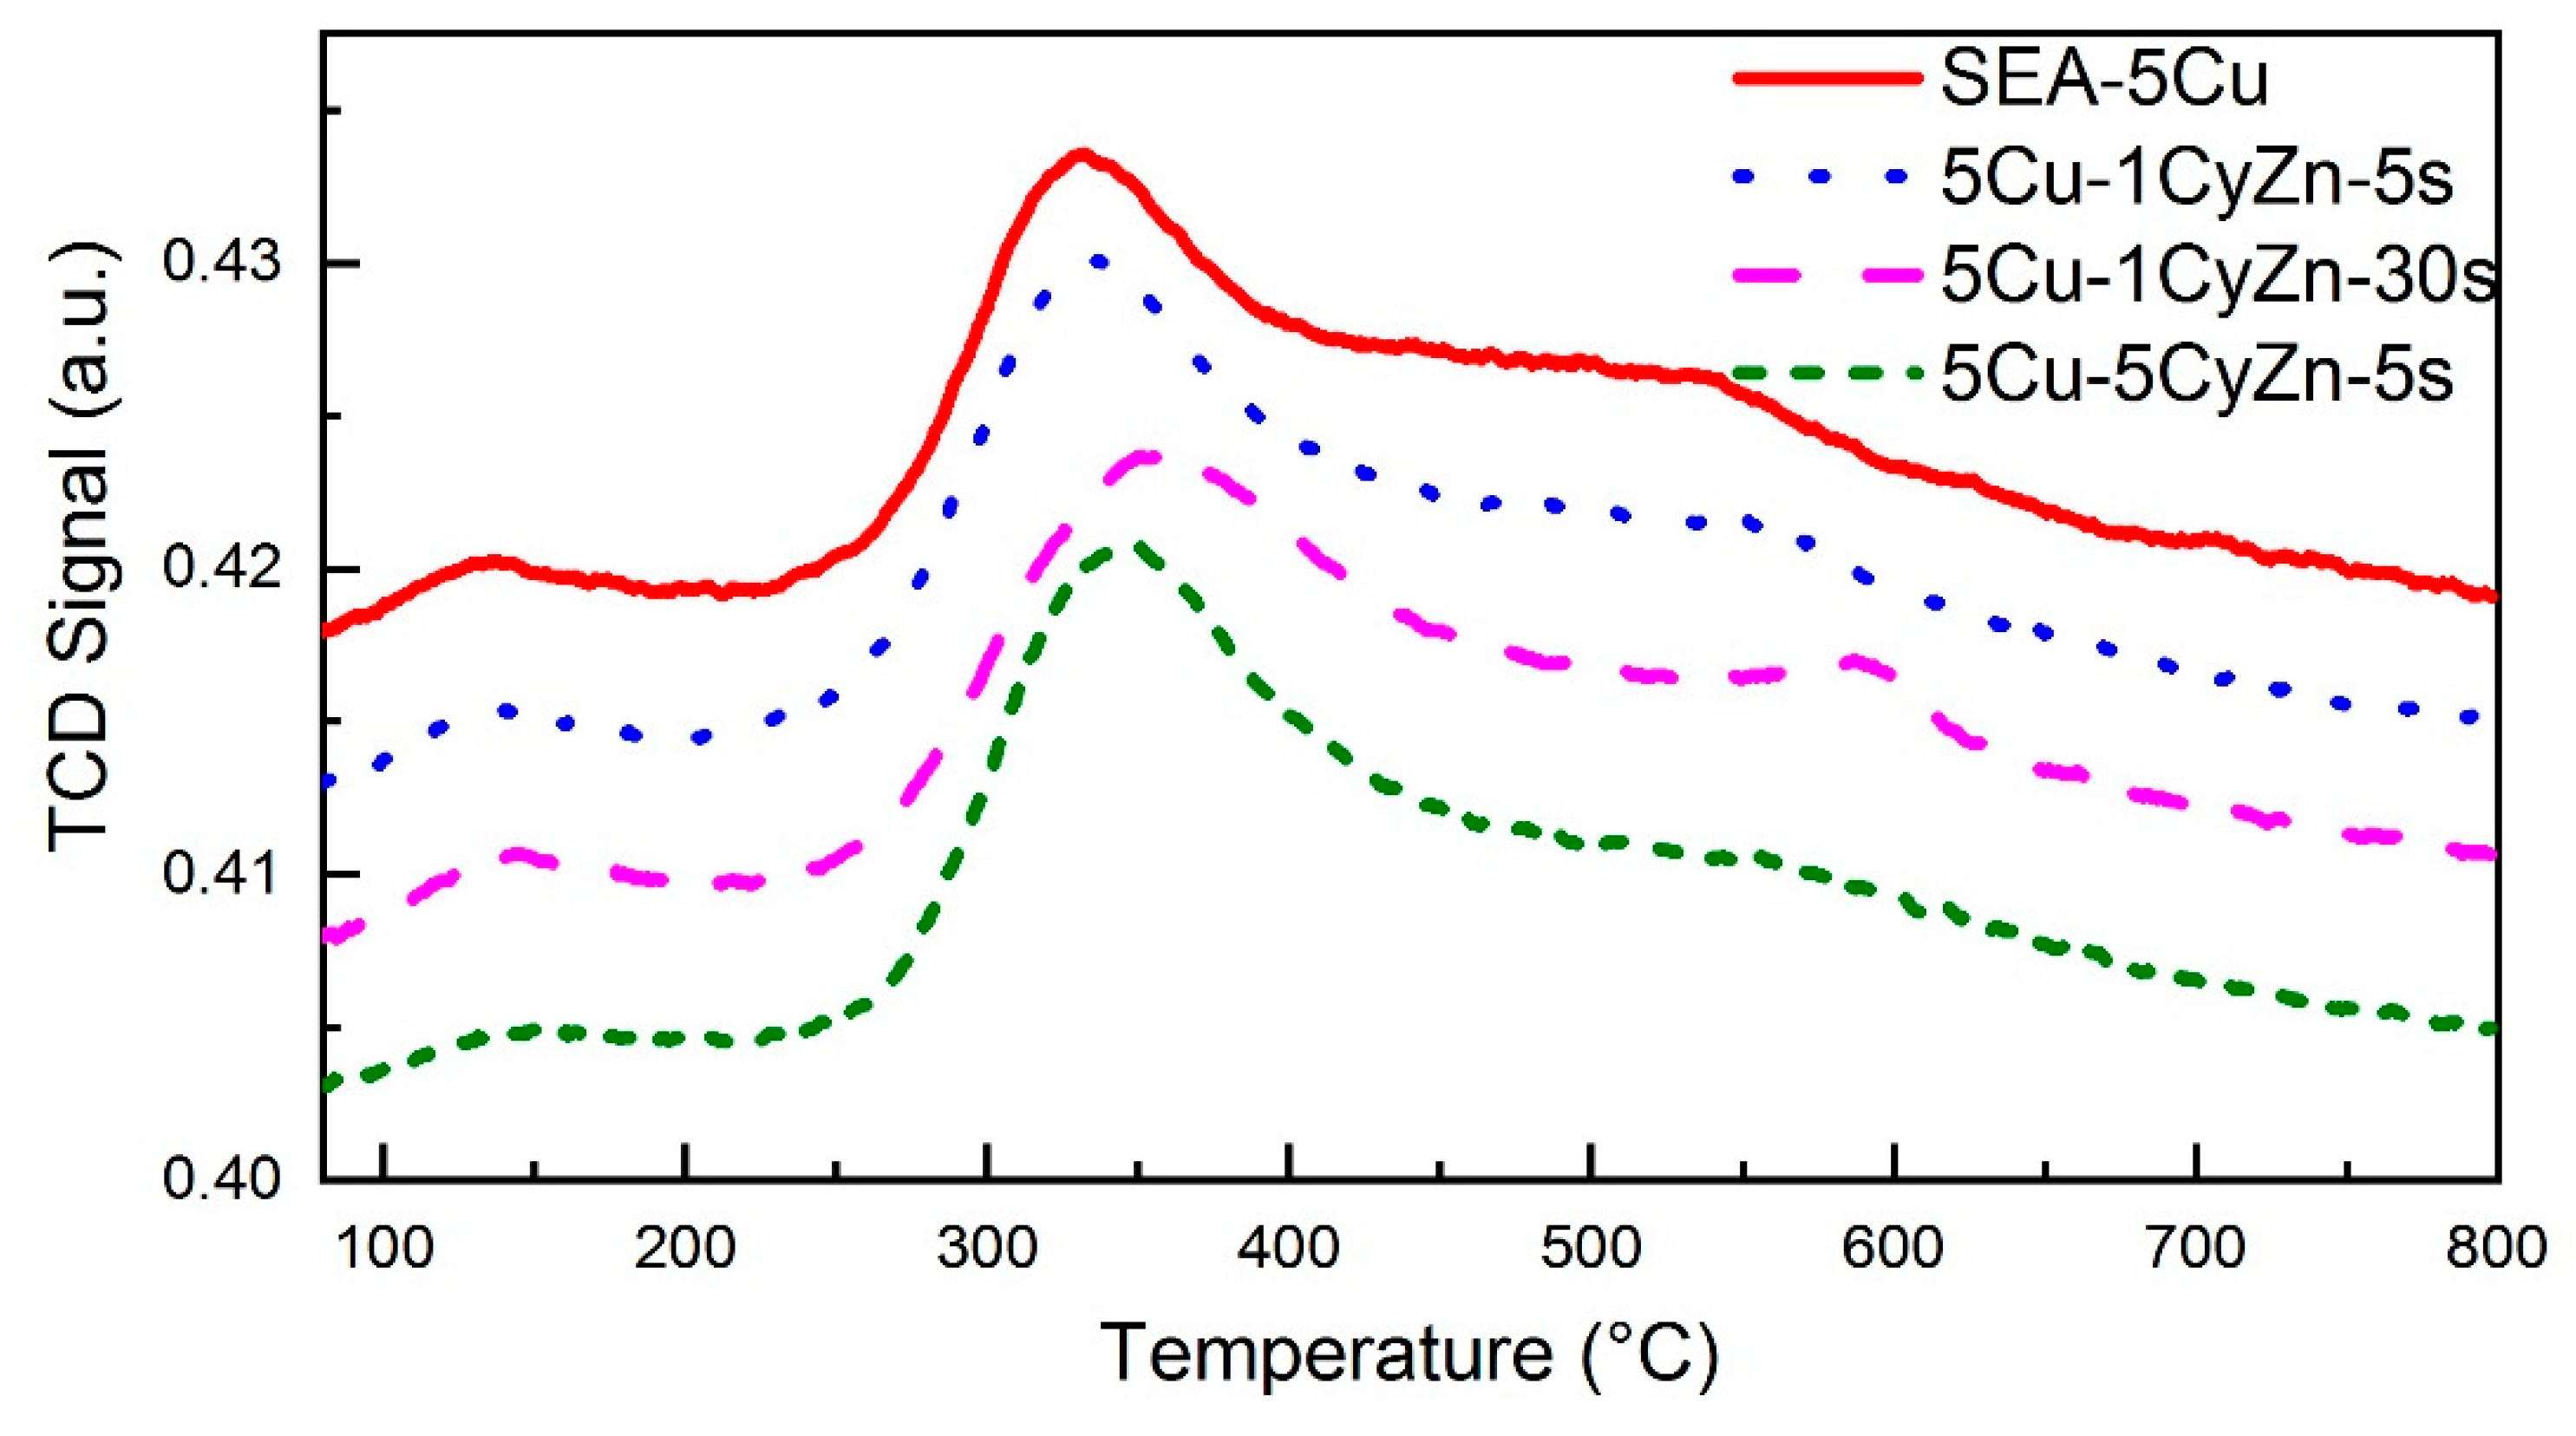
2.1.1. Reduction Properties of Samples from H2-TPR

The H2-TPR results of Imp-Cu and SEA-Cu samples with different Cu contents are shown in Figure 1. Two hydrogen consumption peaks were observed in the range of 186 to 194 °C (referred to as the first peak) and 206 to 240 °C (second peak) in the H2-TPR profile. The first peak was ascribed to the reduction of the highly dispersed CuO phases [16,22], while the second peak was attributed to the reduction of the CuO species having relatively stronger interactions with the support [16]. Imp-5Cu sample (5 means 5 wt% target Cu loading) prepared by impregnation resulted in greater formation of the dispersed CuO species, as shown by the higher intensity of the first peak. SEA-5Cu and SEA-10Cu, prepared by the SEA method with 5 wt% and 10 wt% Cu loading, exhibited a larger second peak. During the preparation of these two samples, the silica gel was first pretreated with ammonia solution at a certain pH to adjust the surface charge prior to mixing with the Cu complex of the opposite charge to form the CuO species. So, the catalysts prepared by the SEA method show more CuO species, which have stronger interactions with the support. To ensure full reduction, 500 °C was used as the reduction temperature in later research.

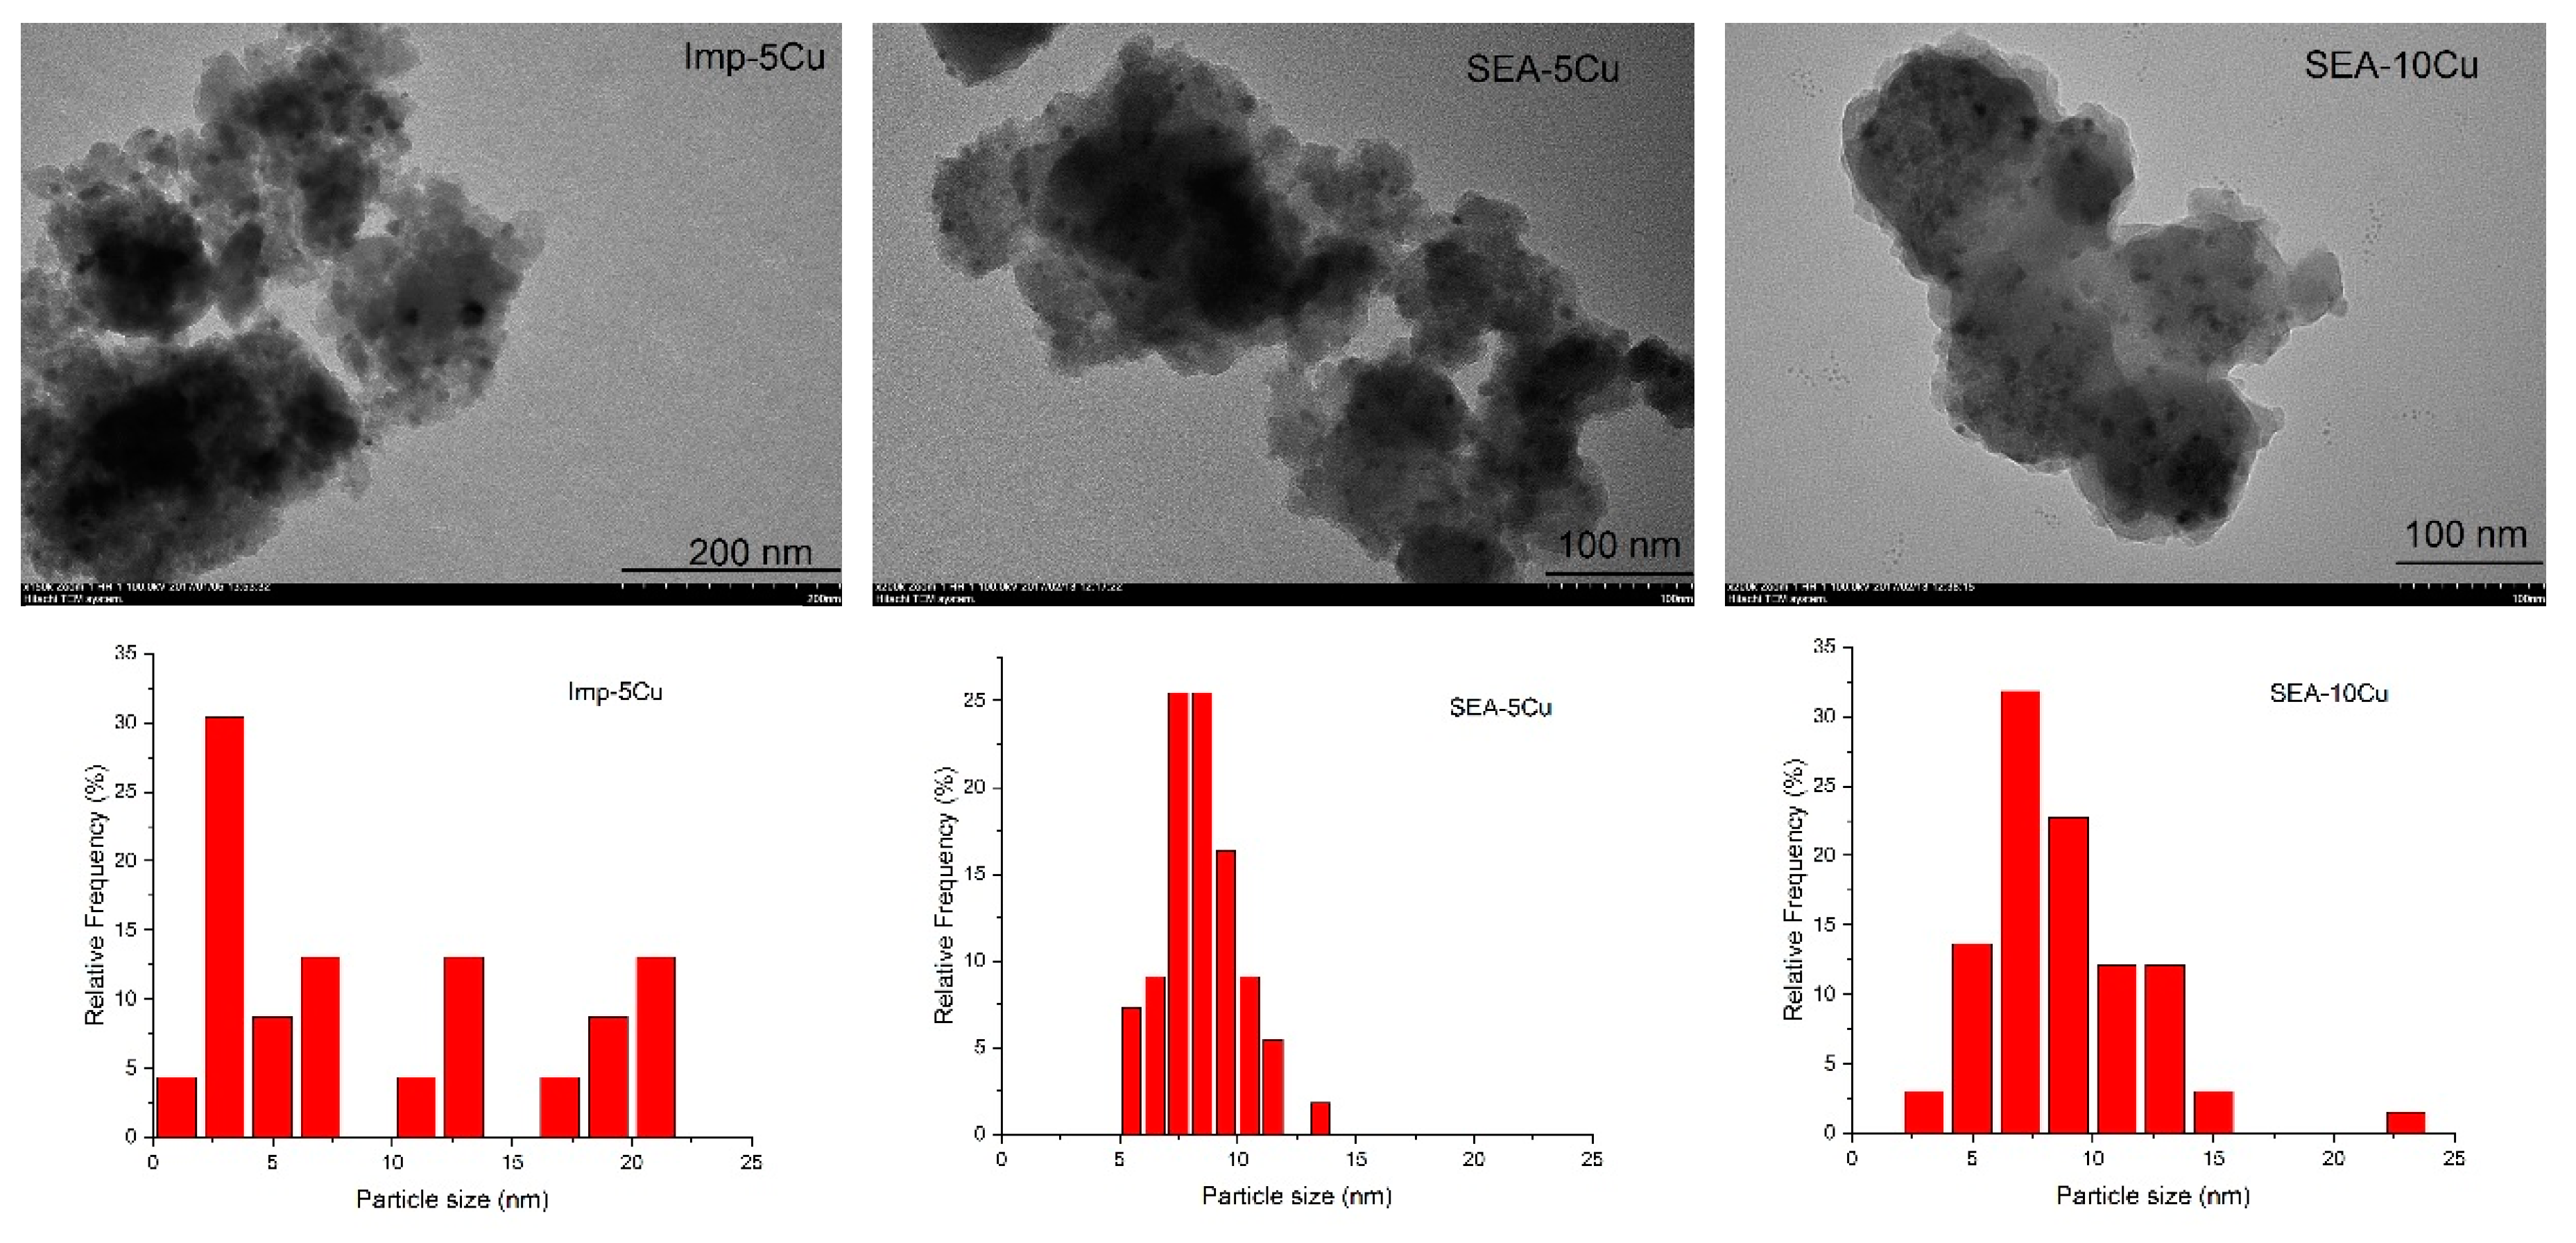
2.1.2. Samples Screened by TEM Images

These three samples reduced at 500 °C were used for TEM analysis. Figure 2 shows the TEM images and the histograms of the samples. The CuO species prepared by the SEA method showed relatively stronger interactions with the support, which was revealed by TPR. The pretreatment in SEA to adjust the surface charge also resulted in a better distribution of the Cu particles. The average particle sizes of catalyst SEA-5Cu and SEA-10Cu were 8.4 and 8.6 nm, respectively. Further comparison of the particle size distribution between SEA-5Cu and SEA-10Cu shows that SEA-5Cu should be used for further study. The final catalysts were prepared by ALD to deposit ZnO with different pulse times or cycles on SEA-5Cu. The catalysts were denoted as 5Cu-1CyZn-5s, 5Cu-1CyZn-30s, and 5Cu-5CyZn-5s (called ZnO over-coated Cu/SiO2 catalysts). 1Cy and 5Cy represent the number of cycles of ALD performed. Furthermore, 5 and 30 s represent the exposure time of the SEA-5Cu to the Zn precursor in each cycle.

2.2. Catalysts and Support Characterization

2.2.1. Results of ICP, BET, and XRD

Table 1 shows the ICP and BET results of the substrate silica gel (SiO2), SEA-5Cu, and the ZnO over-coated Cu/SiO2 catalysts. The Cu contents in these samples were approximately 4.4 wt% as expected; however, the Zn content varied depending on the pulse time and ALD cycles. With a single-cycle deposition, the content of Zn increased from 0.3 (pulse time of 5 s) to 1.5 wt% (pulse time of 30 s). With the same pulse time (5 s), the Zn content increased from 0.3 (1 cycle of ALD) to 1.3 wt% (5 cycles of ALD). The loading of Cu by the SEA method dramatically decreased the specific surface area and pore volume of SiO2. The average pore size increased from 3.0 to 4.5 nm, indicating blockage of smaller mesopores. The surface area and pore volume were decreased further by ZnO ALD, but to a smaller extent on the basis of the Cu loading.
The XRD patterns of the SiO2 and reduced SEA-Cu, ZnO over-coated Cu/SiO2 catalysts are shown in Figure 3. The diffraction peak relative to amorphous SiO2 can be seen at 2θ = 22 ° [23]. After reduction, most of the CuO is reduced to metallic Cu. For the reduced SEA-5Cu, the Cu phase is assigned to a face-centered cubic copper structure with characteristic diffraction peaks 2θ at 43 °, 50 °, and 74 ° [21]. The ALD over-coating of ZnO did not change much of the Cu signals. No new peaks were formed for the ZnO species, which indicated that the structure of ZnO prepared by ALD was not large enough to be detected by XRD. The value of the calculated Cu0 lattice constant (Table 1) increased with the increase in ZnO deposition, from 3.62 to 3.64 Å. Kanai et al. [18] believed that the increasing of the lattice constant from 3.62 to 3.67 Å in their study on the Cu-ZnO catalysts was attributable to the formation of a Cu–Zn alloy. In our case, the increase in the lattice constant upon the deposition of ZnO may also be associated with the formation of the Cu–ZnO surface alloy.

2.2.2. Reduction Properties, Cu Particle Size, and Structure of ZnO

The H2-TPR results of SEA-5Cu and ZnO over-coated Cu/SiO2 catalysts are shown in Figure 4. Two hydrogen consumption peaks are seen in the range of 148 to 194 °C (referred to as the first peak) and 206 to 254 °C (second peak) in the TPR profile. The two peaks are ascribed to the reduction of the highly dispersed CuO phases and the reduction of CuO species having a strong interaction with SiO2 [16,22]. With the increase in the amount of ZnO by either lengthening the pulse time or having more ALD cycles, the second peak clearly shifted to a higher temperature zone. This right shift could indicate that the over-coating of ZnO on the CuO species may cause them to be harder to reduce. The H2-TPR profiles also verify that using 500 °C as the reduction temperature is sufficient to activate the catalysts.
When imaging the three reduced catalysts, 5Cu-1CyZn-5s, 5Cu-1CyZn-30s, and 5Cu-5CyZn-5s, by TEM, four spots were randomly selected to measure the distribution of the elements by the EDX technique (Table 2). The diameter of the spot was 1 μm. On 5Cu-1CyZn-5s, with 25% probability, a Cu particle was detected (87 wt% of Cu), where the Zn content was also relatively high (1.9 wt% vs. 0.2–0.3 wt% on the other three spots). The Cu content on the other three spots varied from 7.8 to 22.6 wt%. On 5Cu-1CyZn-30s, the chance to detect a big change in the Cu and Zn contents become smaller. For all four spots, the Zn content changed from 1.1 to 1.9 wt% while the Cu content changed from 8.3 to 12.9 wt%. On 5Cu-5CyZn-5s, the Zn content varied from 0.1 to 4.1 wt% with four different values for four spots. With a 25% chance, a relatively high Cu spot was detected (26.5 wt% of Cu). The uniformity of the ZnO layer over-coating depended on the number of ALD cycles used and the length of the pulse time of each cycle. One cycle of ZnO over-coating with a pulse time of 5 s possibly led to some uncoated areas. 5 cycles and 5 s possibly led to multiple layers of ZnO as well as uncoated areas. Only one cycle of 30 s led to a relatively uniform ZnO layer and a small chance of having uncoated areas. The layer of ZnO “disciplined” the growth of Cu particles during reduction. Under a uniform single layer of ZnO, 5Cu-1CyZn-30s grew well-distributed Cu particles. However, 5Cu-1CyZn-5s and 5Cu-5CyZn-5s, both possibly having an uncovered surface and specifically having uncovered CuO species, grew larger Cu particles [24].
This argument has immediate support from the TEM images shown in Figure 5. The TEM images and histogram show that 5Cu-1CyZn-30s had the largest number of Cu particles and most uniform particle size from 4 to 10 nm. The average Cu particle sizes of the three ZnO over-coated Cu/SiO2 catalysts as well as their precursors, Cu/SiO2 (SEA-5Cu), as measured from the TEM images are shown in Table 3. The particle size calculated from the XRD peaks by Scherrer’s equation coincided with the TEM results (Table 3). A greater regulation effect can be observed when a longer pulse time or more ALD layers were used.
The CO chemisorption results are also shown in Table 3. Using 5Cu-1CyZn-5s as a benchmark, lengthening the pulse time from 5 to 30 s did not change or decrease too much of the Cu dispersion, metallic Cu surface area, and thus, the number of Cu metallic sites per gram of catalysts. However, using 5 cycles of ALD, each having 5 s of pulse time, significantly changed or decreased the Cu dispersion, metallic Cu surface area, and number of metallic sites per gram of catalysts. A certain position of multiple layers of ZnO may hinder the Cu reduction of the CuO species under multiple layers.

2.2.3. Basicity of the Catalysts from CO2-TPD

The basicity of the SEA-5Cu and ZnO over-coated Cu/SiO2 catalysts was detected using CO2-TPD (Figure 6), which revealed the species and number of basic sites. There are three not totally separated peaks shown in the profiles. The adsorption temperatures of each peak are centered around 140, 340, and 570 °C. All three peaks of 5Cu-1CyZn-30s shifted towards the higher temperature. These peaks can be assigned to the weak, moderate, and strong basic sites. According to the literature, the weak basic sites are ascribed to the OH groups. The moderate basic sites are related to the M-oxygen pairs (M = metal). The strong basic sites are associated with the coordinatively unsaturated O2− ions, which is a low coordination oxygen atom [25,26,27,28].
The peaks of CO2 desorption were then separated and quantified, and the results are shown in Table 4. The comparison of SEA-5Cu and ZnO over-coated Cu/SiO2 catalysts indicated that ZnO over-coating increased the number of total basic sites mainly via the formation of more moderate and strong basic sites. Compared to the catalyst 5Cu-1CyZn-5s, a longer pulse time (5Cu-1CyZn-30s) or multiple cycles of ZnO over-coated (5Cu-5CyZn-5s) led to more basic site formation, which is from 19 (weak) to 42 or 21 μmol∙g−1, 301 (moderate) to 369 or 405 μmol∙g−1, 838 (strong) to 1017 or 884 μmol∙g−1, and 1158 (total) to 1428 or 1310 μmol∙g−1, respectively. It is worth mentioning that a longer pulse time of the ZnO precursor ended in the formation of more strong basic sites, and multiple cycles of ZnO over-coating resulted in more moderated basic sites being formed. Comparing the number of basic sites of the ZnO over-coated Cu/SiO2 catalysts, there are more basic sites on the catalyst 5Cu-1CyZn-30s. The basic sites are where the CO2 adsorption and activation happen.

2.3. Chemical Structure from XAS Spectra

2.3.1. XANES for Cu K-Edge of SEA-5Cu and ZnO Over-Coated Cu/SiO2 Catalysts

The local structure and electronic state of Cu and Zn in the catalysts were investigated by XAS. The Cu K-edge XANES spectra and their first derivative spectra of SEA-5Cu and ZnO over-coated Cu/SiO2 catalysts, along with those of the Cu, Cu2O, and CuO standards are shown in Figure 7. The comparison of the spectra of SEA-5Cu and ZnO over-coated Cu/SiO2 catalysts and those of the standards indicated that the copper in all the calcined samples took the oxidation state of Cu2+. A pre-edge at approximately 8981 eV, which was the characteristic Cu1+ 1s–4d transition feature [29], was only observed in the spectrum of Cu2O. The absence of this peak in the spectra of samples also demonstrated there only Cu2+ species were present in the calcined samples.
Further comparison of the first derivative spectra showed that Cu in the prepared samples maintained the two CuO peaks, 8984 and 8991 eV, which represented the 1s–4p transition shakedown and the main transition, respectively [29]. The notable peak shift toward higher energy (1–3 eV) may suggest a noncentrosymmetric CuO attributable to the ligand donor effect [29]. The spectra of the samples did not show the pre-edge peak (1s–3d quadrupole-allowed transition [29]), which was frequently observed in the Cu2+ compounds.
The Cu K-edge XANES spectra and the first derivative spectra of the reduced SEA-5Cu and ZnO over-coated Cu/SiO2 catalysts, as well as the spectra of Cu, Cu2O, and CuO as the reference, are shown in Figure 8. Compare to the spectra of the standards, those of SEA-5Cu and ZnO over-coated Cu/SiO2 catalysts showed the same shape with the Cu foil and a similar absorption edge, meaning that the chemical environment of Cu species in SEA-5Cu and Cu-ZnO catalysts was close to that of the Cu foil standard. The catalyst 5Cu-1CyZn-30s showed more obviously separated peaks corresponding to resonance features at E0 + 15 eV and E0 + 24 eV [30], which indicated the Cu particles on the catalyst had better dispersion. This conclusion was also corroborated by the TEM images of the reduced catalysts. To further confirm the oxidation state of Cu, linear combination fitting of XANES was then used for reduced SEA-5Cu and ZnO over-coated Cu/SiO2 catalysts (Table 5). There was approximately 75% of metallic Cu formation in SEA-5Cu and the catalysts. With multiple layers of ZnO being over-coated, more Cu was reduced on catalyst 5Cu-5CyZn-5s.
There were two main peaks at approximately 8979 and 8990 eV in the first derivative spectra of the reduced SEA-5Cu and ZnO over-coated Cu/SiO2 catalysts, which were both assigned to 1s–4p transitions [30]. According to the first derivative spectra of the reduced 5Cu-1CyZn-5s and 5Cu-1CyZn-30s catalysts, the peaks assigned to the 1s–4p transition shifted towards higher energy compared to that of SEA-5Cu. This demonstrated that the chemical environment of the Cu species on these two catalysts was affected by the ZnO over-coated, and metallic Cu may be partially oxidized by ZnO. Higher energy was needed to make the electron transition from the 1s to 4p orbital. So, there may be an interaction between Cu and ZnO, and possibly a dissolution of Cu atoms in the ZnO lattice. However, the spectrum of the catalyst R 5Cu-5CyZn-5s showed no shift compared to that of SEA-5Cu, which means that with multiple layers of ZnO, the interaction of Cu and ZnO becomes weaker. The energy shift was not that much because not all the metallic Cu had an interaction with the ZnO, and the spectra can only provide the average feature of the bulk catalysts.

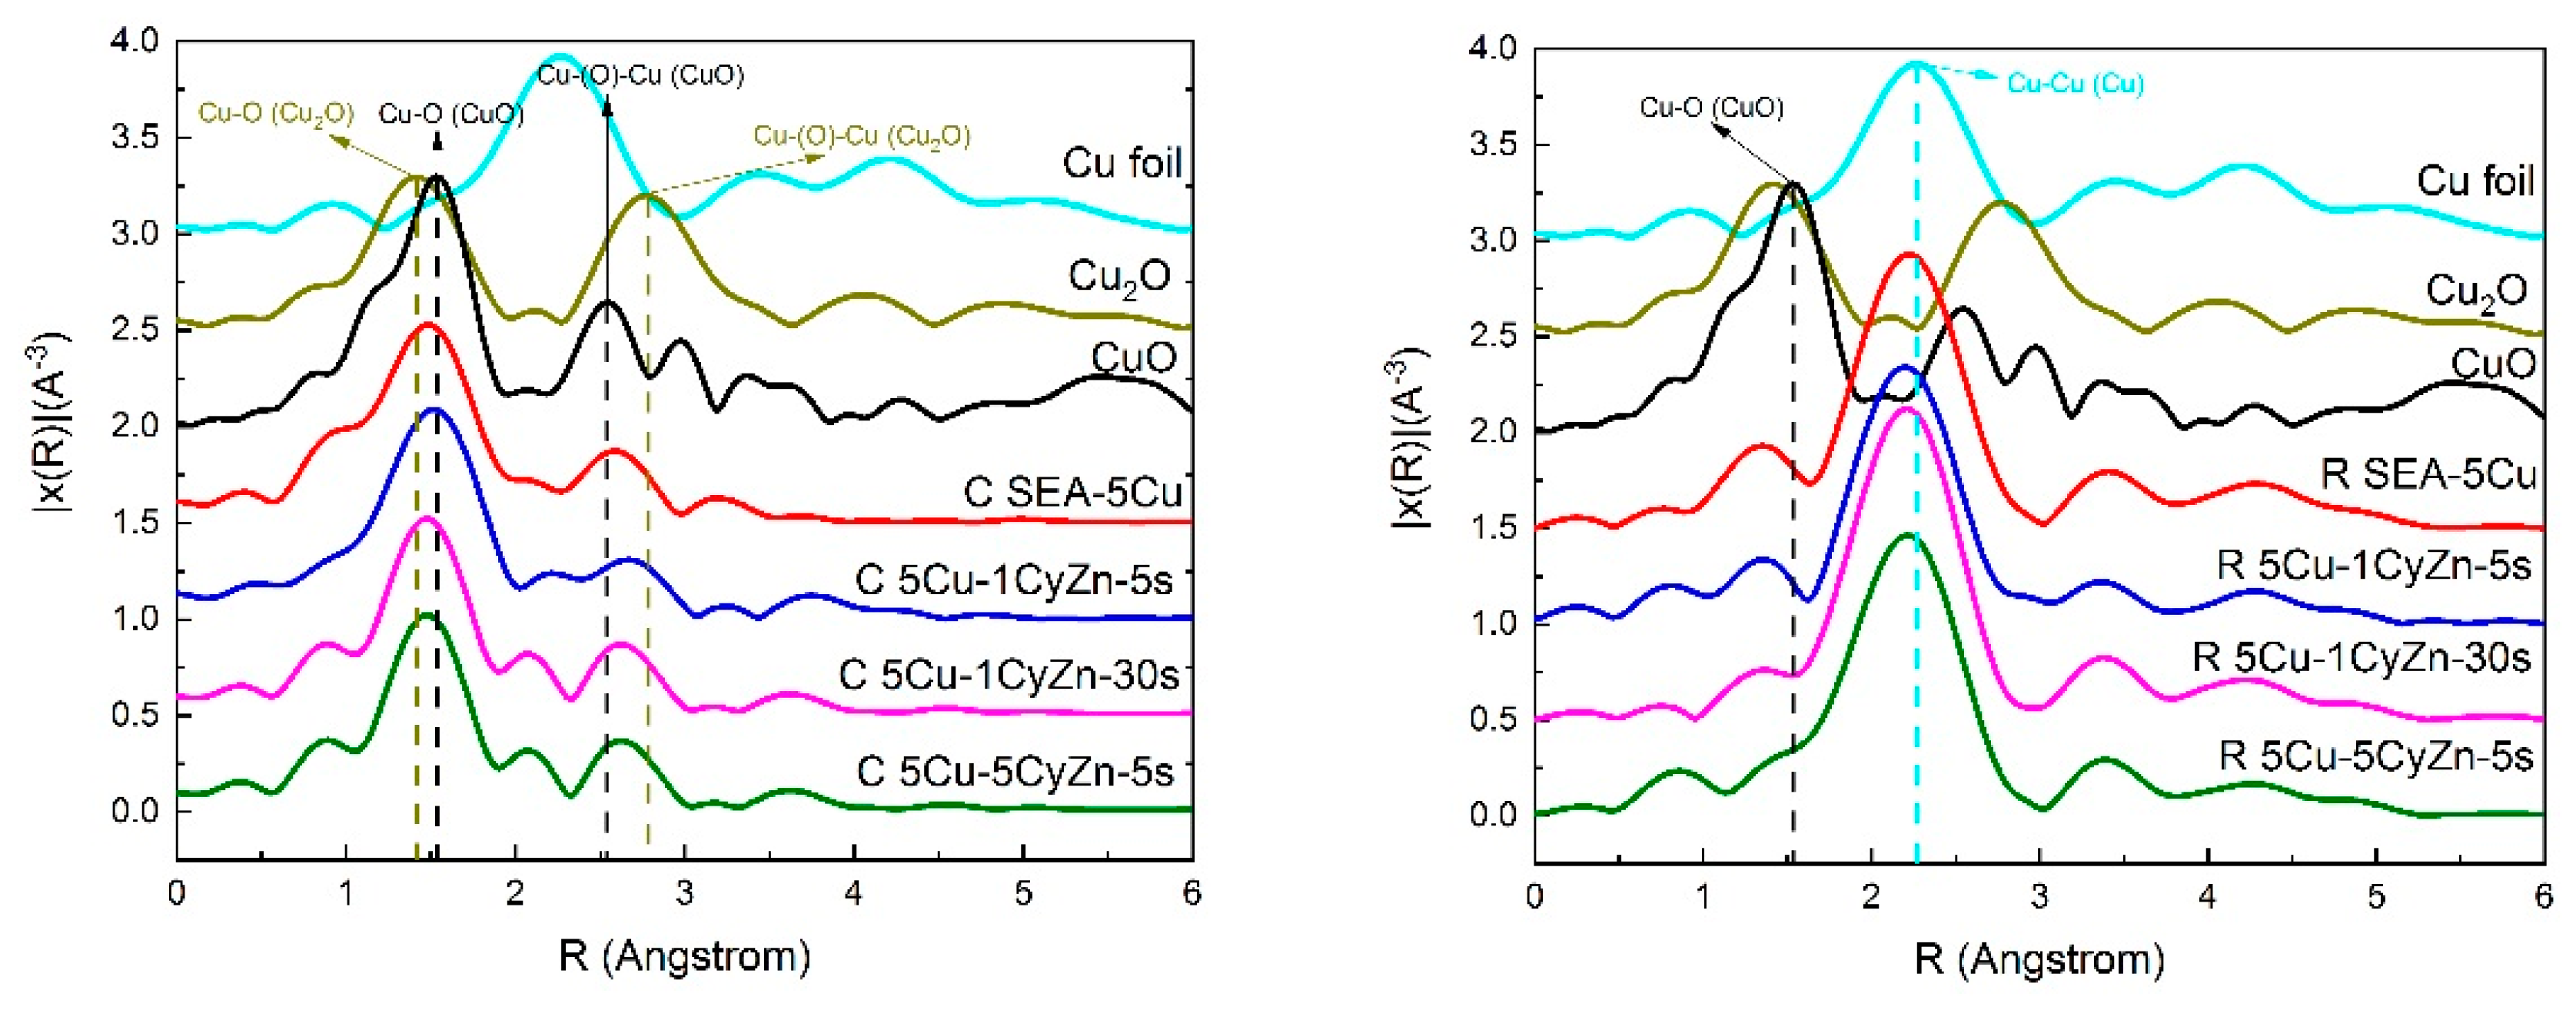
2.3.2. EXAFS for Cu K-Edge of SEA-5Cu and ZnO Over-Coated Cu/SiO2 Catalysts

The EXAFS spectra of the Cu foil, Cu2O, and CuO standards in Figure 9 (left) gave us the information of the bond species and their lengths, which are marked out. The EXAFS spectra of SEA-5Cu and ZnO over-coated Cu/SiO2 catalysts displayed two peaks at around 1.47 and 2.58 Å, which were assigned to the lengths of the Cu-O bond and Cu-(O)-Cu bond. The lengths of these two bonds were both in the middle of those of Cu2O and CuO. Compared to the spectra of SEA-5Cu, the peaks of calcined ZnO over-coated Cu/SiO2 catalysts both shifted right, which indicated that with ZnO over-coated the bonds of Cu-O and Cu-(O)-Cu became longer.
The EXAFS spectra of reduced SEA-5Cu and ZnO over-coated Cu/SiO2 catalysts are shown in Figure 9 (right). There were two peaks in the spectra of catalysts on behalf of the two bonds, respectively; the Cu-O bond whose length was in the range from 1.41 to 1.47 Å, and the Cu-Cu bond whose length was in the range from 2.22 to 2.24 Å. The appearance of the peak representing the Cu-O bond means not all the CuO species were reduced, and this result corresponded to the result of linear combination fitting. The absorption peaks of 5Cu-1CyZn-5s were at 1.42 and 2.24 Å. The first peak went right to 1.47 Å with a longer pulse time or multiple cycles of ZnO over-coated, revealing the length of the Cu-O bond became longer due to more ZnO over-coated. The intensity of this peak became less with the increase of the pulse time and cycles of ZnO deposition, which disclosed that ZnO over-coated helped the reduction of Cu. The Cu-Cu bond length of ZnO over-coated Cu/SiO2 catalysts was similar to that of SEA-5Cu.

2.3.3. XANES for Zn-K Edge of ZnO Over-Coated Cu/SiO2 Catalysts

The Zn XANES spectra of calcined ZnO over-coated Cu/SiO2 catalysts are shown in Figure 10 (left). The absorption edge was at 9662 eV, disclosing the existence of bivalent Zn. However, the spectra of ZnO over-coated Cu/SiO2 catalysts were considerably different from that of ZnO standard. Compared to the spectrum of ZnO, the peaks at 9663.8 and 9668.4 eV assigned to 1s–4sp and 1s–4p transitions, were merged to one peak at 9667.5 eV in the spectra of the catalysts. The peaks at 9679.3 and 9683.4 eV were smoothed and became a shoulder (9681.1 eV), which was assigned to multiple scattering (midrange order and short-range order) [31]. This peak was only shown in the spectrum of 5Cu-5CyZn-5s instead of the catalysts with one cycle of ZnO deposition, since there was a single layer of ZnO appearance with an uncoated area on the catalyst 5Cu-1CyZn-5s and a relatively uniform ZnO layer on the catalyst 5Cu-1CyZn-30s. The difference between the spectra of Cu-ZnO and the spectrum of ZnO was also because the Zn2+ on the catalysts, which existed as molecules or much smaller particles, were mostly influenced by the substrate, SiO2.
The Zn XANES spectra of reduced ZnO over-coated Cu/SiO2 catalysts are shown in Figure 10 (right). These spectra showed no difference with those before reduction. The Zn XANES spectra of ZnO over-coated Cu/SiO2 catalysts revealed a disordered ZnO material with an embryonic short-range order. The nearest neighbor of Zn, O, stayed at the expected angles and distances for the wurtzite structure [16,28].

2.3.4. EXAFS for Zn-K Edge of ZnO Over-Coated Cu/SiO2 Catalysts

The Zn EXAFS spectra of calcined and reduced ZnO over-coated Cu/SiO2 catalysts are shown in Figure 11. In the EXAFS spectra of ZnO standard, the bond length between the central zinc atom and the first shell atom, which was an oxygen atom, was 1.60 Å. The second peak was at 2.85 Å, which was attributed to Zn-(O)-Zn interaction. According to the EXAFS spectra of Zn foil, the bond length of Zn-Zn was 2.28 Å. There was a Zn-O bond in the spectra of calcined Cu-ZnO, and not much difference was shown in the spectra of reduced Cu-ZnO. It is worth noting that there was no peak shown to represent the bond of Zn-(O)-Zn, which means no bigger ZnO particles or many layers of ZnO formed.

2.4. CO2 Conversion and MeOH Synthesis

Catalytic evaluations of the ZnO over-coated Cu/SiO2 catalysts are shown in Table 6. When the catalysts were evaluated by the CO2 hydrogenation reaction, 1 g of catalyst was packed in a packed-bed reactor. The mixture of gas reactants, H2 and CO2, were fed to the reactor at a flow rate of 9.6 L∙h-1. The unreacted gases and gaseous products were analyzed by an off-line GC every 6 h. The CO2 reaction rate and CO formation rate barely changed during a run (acted for 24 h), and the average values are shown in the table. The liquid products were analyzed at the end of the run. No other product besides MeOH and CO was formed. The CO2 reaction rate of catalyst 5Cu-1CyZn-5s is 4.9 mmol∙g−1h−1, which decreases to 4.77 mmol∙g−1h−1 with a pulse time of 30 s, and becomes even smaller (4.06 mmol∙g−1h−1) with five cycles of ZnO over-coated. The formation rate of CO has the same trend with the CO2 reaction rate, which is from 4.57 (5Cu-1CyZn-5s) to 4.32 (5Cu-1CyZn-30s) and 3.89 mmol∙g−1h−1 (5Cu-5CyZn-5s), respectively. The MeOH formation rate of catalyst 5Cu-1CyZn-30s is 0.48 mmol∙g−1h−1, which is higher than that of catalyst 5Cu-1CyZn-5s (0.33 mmol∙g−1h−1) and 5Cu-5CyZn-5s (0.21 mmol∙g−1h−1). The MeOH selectivity of catalyst 5Cu-1CyZn-30s is 10.1%, which is higher than 6.7% for 5Cu-1CyZn-5s, and 5.2% for 5Cu-5CyZn-5s. The ratios of the number of metallic sites to the number of basic sites also are also shown in the table, which are 0.26, 0.19, and 0.17 on the catalysts 5Cu-1CyZn-5s, 5Cu-1CyZn-30s, and 5Cu-5CyZn-5s, respectively. The TOF of CO2 was calculated based on the number of basic sites from the results of CO2-TPD. The TOF of H2 was calculated based on the number of metallic sites from the results of CO chemisorption. 5Cu-1CyZn-5s has higher TOFCO2 of 4.2 h−1, and lower TOFH2 of 18.3 h−1. 5Cu-1CyZn-30s and 5Cu-5CyZn-5s show similar TOFCO2 of 3.3 and 3.1 h−1, respectively, and the similar TOFH2 of 20.0 and 19.7 h−1.
According to our discussion in the introduction, the CO2 was adsorbed and activated by basic sites, ZnO related, and H2 by metallic sites, Cu related. They must be close to each other to form the right structures to facilitate the formation of methanol or to form the wrong structures to help the formation of CO. During the reaction, the activated CO2 needs assistance from the activated H to pull one O away and to insert H in at the same time to form C-H and O-H bonds. When the activated CO2 lacks surrounding H atoms, only O can be pulled away from the activated CO2, resulting in the formation of CO. To form MeOH only, three metallic sites should be next to one basic site to supply three moles of activated H2 to react with the activated CO2 in the molecular form. So, the ratio of the number of metallic sites to the number of basic sites on the catalyst, on which only MeOH forms, should be at least 3. This value should be 1 on the catalyst producing only CO. This conclusion is based on an ideal situation, which is that all the active sites are involved in the reaction. In the actual reaction, not all of the active sites are working during the reaction. Only the metallic and basic sites, who are next to each other, have the opportunity to provide the activated reactants and participate in the reaction.
In our case, many more basic sites are formed than the metallic sites on the ZnO over-coated Cu/SiO2 catalysts. The ratios of the number of metallic sites to the number of basic sites are much smaller than 3. During the reaction, the basic sites are enough to adsorb and activate CO2. It is more important if there are enough metallic sites to activate H2 and provide atom H to the basic sites. Since more metallic sites are formed on the 5Cu-1CyZn-5s, it shows a higher CO2 reaction rate as observed by other researchers [6,11,14]. It indicates that the CO2 reaction rate is related to the number of metallic sites.
When it comes to the selectivity of the catalyst, another factor should be considered, which is whether the metallic and basic sites are close enough to each other. To understand this, the characterization of XRD patterns, XANES, and EXAFS spectra were studied on the ZnO over-coated Cu/SiO2 catalysts. The value of the Cu0 lattice constant of 5Cu-1CyZn-30s is 3.64 Å, but this value for catalyst 5Cu-1CyZn-5s is 3.62 Å. The increase in the lattice constant upon the deposition of ZnO with a longer pulse time may be attributable to the formation of the Cu-ZnO surface alloy [18]. From the XANES spectra registered the Cu K edge of reduced 5Cu-1CyZn-5s and 5Cu-1CyZn-30s, the peaks assigned to the 1s–4p transition drift towards a higher energy compared to that of SEA-5Cu, which demonstrates that the chemical environment of the Cu species on these two catalysts is affected by the ZnO over-coated, and metallic Cu may be oxidized by the ZnO. So, there may be an interaction between Cu and ZnO, and possibly a dissolution of Cu atoms in the ZnO lattice. Longer ZnO pulse times help this dissolution, but multiple layers do not. Compared to the EXAFS spectrum of calcined SEA-5Cu, the bond lengths of Cu-O and Cu-(O)-Cu in the spectra of calcined Cu-ZnO catalysts become longer due to the interaction between Cu and over-coated ZnO. So, the good interaction between the metallic sites and basic sites helps to improve the selectivity of the catalyst.

2.5. CO2 Catalytic Activation to Produce MeOH

According to the study of the relationship between the catalyst structure and activity, a theory of CO2 catalytic activation can be proposed. During the reaction on the 5Cu-1CyZn-30s, CO2 is chemisorbed and activated by the basic sites, ZnO related, which try to push the atom O out of the CO2 molecule. At the same time, the H2 is activated by the metallic site, Cu related, to form the H atom, which then diffuses to the basic site. Since more points where basic sites and metallic sites are close to each other exist, enough H atoms help to pull out the O atom and add into the CO2 to form C-H and O-H bonds, which result in MeOH formation. Due to the synergistic effects of both the basic and metallic sites providing the forces of pushing and pulling, CO2 can be activated and reacted with H2 to form MeOH.
This proposed theory was proved by the performance of our catalysts; it has also been verified by others’ work. The Cu-ZnO catalyst supported by reduced graphene oxide nanosheets exhibits a higher CO2 reaction rate compared to other Cu-ZnO catalysts [5]. According to the TEM image of the catalyst, it shows greatly even-dispersed Cu and ZnO phases, which indicates excellent metallic and basic sites. Due to the contribution of these two sites, the catalyst has high CO2 conversion. Since they randomly connect with each other, the selectivity to MeOH is not outstanding. Another Cu-ZnO catalyst [7] prepared by precipitated ZnO on the surface of Cu powders show 100% of selectivity to MeOH. The catalyst has a very small amount of ZnO precipitated on the surface of metallic Cu, which represent a number of basic sites, a large number of metallic sites, and very good interaction between them. During the reaction, there are enough H atom formation and spillover to the basic sites to reduce the activated CO2 to MeOH. However, this catalyst has very low CO2 conversion due to the weak basic sites. According to the analysis of our catalysts and others, the conclusion is much clearer that the catalyst with high activity and selectivity should have both excellent metallic and basic sites, and stronger interaction between them.

3. Experiment

3.1. Catalyst Preparation

Cu nanoparticles were prepared by Imp method or SEA method. Silica gel (6–12 mesh, grad 40; Fisher Chem, Canada) ground to 255 to 350 nm was used as the substrate. In the Imp method, a certain amount of copper nitrate hemi-pentahydrate (Cu(NO3)2·2.5 H2O, 98%~102%; Aldrich, Canada) was dissolved in 2 mL of distilled water, and ammonia hydroxide (28 wt%; Sigma-Aldrich, Canada) was added dropwise to form a copper hydroxide solid. Then, the solid was re-dissolved to be a dark blue solution. The ammonia was added until the volume of the solution of Cu precursor was the same as the pore volume of the substrate. The dark blue solution, which is tetraamine copper(II) ion, [Cu(NH3)4]2+ was added to silica gel dropwise while stirring with a glass rod for 10 min. The resultant solid was dried overnight at 110 °C, and calcined at 250 °C for 3 h. In the SEA method, 10 g of silica gel was pretreated in 50 mL of ammonia solution for 30 min to adjust the surface charge to negative. The pH of the ammonia solution was higher than 10. To prepare the [Cu(NH3)4]2+-containing solution, a certain amount of copper nitrate was dissolved in 50 mL of H2O. Then, ammonia solution was added to the nitrate solution. The pretreated silica gel mixture and [Cu(NH3)4]2+ solution were mixed and stirred for 2 h. The solid was filtered, washed, dried at 110 °C overnight, and calcined at 250 °C for 3 h.
The ZnO layer on the resultant solid from SEA was prepared by the ALD method using Beneq TFS 200 equipment. Because smaller Cu particles with a good distribution formed on samples prepared by SEA method according to TEM images. Diethyl zinc (DEZ) (98.4 wt%; Sigma-Aldrich, USA) was used as the Zn precursor and H2O was employed as the oxidant. Nitrogen (99.999%; Praxair, Canada) was used to purge the gas lines and the reactor. The temperature of the reaction was set at 150 °C to avoid the formation of metallic Zn. The ALD cycle follows the reactions [32]:
Zn(C2H5)2 + H2O → ZnO + 2C2H6 (g) ΔH = −70 kcal.
This reaction splits into two half-reactions:
Sub-Surf-OH + Zn(C2H5)2 → Sub-Surf-O-Zn(C2H5) + C2H6 (g),
Sub-Surf-O-Zn(C2H5) + H2O → Sub-Surf-O-Zn-OH + C2H6 (g).
The procedure of each ALD cycle is as follows: (1) DEZ vapor was introduced to the chamber and reacted with hydroxyls that are on the surface of the substrate to form monoethylzinc. The monotheylzinc replaced hydrogen and connected to the oxygen atom with the release of ethane as depicted in Equation (3); (2) the chamber was purged with N2 to remove the unreacted precursor and gaseous products; (3) H2O vapor was allowed into the chamber to react with the monoethylzinc, forming hydroxyls bonded with Zn, and releasing ethane (Equation (4)); and (4) the chamber was again purged with N2 to remove the unreacted oxidant and the gaseous products. Before steps (1) and (3), the pressure of the chamber was reduced to 2.0 kPa and the valve that separated the chamber and the pump was closed until the purging procedure started. Finally, the pulse time and/or number of cycles were changed to obtain catalysts with different atomic layers and properties.

3.2. Catalyst Characterization

The elemental composition of catalysts was determined by inductively coupled plasma mass spectrometry (ICP-MS) analysis at Saskatchewan Research Council. The analysis was carried out by the equipment of PerkinElmer Optima 5300 DV/Optima 8300 DV.
The BET surface area, average pore diameter, and pore volume of the support and catalysts were measured by N2 adsorption using Micromeritics ASAP 2020 with 0.2 g of the sample. The analysis bath temperature was maintained at −196 °C through the experiment. Degassing was carried out at 200 °C for 2 h. From room temperature to 200 °C, the heating rate was 10 °C∙min−1. The average pore diameter and pore volume were obtained from the result of the BJH analysis.
The H2 temperature-programmed reduction (H2-TPR) and CO2 temperature-programmed desorption (CO2-TPD) studies were performed using a Micromeritics 2950 HP Chemisorption Analyzer, equipped with a thermal conductivity detector (TCD). Before the analysis of H2-TPR, the sample was purged at 30 °C until the baseline signal was stable. The H2-TPR analysis was conducted by heating samples from 30 to 650 °C at a ramp of 10 °C∙min−1. The flow rate of 10% H2/argon was 50 mL∙min−1. During the CO2-TPD analysis, the catalyst sample was first pretreated at 250 °C for 20 min in He atmosphere to remove physically adsorbed CO2. Then, the CO2 adsorption was carried out at 50 °C. Afterwards, CO2 desorption was performed with a linear temperature increase up to 800 °C at a rate of 10 °C∙min−1.
A transmission electron microscope (TEM) and energy-dispersive X-ray spectroscopy (EDX) were used to investigate the Cu particle size and distribution of the elements of the reduced catalysts on a HITACHI HT-7700 with Bruker X-ray detector at Western College of Veterinary Medicine imaging center, University of Saskatchewan. Before the TEM and EDX tests, the samples were first reduced by 40 v/v% H2 at atmospheric pressure (ramp from room temperature to 500 °C, rate 5 °C∙min−1, isothermal for 3 h).
X-ray diffraction (XRD) analysis was conducted on a Bruker Advance D8 series II, equipped with Cu Kα radiation (λ = 0.1541 nm). The crystallite sizes of the reduced catalysts were estimated using Scherer’s equation:
size = kλ/β(2θ)cosθ,
where k is the crystallite shape constant (0.94), λ is the X-ray wavelength, and β(2θ) is the full width at half maximum in radians. The lattice constants for the reduced catalysts were determined by Bragg’s law:
nλ = 2d sinθ,
where n is the order of diffraction and d is the spacing between the different planes of atoms in the crystal lattice.
The active metal dispersion of the Cu–ZnO catalysts was obtained using CO chemisorption, which was performed on a Micrometrics ASAP 2020 instrument. After the sample was loaded and degassed, it was reduced in-situ with pure hydrogen at 500 °C for 2 h and cooled down under vacuum to 35 °C following purging in the flow of He for 30 min. Then, chemisorption analysis was conducted by passing the pulses of CO gas.
The Cu K-edge and Zn K-edge X-ray absorption spectroscopy (XAS) measurements were conducted at the Soft X-ray Micro-characterization Beamline (SXRMB) and Industry, Development, Education, and Students (IDEAS) beamline, respectively at the Canadian Light Source (CLS, Saskatoon, SK, Canada). A few milligrams of calcined or reduced samples were loaded on carbon tape. Both Cu K-edge and Zn K-edge were collected in fluorescence and transmission modes.

3.3. Catalyst Evaluation

The evaluations of the chosen catalysts with CO2 hydrogenation reactions were conducted in an Inconel fixed bed reactor (ID: 22 mm and length: 450 mm) with a single-pass downward flow. In total, 1 g of catalyst was diluted with 90 mesh size silicon carbide particles and loaded in the constant temperature zone of the reactor. Other parts of the reactor were filled with different sizes of silicon carbide by layers. The catalyst was then reduced under H2 (99.9% purity, Praxair, Canada) flow (120 mL∙min−1) at atmospheric pressure (ramp from room temperature to 500 °C, rate 5 °C∙min−1, isothermal for 3 h). The reduced catalyst was cooled down to 250 °C under H2 flow. The desired reaction gas flow rates were adjusted to a total volumetric flow rate of 160 mL∙min−1 (H2:CO2 = 3:1) (CO2: 99.9% purity, Praxair, Canada). Then, the reactor was pressurized to the reaction pressure of 4.0 MPa. The gas product was cooled to 0 °C in a cold trap to separate the condensable gas in the product stream into the liquid phase at the reaction pressure.
The non-condensable gases in the stream were monitored by a bubble flow column installed at the exit of the reactor, and analyzed by an off-line Agilent Technologies 7890A gas chromatograph instrument equipped with two thermal conductivity detectors (TCDs) and a flame ionization detector (FID). The liquid products were collected during a 24-h reaction period and analyzed with an off-line Agilent Technologies 7890A gas chromatograph equipped with a DB-Wax capillary column and FID detector. The weight of liquid products was measured after the collection to ensure the mass balance.
The conversion of CO2 was calculated as the average values for the total test duration:
X C O 2 = 100 % × n C O 2 , i n n C O 2 , o u t n C O 2 , i n .
Methanol selectivity was calculated with respect to carbon-containing products (no other product obtained except MeOH and CO):
S M e O H = 100 % × n M e O H n M e O H + n C O .
The turnover frequency (TOF) of CO2 or H2 was calculated based on the number of basic or metallic sites on the catalysts:
T O F = r e a c t i o n   r a t e n u m b e r   o f   a c t i v e   s i t e s .

4. Conclusions

The synthesis of the catalysts as planned—the isolated Cu nanoparticles distributed in ZnO layers, using SEA and ALD over-coating—was successful. By varying the exposure time of the Zn-containing precursor and the number of ZnO deposition layers, there was a slight change in the environment of the ZnO sites to Cu sites and vice versa, and their interactions.
As expected, these catalysts facilitated a greater CO formation rate than the MeOH formation rate. The more uniformed Cu site and ZnO site distribution in 5Cu-1CyZn-30s allowed it to have relatively more MeOH formation.
This study partially supports the mechanism theory in CO2 hydrogenation to form MeOH. Activated CO2 on the ZnO sites needs activated hydrogen in the right position. Our following work is to synthesize the catalysts with isolated ZnO sites distributed in Cu sites, in the hope that the activated CO2 will have enough activated hydrogen around it in the right position to form MeOH.

Author Contributions

Conceptualization, J.G. and H.W.; Data curation, J.G.; Formal analysis, J.G.; Funding acquisition, H.W. and A.D.; Investigation, J.G. and P.E.B.; Methodology, J.G.; Resources, Y.H., A.D. and H.W.; Supervision, H.W. and A.D.; Writing—original draft, J.G.; Writing—review and editing, P.E.B., Y.H., A.D. and H.W.

Funding

This research was funded by the Natural Sciences and Engineering Research Council of Canada (NSERC), Canadian Foundation for Innovation (CFI) and the China Scholarship Council (CSC).

Conflicts of Interest

The authors declare no conflict of interest.

References

  1. Le Quéré, C.; Barbero, L.; Hauck, J.; Andrew, R.M.; Canadell, J.G.; Sitch, S.; Korsbakken, J.I. Global Carbon Budget 2018. Earth Syst. Sci. Data 2018, 10, 2141–2194. [Google Scholar] [CrossRef] [Green Version]
  2. Wang, W.; Wang, S.; Ma, X.; Gong, J. Recent advances in catalytic hydrogenation of carbon dioxide. Chem. Soc. Rev. 2011, 40, 3703–3727. [Google Scholar] [CrossRef] [PubMed] [Green Version]
  3. Ma, J.; Sun, N.; Zhang, X.; Zhao, N.; Xiao, F.; Wei, W.; Sun, Y. A short review of catalysis for CO2 conversion. Catal. Today 2009, 148, 221–231. [Google Scholar] [CrossRef]
  4. Duan, H.; Yang, C.Y.; Singh, D.R.; Chiang, B.K.; Wang, S.; Xiao, C.P.; Patel, B.J.; Danaci, C.D.; Burke, B.N.; Zhai, Y.; et al. Mesoporous Carbon-supported Cu/ZnO for Methanol Synthesis from Carbon Dioxide. Aust. J. Chem. 2014, 67, 907–914. [Google Scholar] [CrossRef]
  5. Deerattrakul, V.; Dittanet, P.; Sawangphruk, M.; Kongkachuichay, P. CO2 hydrogenation to methanol using Cu-Zn catalyst supported on reduced graphene oxide nanosheets. J. CO2 Util. 2016, 16, 104–113. [Google Scholar] [CrossRef]
  6. Dong, X.; Li, F.; Zhao, N.; Xiao, F.; Wang, J.; Tan, Y. CO2 hydrogenation to methanol over Cu/ZnO/ZrO2 catalysts prepared by precipitation-reduction method. Appl. Catal. B Environ. 2016, 191, 8–17. [Google Scholar] [CrossRef]
  7. Le Valant, A.; Comminges, C.; Tisseraud, C.; Canaff, C.; Pinard, L.; Pouilloux, Y. The Cu-ZnO synergy in methanol synthesis from CO2, Part 1: Origin of active site explained by experimental studies and a sphere contact quantification model on Cu + ZnO mechanical mixtures. J. Catal. 2015, 324, 41–49. [Google Scholar] [CrossRef]
  8. Liang, Z.; Gao, P.; Tang, Z.; Lv, M.; Sun, Y. Three dimensional porous Cu-Zn/Al foam monolithic catalyst for CO2 hydrogenation to methanol in microreactor. J. CO2 Util. 2017, 21, 191–199. [Google Scholar] [CrossRef]
  9. Karelovic, A.; Bargibant, A.; Fernández, C.; Ruiz, P. Effect of the structural and morphological properties of Cu/ZnO catalysts prepared by citrate method on their activity toward methanol synthesis from CO2 and H2 under mild reaction conditions. Catal. Today 2012, 197, 109–118. [Google Scholar] [CrossRef]
  10. Gesmanee, S.; Koo-Amornpattana, W. Catalytic hydrogenation of CO2 for methanol production in fixed-bed reactor using Cu-Zn supported on gamma-Al2O3. Energy Procedia 2017, 138, 739–744. [Google Scholar] [CrossRef]
  11. Behrens, M.; Studt, F.; Kasatkin, I.; Kühl, S.; Hävecker, M.; Abild-pedersen, F.; Zander, S.; Girgsdies, F.; Kurr, P.; Kniep, B.; et al. The Active Site of Methanol Synthesis over Cu/ZnO/Al2O3 Industrial Catalysts. Science 2012, 759, 893–898. [Google Scholar] [CrossRef] [PubMed]
  12. Behrens, M. Meso-and nano-structuring of industrial Cu/ZnO/(Al2O3) catalysts. J. Catal. 2009, 267, 24–29. [Google Scholar] [CrossRef]
  13. Fujimoto, K.; Yu, Y. Spillover effect on the stabilization of Cu-Zn catalyst for CO2 hydrogenation to methanol. Stud. Surf. Sci. Catal. 1993, 77, 393–396. [Google Scholar]
  14. Hu, B.; Yin, Y.; Liu, G.; Chen, S.; Hong, X.; Tsang, S.C.E. Hydrogen spillover enabled active Cu sites for methanol synthesis from CO2 hydrogenation over Pd doped CuZn catalysts. J. Catal. 2018, 359, 17–26. [Google Scholar] [CrossRef]
  15. Waugh, K.C. Methanol Synthesis. Catal. Today 1992, 15, 51–75. [Google Scholar] [CrossRef]
  16. Ren, H.; Xu, C.-H.; Zhao, H.-Y.; Wang, Y.-X.; Liu, J.J.-Y.; Liu, J.J.-Y. Methanol synthesis from CO2 hydrogenation over Cu/γ-Al2O3 catalysts modified by ZnO, ZrO2 and MgO. J. Ind. Eng. Chem. 2015, 28, 261–267. [Google Scholar] [CrossRef]
  17. Choi, Y.; Futagami, K.; Fujitani, T.; Nakamura, J. The difference in the active sites for CO2 and CO hydrogenations on Cu / ZnO-based methanol synthesis catalysts. Catal. Lett. 2001, 73, 27–31. [Google Scholar] [CrossRef]
  18. Kanai, Y.; Watanabe, T.; Fujitani, T.; Saito, M.; Nakamura, J.; Uchijima, T. Evidence for the migration of ZnOx in a Cu/ZnO methanol synthesis catalyst. Catal. Lett. 1994, 27, 67–78. [Google Scholar] [CrossRef]
  19. Tisseraud, C.; Comminges, C.; Belin, T.; Ahouari, H.; Soualah, A.; Pouilloux, Y.; Le Valant, A. The Cu-ZnO synergy in methanol synthesis from CO2, Part 2: Origin of the methanol and CO selectivities explained by experimental studies and a sphere contact quantification model in randomly packed binary mixtures on Cu-ZnO coprecipitate catalysts. J. Catal. 2015, 330, 533–544. [Google Scholar] [CrossRef]
  20. Tisseraud, C.; Comminges, C.; Pronier, S.; Pouilloux, Y.; Le Valant, A. The Cu–ZnO synergy in methanol synthesis Part 3: Impact of the composition of a selective Cu@ZnOxcore–shell catalyst on methanol rate explained by experimental studies and a concentric spheres model. J. Catal. 2016, 343, 106–114. [Google Scholar] [CrossRef]
  21. Tisseraud, C.; Comminges, C.; Habrioux, A.; Pronier, S.; Pouilloux, Y.; Le Valant, A. Cu-ZnO catalysts for CO2 hydrogenation to methanol: Morphology change induced by ZnO lixiviation and its impact on the active phase formation. Mol. Catal. 2018, 446, 98–105. [Google Scholar] [CrossRef]
  22. Din, I.U.; Shaharun, M.S.; Naeem, A.; Tasleem, S.; Johan, M.R. Carbon nanofiber-based copper/zirconia catalyst for hydrogenation of CO2 to methanol. J. CO2 Util. 2017, 21, 145–155. [Google Scholar] [CrossRef]
  23. Musić, S.; Filipović-Vinceković, N.; Sekovanić, L. Precipitation of amorphous SiO2 particles and their properties. Braz. J. Chem. Eng. 2011, 28, 89–94. [Google Scholar] [CrossRef]
  24. Gawande, M.B.; Goswami, A.; Felpin, F.X.; Asefa, T.; Huang, X.; Silva, R.; Zou, X.; Zboril, R.; Varma, R.S. Cu and Cu-Based Nanoparticles: Synthesis and Applications in Catalysis. Chem. Rev. 2016, 116, 3722–3811. [Google Scholar] [CrossRef] [PubMed] [Green Version]
  25. Ayodele, O.B.; Tasfy, S.F.H.; Zabidi, N.A.M.; Uemura, Y. Co-synthesis of methanol and methyl formate from CO2 hydrogenation over oxalate ligand functionalized ZSM-5 supported Cu/ZnO catalyst. J. CO2 Util. 2017, 17, 273–283. [Google Scholar] [CrossRef]
  26. Huang, C.; Chen, S.; Fei, X.; Liu, D.; Zhang, Y. Catalytic hydrogenation of CO2 to methanol: Study of synergistic effect on adsorption properties of CO2 and H2 in CuO/ZnO/ZrO2 system. Catalysts 2015, 5, 1846–1861. [Google Scholar] [CrossRef]
  27. Gao, P.; Li, F.; Zhan, H.; Zhao, N.; Xiao, F.; Wei, W.; Zhong, L.; Sun, Y. Fluorine-modified Cu/Zn/Al/Zr catalysts via hydrotalcite-like precursors for CO2 hydrogenation to methanol. Catal. Commun. 2014, 50, 78–82. [Google Scholar] [CrossRef]
  28. Liu, Y.; Sun, K.; Ma, H.; Xu, X.; Wang, X. Cr, Zr-incorporated hydrotalcites and their application in the synthesis of isophorone. Catal. Commun. 2010, 11, 880–883. [Google Scholar] [CrossRef]
  29. Bhuiyan, M.M.R.; Lin, S.D.; Hsiao, T.C. Effect of calcination on Cu-Zn-loaded hydrotalcite catalysts for C-C bond formation derived from methanol. Catal. Today 2014, 226, 150–159. [Google Scholar] [CrossRef]
  30. Velu, S.; Suzuki, K.; Gopinath, C.S.; Yoshida, H.; Hattori, T. XPS, XANES and EXAFS investigations of CuO/ZnO/Al2O3/ZrO2 mixed oxide catalysts. Phys. Chem. Chem. Phys. 2002, 4, 1990–1999. [Google Scholar] [CrossRef]
  31. Dadlani, A.; Acharya, S.; Trejo, O.; Nordlund, D.; Peron, M.; Razavi, J.; Berto, F.; Prinz, F.B.; Torgersen, J. Revealing the Bonding Environment of Zn in ALD Zn(O,S) Buffer Layers through X-ray Absorption Spectroscopy. Appl. Mater. Interfaces 2017, 9, 39105–39109. [Google Scholar] [CrossRef] [PubMed]
  32. Janocha, E. Electronic Properties of ALD Zinc Oxide Interfaces and its Implication for Chalcopyrite Absorber Materials. Ph.D. Thesis, Fakultät IV—Elektrotechnik und Informatik, Technische Universität Berlin, Berlin, Germany, 2011. [Google Scholar] [CrossRef]
Figure 1. H2-TPR profiles of samples prepared by the Imp or SEA method with different Cu contents.
Catalysts 09 00922 g001
Figure 2. TEM images and particle size distribution of samples Imp-5Cu, SEA-5Cu, and SEA-10Cu.
Catalysts 09 00922 g002
Figure 3. XRD patterns corresponding to SiO2, SEA-5Cu, and ZnO over-coated Cu/SiO2 catalysts.
Catalysts 09 00922 g003
Figure 4. H2-TPR profiles of SEA-5Cu and ZnO over-coated Cu/SiO2 catalysts.
Catalysts 09 00922 g004
Figure 5. TEM images, particle size, and distribution of ZnO over-coated Cu/SiO2 catalysts.
Catalysts 09 00922 g005
Figure 6. CO2-TPD curves of the SEA-5Cu and ZnO over-coated Cu/SiO2 catalysts.
Catalysts 09 00922 g006
Figure 7. Experimental XANES spectra registered Cu K-edge of SEA-5Cu and ZnO over-coated Cu/SiO2 catalysts (left). The first derivative XANES spectra (right).
Catalysts 09 00922 g007
Figure 8. Experimental XANES spectra registered the Cu K-edge of reduced SEA-5Cu and ZnO over-coated Cu/SiO2 catalysts (left). The first derivative XANES spectra (right).
Catalysts 09 00922 g008
Figure 9. Experimental EXAFS spectra registered Cu K-edge of calcined (left) and reduced (right) SEA-5Cu and ZnO over-coated Cu/SiO2 catalysts.
Catalysts 09 00922 g009
Figure 10. Experimental XANES spectra registered Zn K-edge of calcined (left) reduced (right) SEA-5Cu and ZnO over-coated Cu/SiO2 catalysts (left).
Catalysts 09 00922 g010
Figure 11. Experimental EXAFS spectra registered Zn K-edge of calcined (left) and reduced (right) SEA-5Cu and ZnO over-coated Cu/SiO2 catalysts.
Catalysts 09 00922 g011
Table 1. Bulk properties of SiO2, SEA-5Cu, and ZnO over-coated Cu/SiO2 catalysts.
SamplesCu 1 Loading (wt%)Zn 1 Loading (wt%)BET Surface Area 2 (m2g−1)Pore Volume 2 (cm3g−1)Average Pore Size 2 (nm)Cu0 Lattice Constant 3 (Å)
SiO2--7180.413.0-
SEA-5Cu4.4-2640.304.53.62
5Cu-1CyZn-5s4.40.32000.214.23.62
5Cu-1CyZn-30s4.51.52100.244.33.64
5Cu-5CyZn-5s4.31.32380.284.63.65
1 Tested by ICP analysis; 2 Tested by N2 adsorption–desorption; 3 Calculated from XRD patterns.
Table 2. The content of elements on the reduced ZnO over-coated Cu/SiO2 catalysts detected by TEM-EDX.
Catalysts5Cu-1CyZn-5s
Element Content (wt%)
5Cu-1CyZn-30s
Element Content (wt%)
5Cu-5CyZn-5s
Elements Content (wt%)
SpotsZnCuSiOZnCuSiOZnCuSiO
11.987.01.89.31.110.943.744.30.15.060.734.2
20.222.642.035.21.912.348.637.24.18.043.144.8
30.317.746.835.21.18.552.837.62.49.043.245.4
40.27.845.246.81.88.350.139.81.026.534.637.9
Table 3. Metallic Cu particle size, dispersion, and metallic surface area of reduced catalysts.
SamplesCu Particle Size (nm)Cu Dispersion (%)Cu Surface Area (m2∙g−1)The Number of Metallic Sites (μmol∙g−1)
TEMXRD
SEA-5Cu8.47.1---
5Cu-1CyZn-5s8.16.51.90.69304
5Cu-1CyZn-30s6.75.31.70.65286
5Cu-5CyZn-5s6.96.41.30.53228
Table 4. Basic properties of the SEA-5Cu and ZnO over-coated Cu/SiO2 catalysts.
SamplesNumber of Basic Sites (μmol∙g−1)Total Number of Basic Sites
WeakModerateStrong
SEA-5Cu13193578784
5Cu-1CyZn-5s193018381158
5Cu-1CyZn-30s4236910171428
5Cu-5CyZn-5s214058841310
Table 5. Cu species in the reduced SEA-5Cu and ZnO over-coated Cu/SiO2 catalysts based on linear combination fitting.
SamplesConfiguration
CuCu2OCuO
SEA-5Cu0.750.010.24
5Cu-1CyZn-5s0.7500.25
5Cu-1CyZn-30s0.7500.25
5Cu-5CyZn-5s0.7900.21
Table 6. Catalytic performance of the ZnO over-coated Cu/SiO2 catalysts.
Catalysts 1CO2 Reaction RateMeOH Formation RateCO Formation RateMeOH SelectivityNumber of Basic SitesNumber of Metallic SitesRatio of Metallic to Basic SitesTOFCO2 by ZnOTOFH2 by Cu
(mmol∙g−1h−1)(%)(μmol∙g−1)(h−1)
5Cu-1CyZn-5s4.900.334.576.711583040.264.218.3
5Cu-1CyZn-30s4.770.484.3210.114282860.193.320.0
5Cu-5CyZn-5s4.060.213.895.213102280.173.119.7
1 Reaction conditions: T = 250 °C, P = 4.0 MPa, F = 9.6 L/h, 1.0 g catalyst.

