Article

Capping Agent Effect on Pd-Supported Nanoparticles in the Hydrogenation of Furfural

1
Department of Chemistry, University of Milan, via Golgi 19, 20133 Milano, Italy
2
ISTM-Institute of Molecular Sciences and Technologies, CNR—National Research Council, 20138 Milan, Italy
3
School of chemistry, University of Southampton, Southampton SO17 1BJ, UK
4
UK Catalysis Hub, Research Complex at Harwell, Rutherford Appleton Laboratory, Harwell Oxon, Didcot OX11 0FA, UK
5
Diamond Light Source Ltd., Harwell Science and Innovation Campus, Chilton, Didcot OX11 0DE, UK
*
Author to whom correspondence should be addressed.
Catalysts 2020, 10(1), 11; https://doi.org/10.3390/catal10010011
Submission received: 6 December 2019 / Revised: 17 December 2019 / Accepted: 18 December 2019 / Published: 19 December 2019
(This article belongs to the Special Issue Catalytic Transformation of Renewables (Olefin, Bio-sourced, et. al))

Abstract

:
The catalytic performance of a series of 1 wt % Pd/C catalysts prepared by the sol-immobilization method has been studied in the liquid-phase hydrogenation of furfural. The temperature range studied was 25–75 °C, keeping the H2 pressure constant at 5 bar. The effect of the catalyst preparation using different capping agents containing oxygen or nitrogen groups was assessed. Polyvinyl alcohol (PVA), polyvinylpyrrolidone (PVP), and poly (diallyldimethylammonium chloride) (PDDA) were chosen. The catalysts were characterized by ultraviolet-visible spectroscopy (UV-Vis), Fourier transform infrared spectroscopy (FTIR), transmission electron microscopy (TEM), and X-ray photoelectron spectroscopy (XPS). The characterization data suggest that the different capping agents affected the initial activity of the catalysts by adjusting the available Pd surface sites, without producing a significant change in the Pd particle size. The different activity of the three catalysts followed the trend: PdPVA/C > PdPDDA/C > PdPVP/C. In terms of selectivity to furfuryl alcohol, the opposite trend has been observed: PdPVP/C > PdPDDA/C > PdPVA/C. The different reactivity has been ascribed to the different shielding effect of the three ligands used; they influence the adsorption of the reactant on Pd active sites.

1. Introduction

Diminishing fossil fuel resources, a growing energy demand, and the increased environmental concerns caused by CO2 emissions have led to the search for new sustainable energy resources [1,2]. In this regard, waste lignocellulosic biomass, which mainly contains cellulose, hemicellulose, and lignin, is considered a promising sustainable resource. It is an abundant alternative carbon resource that can be used to produce chemicals and biofuels [3,4].
Among the value-added molecules, furfural is an important precursor in the generation of biofuels and chemical intermediates. It can be readily obtained from hemicellulose by acid-catalyzed cascade hydrolysis and dehydration [4,5]. Owing to its high unsaturation, the selective hydrogenation of furfural has attracted significant attention to produce a range of valuable C4 and C5 molecules including furfuryl alcohol (FA), tetrahydrofurfuryl alcohol (THFA), 2-methylfuran (2-MF), 2-methyltetrahydrofuran (2-MTHF), and others (Figure 1). FA is widely used in the chemical industry, primarily for the production of foundry resins, polymers, synthetic fibers, and a chemical intermediate for the production of perfume and vitamin [6,7]. THFA is considered a green solvent and is usually used in printer ink, agricultural applications, and electronics cleaners [7,8]. 2-MF has applications in biorefineries as a consequence of its high octane number, and in chemical industries, e.g., the production of toluene [9].
The main issue with furfural hydrogenation is controlling its reaction route and hydrogenation degree through a selective catalyst [10]. Depending on the process conditions [11], the nature of the catalyst [12], and the type of the solvent [13], furfural hydrogenation proceeds through various pathways and with the formation of a significant number of products. A variety of heterogeneous catalysts mainly based on Pd [14,15], Pt [16], Ni [17], Cu [18], and Ru [19]. supported on carbon [20], titanium oxide [21], alumina [22], silica. or zeolite [22], have been reported for the hydrogenation of furfural.
In terms of supported metal nanoparticles, the capping agent can affect the particle size, size distribution, morphology, and stability [23,24]. Recently, a number of researchers revealed an additional benefit of capping agents, which act as promoters and/or selectivity modifiers by blocking specific surface sites in various liquid-phase reactions [25]. Medlin et al. used self-assembled monolayers (SAMs) to create a more favorable surface environment for specific product formation [26]. They used alkanethiolate SAM-modified Pd catalysts for the selective hydrogenation of furfural, increasing the selectivity to value-added compounds, i.e., FA and 2-MF, by selectively blocking facets, leaving only particle edges/corners exposed [26]. It was also observed that supported Pd nanoparticles (NPs) protected by PVA led to higher selectivity to benzaldehyde in the liquid phase oxidation of benzyl alcohol, despite the conversion being lower. This was mainly because of the preferential blocking of Pd (111) facets, which have been recognized to facilitate the decarbonylation process [27]. Indeed, Rogers et al. proposed that the interaction between the solvent and PVA alters the PVA binding on the metal surface. Consequently, this interaction contributes to the different Pd corner and edge sites available [21].
To further understand the role of capping agents in controlling the selectivity of furfural hydrogenation, we prepared carbon-supported Pd nanoparticles through controlled sol-immobilization routes [28], using different capping agents including polyvinyl alcohol (PVA), polyvinylpyrrolidone (PVP), and poly(diallyldimethylammonium) chloride (PDDA). The aim of this work was to perform a more systematic study of the role of stabilizers under mild reaction conditions (25–75 °C, and 5 bar) and to enhance the understanding of this relatively under-reported effect.

2. Results

Pd colloids have been prepared in the presence of PVA, PVP, and PDDA as the stabilizer and NaBH4 as the reducing agent. PVA contains –OH groups, whereas PVP has a pyrrole-type N species in close proximity to a carbonyl group and PDDA contains dimethyl-ammonium groups (Figure 2). The metal loading was confirmed by atomic absorption spectroscopy (AAS).

2.1. UV-Visible Characterization

UV-Vis spectroscopy was used to demonstrate the complete reduction of the Pd2+ precursor to Pd0 after the addition of NaBH4, before immobilization on the support (Figure S1).
The peak at 236 nm, corresponds to the Pd–Cl metal charge transfer in [PdCl4]2−, whereas the peak at 420 nm is related to d–d transitions [29,30]. The capping agent–H2O sols are transparent in the visible range; however, PVA has a band at 280 nm, which can be attributed to the π → π* transition of the carbonyl groups (C=O) associated with ethylene unsaturation [31]. The spectra of the Pd precursor+capping agent and Pd sols demonstrate the interaction of the metal with PVA and PVP. A shift at 286 nm (blue curve, Figure S1c) after adding PDDA to the Pd precursor, suggests a possible ligand-to-metal charge transfer interaction between PDDA and [PdCl4]2-, as already evidenced in the case of Au [31]. The disappearance of the peaks related to Pd2+ and the observed scattering suggest the complete reduction to Pd0 and the formation of metal nanoparticles [32,33].

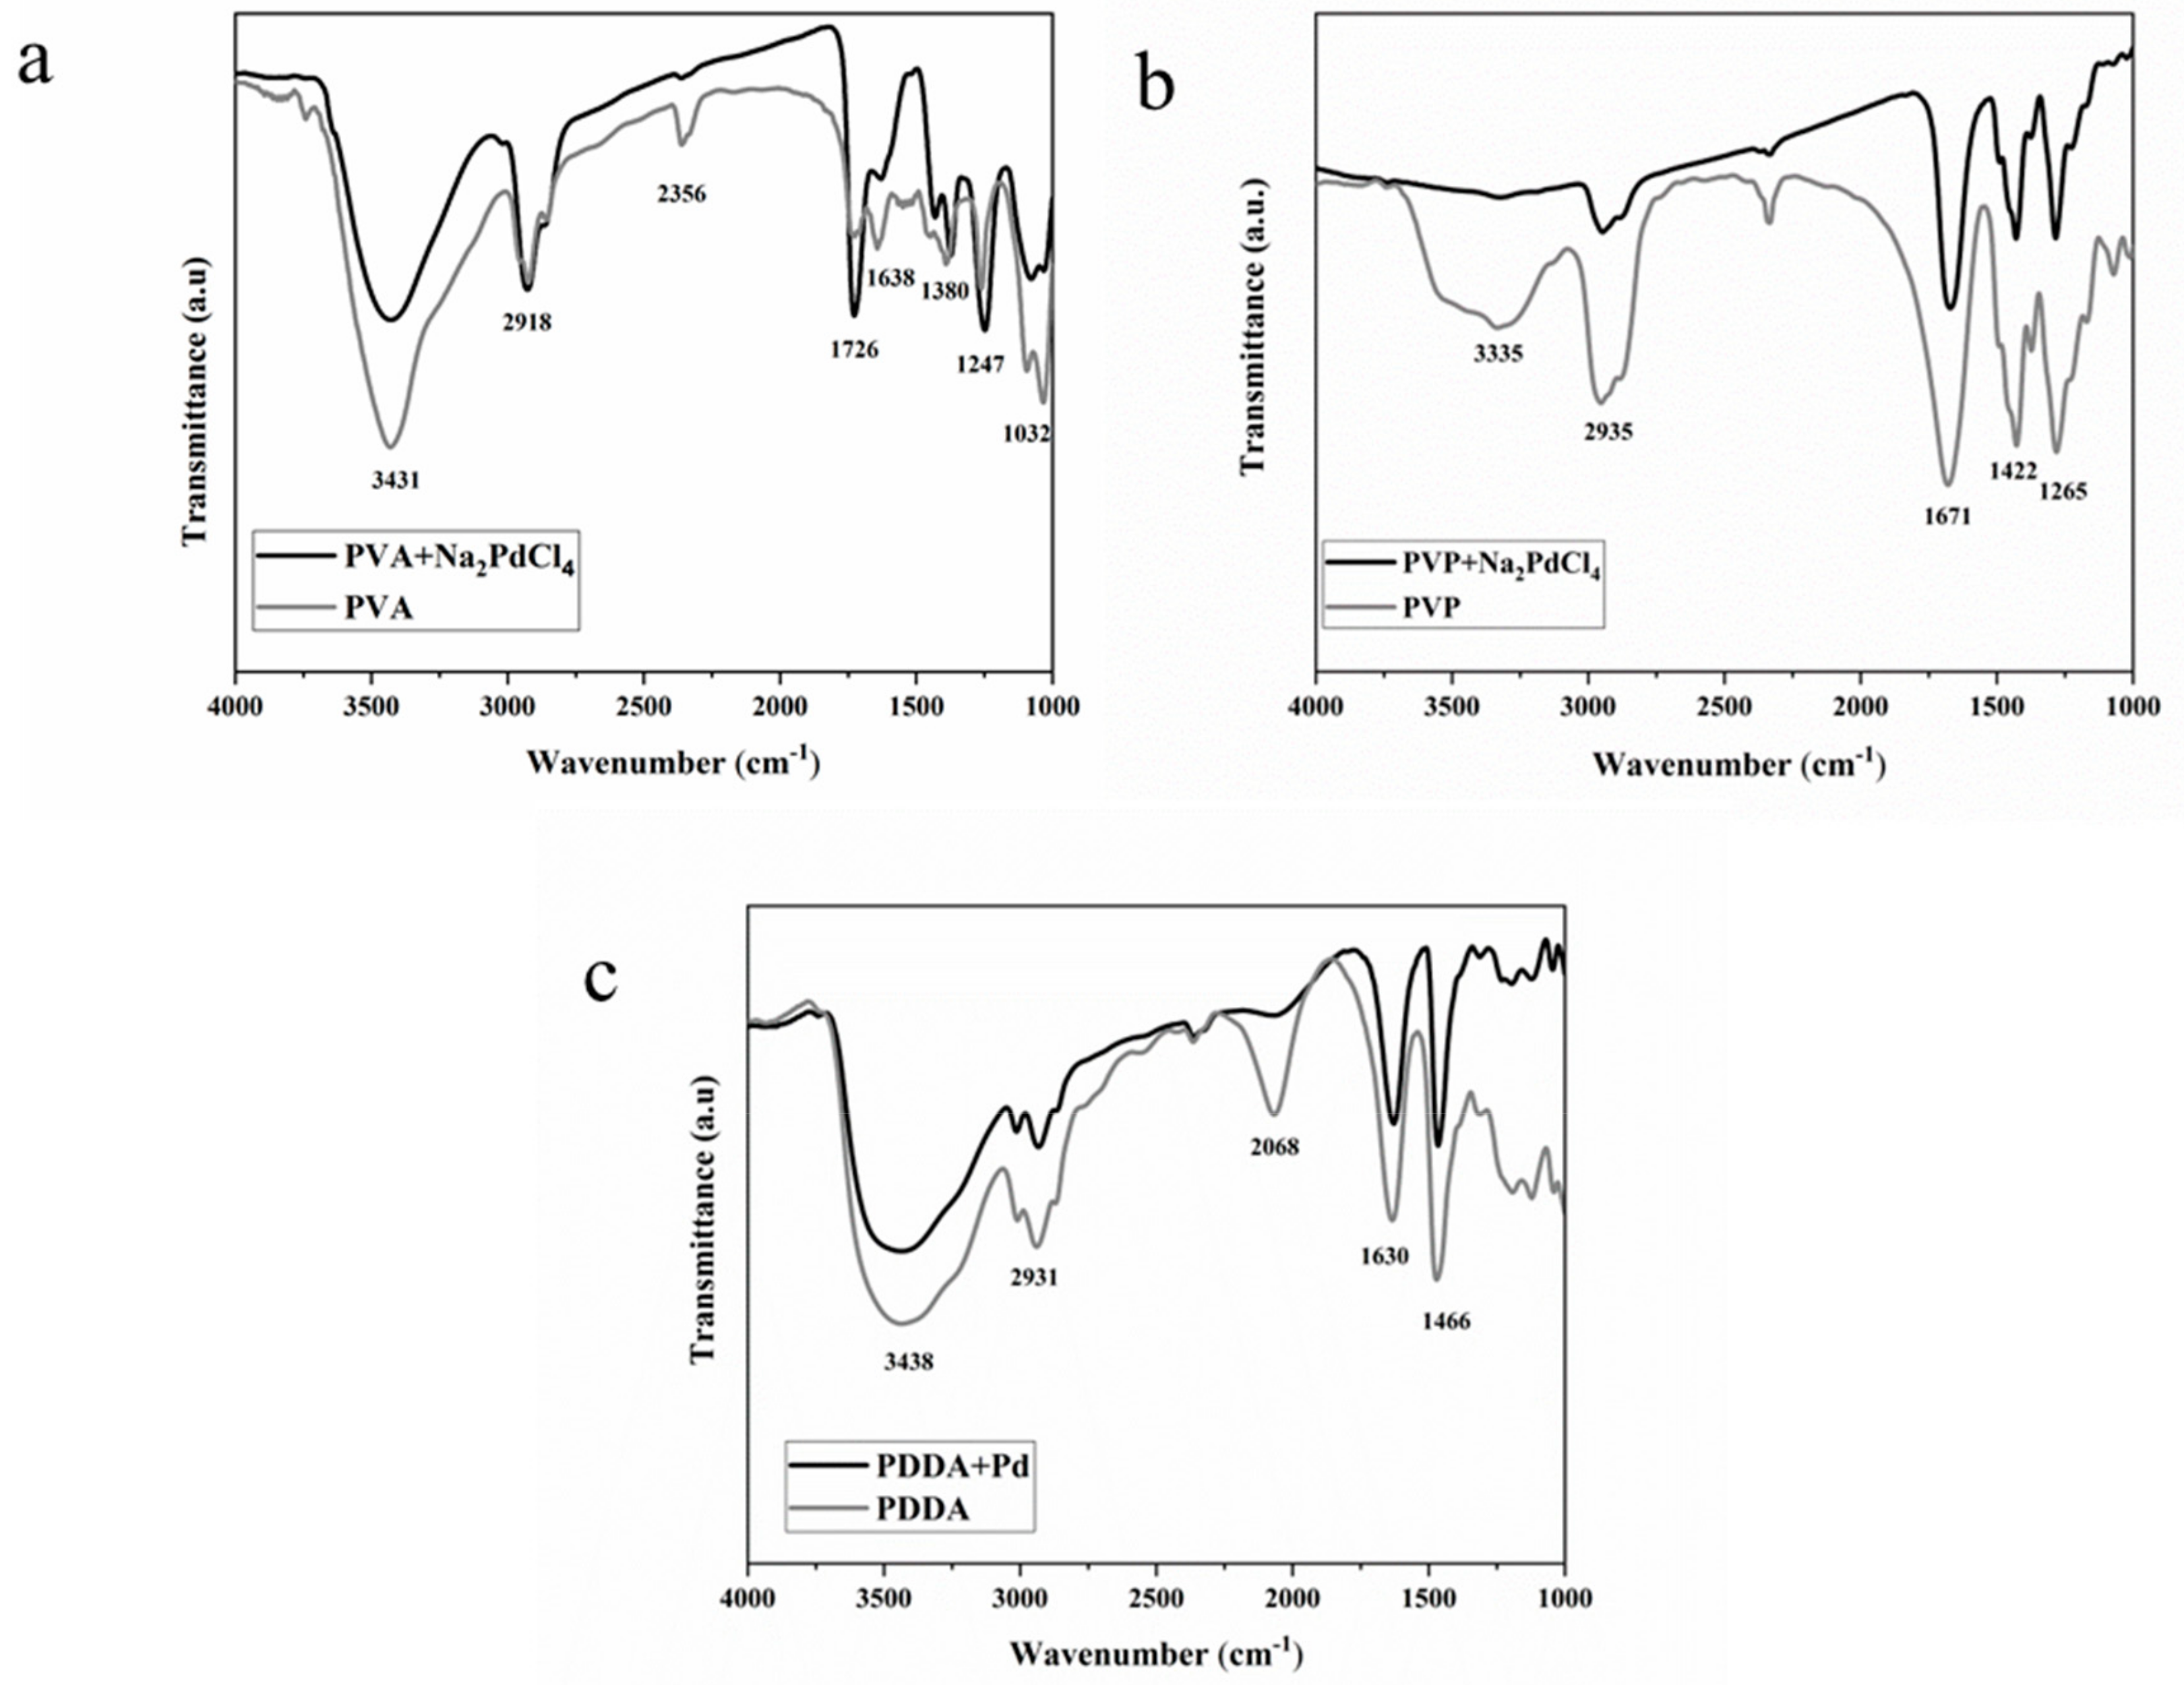
2.2. Infrared (IR) Spectroscopy

The interaction of the capping agents with Pd precursor was also investigated using Fourier transform infrared (FTIR) spectroscopy. The FTIR spectra of PVA and PVA–Pd precursor (Na2PdCl4) are shown in Figure 3a. The primary bands for the PVA films are: (i) 3431 cm−1, O–H stretching vibrations (the broad nature of the –OH stretching vibration is characteristic of residual water, i.e., KBr is hygroscopic) and (ii) 2918 cm−1, aliphatic C–H stretching vibrations (the peak at 2356 cm−1 is due to gas phase CO2). The peak at 1726 cm−1 can be assigned to C=O stretching deriving from the residual C=O due to the incomplete hydrolysis of the acetate group [34]. PVA is produced by the polymerization of vinyl acetate to poly(vinyl acetate), and its subsequent hydrolysis to PVA. The peaks between 1380 and 1247 cm−1 can be assigned to O–H deformation, whereas the peaks at 1200–1000 cm−1 can be attributed to the stretching vibrations of C–O–C linkage, which suggest the presence of cross-linked PVA molecules [35]. The slight modification observed for the peaks at 1380–1247 cm−1 in the spectrum of PVA+Na2PdCl4 suggests a weak interaction between the metal precursor and the –OH groups present in PVA.
The prominent band related to PVP (Figure 3b) at 3335 cm−1 is due to the O–H stretching vibrations of adsorbed water at the surface of particles. The peak at 2951 cm−1 could be related to asymmetric CH2 stretching of the ring, while the one at 1671 cm−1 is assigned to the stretching vibration of C=O. The absorption peak at 1425 cm−1 is due to the С–H2 scissor. The peak at 1281 cm−1 can be assigned to the C–N stretching vibrations. Previous studies revealed that PVP can bind to Pd surfaces from the carbonyl group or nitrogen atom of the pyrrolidone units [36,37]. The decrease in intensity of the peak at 1671 cm−1 and at 1265 cm−1, observed after the addition of Pd, confirms that both O and N groups present in PVP interact with the metal precursor [38,39].
The characteristic FTIR spectrum of PDDA is illustrated in Figure 3c. The peak at 1635 cm−1 is attributed to the bending vibration of the C–N group, and the one at 1466 cm−1 is assigned to C=C stretching, in a positively charged environment contributed by the positively charged nitrogen of the polycations [40]. After the addition of Pd, the observed decrease in the intensity of the peaks located at 1635 and 1466 cm−1 indicates that the activities of these vibrational modes are modified in the mixture, probably due to the PDDA–Pd interaction. With further inspection of Figure 3c, one can observe a loss in the peak at 2068 cm−1 after the addition of the Pd precursor. This result has been already observed in the literature, but the origin of this peak is not clear [40].

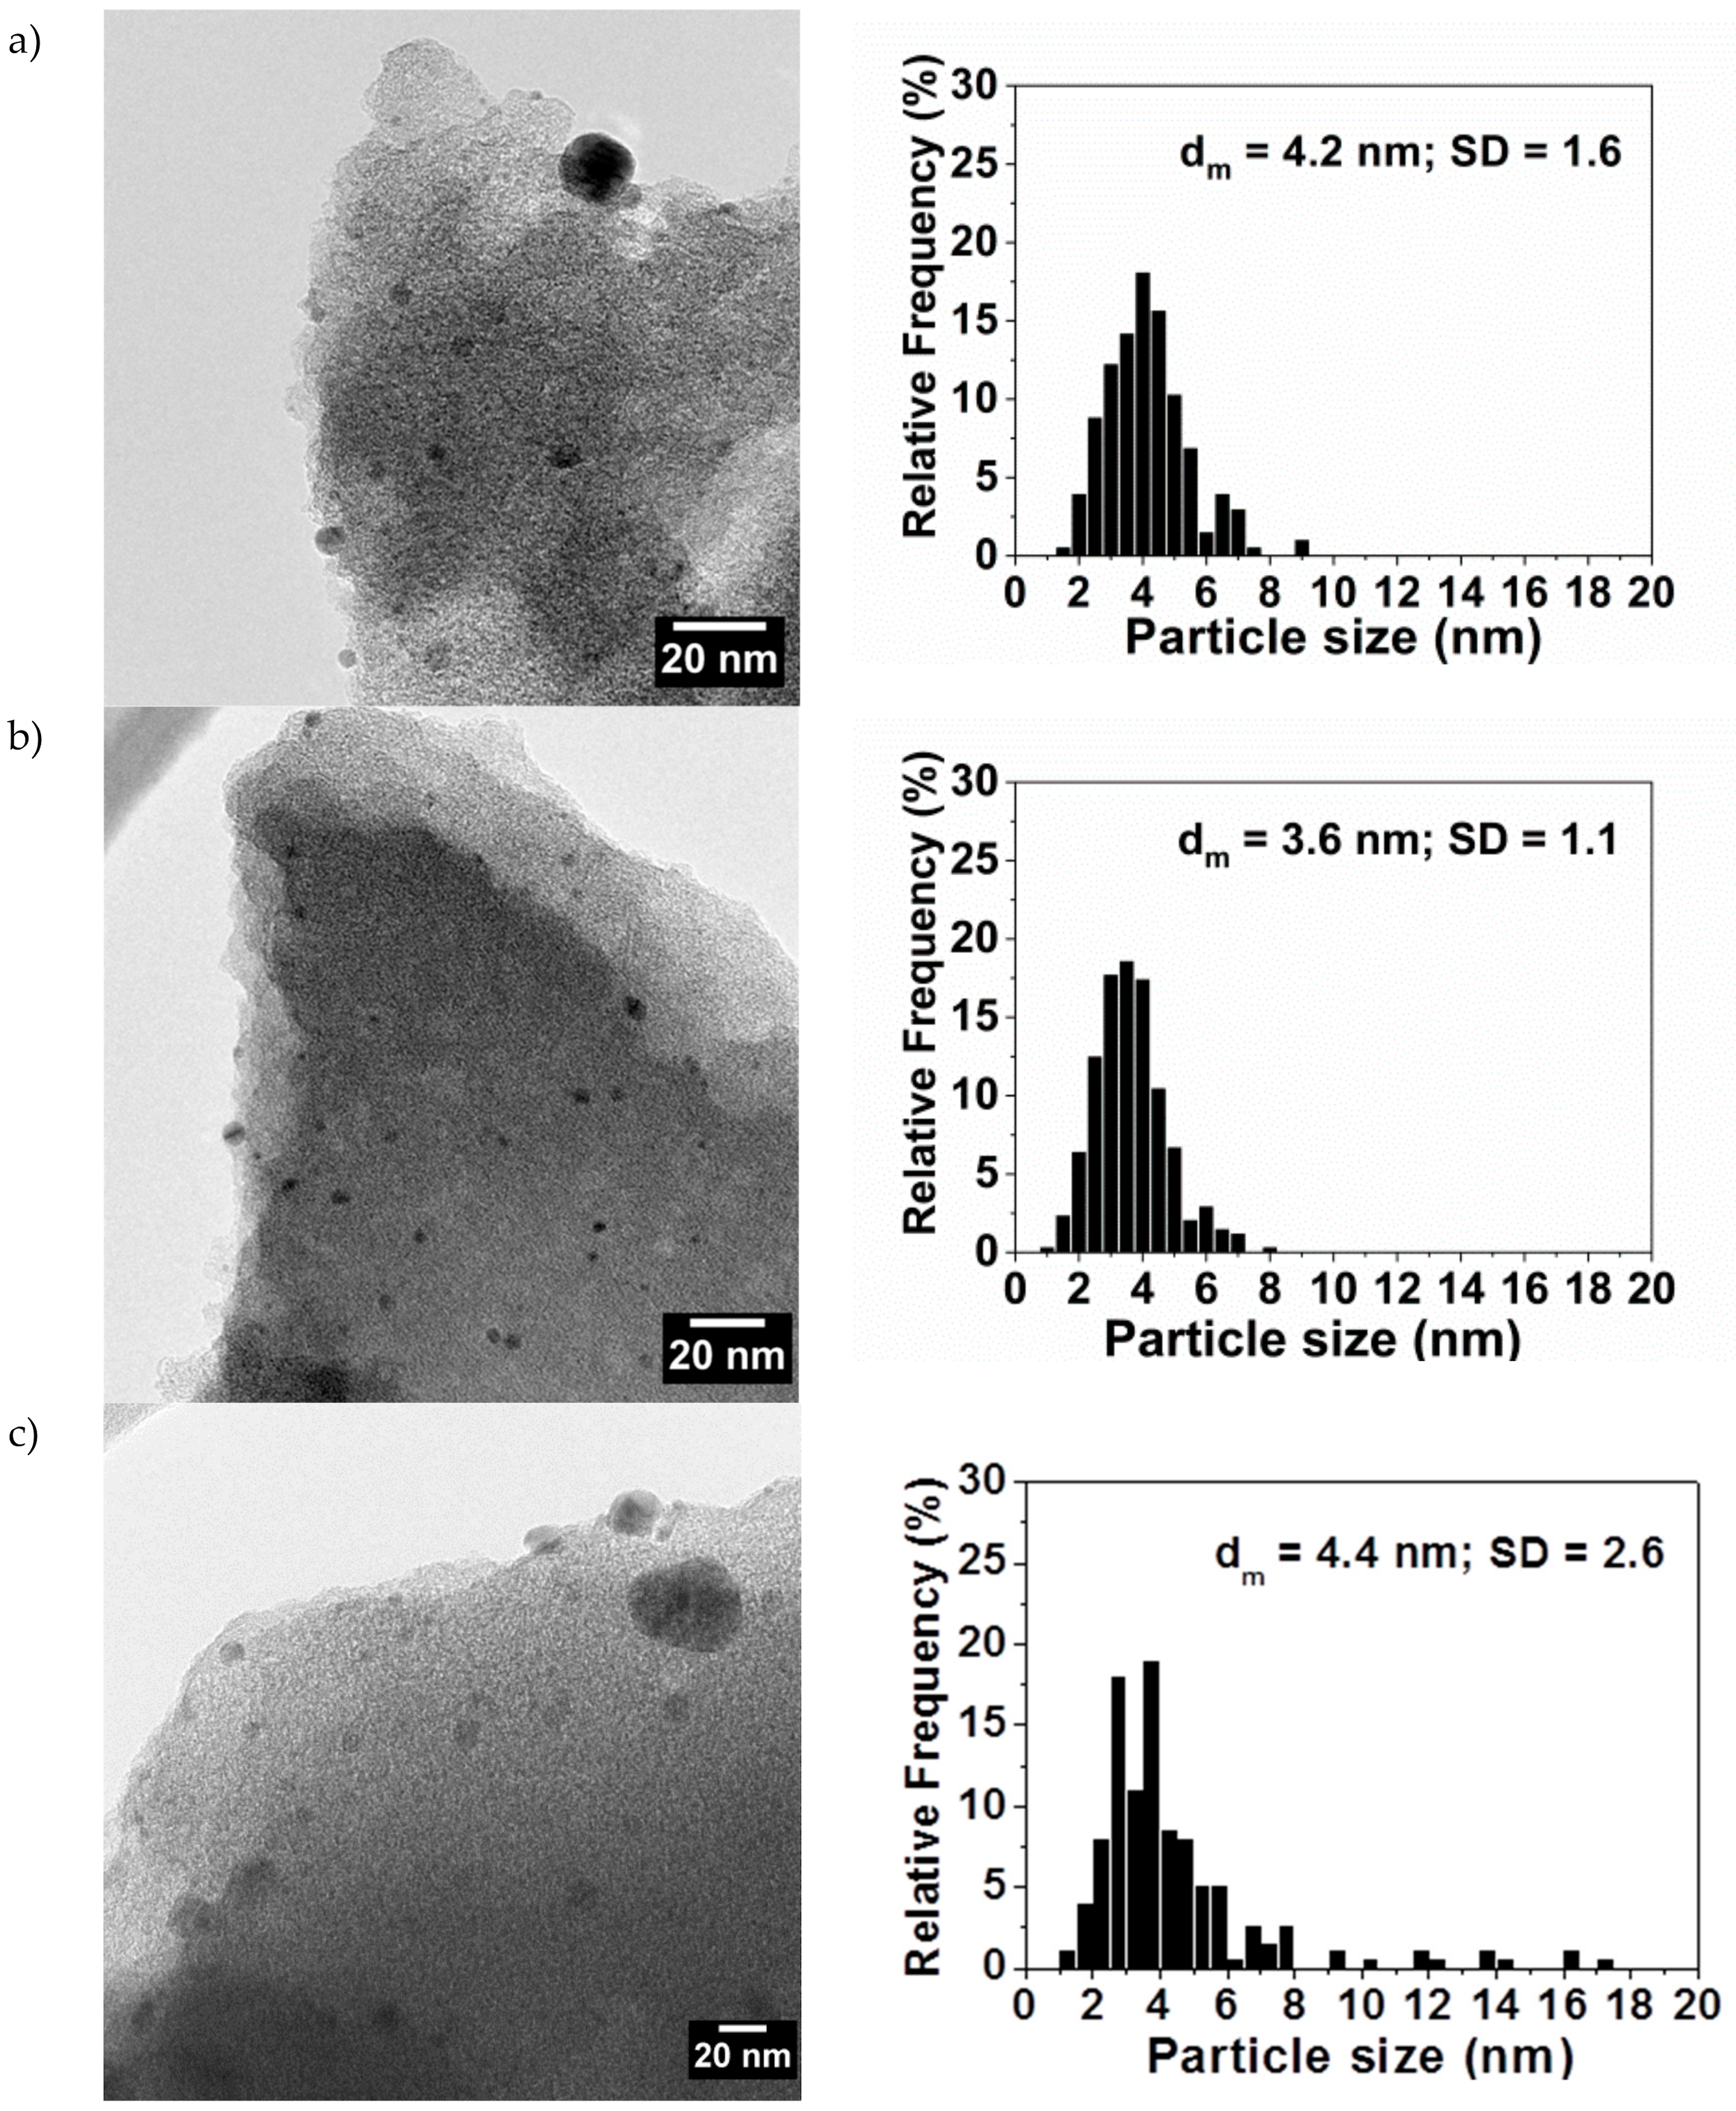
2.3. Transmission Electron Microscopy (TEM)

After the immobilization of the Pd nanoparticles on the support, the morphological specification of the prepared catalysts was investigated by HRTEM (Figure 4). It is noticeable that the capping agent has a great influence on the Pd NPs’ size and distribution when using activated carbon (Camel (X40S)) as a support. All the catalysts showed an average particle size of 3–4 nm, with the presence of isolated larger particles, in particular for PdPDDA/C (see Figure 4).

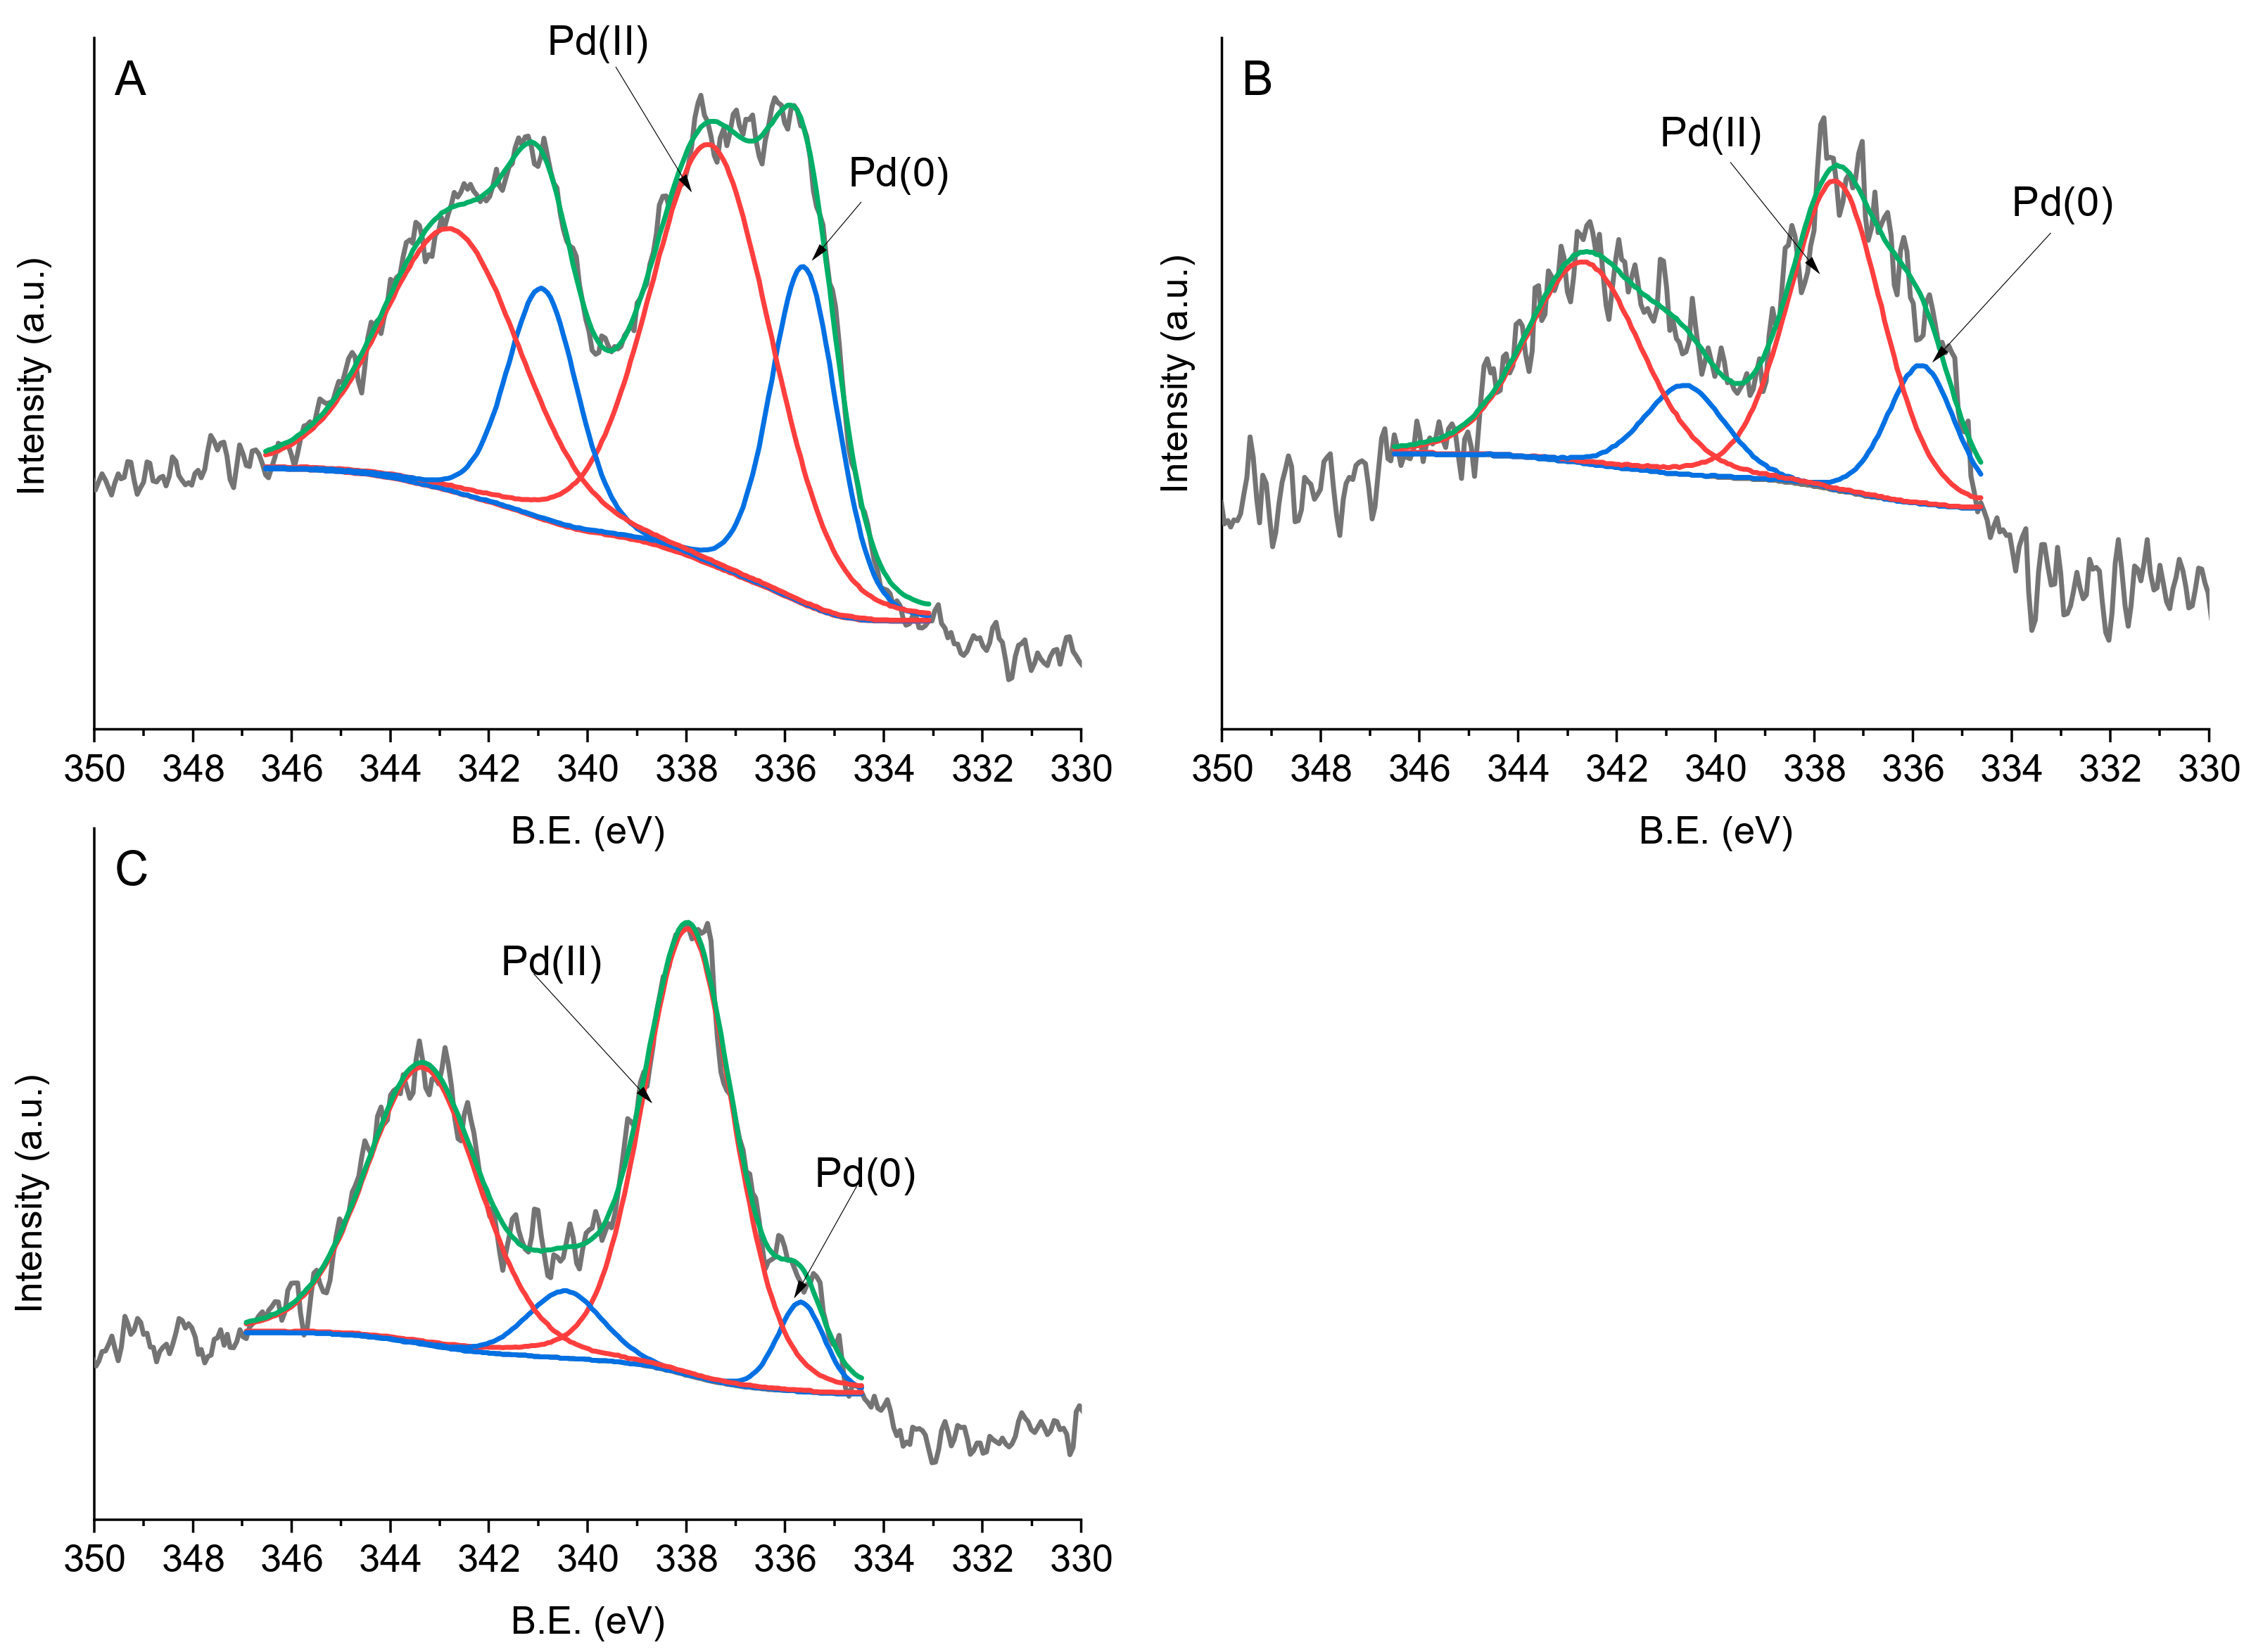
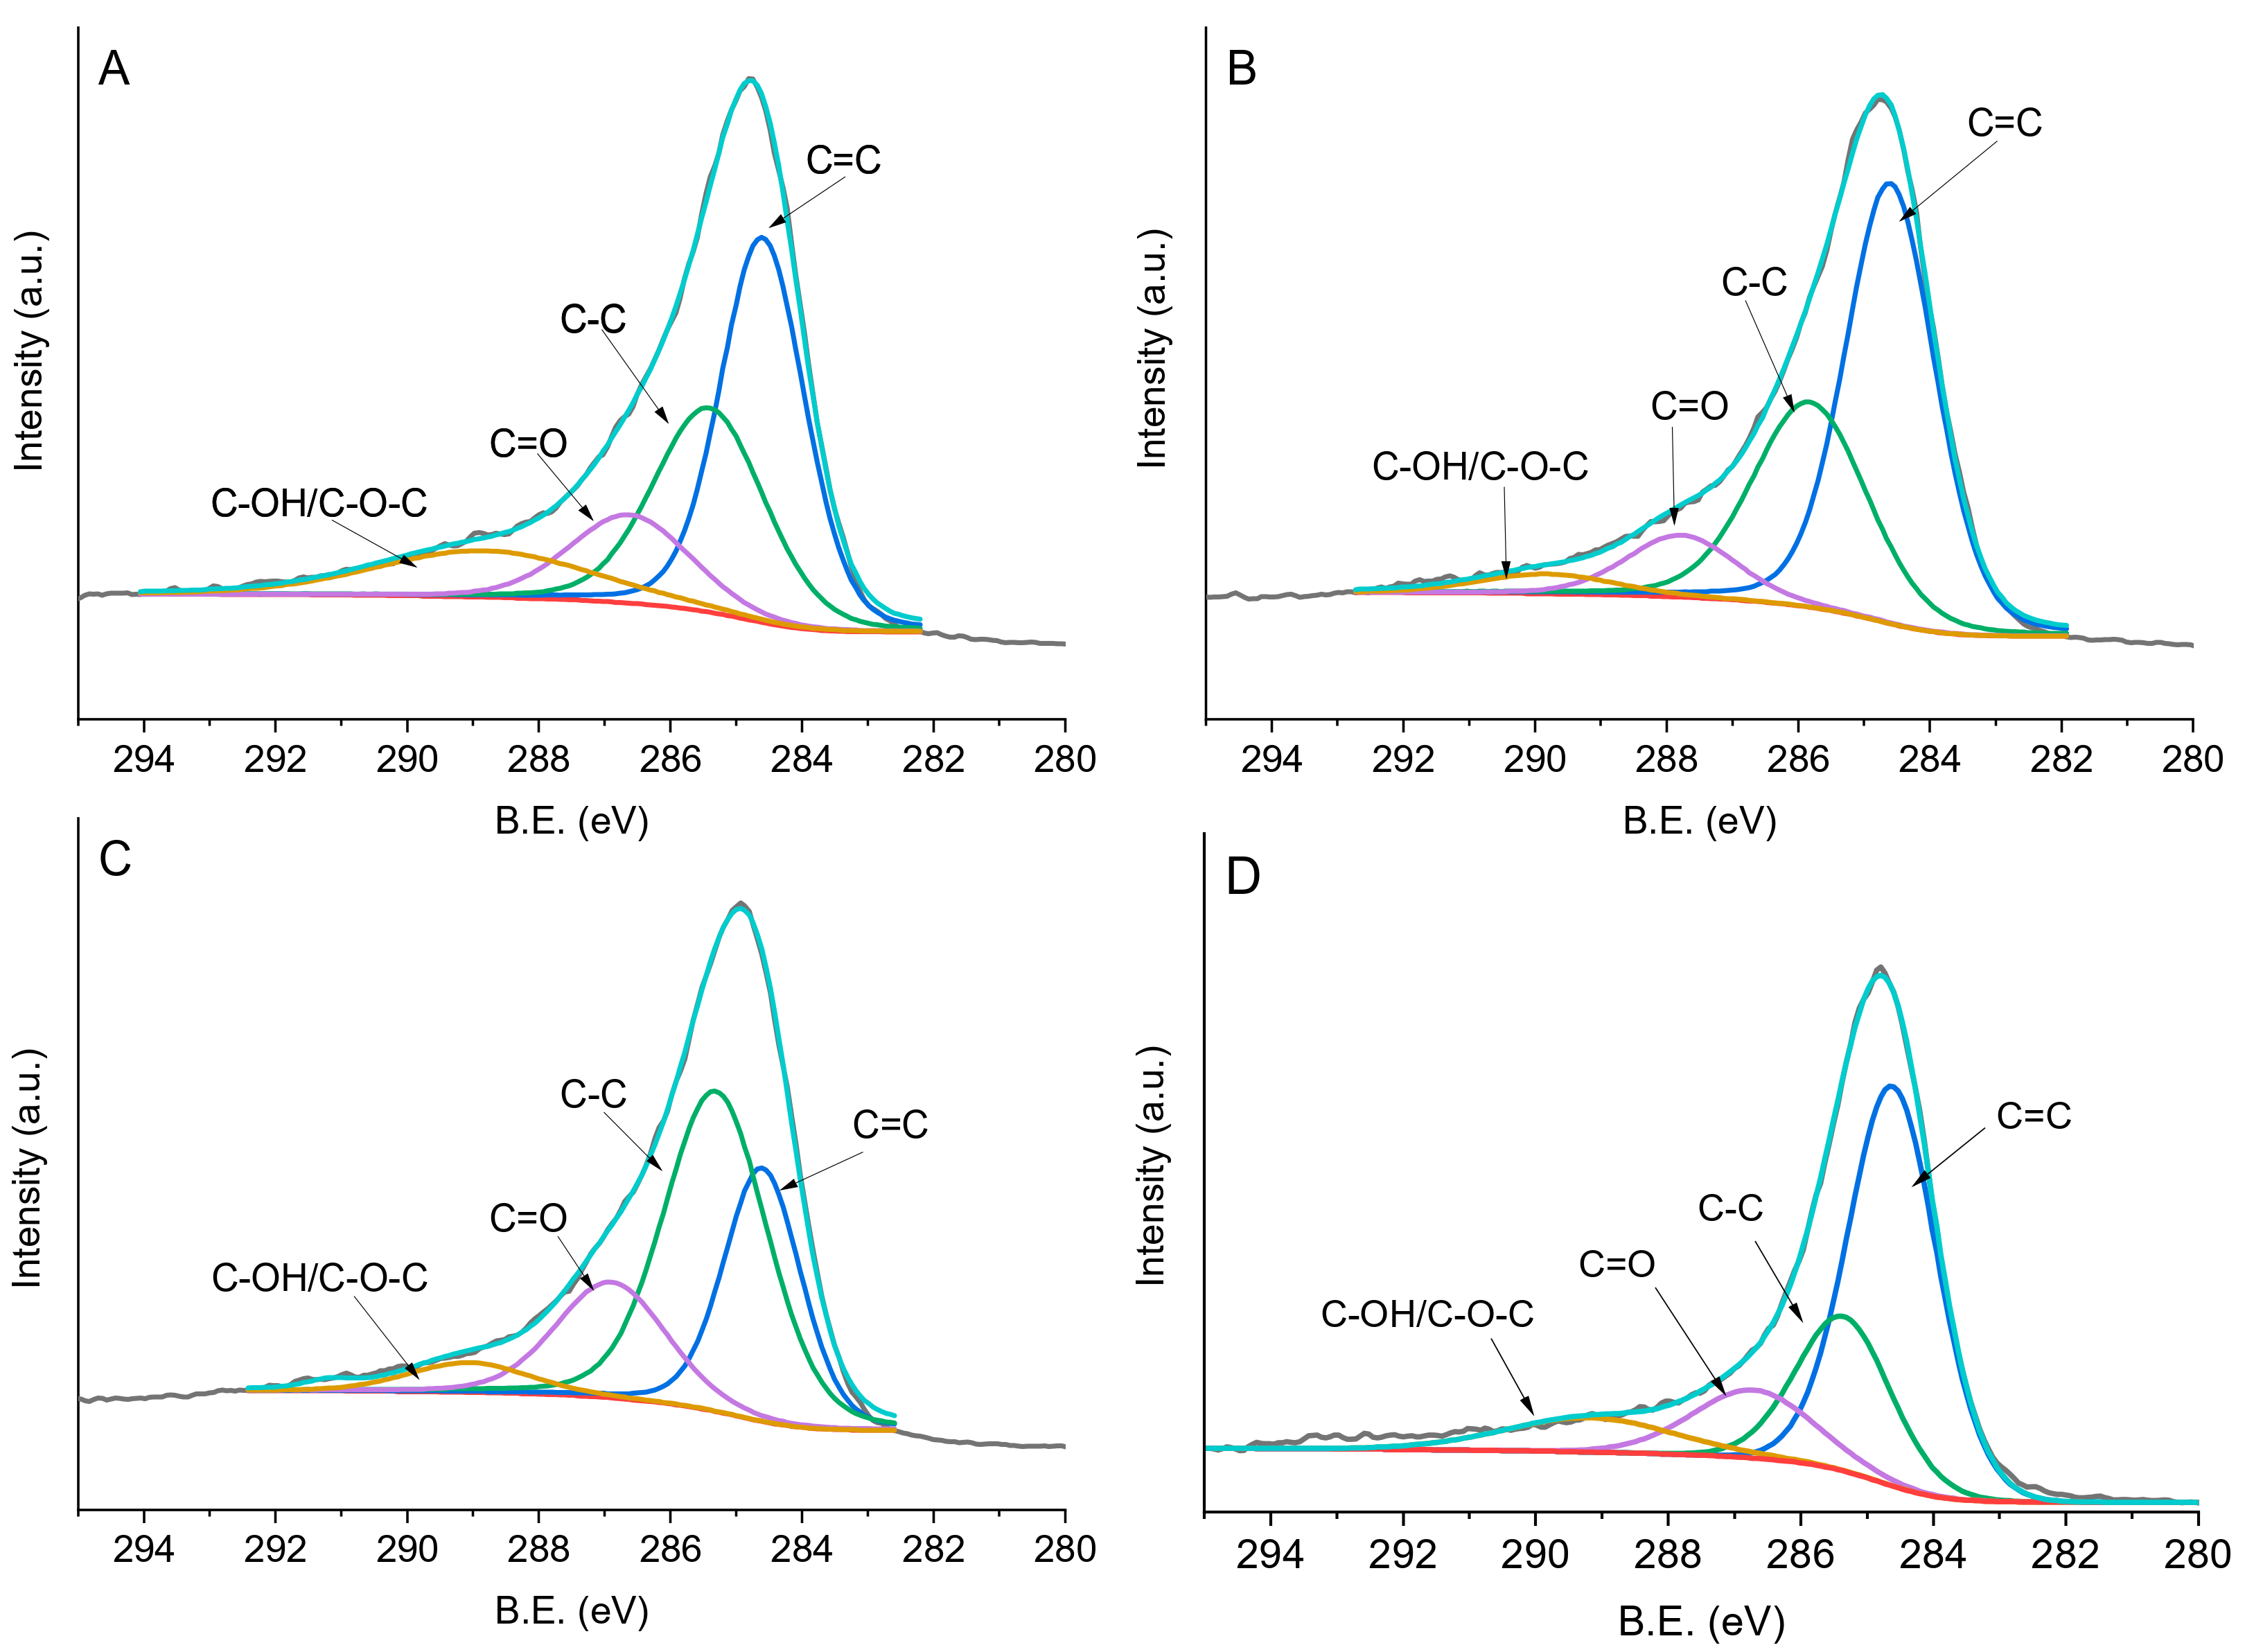
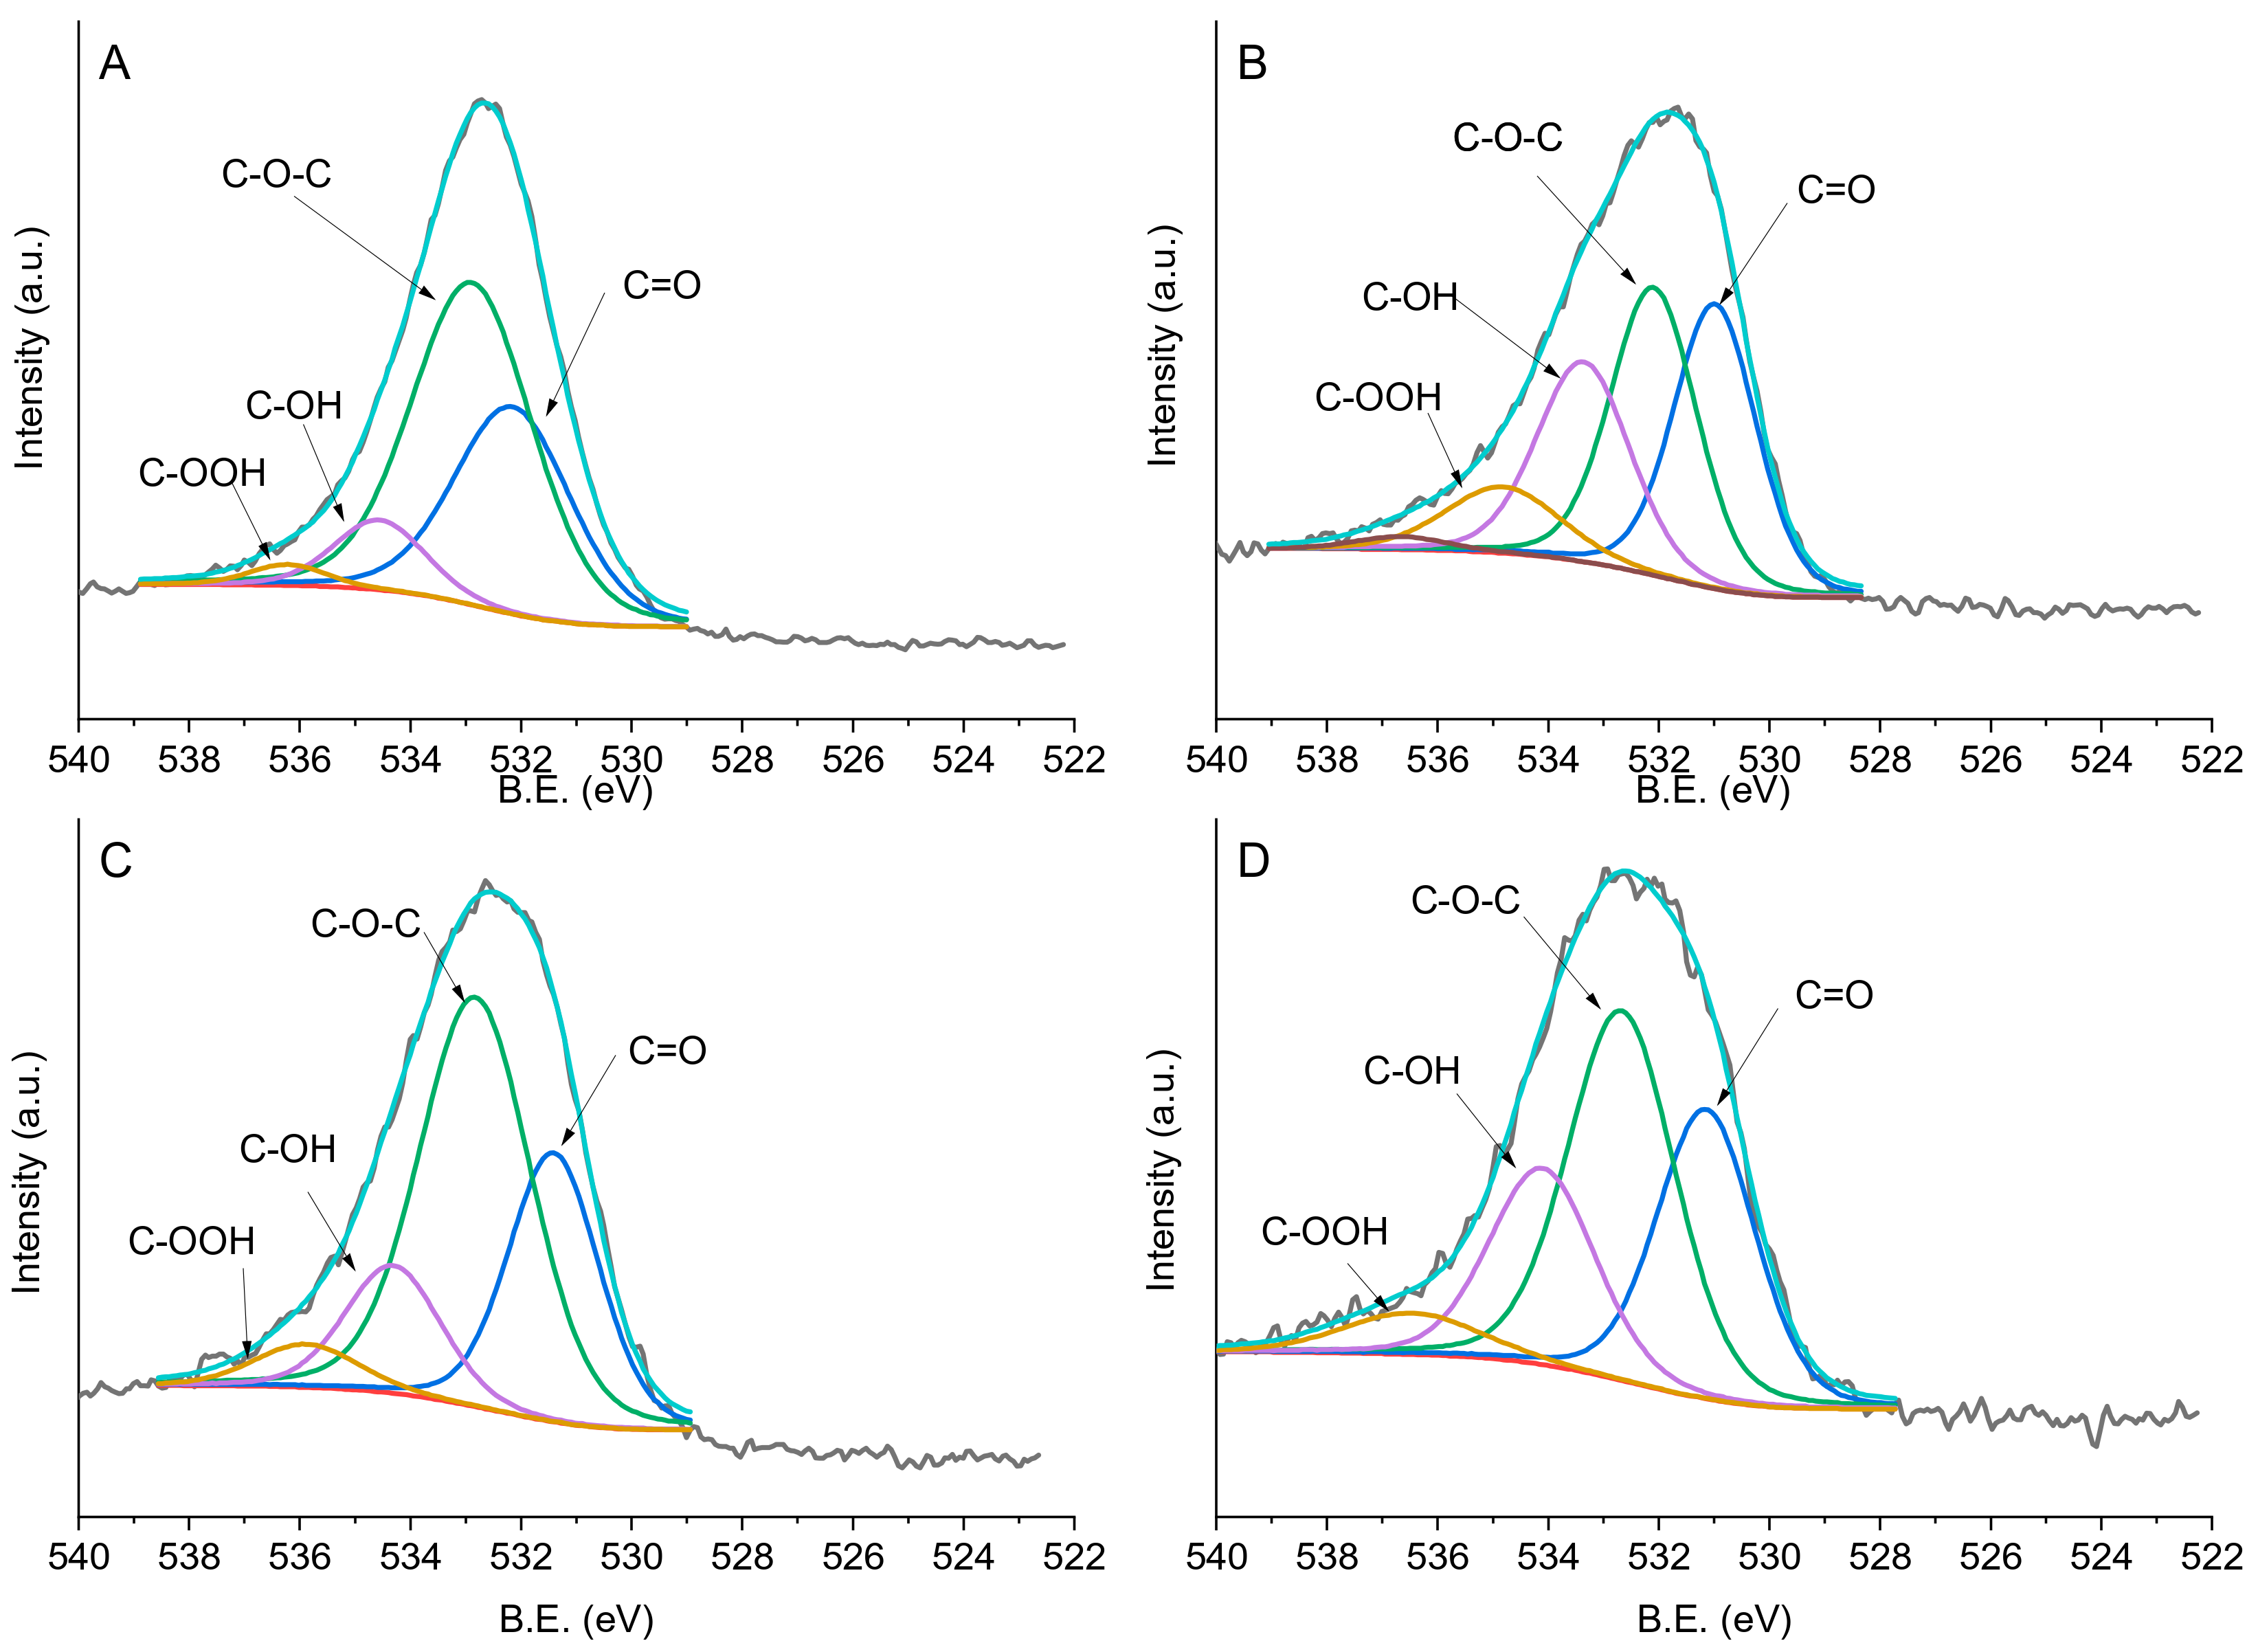
2.4. X-ray Photoelectron Spectroscopy (XPS)

X-ray photoelectron spectroscopy (XPS) of the catalysts was performed to investigate the surface chemistry of the carbon support, the chemical state, and the exposure of supported palladium species. XPS survey data indicated the presence of only Pd, C, N, and O species. No evidence of Na or B residues from NaBH4 was detected (Table 1). Depending on the capping agent used, significant differences were observed in the relative amount of Pd at the surface: PdPVA/C (1.30%) > PdPDDA/C (0.76%) > PdPVP/C (0.50) (Table 1). The data revealed a different oxygen content in the samples. PdPVA/C shows the highest relative amount of O 1s (14.7%) compared to PdPDDA/C (9.70%) and PdPVP/C (9.10%), which show an oxygen content similar to bare carbon (9.17%) (Table 1). The highest oxygen content on the surface of PdPVA/C catalyst is probably due to the presence of oxygen groups contained in PVA, confirming the presence of the capping agent on the surface of the catalyst.
PdPVP/C evidenced the highest amount of N (2.95%), superior to PdPDDA/C (1.86%), whereas for PdPVA/C nitrogen was not detected on the surface, as expected.
The XPS spectra show two components in the Pd 3d3/2 region. The full width at half maximum (FWHM) was set between 1 and 3 eV. The measured spectra were deconvoluted with a few traces of the Gauss (80%)–Lorentz (20%) mixed function.
The XPS spectra show two components in the Pd 3d3/2 region. The first peak at a binding energy (BE) of ~335 eV is ascribed to Pd0, while a second peak centered at ~338 eV was ascribed to Pdδ+ species (Table 2 and Figure 4). Pd is mainly present in its oxidized form. However, the Pd0/Pdδ+ ratio varies when using different capping agents. A higher content of Pd0 species was observed in the case of PdPVA/C and PdPVP/C catalysts (30.9% and 23.9%, respectively), compared to PdPDDA/C, which mainly contain oxidized Pd on the surface of the nanoparticles (Table 2, Figure 5c), in agreement with the increasing steric hindrance of the capping agent (PVA < PVP < PDDA).
In the C 1s region we can identify four peaks. The signal at 284.0–284.6 eV can be assigned to sp2-hybridised carbon, the one at 285.3–285.8 eV to sp3-hybridized carbon, the one at 286.6–287.9 eV to the C=O group, and the one at 288.8–292.2 eV to C–OH/C–O–C, as indicated in Table 3 and Figure 6. Four main oxygen groups were identified. Binding Energy (BE) of 529.5–531.4 eV corresponds to a carbon–oxygen double bond and the one at 532.1–532.8 eV to an ether-like single bond, whereas BE at 533.4–534.6 eV can be attributed to carbon–oxygen single bonds in hydroxyl groups [41] (Figure 7). Oxygen species around 536.0 eV refer to the presence of carboxylic groups [42]. Bare X40S carbon contains 30% C=O groups, 41.9% C–O–C, 22.1% C–OH groups, and 6.0% carboxylic groups (Table 3). After the addition of PdPVP nanoparticles, the oxygen species’ relative ratio remains similar, whereas after the addition of PdPVA and PdPDDA the percentage of C–O–C increases with a decrease in C–OH species. For PdPVA, we can attribute the unexpected decrease in superficial –OH groups to the formation of C–O–C species between hydroxyl groups of the carbon and of PVA and the crosslinking of PVA chains, supporting the findings of FTIR spectroscopy

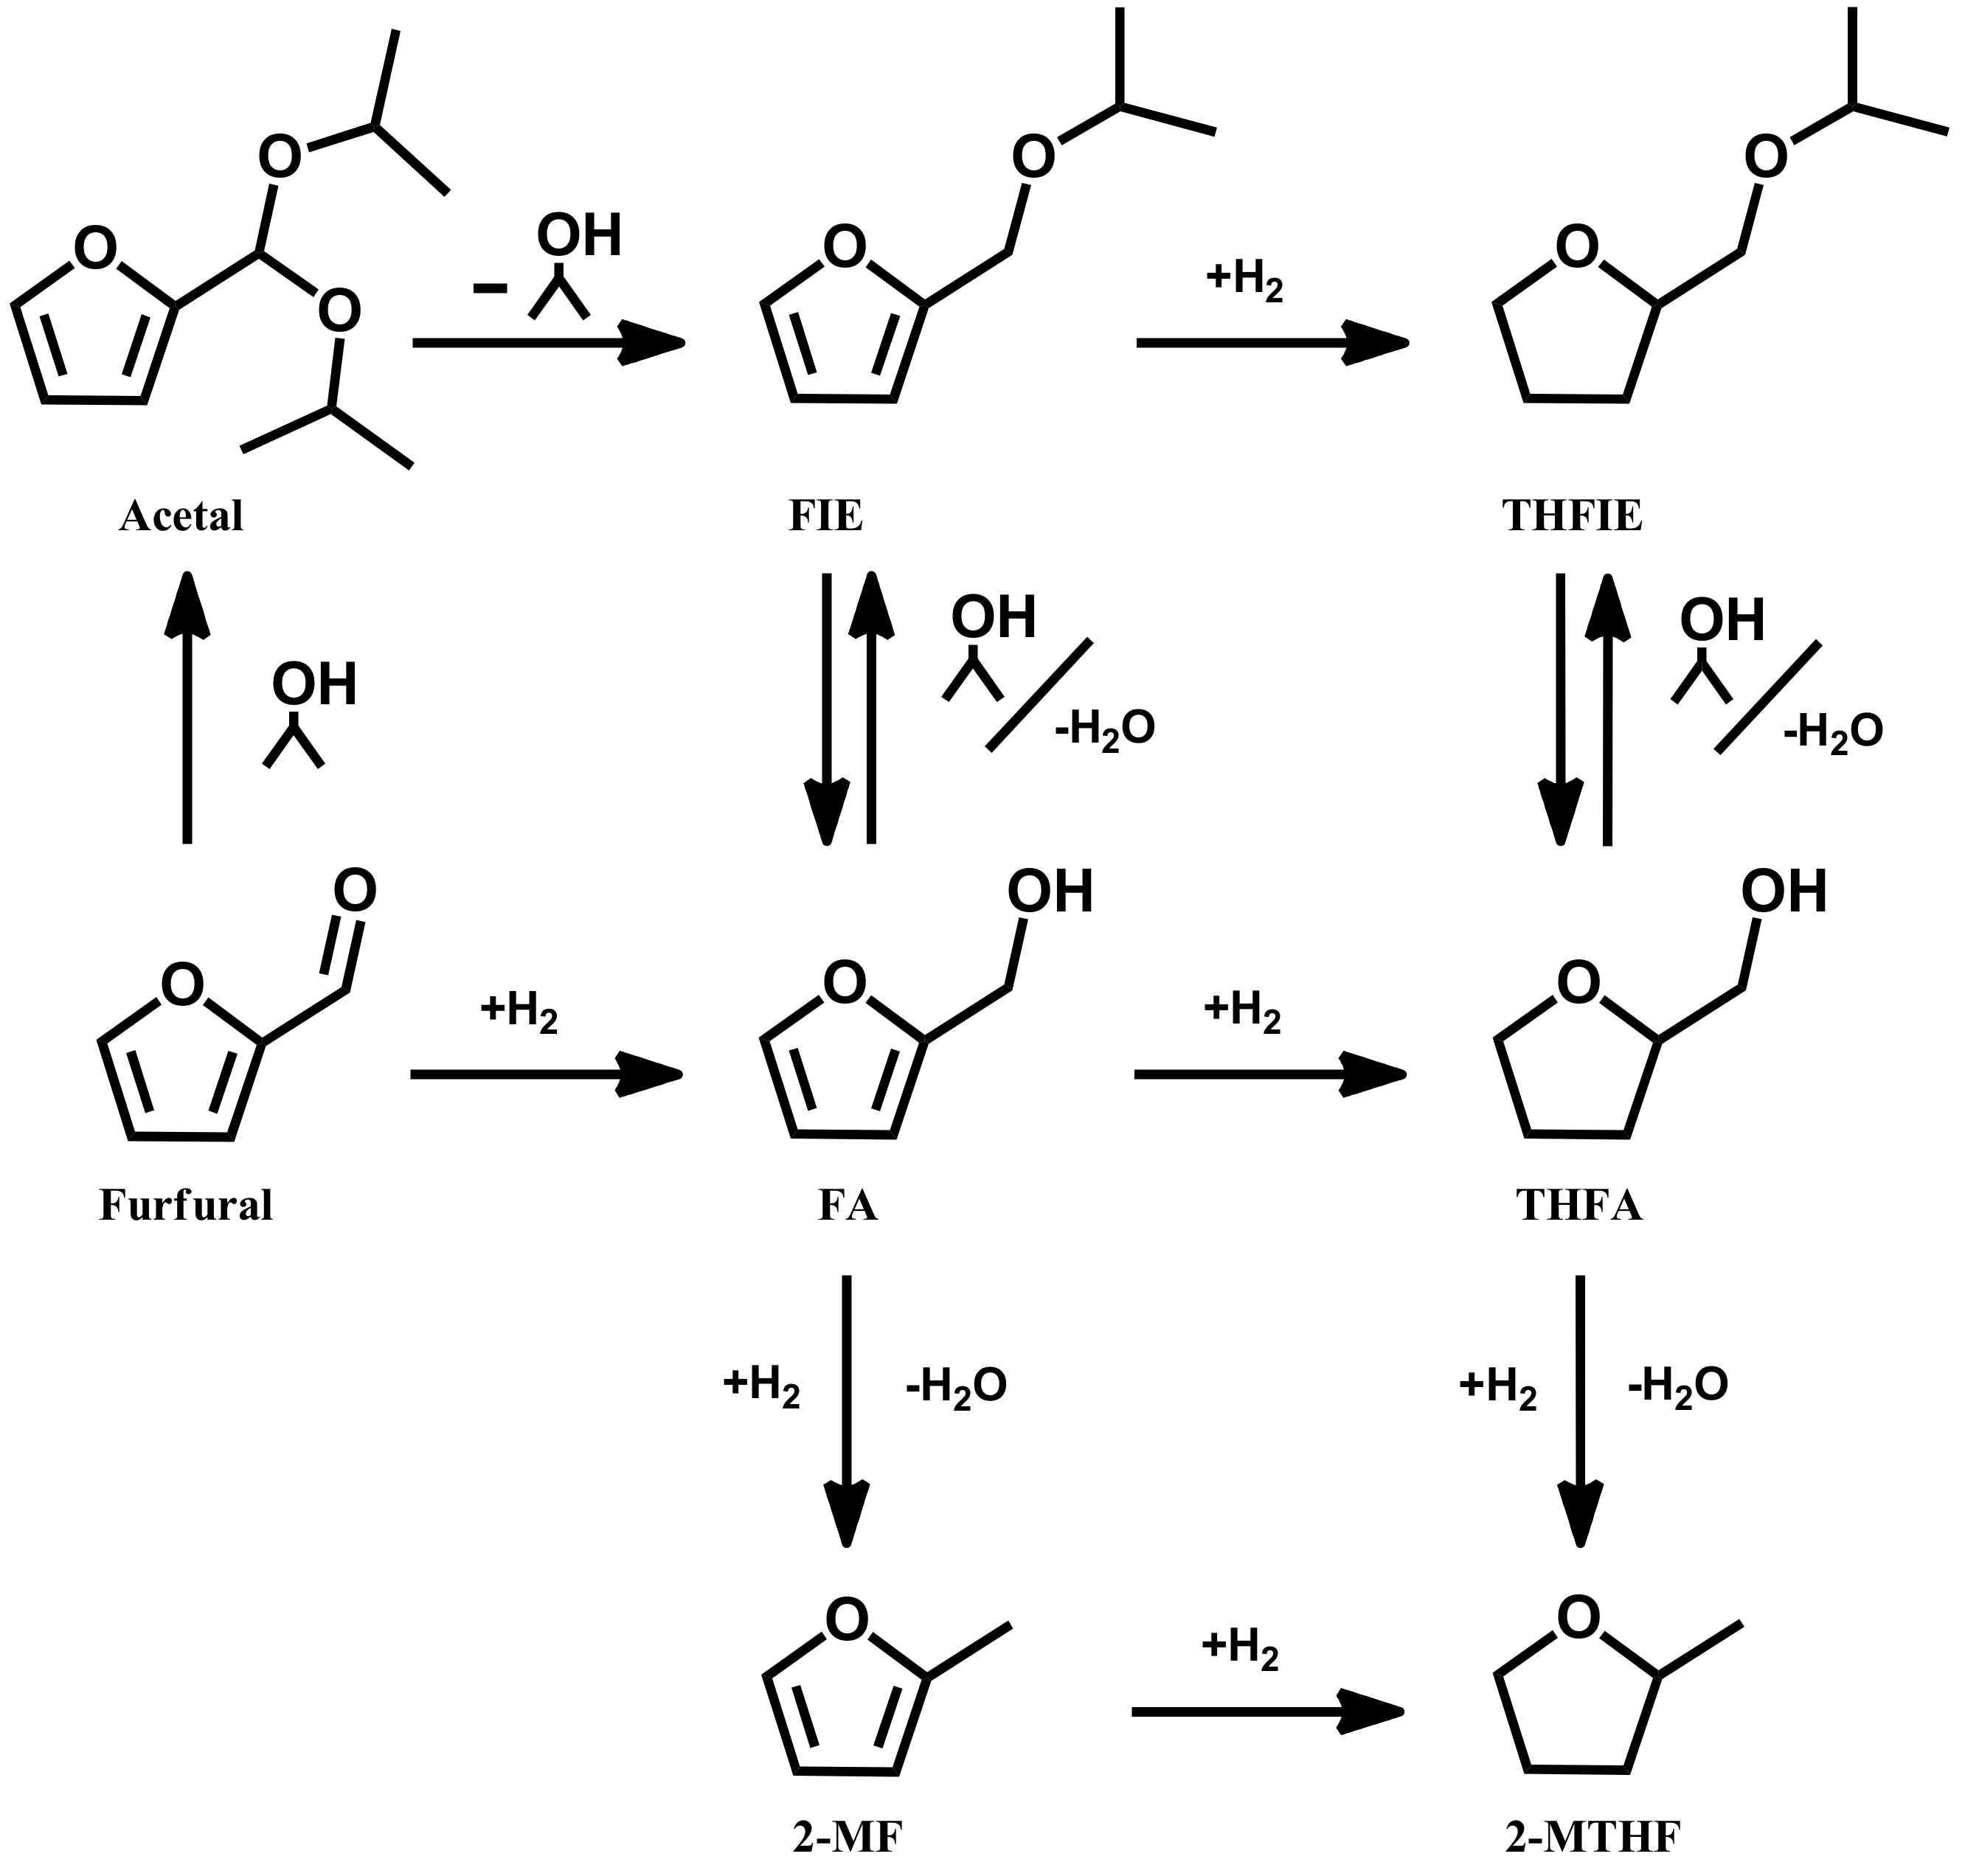
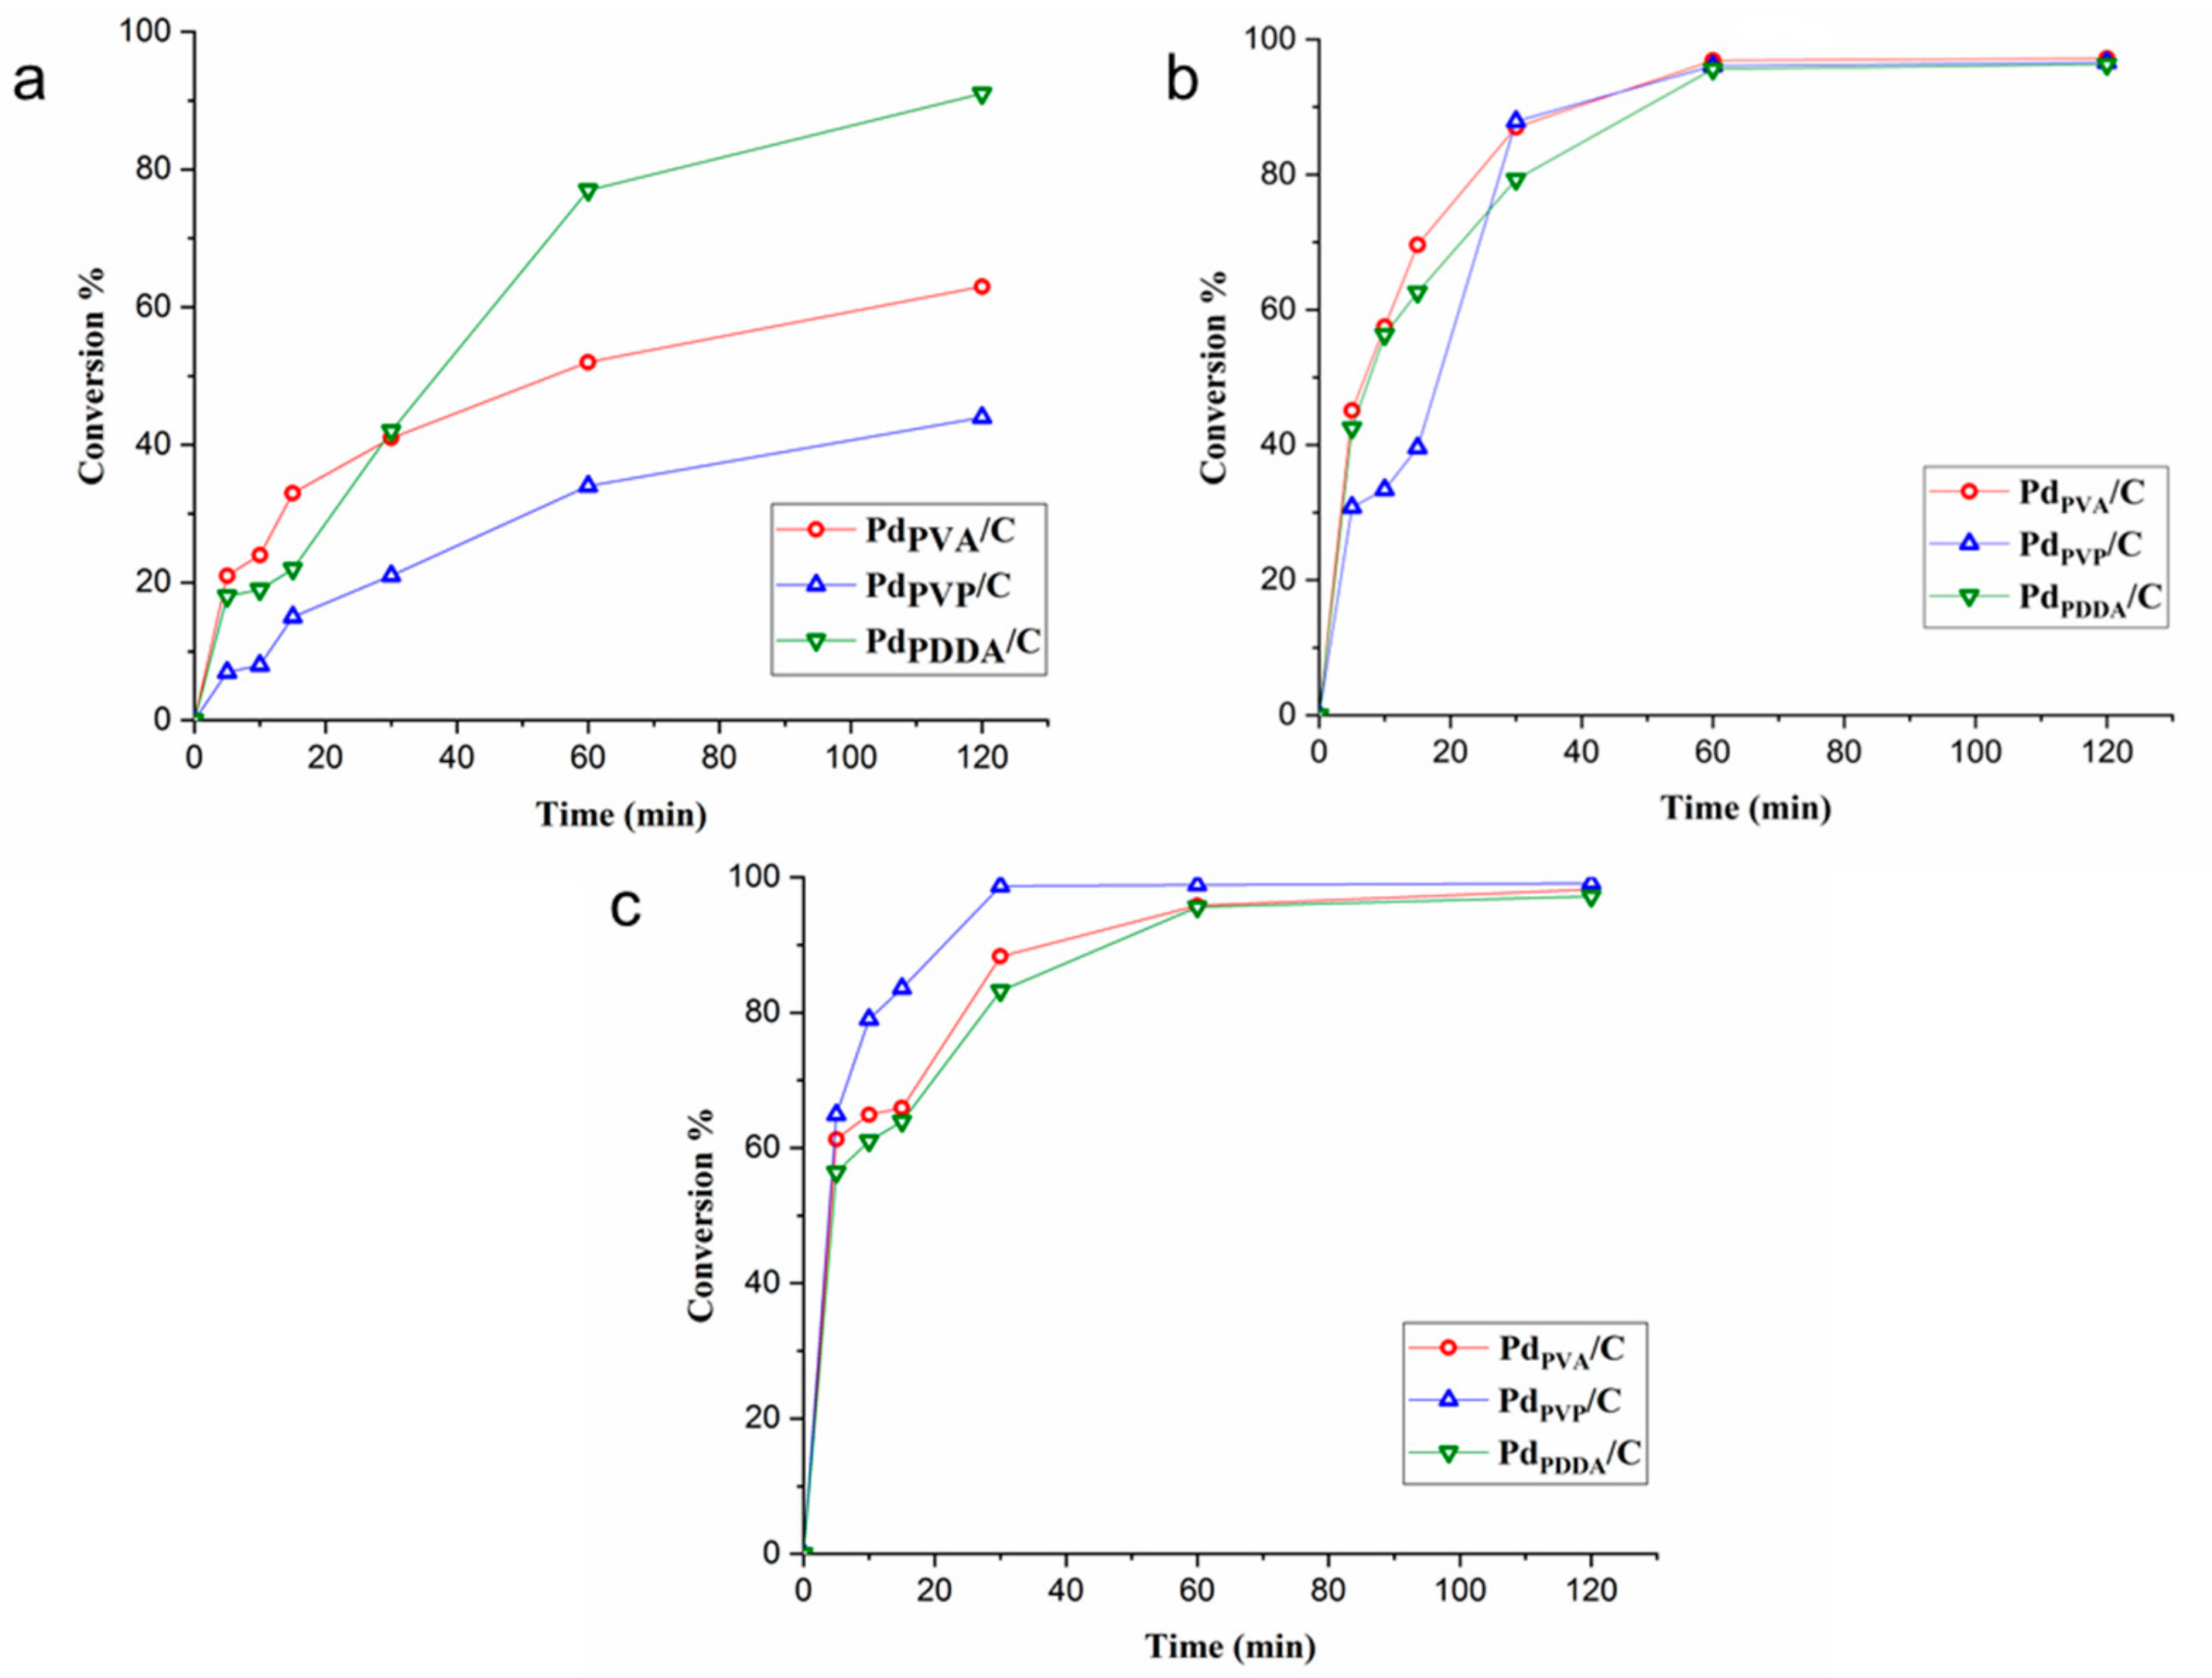
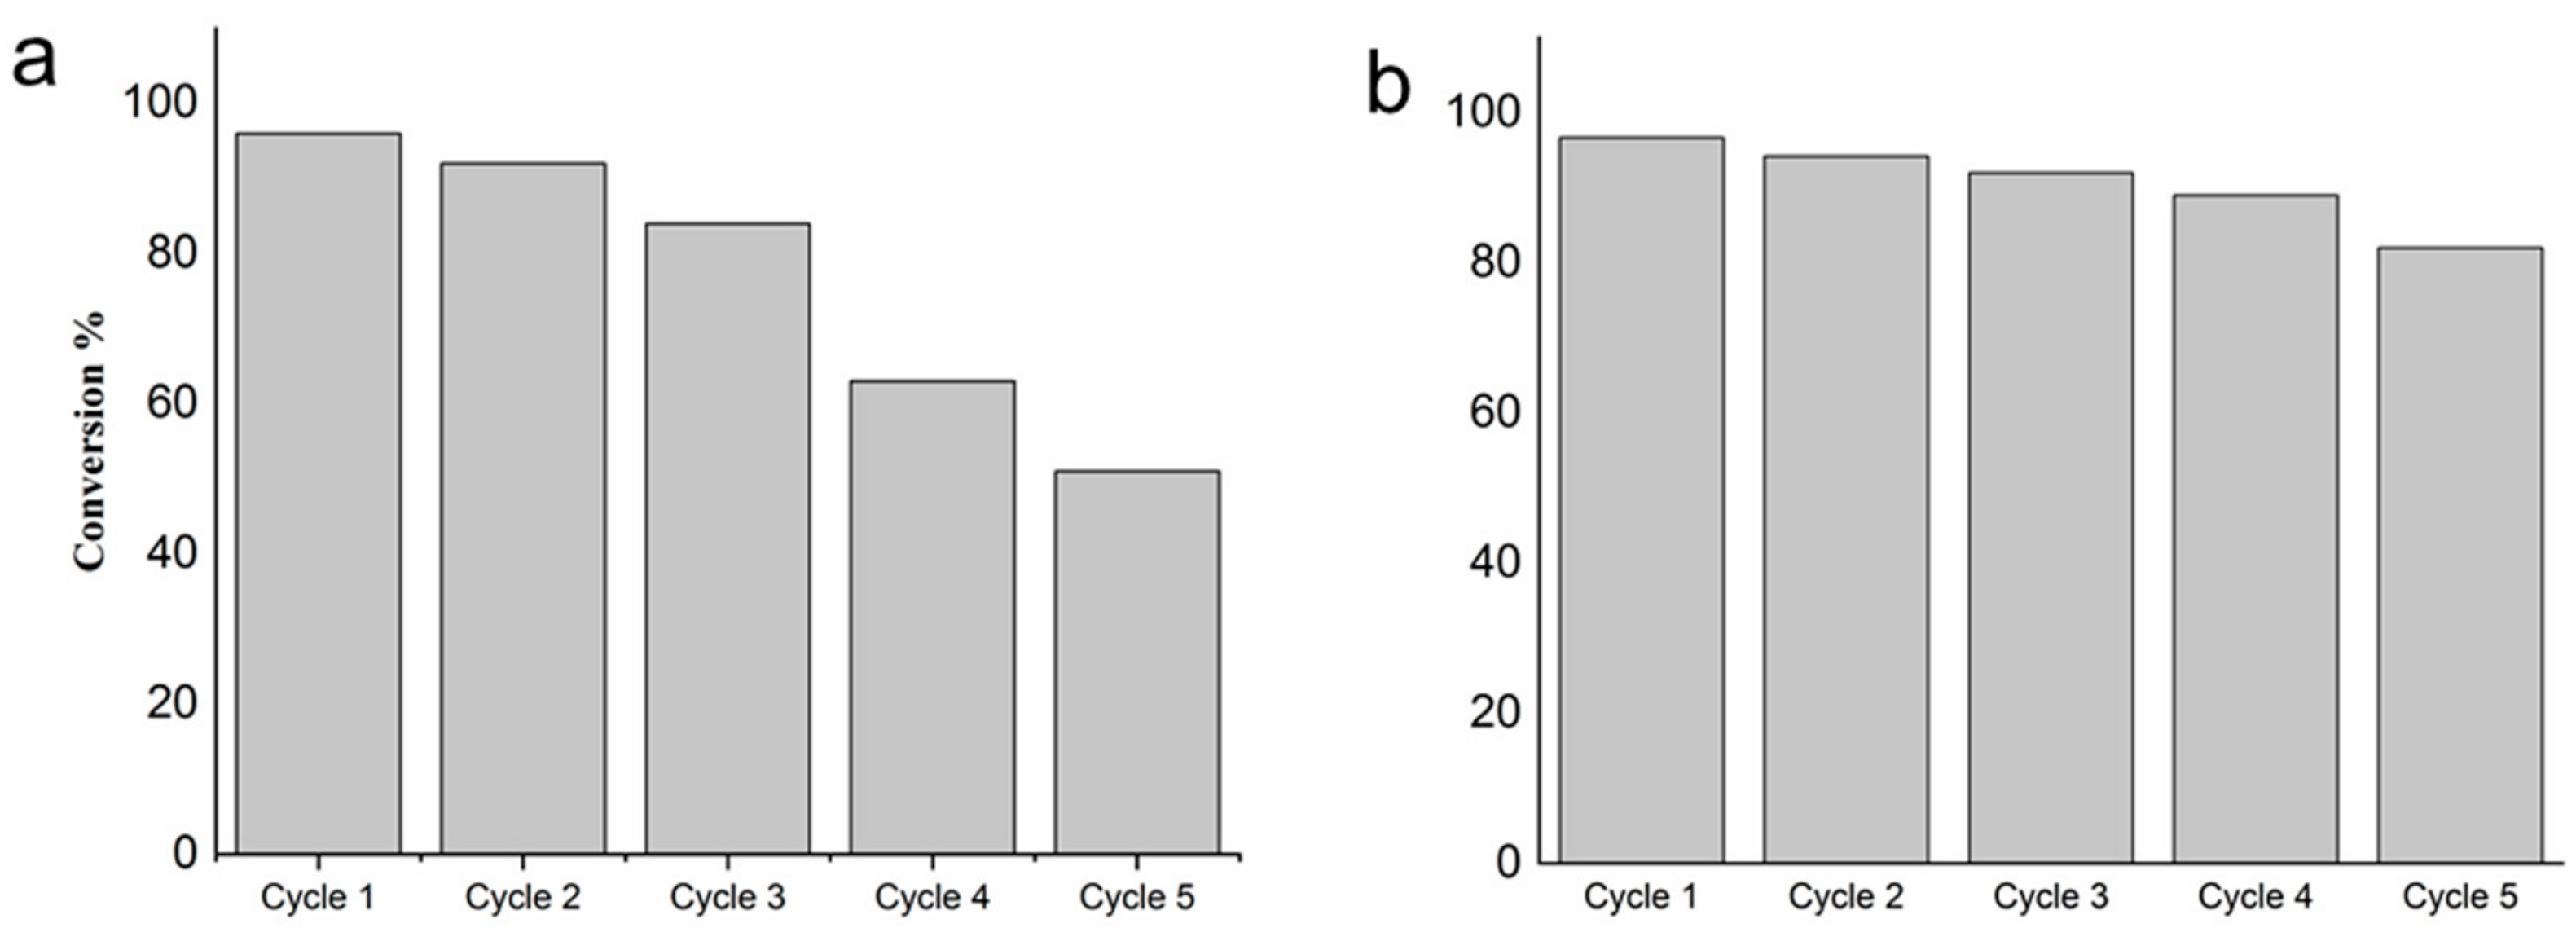
2.5. Catalytic Results

The performance of the prepared catalysts was evaluated for the liquid-phase hydrogenation of furfural (furfural 0.3 M; furfural/metal ratio 500 mol/mol, 5 bar of H2, in the temperature range 25–75 °C), with 2-propanol as the solvent. As illustrated in Figure 1, the reaction route map is a cascade of reactions that forms various products such as FA, THFA, 2-MF, 2-MTHF, and ethers.
Hydrogenation of the carbonyl group (C=O) in furfural yields FA. The formation of THFA, on the other hand, requires the unselective hydrogenation of the furan double bonds along with the hydrogenation of the carbonyl group. Moreover, hydrogenolysis via ring activation is a primary pathway in the C−OH bond cleavage for the conversion of FA to 2-MF. By using alcohols as the solvent, several other byproducts can be formed, such as acetals [43] and ethers [44,45,46].
When the reaction was performed at 25 °C and 50 °C, PdPVA/C showed the highest initial activity (calculated after 5 min as 824 h−1 and 1775 h−1 at 25 °C and 50 °C, respectively), higher than PdPDDA (624 h−1 and 1422 h−1 at 25 °C and 50 °C, respectively) and PdPVP/C (304 h−1 and 573 h−1 at 25 °C and 50 °C, respectively) (Table 4). At 75 °C all the catalysts were very active; it is not possible to precisely calculate the initial activity (conversion >55% after 5 min in all cases). We can exclude any effect of the size of Pd nanoparticles on the activity since all the catalysts had a similar particle size (3–4 nm, Table 4). However, it is possible to correlate the activity to the relative amount of Pd at the surface (Table 2 and Table 4): PdPVA/C (1.3%) > PdPDDA/C (0.76%) > PdPVP/C (0.50%). Therefore, the initial activity can be affected by using different capping agents as they can change the available Pd surface sites regardless of any particle size effect. Indeed, as already reported in the literature, the N groups present in PVP blocks the Pd active sites more than in PDDA, whereas the oxygen groups in PVA interact weakly with the Pd surface [38]. By plotting the conversion versus time of reaction (Figure 8), it is possible to observe an induction time in the first 15 min of the reaction, for all the tested catalysts, in particular for the reaction performed at 25 °C. It is worth noting that at 25 °C the activity of PdPDDA/C increased after 1 h, becoming the most active catalyst, whereas PdPVA/C and PdPVP/C showed a similar reaction profile. This behavior can be attributed to the easier removal of PDDA from Pd active sites during the reaction, and the reduction of the superficial oxidized Pd (Table 2). At 75 °C the catalysts show similar reactivity. We ascribed both effects to the partial removal of a capping agent during the reaction, thereby exposing a higher amount of active sites to the reactant [47].
Comparing the selectivity at low temperature (25 °C and 50 °C), PdPVP/C exhibits better selectivity towards furfuryl alcohol (64% and 56.7% at 25 °C and 50 °C, respectively) compared to the other catalysts (45.2% and 49.6% at 25 °C and 50 °C, respectively, for PdPVA/C and 52.8% and 49.0% at 25 °C and 50 °C, respectively, for PdPDDA/C) (Table 4). We already reported that the presence of a higher amount of protective agent can enhance the selectivity to furfuryl alcohol, directing the geometry of the adsorption of the furfural on the surface of the catalyst [21,48]. The evolution of the selectivity with the time on stream for the reaction performed at 25 °C is reported in Figure S2. For all catalysts, with a low reaction time, the main product is the acetal. When increasing the conversion rate, the production of acetal decreases, with the formation of furfuryl alcohol as the main product and furfuryl ether. According to the literature, Pd/C can catalyze the formation of ether even in the absence of an acid support [44]. Indeed, the Pd hydride can catalyze the formation of acetal, followed by hydrogenolysis to form the corresponding ether. Figure S2 shows the initial formation of acetals, which are converted to ether at a higher conversion rate, confirming the proposed mechanism. At 75 °C the selectivity is similar due to the removal of the protective agent.
The stability of the most active catalyst (PdPVA/C) has been studied. Five successive reactions were conducted by simply filtering the catalyst and reusing it either without any treatment or by washing with acetone. As shown in Figure 9a, the conversion starts to decrease immediately after the first run. Washing with acetone was performed to prove if the deactivation is caused by the irreversible adsorption of the products. Pretreating the catalyst after each run, the catalyst maintained almost the same activity and selectivity (Figure 9b), confirming our assumption.
We performed XPS of the used catalysts (Table 1, Figures S4–S6). The catalyst used without any treatment showed a high O/C ratio (1.10) (10 times higher than in the fresh one (0.10)), and a low surface Pd content (0.32 and 1.30 at % for the used and fresh PdPVA/C, respectively; see Table 1), attributed to the adsorption of furfural and the hydrogenation products (Table 1). After washing, the O/C ratio decreased to 0.22, and Pd exposure increased from 0.32 to 0.93 at %, confirming the partial removal of the adsorbed species. The Pd3d spectrum of the used PdPVA/C catalyst shows that a reduction of Pdδ+ to Pd0 occurred during the reaction (Pd0 of 30.9% to 72.7% before and after reaction) (Table 2). This result can also explain why the catalysts become more active after 15 min of reaction. The slight deactivation observed in the recycling tests performed after washing the catalyst after each run can be attributed to the formation of palladium carbide, as already demonstrated by Rogers et al. [21].

3. Materials and Methods
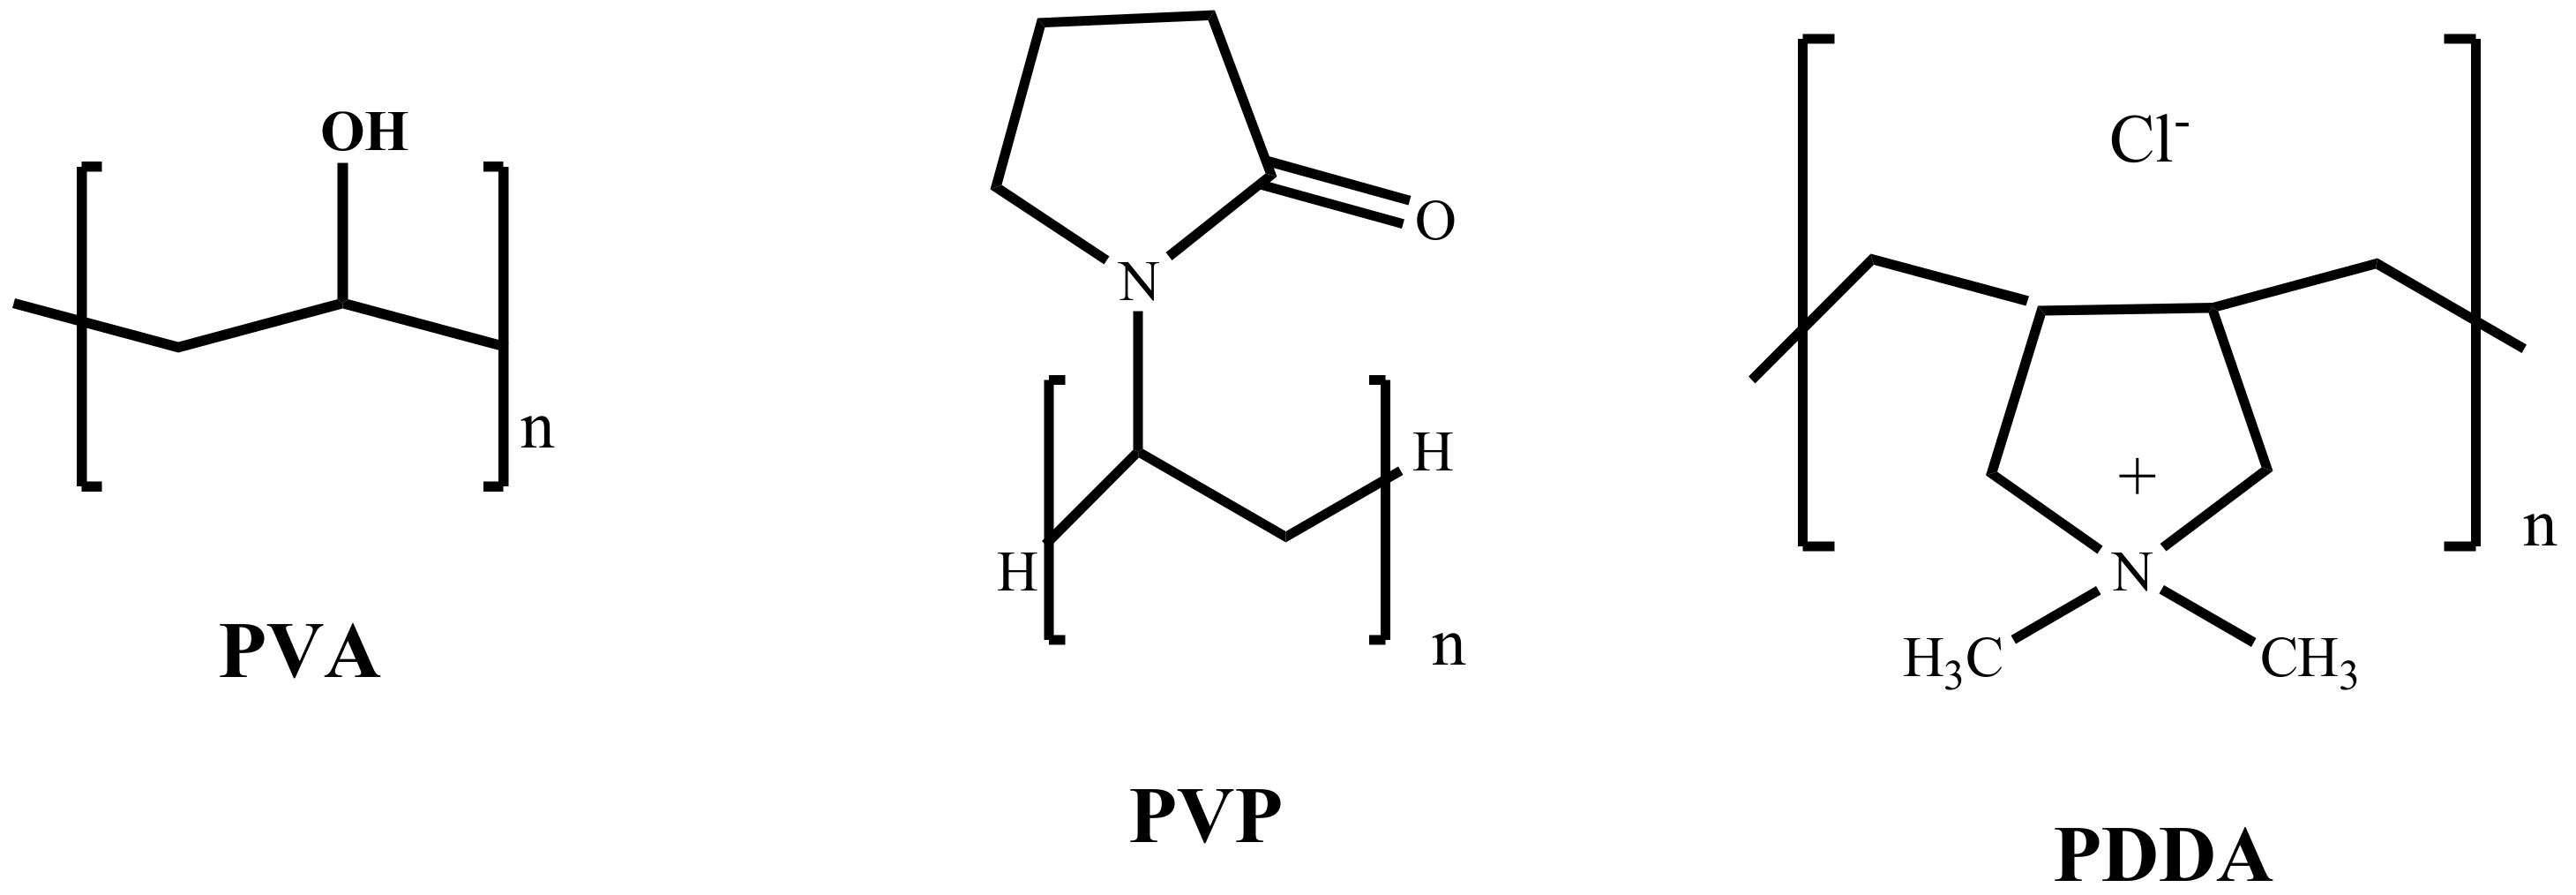
3.1. Materials

Sodium tetrachloropalladate (II) (99.99%, Sigma-Aldrich, St. Louis, MO, USA), sodium borohydride (99.99%, Sigma-Aldrich, St. Louis, MO, USA), poly(vinyl alcohol) (average molar weight 10,000, 87–89% hydrolyzed, Sigma-Aldrich, St. Louis, MO, USA), polyvinylpyrrolidone (average molar weight 10,000, Sigma-Aldrich, St. Louis, MO, USA), poly (diallyldimethylamonium chloride, Sigma-Aldrich, St. Louis, MO, USA) (20 wt % in water), and activated carbon (Camel (X40S)) were used without any pretreatment for the catalyst synthesis All the catalytic tests were carried out using furfural (99 %, Sigma-Aldrich) and 2-propanol (99.8%, Sigma-Aldrich, St. Louis, MO, USA) as the substrate and the solvent, respectively. Furfuryl alcohol (98%, Sigma-Aldrich, St. Louis, MO, USA), tetrahydrofurfuryl alcohol (99%, Sigma-Aldrich, St. Louis, MO, USA), methyl furan (99%, Sigma-Aldrich, St. Louis, MO, USA), and 2-Methyltetrahydrofuran (>99%, Sigma-Aldrich, St. Louis, MO, USA ) were used as standards. Isopropyl-furfuryl ether and isopropyl-tetrahydrofurfuryl ether were obtained by reacting isopropanol with furfuryl alcohol and tetrahydrofurfuryl alcohol, respectively, using ZSM5 as a catalyst at 150 °C and as a standard.

3.2. Catalysts Preparation

Supported Pd nanoparticles were synthesized by the sol-immobilization method [27]. Two aqueous solutions, one containing the metal precursor (Na2PdCl4, 1 mL of a 1.26 × 10⁻⁴ mol L−1 solution) and one containing the desired capping agent (1 mL of a 1 wt % solution, capping agents/Pd (w/w) = 1), were added to 100 mL of deionized water. The third solution of NaBH4 (3.7 mL of a 0.1 mol L−1 solution; NaBH4/Pd (mol/mol) = 8) was then added to the yellow-brown solution under stirring. After the reduction of Pd species (30 min), the colloidal solution was immobilized on activated carbon (Camel X40S; Surface Area = 1200 m2g−1) under vigorous stirring. The amount of support material required was calculated to give a final metal loading of 1 wt %. The suspension was acidified to pH 2 by sulfuric acid before being stirred for 60 min to accomplish full immobilization of the metal NPs onto the support [49]. The slurry was filtered, washed completely with distilled water, and dried at 80 °C for 2 h.

3.3. Catalytic Tests

The liquid phase hydrogenation of furfural was carried out in a stainless-steel autoclave equipped with a heater and a magnetic stirrer. For a typical experiment, 0.063 g of catalyst (1:500 metal/substrate) was loaded in the reactor and tested at 5 bar of H2 and different temperatures (25 °C, 50 °C, and 75 °C) for 2 h. Before starting the reaction, the reactor was charged with 10 mL of 0.3 M furfural solution using 2-propanol as the solvent; the reactor was then purged with nitrogen and finally charged at 5 bar of H2. The reactor was heated to the desired temperature and the reaction commenced as soon as the stirring speed was 1000 rpm. Samples were collected at regular intervals for gas chromatography analysis (Agilent 6890, equipped with a Zebron ZB5 60 m x 0.32 mm x 1 μm column and a FID detector, Agilent, Santa Clara, CA, USA). Response factors were determined using a known concentration of standard solutions of the pure compounds. To identify unknown products, gas chromatography–mass spectrometry (GC-MS) was used (Thermo Scientific ISQ QD, equipped with an Agilent VF-5ms column, 60 m × 0.32 mm I.D × 1 µm film thickness, Thermo Scientific, Waltham, MA, USA).

3.4. Characterization

The ultraviolet-visible (UV-Vis) absorption spectra of capping agents and the corresponding Pd sols were collected using a UV-Vis spectrophotometer (Shimadzu UV3600, Kyoto, Japan) with quartz cuvettes with 1 cm optical path length, in the wavelength range 150–600 nm.
The FTIR spectra of catalysts were recorded with a JASCO spectrometer (Jasco FT/IR-4100; Jasco Corporation, Tokyo, Japan) in the range of 4000–400 cm−1. For the measurements, 1 mL of a solution of capping agent (1 wt %) was mixed thoroughly with 1 mL of a metal precursor solution (10 mg Pd mL−1); 0.15 g of KBr were then added, and the solution was mixed until all the solid was completely dissolved. The obtained solution was dried in a rotary evaporator and the resulting solid was crushed in a mortar and pressed to obtain a thin film.
The morphological characteristics of the samples were determined using a high-resolution transmission electron microscope (LIBRA 200FE Zeiss at 200 kV equipped with a high-angle annular dark-field detector (HAADF), Zeiss, Oberkochen, Germany). The samples were suspended in isopropanol and sonicated; afterwards, each suspension was dropped onto a carbon-coated copper grid (300 mesh), and the solvent was evaporated. Particle size distribution curves were obtained by counting onto the micrographs at least 300 particles.
X-ray photoelectron spectra (XPS) were acquired in an M-probe apparatus (Surface Science Instruments, Warrington, UK) equipped with an atmospheric reaction chamber. The XPS lines of Pd 3d, O 1s, and C 1s were recorded by applying a Al Kα characteristic X-ray line and (hv = 1486.6 eV) pass energy.
The metal content was checked by atomic absorption spectroscopy (AAS) analysis of the filtrate on a Perkin Elmer 3100 instrument (Perkin Elmer, Waltham, MA, USA). After the catalyst filtration, a 10 mL sample of the filtered solution was collected and analyzed

4. Conclusions

A sol-immobilization methodology was utilized for preparing a series of catalysts with different capping agents (PVA, PVP, and PDDA), using carbon as the support (Camel X40s). UV-Vis and FTIR analyses were applied for studying the interaction between the Pd precursor and the capping agents, and XPS and HRTEM techniques were used to identify the metal surface exposure and particle size/distribution, respectively.
The results showed differences in the relative amount of Pd at the surface of catalysts. Moreover, the use of different capping agents affected the initial activity of the catalysts (PdPVA/C > PdPDDA/C > PdPVP/C), depending on the Pd exposure on the catalyst surface. However, in terms of particle size and distribution, the capping agents were not as effective as expected, since all the catalysts revealed a roughly similar range of particle size and distribution when using carbon as the support. We also found that the use of different capping agents affects the product distribution at low temperatures (25 °C and 50 °C).

Supplementary Materials

The following are available online at https://www.mdpi.com/2073-4344/10/1/11/s1, Figure S1: UV−vis spectra of (a) Pd/PVA sols in H2O, (b) Pd/PVP sols in H2O, and Pd/PDDA sols in H2O, Figure S2: Selectivity vs. time of reaction (a) PdPVA/C (b) PdPVP/C, and PdPDDA/C at 25 °C, Figure S3: GC-MS results of the furfuryl isopropyl ether, tetrahydrofurfuryl isopropyl ether and 2-(diisopropoxymethyl)furan, Figure S4: Fitting of XPS envelopes of (a) PdPVA/C used and (b) PdPVA/C, used and washed for Pd 3d, Figure S5: Fitting of XPS envelopes of (a) PdPVA/C used and (b) PdPVA/C, used and washed for C1s, Figure S6: Fitting of XPS envelopes of (a) PdPVA/C used and (b) PdPVA/C, used and washed for O1s.

Author Contributions

S.A. carried out the catalytic evaluation and wrote the article; S.C. (Sofia Capelli) carried out the XPS experiments and helped with the interpretation; C.E. carried out the TEM and helped with the interpretation; S.C. (Stefano Cattaneo) prepared the catalysts; K.M.H.M. carried out the UV and IR experiments; M.S. carried out the GC analysis and helped with the interpretation; A.V., F.T., and P.P.W. were involved in writing and editing the manuscript. All authors have read and agreed to the published version of the manuscript.

Funding

This research received no external funding.

Conflicts of Interest

The authors declare no conflict of interest.

References

  1. Gielen, D.; Boshell, F.; Saygin, D.; Bazilian, M.D.; Wagner, N.; Gorini, R. The role of renewable energy in the global energy transformation. Energy Strategy Rev. 2019, 24, 38–50. [Google Scholar] [CrossRef]
  2. Lanzafame, P.; Centi, G.; Perathoner, S. Catalysis for biomass and CO2 use through solar energy: Opening new scenarios for a sustainable and low-carbon chemical production. Chem. Soc. Rev. 2014, 43, 7562–7580. [Google Scholar] [CrossRef]
  3. Chen, S.; Wojcieszak, R.; Dumeignil, F.; Marceau, E.; Royer, S. How Catalysts and Experimental Conditions Determine the Selective Hydroconversion of Furfural and 5-Hydroxymethylfurfural. Chem. Rev. 2018, 118, 11023–11117. [Google Scholar] [CrossRef] [Green Version]
  4. Ramirez-Barria, C.; Isaacs, M.; Wilson, K.; Guerrero-Ruiz, A.; Rodríguez-Ramos, I. Optimization of ruthenium based catalysts for the aqueous phase hydrogenation of furfural to furfuryl alcohol. Appl. Catal. A Gen. 2018, 563, 177–184. [Google Scholar] [CrossRef] [Green Version]
  5. Taylor, M.J.; Durndell, L.J.; Isaacs, M.A.; Parlett, C.M.A.; Wilson, K.; Lee, A.F.; Kyriakou, G. Highly selective hydrogenation of furfural over supported Pt nanoparticles under mild conditions. Appl. Catal. B Environ. 2016, 180, 580–585. [Google Scholar] [CrossRef]
  6. Aldosari, O.F.; Iqbal, S.; Miedziak, P.J.; Brett, G.L.; Jones, D.R.; Liu, X.; Edwards, J.K.; Morgan, D.J.; Knight, D.K.; Hutchings, G.J. Pd-Ru/TiO2 catalyst—An active and selective catalyst for furfural hydrogenation. Catal. Sci. Technol. 2016, 6, 234–242. [Google Scholar] [CrossRef] [Green Version]
  7. Mariscal, R.; Maireles-Torres, P.; Ojeda, M.; Sádaba, I.; López Granados, M. Furfural: A renewable and versatile platform molecule for the synthesis of chemicals and fuels. Energy Environ. Sci. 2016, 9, 1144–1189. [Google Scholar] [CrossRef]
  8. Liu, L.; Lou, H.; Chen, M. Selective hydrogenation of furfural over Pt based and Pd based bimetallic catalysts supported on modified multiwalled carbon nanotubes (MWNT). Appl. Catal. A Gen. 2018, 550, 1–10. [Google Scholar] [CrossRef]
  9. Gilkey, M.J.; Panagiotopoulou, P.; Mironenko, A.V.; Jenness, G.R.; Vlachos, D.G.; Xu, B. Mechanistic Insights into Metal Lewis Acid-Mediated Catalytic Transfer Hydrogenation of Furfural to 2-Methylfuran. ACS Catal. 2015, 5, 3988–3994. [Google Scholar] [CrossRef]
  10. O’Driscoll, A.; Leahy, J.J.; Curtin, T. The influence of metal selection on catalyst activity for the liquid phase hydrogenation of furfural to furfuryl alcohol. Catal. Today 2017, 279, 194–201. [Google Scholar] [CrossRef]
  11. Gupta, K.; Rai, R.K.; Singh, S.K. Metal Catalysts for the Efficient Transformation of Biomass-derived HMF and Furfural to Value Added Chemicals. ChemCatChem 2018, 10, 2326–2349. [Google Scholar] [CrossRef]
  12. Li, X.; Jia, P.; Wang, T. Furfural: A Promising Platform Compound for Sustainable Production of C4 and C5 Chemicals. ACS Catal. 2016, 6, 7621–7640. [Google Scholar] [CrossRef]
  13. Giorgianni, G.; Abate, S.; Centi, G.; Perathoner, S.; Van Beuzekom, S.; Soo-Tang, S.H.; Van Der Waal, J.C. Effect of the Solvent in Enhancing the Selectivity to Furan Derivatives in the Catalytic Hydrogenation of Furfural. ACS Sustain. Chem. Eng. 2018, 6, 16235–16247. [Google Scholar]
  14. Bhogeswararao, S.; Srinivas, D. Catalytic conversion of furfural to industrial chemicals over supported Pt and Pd catalysts. J. Catal. 2015, 327, 65–77. [Google Scholar] [CrossRef]
  15. Wang, W.; Villa, A.; Kübel, C.; Hahn, H.; Wang, D. Tailoring the 3D Structure of Pd Nanocatalysts Supported on Mesoporous Carbon for Furfural Hydrogenation. ChemNanoMat 2018, 4, 1125–1132. [Google Scholar] [CrossRef]
  16. Wang, C.; Guo, Z.; Yang, Y.; Chang, J.; Borgna, A. Hydrogenation of furfural as model reaction of bio-oil stabilization under mild conditions using multiwalled carbon nanotube (MWNT)-supported pt catalysts. Ind. Eng. Chem. Res. 2014, 53, 11284–11291. [Google Scholar] [CrossRef]
  17. Meng, X.; Yang, Y.; Chen, L.; Xu, M.; Zhang, X.; Wei, M. A Control over Hydrogenation Selectivity of Furfural via Tuning Exposed Facet of Ni Catalysts. ACS Catal. 2019, 9, 4226–4235. [Google Scholar] [CrossRef]
  18. Zhou, X.; Feng, Z.; Guo, W.; Liu, J.; Li, R.; Chen, R.; Huang, J. Hydrogenation and Hydrolysis of Furfural to Furfuryl Alcohol, Cyclopentanone, and Cyclopentanol with a Heterogeneous Copper Catalyst in Water. Ind. Eng. Chem. Res. 2019, 58, 3988–3993. [Google Scholar] [CrossRef]
  19. Liu, F.; Liu, Q.; Xu, J.; Li, L.; Cui, Y.T.; Lang, R.; Li, L.; Su, Y.; Miao, S.; Sun, H.; et al. Catalytic cascade conversion of furfural to 1,4-pentanediol in a single reactor. Green Chem. 2018, 20, 1770–1776. [Google Scholar] [CrossRef]
  20. Lam, E.; Luong, J.H.T. Carbon materials as catalyst supports and catalysts in the transformation of biomass to fuels and chemicals. ACS Catal. 2014, 4, 3393–3410. [Google Scholar] [CrossRef]
  21. Rogers, S.M.; Catlow, C.R.A.; Chan-Thaw, C.E.; Chutia, A.; Jian, N.; Palmer, R.E.; Perdjon, M.; Thetford, A.; Dimitratos, N.; Villa, A.; et al. Tandem Site- and Size-Controlled Pd Nanoparticles for the Directed Hydrogenation of Furfural. ACS Catal. 2017, 7, 2266–2274. [Google Scholar] [CrossRef]
  22. Huang, R.; Cui, Q.; Yuan, Q.; Wu, H.; Guan, Y.; Wu, P. Total Hydrogenation of Furfural over Pd/Al2O3 and Ru/ZrO2 Mixture under Mild Conditions: Essential Role of Tetrahydrofurfural as an Intermediate and Support Effect. ACS Sustain. Chem. Eng. 2018, 6, 6957–6964. [Google Scholar] [CrossRef]
  23. Campisi, S.; Schiavoni, M.; Chan-Thaw, C.E.; Villa, A. Untangling the role of the capping agent in nanocatalysis: Recent advances and perspectives. Catalysts 2016, 6, 185. [Google Scholar] [CrossRef] [Green Version]
  24. Abedini, A.; Bakar, A.A.A.; Larki, F.; Menon, P.S.; Islam, M.S.; Shaari, S. Recent Advances in Shape-Controlled Synthesis of Noble Metal Nanoparticles by Radiolysis Route. Nanoscale Res. Lett. 2016, 11, 1–13. [Google Scholar] [CrossRef] [PubMed] [Green Version]
  25. Niu, Z.; Li, Y. Removal and utilization of capping agents in nanocatalysis. Chem. Mater. 2014, 26, 72–83. [Google Scholar] [CrossRef]
  26. Pang, S.H.; Schoenbaum, C.A.; Schwartz, D.K.; Will Medlin, J. Effects of thiol modifiers on the kinetics of furfural hydrogenation over Pd catalysts. ACS Catal. 2014, 4, 3123–3131. [Google Scholar] [CrossRef]
  27. Campisi, S.; Ferri, D.; Villa, A.; Wang, W.; Wang, D.; Kröcher, O.; Prati, L. Selectivity Control in Palladium-Catalyzed Alcohol Oxidation through Selective Blocking of Active Sites. J. Phys. Chem. C 2016, 120, 14027–14033. [Google Scholar] [CrossRef]
  28. Rogers, S.M.; Catlow, C.R.A.; Chan-Thaw, C.E.; Gianolio, D.; Gibson, E.K.; Gould, A.L.; Jian, N.; Logsdail, A.J.; Palmer, R.E.; Prati, L.; et al. Tailoring Gold Nanoparticle Characteristics and the Impact on Aqueous-Phase Oxidation of Glycerol. ACS Catal. 2015, 5, 4377–4384. [Google Scholar] [CrossRef]
  29. Zhao, Y.; Liang, W.; Li, Y.; Lefferts, L. Effect of chlorine on performance of Pd catalysts prepared via colloidal immobilization. Catal. Today 2017, 297, 308–315. [Google Scholar] [CrossRef]
  30. Chowdhury, S.R.; Roy, P.S.; Bhattacharya, S.K. Room temperature synthesis of polyvinyl alcohol stabilized palladium nanoparticles: Solvent effect on shape and electro-catalytic activity. Nano-Struct. Nano-Objects 2018, 14, 11–18. [Google Scholar] [CrossRef]
  31. Eisa, W.H.; Shabaka, A.A. Ag seeds mediated growth of Au nanoparticles within PVA matrix: An eco-friendly catalyst for degradation of 4-nitrophenol. React. Funct. Polym. 2013, 73, 1510–1516. [Google Scholar] [CrossRef]
  32. Liu, J.; Ruffini, N.; Pollet, P.; Llopis-Mestre, V.; Dilek, C.; Eckert, C.A.; Liotta, C.L.; Roberts, C.B. More benign synthesis of palladium nanoparticles in dimethyl sulfoxide and their extraction into an organic phase. Ind. Eng. Chem. Res. 2010, 49, 8174–8179. [Google Scholar] [CrossRef]
  33. Tang, H.; Pan, M.; Jiang, S.; Wan, Z.; Yuan, R. Self-assembling multi-layer Pd nanoparticles onto NafionTM membrane to reduce methanol crossover. Colloids Surfaces A Physicochem. Eng. Asp. 2005, 262, 65–70. [Google Scholar] [CrossRef]
  34. Hassan, C.M.; Peppas, N.A. Structure and applications of poly (vinyl alcohol) hydrogels produced by conventional crosslinking or by freezing/thawing methods. Adv. Polym. Sci. 2000, 153, 37–65. [Google Scholar]
  35. Luo, L.B.; Yu, S.H.; Qian, H.S.; Zhou, T. Large-scale fabrication of flexible silver/cross-linked poly (vinyl alcohol) coaxial nanocables by a facile solution approach. J. Am. Chem. Soc. 2005, 127, 2822–2823. [Google Scholar] [CrossRef] [PubMed]
  36. Koczkur, K.M.; Mourdikoudis, S.; Polavarapu, L.; Skrabalak, S.E. Polyvinylpyrrolidone (PVP) in nanoparticle synthesis. Dalton Trans. 2015, 44, 17883–17905. [Google Scholar] [CrossRef] [Green Version]
  37. Song, Y.J.; Wang, M.; Zhang, X.Y.; Wu, J.Y.; Zhang, T. Investigation on the role of the molecular weight of polyvinyl pyrrolidone in the shape control of high yield silver nanospheres and nanowires. Nanoscale Res. Lett. 2014, 9, 17. [Google Scholar] [CrossRef] [Green Version]
  38. Chan-Thaw, C.E.; Villa, A.; Veith, G.M.; Prati, L. Identifying the Role of N-Heteroatom Location in the Activity of Metal Catalysts for Alcohol Oxidation. ChemCatChem 2015, 7, 1338–1346. [Google Scholar] [CrossRef]
  39. Xian, J.; Hua, Q.; Jiang, Z.; Ma, Y.; Huang, W. Size-Dependent Interaction of the Poly(N-vinyl-2-pyrrolidone) Capping Ligand with Pd Nanocrystals. Langmuir 2012, 28, 6736–6741. [Google Scholar] [CrossRef]
  40. Yang, D.Q.; Rochelte, J.F.; Sacher, E. Spectroscopic evidence for π-π interaction between poly(diallyl dimethylammonium) chloride and multiwalled carbon nanotubes. J. Phys. Chem. B 2005, 109, 4481–4484. [Google Scholar] [CrossRef]
  41. Figueiredo, J.L.; Pereira, M.F.R.; Freitas, M.M.A.; Órfão, J.J.M. Modification of the surface chemistry of activated carbons. Carbon 1999, 37, 1379–1389. [Google Scholar] [CrossRef]
  42. Walczyk, M.; S̀wiatkowski, A.; Pakuła, M.; Biniak, S. Electrochemical studies of the interaction between a modified activated carbon surface and heavy metal ions. J. Appl. Electrochem. 2005, 35, 123–130. [Google Scholar] [CrossRef]
  43. Mertens, P.G.N.; Cuypers, F.; Vandezande, P.; Ye, X.; Verpoort, F.; Vankelecom, I.F.J.; De Vos, D.E. Ag0 and Co0 nanocolloids as recyclable quasihomogeneous metal catalysts for the hydrogenation of α, β-unsaturated aldehydes to allylic alcohol fragrances. Appl. Catal. A Gen. 2007, 325, 130–139. [Google Scholar] [CrossRef]
  44. Wang, Y.; Cui, Q.; Guan, Y.; Wu, P. Facile synthesis of furfuryl ethyl ether in high yield: Via the reductive etherification of furfural in ethanol over Pd/C under mild conditions. Green Chem. 2018, 20, 2110–2117. [Google Scholar] [CrossRef]
  45. Padovan, D.; Al-Nayili, A.; Hammond, C. Bifunctional Lewis and Brønsted acidic zeolites permit the continuous production of bio-renewable furanic ethers. Green Chem. 2017, 19, 2846–2854. [Google Scholar] [CrossRef]
  46. Pizzi, R.; van Putten, R.J.; Brust, H.; Perathoner, S.; Centi, G.; van der Waal, J.C. High-throughput screening of heterogeneous catalysts for the conversion of furfural to bio-based fuel components. Catalysts 2015, 5, 2244–2257. [Google Scholar] [CrossRef] [Green Version]
  47. Rossi, L.M.; Fiorio, J.L.; Garcia, M.A.S.; Ferraz, C.P. The role and fate of capping ligands in colloidally prepared metal nanoparticle catalysts. Dalton Trans. 2018, 47, 5889–5915. [Google Scholar] [CrossRef]
  48. Villa, A.; Wang, D.; Veith, G.M.; Vindigni, F.; Prati, L. Sol immobilization technique: A delicate balance between activity, selectivity and stability of gold catalysts. Catal. Sci. Technol. 2013, 3, 3036. [Google Scholar] [CrossRef] [Green Version]
  49. Villa, A.; Wang, D.; Dimitratos, N.; Su, D.; Trevisan, V.; Prati, L. Pd on carbon nanotubes for liquid phase alcohol oxidation. Catal. Today 2010, 150, 8–15. [Google Scholar] [CrossRef] [Green Version]
Figure 1. Possible reaction pathway of furfural hydrogenation. Reaction products: furfuryl alcohol (FA), tetrahydrofurfuryl alcohol (THFA), 2-methylfuran (2-MF), 2-methyltetrahydrofuran (2-MTHF), furfuryl isopropyl ether (FIE), and tetrahydrofurfuryl isopropyl ether (THFIE).
Catalysts 10 00011 g001
Figure 2. Structure of the capping agents used.
Catalysts 10 00011 g002
Figure 3. FTIR spectra of (a) PVA and PVA/Pd, (b) PVP and PVP-Pd, and (c) PDDA and PDDA/Pd.
Catalysts 10 00011 g003
Figure 4. HRTEM micrograph and histogram of particle size distribution of (a) PdPVA/C, (b) PdPVP/C, and (c) PdPDDA/C.
Catalysts 10 00011 g004
Figure 5. Fitting of XPS envelopes of (a) PdPVA/C, (b) PdPVP/C, and (c) PdPDDA/C for Pd 3d.
Catalysts 10 00011 g005
Figure 6. Fitting of XPS envelopes of (a) PdPVA/C, (b) PdPVP/C, (c) PdPDDA/C, and (d) X40S carbon for C1s species.
Catalysts 10 00011 g006
Figure 7. Fitting of XPS envelopes of (a) PdPVA/C, (b) PdPVP/C, (c) PdPDDA/C, and (d) X40S carbon for O1s species.
Catalysts 10 00011 g007
Figure 8. Conversion % vs. time plot for the catalysts at (a) 25 °C, (b) 50 °C, and (c) 75 °C.
Catalysts 10 00011 g008
Figure 9. Reusability tests on PdPVA/C performed at 25 °C (a) without any treatment; (b) after washing the catalyst with acetone.
Catalysts 10 00011 g009
Table 1. XPS data for the relative surface amount of Pd, O, N, C, and O/C.
CatalystContent (at %)O/C
PdONC
C (X40S)09.17090.820.10
PdPVA/AC1.3014.70084.230.17
PdPVP/C0.509.102.9587.540.10
PdPDDA/C0.769.701.8687.840.11
PdPVA/AC used0.3245.70053.981.10
PdPVA/AC used and washed0.9318.00081.070.22
Table 2. XPS analysis of carbon-supported Pd NPs.
Sample Pd3d
Pd0Pdδ+
PdPVA/CBE [eV]335.7337.6
[%]30.969.1
PdPVP/CBE [eV]335.6337.6
[%]23.976.1
PdPDDA/CBE [eV]335.7338.0
[%]9.490.6
PdPVA/C usedBE [eV]335.4337.3
[%]72.727.3
PdPVA/C used and washedBE [eV]335.8337.0
[%]65.534.5
Table 3. C species for 1 wt % Pd/C samples.
Sample C1s
C=CC–CC=OC–OH/
C–O–C
C (X40S)BE [eV]284.6285.4286.7289.2
[%]55.422.712.99.0
PdPVA/CBE [eV]284.0285.4286.7289.2
[%]42.929.914.113.1
PdPVP/CBE [eV]284.6285.9287.9289.9
[%]54.732.39.43.6
PdPDDA/CBE [eV]284.6285.3286.9289.1
[%]28.447.518.55.6
PdPVA/C usedBE [eV]284.6285.8287.8289.2
[%]35.036.222.56.3
PdPVA/C used and washedBE [eV]284.6285.5286.6288.8
[%]33.131.123.612.2
Sample O1s
C=OC–O–CC–OHC–OOH
C (X40S)BE [eV]531.1532.7534.0536.5
[%]30.041.922.16.0
PdPVA/CBE [eV]531.2532.9534.6536.2
[%]33.854.89.12.3
PdPVP/CBE [eV]531.0532.1533.4534.8
[%]30.932.924.711.1
PdPDDA/CBE [eV]531.4532.8534.3535.9
[%]28.152.514.25.2
PdPVA/C usedBE [eV]-532.6533.9535.9
[%]-53.142.44.5
PdPVA/C used and washedBE [eV]529.8531.0532.4533.6
[%]42.827.317.712.2
Table 4. Comparison of the activity and selectivity for PdPVA/C, PdPVP/C, and PdPDDA/C in the selective hydrogenation of furfural.
CatalystT (°C)Activity (h−1) aSelectivity (%) bCarbon Balance (%)Pd (XPS, at%) Pd Size (TEM, nm)
FA THFA2-MFFA EtherTHFA EtherAcetal
PdPVA/C 1.304.2
2582445.25.01.817.33.719.092.0
50177549.66.04.431.03.32.797.0
75252246.01.75.232.44.14.393.7
PdPVP/C 0.503.6
2530464.06.82.919.25.4-98.3
5057356.77.75.419.03.82.995.5
75272242.01.99.234.23.45.195.8
PdPDDA/C 0.764.4
2562452.810.24.923.35.6-96.8
50142249.05.74.627.45.24.696.5
75258144.14.74.532.22.93.291.2
Reaction conditions: Furfural 0.3M in isopropanol, metal/substrate 1:500, 5 bar of H2. a calculated at 5 min of reaction as molfurfural converted molmetal −1 h−1. b selectivity at 60% of conversion

