Next Issue
Volume 11, August-2
Previous Issue
Volume 11, July-2
 
 
remotesensing-logo

Journal Browser

Journal Browser

Remote Sens., Volume 11, Issue 15 (August-1 2019) – 101 articles

Cover Story (view full-size image): 
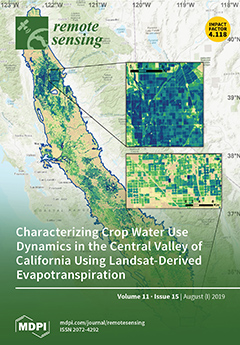
Understanding how different crops use water over time is essential for planning and managing water resources and agricultural production. The main objective of this paper is to characterize the spatiotemporal dynamics of crop water use in the Central Valley of California using Landsat-derived actual evapotranspiration (ETa). Crop water use for 10 crops has been characterized for the entire Central Valley since 2008, and in the case of Kern County, since 1999. A Mann–Kendall trend analysis revealed a significant increase in area cultivated with almonds and their increasing water use at a rate of 13,488 ha-m per year, while alfalfa showed a significant decline, with 13,901 ha-m per year during the same period. This study demonstrates the useful application of historical Landsat ETa to produce water management information. View this paper.
  • Issues are regarded as officially published after their release is announced to the table of contents alert mailing list.
  • You may sign up for e-mail alerts to receive table of contents of newly released issues.
  • PDF is the official format for papers published in both, html and pdf forms. To view the papers in pdf format, click on the "PDF Full-text" link, and use the free Adobe Reader to open them.
Order results
Result details
Section
Select all
Export citation of selected articles as:
22 pages, 4678 KiB  
Article
Modeling Mid-Season Rice Nitrogen Uptake Using Multispectral Satellite Data
by James Brinkhoff, Brian W. Dunn, Andrew J. Robson, Tina S. Dunn and Remy L. Dehaan
Remote Sens. 2019, 11(15), 1837; https://doi.org/10.3390/rs11151837 - 06 Aug 2019
Cited by 25 | Viewed by 5735
Abstract
Mid-season nitrogen (N) application in rice crops can maximize yield and profitability. This requires accurate and efficient methods of determining rice N uptake in order to prescribe optimal N amounts for topdressing. This study aims to determine the accuracy of using remotely sensed [...] Read more.
Mid-season nitrogen (N) application in rice crops can maximize yield and profitability. This requires accurate and efficient methods of determining rice N uptake in order to prescribe optimal N amounts for topdressing. This study aims to determine the accuracy of using remotely sensed multispectral data from satellites to predict N uptake of rice at the panicle initiation (PI) growth stage, with a view to providing optimum variable-rate N topdressing prescriptions without needing physical sampling. Field experiments over 4 years, 4–6 N rates, 4 varieties and 2 sites were conducted, with at least 3 replicates of each plot. One WorldView satellite image for each year was acquired, close to the date of PI. Numerous single- and multi-variable models were investigated. Among single-variable models, the square of the NDRE vegetation index was shown to be a good predictor of N uptake (R 2 = 0.75, RMSE = 22.8 kg/ha for data pooled from all years and experiments). For multi-variable models, Lasso regularization was used to ensure an interpretable and compact model was chosen and to avoid over fitting. Combinations of remotely sensed reflectances and spectral indexes as well as variety, climate and management data as input variables for model training achieved R 2 < 0.9 and RMSE < 15 kg/ha for the pooled data set. The ability of remotely sensed data to predict N uptake in new seasons where no physical sample data has yet been obtained was tested. A methodology to extract models that generalize well to new seasons was developed, avoiding model overfitting. Lasso regularization selected four or less input variables, and yielded R 2 of better than 0.67 and RMSE better than 27.4 kg/ha over four test seasons that weren’t used to train the models. Full article
(This article belongs to the Special Issue Remote Sensing for Precision Nitrogen Management)
Show Figures

Graphical abstract

25 pages, 5953 KiB  
Article
Mapping Irrigated Areas Using Sentinel-1 Time Series in Catalonia, Spain
by Hassan Bazzi, Nicolas Baghdadi, Dino Ienco, Mohammad El Hajj, Mehrez Zribi, Hatem Belhouchette, Maria Jose Escorihuela and Valérie Demarez
Remote Sens. 2019, 11(15), 1836; https://doi.org/10.3390/rs11151836 - 06 Aug 2019
Cited by 68 | Viewed by 7046
Abstract
Mapping irrigated plots is essential for better water resource management. Today, the free and open access Sentinel-1 (S1) and Sentinel-2 (S2) data with high revisit time offers a powerful tool for irrigation mapping at plot scale. Up to date, few studies have used [...] Read more.
Mapping irrigated plots is essential for better water resource management. Today, the free and open access Sentinel-1 (S1) and Sentinel-2 (S2) data with high revisit time offers a powerful tool for irrigation mapping at plot scale. Up to date, few studies have used S1 and S2 data to provide approaches for mapping irrigated plots. This study proposes a method to map irrigated plots using S1 SAR (synthetic aperture radar) time series. First, a dense temporal series of S1 backscattering coefficients were obtained at plot scale in VV (Vertical-Vertical) and VH (Vertical-Horizontal) polarizations over a study site located in Catalonia, Spain. In order to remove the ambiguity between rainfall and irrigation events, the S1 signal obtained at plot scale was used conjointly to S1 signal obtained at a grid scale (10 km × 10 km). Later, two mathematical transformations, including the principal component analysis (PCA) and the wavelet transformation (WT), were applied to the several SAR temporal series obtained in both VV and VH polarization. Irrigated areas were then classified using the principal component (PC) dimensions and the WT coefficients in two different random forest (RF) classifiers. Another classification approach using one dimensional convolutional neural network (CNN) was also performed on the obtained S1 temporal series. The results derived from the RF classifiers with S1 data show high overall accuracy using the PC values (90.7%) and the WT coefficients (89.1%). By applying the CNN approach on SAR data, a significant overall accuracy of 94.1% was obtained. The potential of optical images to map irrigated areas by the mean of a normalized differential vegetation index (NDVI) temporal series was also tested in this study in both the RF and the CNN approaches. The overall accuracy obtained using the NDVI in RF classifier reached 89.5% while that in the CNN reached 91.6%. The combined use of optical and radar data slightly enhanced the classification in the RF classifier but did not significantly change the accuracy obtained in the CNN approach using S1 data. Full article
Show Figures

Graphical abstract

23 pages, 8806 KiB  
Article
Evaluation of Grass Quality under Different Soil Management Scenarios Using Remote Sensing Techniques
by Mohammad Sadegh Askari, Timothy McCarthy, Aidan Magee and Darren J. Murphy
Remote Sens. 2019, 11(15), 1835; https://doi.org/10.3390/rs11151835 - 06 Aug 2019
Cited by 33 | Viewed by 6102
Abstract
Hyperspectral and multispectral imagery have been demonstrated to have a considerable potential for near real-time monitoring and mapping of grass quality indicators. The objective of this study was to evaluate the efficiency of remote sensing techniques for quantification of aboveground grass biomass (BM) [...] Read more.
Hyperspectral and multispectral imagery have been demonstrated to have a considerable potential for near real-time monitoring and mapping of grass quality indicators. The objective of this study was to evaluate the efficiency of remote sensing techniques for quantification of aboveground grass biomass (BM) and crude protein (CP) in a temperate European climate such as Ireland. The experiment was conducted on 64 plots and 53 paddocks with varying quantities of nitrogen applied. Hyperspectral imagery (HSI) and multispectral imagery (MSI) were analyzed to develop the prediction models. The MSI data used in this study were captured using an unmanned aircraft vehicle (UAV) and the satellite Sentinel-2, while the HSI data were obtained using a handheld hyperspectral camera. The prediction models were developed using partial least squares regression (PLSR) and stepwise multi-linear regression (MLR). Eventually, the spatial distribution of grass biomass over plots and paddocks was mapped to assess the within-field variability of grass quality metrics. An excellent accuracy was achieved for the prediction of BM and CP using HSI (RPD > 2.5 and R2 > 0.8), and a good accuracy was obtained via MSI-UAV (2 < RPD < 2.5 and R2 > 0.7) for the grass quality indicators. The accuracy of the models calculated using MSI-Sentinel-2 was reasonable for BM prediction and insufficient for CP estimation. The red-edge range of the wavelengths showed the maximum impact on the predictability of grass BM, and the NIR range had the greatest influence on the estimation of grass CP. Both the PLSR and MLR techniques were found to be sufficiently robust for spectral modelling of aboveground BM and CP. The PLSR yielded a slightly better model than MLR. This study suggested that remote sensing techniques can be used as a rapid and reliable approach for near real-time quantitative assessment of fresh grass quality under a temperate European climate. Full article
(This article belongs to the Section Remote Sensing in Agriculture and Vegetation)
Show Figures

Figure 1

18 pages, 3726 KiB  
Article
Comparison of Changes in Urban Land Use/Cover and Efficiency of Megaregions in China from 1980 to 2015
by Shu Zhang, Chuanglin Fang, Wenhui Kuang and Fengyun Sun
Remote Sens. 2019, 11(15), 1834; https://doi.org/10.3390/rs11151834 - 06 Aug 2019
Cited by 19 | Viewed by 3469
Abstract
Urban land use/cover and efficiency are important indicators of the degree of urbanization. However, research about comparing their changes at the megaregion level is relatively rare. In this study, we depicted the differences and inequalities of urban land and efficiency among megaregions in [...] Read more.
Urban land use/cover and efficiency are important indicators of the degree of urbanization. However, research about comparing their changes at the megaregion level is relatively rare. In this study, we depicted the differences and inequalities of urban land and efficiency among megaregions in China using China’s Land Use/cover Dataset (CLUD) and China’s Urban Land Use/cover Dataset (CLUD-Urban). Furthermore, we analyzed regional inequality using the Theil index. The results indicated that the Guangdong-Hong Kong-Macao Great Bay Area had the highest proportion of urban land (8.03%), while the Chengdu-Chongqing Megaregion had the highest proportion of developed land (64.70%). The proportion of urban impervious surface area was highest in the Guangdong-Hong Kong-Macao Great Bay Area (75.16%) and lowest in the Chengdu-Chongqing Megaregion (67.19%). Furthermore, the highest urban expansion occurred in the Yangtze River Delta (260.52 km2/a), and the fastest period was 2000–2010 (298.19 km2/a). The decreasing Theil index values for the urban population and economic density were 0.305 and 1.748, respectively, in 1980–2015. This study depicted the development trajectory of different megaregions, and will expect to provide a valuable insight and new knowledge on reasonable urban growth modes and sustainable goals in urban planning and management. Full article
Show Figures

Graphical abstract

20 pages, 3965 KiB  
Article
A Novel Coarse-to-Fine Scheme for Remote Sensing Image Registration Based on SIFT and Phase Correlation
by Han Yang, Xiaorun Li, Liaoying Zhao and Shuhan Chen
Remote Sens. 2019, 11(15), 1833; https://doi.org/10.3390/rs11151833 - 06 Aug 2019
Cited by 24 | Viewed by 4010
Abstract
Automatic image registration has been wildly used in remote sensing applications. However, the feature-based registration method is sometimes inaccurate and unstable for images with large scale difference, grayscale and texture differences. In this manuscript, a coarse-to-fine registration scheme is proposed, which combines the [...] Read more.
Automatic image registration has been wildly used in remote sensing applications. However, the feature-based registration method is sometimes inaccurate and unstable for images with large scale difference, grayscale and texture differences. In this manuscript, a coarse-to-fine registration scheme is proposed, which combines the advantage of feature-based registration and phase correlation-based registration. The scheme consists of four steps. First, feature-based registration method is adopted for coarse registration. A geometrical outlier removal method is applied to improve the accuracy of coarse registration, which uses geometric similarities of inliers. Then, the sensed image is modified through the coarse registration result under affine deformation model. After that, the modified sensed image is registered to the reference image by extended phase correlation. Lastly, the final registration results are calculated by the fusion of the coarse registration and the fine registration. High universality of feature-based registration and high accuracy of extended phase correlation-based registration are both preserved in the proposed method. Experimental results of several different remote sensing images, which come from several published image registration papers, demonstrate the high robustness and accuracy of the proposed method. The evaluation contains root mean square error (RMSE), Laplace mean square error (LMSE) and red–green image registration results. Full article
Show Figures

Graphical abstract

24 pages, 3590 KiB  
Article
Vegetation and Soil Fire Damage Analysis Based on Species Distribution Modeling Trained with Multispectral Satellite Data
by Carmen Quintano, Alfonso Fernández-Manso, Leonor Calvo and Dar A. Roberts
Remote Sens. 2019, 11(15), 1832; https://doi.org/10.3390/rs11151832 - 06 Aug 2019
Cited by 18 | Viewed by 3929
Abstract
Forest managers demand reliable tools to evaluate post-fire vegetation and soil damage. In this study, we quantify wildfire damage to vegetation and soil based on the analysis of burn severity, using multitemporal and multispectral satellite data and species distribution models, particularly maximum entropy [...] Read more.
Forest managers demand reliable tools to evaluate post-fire vegetation and soil damage. In this study, we quantify wildfire damage to vegetation and soil based on the analysis of burn severity, using multitemporal and multispectral satellite data and species distribution models, particularly maximum entropy (MaxEnt). We studied a mega-wildfire (9000 ha burned) in North-Western Spain, which occurred from 21 to 27 August 2017. Burn severity was measured in the field using the composite burn index (CBI). Burn severity of vegetation and soil layers (CBIveg and CBIsoil) was also differentiated. MaxEnt provided the relative contribution of each pre-fire and post-fire input variable on low, moderate and high burn severity levels, as well as on all severity levels combined (burned area). In addition, it built continuous suitability surfaces from which the burned surface area and burn severity maps were built. The burned area map achieved a high accuracy level (κ = 0.85), but slightly lower accuracy when differentiating the three burn severity classes (κ = 0.81). When the burn severity map was validated using field CBIveg and CBIsoil values we reached lower κ statistic values (0.76 and 0.63, respectively). This study revealed the effectiveness of the proposed multi-temporal MaxEnt based method to map fire damage accurately in Mediterranean ecosystems, providing key information to forest managers. Full article
(This article belongs to the Section Forest Remote Sensing)
Show Figures

Figure 1

26 pages, 26740 KiB  
Article
PolSAR Image Classification via Learned Superpixels and QCNN Integrating Color Features
by Xinzheng Zhang, Jili Xia, Xiaoheng Tan, Xichuan Zhou and Tao Wang
Remote Sens. 2019, 11(15), 1831; https://doi.org/10.3390/rs11151831 - 06 Aug 2019
Cited by 17 | Viewed by 4041
Abstract
Polarimetric synthetic aperture radar (PolSAR) image classification plays an important role in various PolSAR image application. And many pixel-wise, region-based classification methods have been proposed for PolSAR images. However, most of the pixel-wise methods can not model local spatial relationship of pixels due [...] Read more.
Polarimetric synthetic aperture radar (PolSAR) image classification plays an important role in various PolSAR image application. And many pixel-wise, region-based classification methods have been proposed for PolSAR images. However, most of the pixel-wise methods can not model local spatial relationship of pixels due to negative effects of speckle noise, and most of the region-based methods fail to figure out the regions with the similar polarimetric features. Considering that color features can provide good visual expression and perform well for image interpretation, in this work, based on the PolSAR pseudo-color image over Pauli decomposition, we propose a supervised PolSAR image classification approach combining learned superpixels and quaternion convolutional neural network (QCNN). First, the PolSAR RGB pseudo-color image is formed under Pauli decomposition. Second, we train QCNN with quaternion PolSAR data converted by RGB channels to extract deep color features and obtain pixel-wise classification map. QCNN treats color channels as a quaternion matrix excavating the relationship among the color channels effectively and avoiding information loss. Third, pixel affinity network (PAN) is utilized to generate the learned superpixels of PolSAR pseudo-color image. The learned superpixels allow the local information exploitation available in the presence of speckle noise. Finally, we fuse the pixel-wise classification result and superpixels to acquire the ultimate pixel-wise PolSAR image classification map. Experiments on three real PolSAR data sets show that the proposed approach can obtain 96.56%, 95.59%, and 92.55% accuracy for Flevoland, San Francisco and Oberpfaffenhofen data set, respectively. And compared with state-of-the-art PolSAR image classification methods, the proposed algorithm can obtained competitive classification results. Full article
(This article belongs to the Section Remote Sensing Image Processing)
Show Figures

Graphical abstract

16 pages, 3278 KiB  
Technical Note
Leveraging Commercial High-Resolution Multispectral Satellite and Multibeam Sonar Data to Estimate Bathymetry: The Case Study of the Caribbean Sea
by Samuel Pike, Dimosthenis Traganos, Dimitris Poursanidis, Jamie Williams, Katie Medcalf, Peter Reinartz and Nektarios Chrysoulakis
Remote Sens. 2019, 11(15), 1830; https://doi.org/10.3390/rs11151830 - 06 Aug 2019
Cited by 24 | Viewed by 5590
Abstract
The global coastal seascape offers a multitude of ecosystem functions and services to the natural and human-induced ecosystems. However, the current anthropogenic global warming above pre-industrial levels is inducing the degradation of seascape health with adverse impacts on biodiversity, economy, and societies. Bathymetric [...] Read more.
The global coastal seascape offers a multitude of ecosystem functions and services to the natural and human-induced ecosystems. However, the current anthropogenic global warming above pre-industrial levels is inducing the degradation of seascape health with adverse impacts on biodiversity, economy, and societies. Bathymetric knowledge empowers our scientific, financial, and ecological understanding of the associated benefits, processes, and pressures to the coastal seascape. Here we leverage two commercial high-resolution multispectral satellite images of the Pleiades and two multibeam survey datasets to measure bathymetry in two zones (0–10 m and 10–30 m) in the tropical Anguilla and British Virgin Islands, northeast Caribbean. A methodological framework featuring a combination of an empirical linear transformation, cloud masking, sun-glint correction, and pseudo-invariant features allows spatially independent calibration and test of our satellite-derived bathymetry approach. The best R2 and RMSE for training and validation vary between 0.44–0.56 and 1.39–1.76 m, respectively, while minimum vertical errors are less than 1 m in the depth ranges of 7.8–10 and 11.6–18.4 m for the two explored zones. Given available field data, the present methodology could provide simple, time-efficient, and accurate spatio-temporal satellite-derived bathymetry intelligence in scientific and commercial tasks i.e., navigation, coastal habitat mapping and resource management, and reducing natural hazards. Full article
(This article belongs to the Special Issue Satellite Derived Bathymetry)
Show Figures

Graphical abstract

32 pages, 9404 KiB  
Article
Random Noise Suppression of Magnetic Resonance Sounding Data with Intensive Sampling Sparse Reconstruction and Kernel Regression Estimation
by Xiaokang Yao, Jianmin Zhang, Zhenyang Yu, Fa Zhao and Yong Sun
Remote Sens. 2019, 11(15), 1829; https://doi.org/10.3390/rs11151829 - 05 Aug 2019
Cited by 4 | Viewed by 3231
Abstract
The magnetic resonance sounding (MRS) method is a non-invasive, efficient and advanced geophysical method for groundwater detection. However, the MRS signal received by the coil sensor is extremely susceptible to electromagnetic noise interference. In MRS data processing, random noise suppression of noisy MRS [...] Read more.
The magnetic resonance sounding (MRS) method is a non-invasive, efficient and advanced geophysical method for groundwater detection. However, the MRS signal received by the coil sensor is extremely susceptible to electromagnetic noise interference. In MRS data processing, random noise suppression of noisy MRS data is an important research aspect. We propose an approach for intensive sampling sparse reconstruction (ISSR) and kernel regression estimation (KRE) to suppress random noise. The approach is based on variable frequency sampling, numerical integration and statistical signal processing combined with kernel regression estimation. In order to realize the approach, we proposed three specific sparse reconstructions, namely rectangular sparse reconstruction, trapezoidal sparse reconstruction and Simpson sparse reconstruction. To solve the distortion of peaks and valleys after sparse reconstruction, we introduced the KRE to deal with the processed data by the ISSR. Further, the simulation and field experiments demonstrate that the ISSR-KRE approach is a feasible and effective way to suppress random noise. Besides, we find that rectangular sparse reconstruction and trapezoidal sparse reconstruction are superior to Simpson sparse reconstruction in terms of noise suppression effect, and sampling frequency is positively correlated with signal-to-noise improvement ratio (SNIR). In one case of field experiment, the standard deviation of noisy MRS data was reduced from 1200.80 nV to 570.01 nV by the ISSR-KRE approach. The proposed approach provides theoretical support for random noise suppression and contributes to the development of MRS instrument with low power consumption and high efficiency. In the future, we will integrate the approach into MRS instrument and attempt to utilize them to eliminate harmonic noise from power line. Full article
(This article belongs to the Special Issue Recent Advances in Subsurface Sensing Technologies)
Show Figures

Graphical abstract

19 pages, 5427 KiB  
Article
Spatio–temporal Assessment of Drought in Ethiopia and the Impact of Recent Intense Droughts
by Yuei-An Liou and Getachew Mehabie Mulualem
Remote Sens. 2019, 11(15), 1828; https://doi.org/10.3390/rs11151828 - 05 Aug 2019
Cited by 55 | Viewed by 8480
Abstract
The recent droughts that have occurred in different parts of Ethiopia are generally linked to fluctuations in atmospheric and ocean circulations. Understanding these large-scale phenomena that play a crucial role in vegetation productivity in Ethiopia is important. In view of this, several techniques [...] Read more.
The recent droughts that have occurred in different parts of Ethiopia are generally linked to fluctuations in atmospheric and ocean circulations. Understanding these large-scale phenomena that play a crucial role in vegetation productivity in Ethiopia is important. In view of this, several techniques and datasets were analyzed to study the spatio–temporal variability of vegetation in response to a changing climate. In this study, 18 years (2001–2018) of Moderate Resolution Imaging Spectroscopy (MODIS) Terra/Aqua, normalized difference vegetation index (NDVI), land surface temperature (LST), Climate Hazards Group Infrared Precipitation with Stations (CHIRPS) daily precipitation, and the Famine Early Warning Systems Network (FEWS NET) Land Data Assimilation System (FLDAS) soil moisture datasets were processed. Pixel-based Mann–Kendall trend analysis and the Vegetation Condition Index (VCI) were used to assess the drought patterns during the cropping season. Results indicate that the central highlands and northwestern part of Ethiopia, which have land cover dominated by cropland, had experienced decreasing precipitation and NDVI trends. About 52.8% of the pixels showed a decreasing precipitation trend, of which the significant decreasing trends focused on the central and low land areas. Also, 41.67% of the pixels showed a decreasing NDVI trend, especially in major parts of the northwestern region of Ethiopia. Based on the trend test and VCI analysis, significant countrywide droughts occurred during the El Niño 2009 and 2015 years. Furthermore, the Pearson correlation coefficient analysis assures that the low NDVI was mainly attributed to the low precipitation and water availability in the soils. This study provides valuable information in identifying the locations with the potential concern of drought and planning for immediate action of relief measures. Furthermore, this paper presents the results of the first attempt to apply a recently developed index, the Normalized Difference Latent Heat Index (NDLI), to monitor drought conditions. The results show that the NDLI has a high correlation with NDVI (r = 0.96), precipitation (r = 0.81), soil moisture (r = 0.73), and LST (r = −0.67). NDLI successfully captures the historical droughts and shows a notable correlation with the climatic variables. The analysis shows that using the radiances of green, red, and short wave infrared (SWIR), a simplified crop monitoring model with satisfactory accuracy and easiness can be developed. Full article
Show Figures

Graphical abstract

16 pages, 6231 KiB  
Article
Remote Sensing of Explosives-Induced Stress in Plants: Hyperspectral Imaging Analysis for Remote Detection of Unexploded Threats
by Paul V. Manley, Vasit Sagan, Felix B. Fritschi and Joel G. Burken
Remote Sens. 2019, 11(15), 1827; https://doi.org/10.3390/rs11151827 - 05 Aug 2019
Cited by 13 | Viewed by 5379
Abstract
Explosives contaminate millions of hectares from various sources (partial detonations, improper storage, and release from production and transport) that can be life-threatening, e.g., landmines and unexploded ordnance. Exposure to and uptake of explosives can also negatively impact plant health, and these factors can [...] Read more.
Explosives contaminate millions of hectares from various sources (partial detonations, improper storage, and release from production and transport) that can be life-threatening, e.g., landmines and unexploded ordnance. Exposure to and uptake of explosives can also negatively impact plant health, and these factors can be can be remotely sensed. Stress induction was remotely sensed via a whole-plant hyperspectral imaging system as two genotypes of Zea mays, a drought-susceptible hybrid and a drought-tolerant hybrid, and a forage Sorghum bicolor were grown in a greenhouse with one control group, one group maintained at 60% soil field capacity, and a third exposed to 250 mg kg−1 Royal Demolition Explosive (RDX). Green-Red Vegetation Index (GRVI), Photochemical Reflectance Index (PRI), Modified Red Edge Simple Ratio (MRESR), and Vogelmann Red Edge Index 1 (VREI1) were reduced due to presence of explosives. Principal component analyses of reflectance indices separated plants exposed to RDX from control and drought plants. Reflectance of Z. mays hybrids was increased from RDX in green and red wavelengths, while reduced in near-infrared wavelengths. Drought Z. mays reflectance was lower in green, red, and NIR regions. S. bicolor grown with RDX reflected more in green, red, and NIR wavelengths. The spectra and their derivatives will be beneficial for developing explosive-specific indices to accurately identify plants in contaminated soil. This study is the first to demonstrate potential to delineate subsurface explosives over large areas using remote sensing of vegetation with aerial-based hyperspectral systems. Full article
(This article belongs to the Section Environmental Remote Sensing)
Show Figures

Graphical abstract

13 pages, 3547 KiB  
Letter
Ocean Optical Profiling in South China Sea Using Airborne LiDAR
by Peng Chen and Delu Pan
Remote Sens. 2019, 11(15), 1826; https://doi.org/10.3390/rs11151826 - 05 Aug 2019
Cited by 31 | Viewed by 3826
Abstract
Increasingly, LiDAR has more and more applications. However, so far, there are no relevant publications on using airborne LiDAR for ocean optical profiling in the South China Sea (SCS). The applicability of airborne LiDAR for optical profiling in the SCS will be presented. [...] Read more.
Increasingly, LiDAR has more and more applications. However, so far, there are no relevant publications on using airborne LiDAR for ocean optical profiling in the South China Sea (SCS). The applicability of airborne LiDAR for optical profiling in the SCS will be presented. A total of four airborne LiDAR flight experiments were conducted over autumn 2017 and spring 2018 in the SCS. A hybrid retrieval method will be presented here, which incorporates a Klett method to obtain LiDAR attenuation coefficient and a perturbation retrieval method for a volume scattering function at 180°. The correlation coefficient between the LiDAR-derived results and the traditional measurements was 0.7. The mean absolute relative error (MAE) and the normalized root mean square deviation (NRMSD) between the two are both between 10% and 12%. Subsequently, the vertical structure of the LiDAR-retrieved attenuation and backscattering along airborne LiDAR flight tracks was mapped. In addition to this, ocean subsurface phytoplankton layers were detected between 10 to 20 m depths along the flight track in Sanya Bay. Primary results demonstrated that our airborne LiDAR has an independent ability to survey and characterize ocean optical structure. Full article
(This article belongs to the Section Ocean Remote Sensing)
Show Figures

Graphical abstract

22 pages, 7446 KiB  
Article
Chlorophyll Concentration Response to the Typhoon Wind-Pump Induced Upper Ocean Processes Considering Air–Sea Heat Exchange
by Yupeng Liu, Danling Tang and Morozov Evgeny
Remote Sens. 2019, 11(15), 1825; https://doi.org/10.3390/rs11151825 - 04 Aug 2019
Cited by 43 | Viewed by 5660
Abstract
The typhoon Wind-Pump induced upwelling and cold eddy often promote the significant growth of phytoplankton after the typhoon. However, the importance of eddy-pumping and wind-driven upwelling on the sea surface chlorophyll a concentration (Chl-a) during the typhoon are still not clearly distinguished. In [...] Read more.
The typhoon Wind-Pump induced upwelling and cold eddy often promote the significant growth of phytoplankton after the typhoon. However, the importance of eddy-pumping and wind-driven upwelling on the sea surface chlorophyll a concentration (Chl-a) during the typhoon are still not clearly distinguished. In addition, the air–sea heat flux exchange is closely related to the upper ocean processes, but few studies have discussed its role in the sea surface Chl-a variations under typhoon conditions. Based on the cruise data, remote sensing data, and model data, this paper analyzes the contribution of the vertical motion caused by the eddy-pumping upwelling and Ekman pumping upwelling on the surface Chl-a, and quantitatively analyzes the influence of air–sea heat exchange on the surface Chl-a after the typhoon Linfa over the northeastern South China Sea (NSCS) in 2009. The results reveal the Wind Pump impacts on upper ocean processes: (1) The euphotic layer-integrated Chl-a increased after the typhoon, and the increasing of the surface Chl-a was not only the uplift of the deeper waters with high Chl-a but also the growth of the phytoplankton; (2) The Net Heat Flux (air–sea heat exchange) played a major role in controlling the upper ocean physical processes through cooling the SST and indirectly increased the surface Chl-a until two weeks after the typhoon; (3) the typhoon-induced cyclonic eddy was the most important physical process in increasing the surface Chl-a rather than the Ekman pumping and wind-stirring mixing after typhoon; (4) the spatial shift between the surface Chl-a blooms and the typhoon-induced cyclonic eddy could be due to the Ekman transport; (5) nutrients uplifting and adequate light were two major biochemical elements supplying for the growth of surface phytoplankton. Full article
(This article belongs to the Special Issue Tropical Cyclones Remote Sensing and Data Assimilation)
Show Figures

Graphical abstract

18 pages, 6761 KiB  
Article
Changes in Water Surface Area during 1989–2017 in the Huai River Basin using Landsat Data and Google Earth Engine
by Haoming Xia, Jinyu Zhao, Yaochen Qin, Jia Yang, Yaoping Cui, Hongquan Song, Liqun Ma, Ning Jin and Qingmin Meng
Remote Sens. 2019, 11(15), 1824; https://doi.org/10.3390/rs11151824 - 04 Aug 2019
Cited by 71 | Viewed by 8080
Abstract
The dynamics of surface water play a crucial role in the hydrological cycle and are sensitive to climate change and anthropogenic activities, especially for the agricultural zone. As one of the most populous areas in China’s river basins, the surface water in the [...] Read more.
The dynamics of surface water play a crucial role in the hydrological cycle and are sensitive to climate change and anthropogenic activities, especially for the agricultural zone. As one of the most populous areas in China’s river basins, the surface water in the Huai River Basin has significant impacts on agricultural plants, ecological balance, and socioeconomic development. However, it is unclear how water areas responded to climate change and anthropogenic water exploitation in the past decades. To understand the changes in water surface areas in the Huai River Basin, this study used the available 16,760 scenes Landsat TM, ETM+, and OLI images in this region from 1989 to 2017 and processed the data on the Google Earth Engine (GEE) platform. The vegetation index and water index were used to quantify the spatiotemporal variability of the surface water area changes over the years. The major results include: (1) The maximum area, the average area, and the seasonal variation of surface water in the Huai River Basin showed a downward trend in the past 29 years, and the year-long surface water areas showed a slight upward trend; (2) the surface water area was positively correlated with precipitation (p < 0.05), but was negatively correlated with the temperature and evapotranspiration; (3) the changes of the total area of water bodies were mainly determined by the 216 larger water bodies (>10 km2). Understanding the variations in water body areas and the controlling factors could support the designation and implementation of sustainable water management practices in agricultural, industrial, and domestic usages. Full article
Show Figures

Figure 1

22 pages, 6795 KiB  
Article
Evaluating the Performance of Satellite-Derived Vegetation Indices for Estimating Gross Primary Productivity Using FLUXNET Observations across the Globe
by Xiaojuan Huang, Jingfeng Xiao and Mingguo Ma
Remote Sens. 2019, 11(15), 1823; https://doi.org/10.3390/rs11151823 - 04 Aug 2019
Cited by 60 | Viewed by 6380
Abstract
Satellite-derived vegetation indices (VIs) have been widely used to approximate or estimate gross primary productivity (GPP). However, it remains unclear how the VI-GPP relationship varies with indices, biomes, timescales, and the bidirectional reflectance distribution function (BRDF) effect. We examined the relationship between VIs [...] Read more.
Satellite-derived vegetation indices (VIs) have been widely used to approximate or estimate gross primary productivity (GPP). However, it remains unclear how the VI-GPP relationship varies with indices, biomes, timescales, and the bidirectional reflectance distribution function (BRDF) effect. We examined the relationship between VIs and GPP for 121 FLUXNET sites across the globe and assessed how the VI-GPP relationship varied among a variety of biomes at both monthly and annual timescales. We used three widely-used VIs: normalized difference vegetation index (NDVI), enhanced vegetation index (EVI), and 2-band EVI (EVI2) as well as a new VI - NIRV and used surface reflectance both with and without BRDF correction from the moderate resolution imaging spectroradiometer (MODIS) to calculate these indices. The resulting traditional (NDVI, EVI, EVI2, and NIRV) and BRDF-corrected (NDVIBRDF, EVIBRDF, EVI2BRDF, and NIRV, BRDF) VIs were used to examine the VI-GPP relationship. At the monthly scale, all VIs were moderate or strong predictors of GPP, and the BRDF correction improved their performance. EVI2BRDF and NIRV, BRDF had similar performance in capturing the variations in tower GPP as did the MODIS GPP product. The VIs explained lower variance in tower GPP at the annual scale than at the monthly scale. The BRDF-correction of surface reflectance did not improve the VI-GPP relationship at the annual scale. The VIs had similar capability in capturing the interannual variability in tower GPP as MODIS GPP. VIs were influenced by temperature and water stresses and were more sensitive to temperature stress than to water stress. VIs in combination with environmental factors could improve the prediction of GPP than VIs alone. Our findings can help us better understand how the VI-GPP relationship varies among indices, biomes, and timescales and how the BRDF effect influences the VI-GPP relationship. Full article
Show Figures

Graphical abstract

19 pages, 1996 KiB  
Article
Tensor Discriminant Analysis via Compact Feature Representation for Hyperspectral Images Dimensionality Reduction
by Jinliang An, Yuzhen Song, Yuwei Guo, Xiaoxiao Ma and Xiangrong Zhang
Remote Sens. 2019, 11(15), 1822; https://doi.org/10.3390/rs11151822 - 04 Aug 2019
Cited by 5 | Viewed by 3230
Abstract
Dimensionality reduction is of great importance which aims at reducing the spectral dimensionality while keeping the desirable intrinsic structure information of hyperspectral images. Tensor analysis which can retain both spatial and spectral information of hyperspectral images has caused more and more concern in [...] Read more.
Dimensionality reduction is of great importance which aims at reducing the spectral dimensionality while keeping the desirable intrinsic structure information of hyperspectral images. Tensor analysis which can retain both spatial and spectral information of hyperspectral images has caused more and more concern in the field of hyperspectral images processing. In general, a desirable low dimensionality feature representation should be discriminative and compact. To achieve this, a tensor discriminant analysis model via compact feature representation (TDA-CFR) was proposed in this paper. In TDA-CFR, the traditional linear discriminant analysis was extended to tensor space to make the resulting feature representation more informative and discriminative. Furthermore, TDA-CFR redefines the feature representation of each spectral band by employing the tensor low rank decomposition framework which leads to a more compact representation. Full article
(This article belongs to the Special Issue Advanced Techniques for Spaceborne Hyperspectral Remote Sensing)
Show Figures

Figure 1

20 pages, 14351 KiB  
Article
Using Nighttime Light Data and POI Big Data to Detect the Urban Centers of Hangzhou
by Ge Lou, Qiuxiao Chen, Kang He, Yue Zhou and Zhou Shi
Remote Sens. 2019, 11(15), 1821; https://doi.org/10.3390/rs11151821 - 04 Aug 2019
Cited by 41 | Viewed by 6030
Abstract
The worldwide development of multi-center structures in large cities is a prevailing development trend. In recent years, China’s large cities developed from a predominantly mono-centric to a multi-center urban space structure. However, the definition and identification city centers is complex. Both nighttime light [...] Read more.
The worldwide development of multi-center structures in large cities is a prevailing development trend. In recent years, China’s large cities developed from a predominantly mono-centric to a multi-center urban space structure. However, the definition and identification city centers is complex. Both nighttime light data and point of interest (POI) data are important data sources for urban spatial structure research, but there are few integrated applications for these two kinds of data. In this study, visible infrared imaging radiometer suite (NPP-VIIRS) nighttime imagery and POI data were combined to identify the city centers in Hangzhou, China. First, the optimal parameters of multi-resolution segmentation were determined by experiments. The POI density was then calculated with the segmentation results as the statistical unit. High–high clustering units were then defined as the main centers by calculating the Anselin Local Moran’s I, and a geographically weighted regression model was used to identify the subcenters according to the square root of the POI density and the distances between the units and the city center. Finally, a comparison experiment was conducted between the proposed method and the relative cut-off_threshold method, and the experiment results were compared with the evaluation report of the master plan. The results showed that the optimal segmentation parameters combination was 0.1 shape and 0.5 compactness factors. Two main city centers and ten subcenters were detected. Comparison with the evaluation report of the master plan indicated that the combination of nighttime light data and POI data could identify the urban centers accurately. Combined with the characteristics of the two kinds of data, the spatial structure of the city could be characterized properly. This study provided a new perspective for the study of the spatial structure of polycentric cities. Full article
Show Figures

Graphical abstract

21 pages, 7083 KiB  
Article
Impacts of Large-Scale Open-Pit Coal Base on the Landscape Ecological Health of Semi-Arid Grasslands
by Zhenhua Wu, Shaogang Lei, Qingqing Lu and Zhengfu Bian
Remote Sens. 2019, 11(15), 1820; https://doi.org/10.3390/rs11151820 - 04 Aug 2019
Cited by 48 | Viewed by 4984
Abstract
Coal is an important energy resource in the world, especially in China. Extensive coal exploitation seriously damaged the grassland and its fragile ecosystem. However, temporal and spatial impact laws of open-pit coal exploitation on Landscape Ecological Health (LEH) of semi-arid grasslands are still [...] Read more.
Coal is an important energy resource in the world, especially in China. Extensive coal exploitation seriously damaged the grassland and its fragile ecosystem. However, temporal and spatial impact laws of open-pit coal exploitation on Landscape Ecological Health (LEH) of semi-arid grasslands are still not clear. Therefore, the main objective of this paper is to study impact of Large-scale Open-pit Coal Base (LOCB) on the LEH of semi-arid grasslands from the perspectives of temporal and spatial. Taking Shengli LOCB of Xilinguole grassland in Inner Mongolia as an example, we demonstrate a conceptual model of LOCB impact on LEH of semi-arid grasslands, and establish a research system called landscape Index-pattern Evolution-Driving force-Spatial statistics (IEDS). A complete process integrated from investigation, monitoring, and evaluation to the analysis of impact laws was developed. Result indicated that coal mining causes gradual increase of landscape patches, landscape fragmentation, gradual decline of landscape connectivity, complexity and irregularity of landscape shape, enhancement of landscape heterogeneity and complexity, gradual decline of landscape stability, gradual decrease of grassland landscape and annual increase of unhealthy grassland landscape. The LEH of grassland basically belongs to the state of slight deterioration. In the past 15 years, the spatial and temporal distribution characteristics of LEH in the study area are similar. This study provides scientific reference for ecological disturbance research, environmental protection, landscape planning, restoration and renovation of ecological environment in mining areas. At the same time, future research should integrate geological, hydrological, soil, vegetation, microorganisms, animals, climate, and other perspectives to study the impact of mining on landscape ecology deeply. Full article
(This article belongs to the Section Environmental Remote Sensing)
Show Figures

Graphical abstract

29 pages, 12156 KiB  
Article
BDS-3 Time Group Delay and Its Effect on Standard Point Positioning
by Peipei Dai, Yulong Ge, Weijin Qin and Xuhai Yang
Remote Sens. 2019, 11(15), 1819; https://doi.org/10.3390/rs11151819 - 03 Aug 2019
Cited by 17 | Viewed by 3059
Abstract
The development of the BeiDou navigation system (BDS) is divided into three phases: The demonstration system (BDS-1), the regional system (BDS-2) and the global BeiDou navigation system (BDS-3). At present, the construction of the global BeiDou navigation system (BDS-3) constellation network is progressing [...] Read more.
The development of the BeiDou navigation system (BDS) is divided into three phases: The demonstration system (BDS-1), the regional system (BDS-2) and the global BeiDou navigation system (BDS-3). At present, the construction of the global BeiDou navigation system (BDS-3) constellation network is progressing very smoothly. The signal design and functionality of BDS-3 are different from those of BDS-1 and BDS-2. The BDS-3 satellite not only broadcasts B1I (1561.098 MHz) and B3I (1268.52 MHz) signals but also broadcasts new signals B1C (1575.42 MHz) and B2a (1176.45 MHz). In this work, six tracking stations of the international GNSS monitoring and assessment system (iGMAS) were selected, and 41 consecutive days of observation data, were collected. To fully exploit the code observations of BDS-2 and BDS-3, the time group delay (TGD) correction model of BDS-2 and BDS-3 are described in detail. To further verify the efficacy of the broadcast TGD parameters in the broadcast ephemeris, the standard point positioning (SPP) of all the signals from BDS-2 and BDS-3 with and without TGD correction was studied. The experiments showed that the B1I SPP accuracy of BDS-2 was increased by approximately 50% in both the horizontal and vertical components, and B1I/B3I were improved by approximately 70% in the horizontal component and 47.4% in the vertical component with TGD correction. The root mean square (RMS) value of B1I and B1C from BDS-3 with TGD correction was enhanced by approximately 60%–70% in the horizontal component and by approximately 50% in the vertical component. The B2a-based SPP was increased by 60.2% and 64.4% in the east and north components, respectively, and the up component was increased by approximately 19.8%. For the B1I/B3I and B1C/B2a dual-frequency positioning accuracy with TGD correction, the improvement in the horizontal component ranges from 62.1% to 75.0%, and the vertical component was improved by approximately 45%. Furthermore, the positioning accuracy of the BDS-2 + BDS-3 combination constellation was obviously higher than that of BDS-2 or BDS-3. Full article
(This article belongs to the Special Issue Global Navigation Satellite Systems for Earth Observing System)
Show Figures

Graphical abstract

19 pages, 19285 KiB  
Article
Copernicus Imaging Microwave Radiometer (CIMR) Benefits for the Copernicus Level 4 Sea-Surface Salinity Processing Chain
by Daniele Ciani, Rosalia Santoleri, Gian Luigi Liberti, Catherine Prigent, Craig Donlon and Bruno Buongiorno Nardelli
Remote Sens. 2019, 11(15), 1818; https://doi.org/10.3390/rs11151818 - 03 Aug 2019
Cited by 7 | Viewed by 4295
Abstract
We present a study on the potential of the Copernicus Imaging Microwave Radiometer (CIMR) mission for the global monitoring of Sea-Surface Salinity (SSS) using Level-4 (gap-free) analysis processing. Space-based SSS are currently provided by the Soil Moisture and Ocean Salinity (SMOS) and Soil [...] Read more.
We present a study on the potential of the Copernicus Imaging Microwave Radiometer (CIMR) mission for the global monitoring of Sea-Surface Salinity (SSS) using Level-4 (gap-free) analysis processing. Space-based SSS are currently provided by the Soil Moisture and Ocean Salinity (SMOS) and Soil Moisture Active Passive (SMAP) satellites. However, there are no planned missions to guarantee continuity in the remote SSS measurements for the near future. The CIMR mission is in a preparatory phase with an expected launch in 2026. CIMR is focused on the provision of global coverage, high resolution sea-surface temperature (SST), SSS and sea-ice concentration observations. In this paper, we evaluate the mission impact within the Copernicus Marine Environment Monitoring Service (CMEMS) SSS processing chain. The CMEMS SSS operational products are based on a combination of in situ and satellite (SMOS) SSS and high-resolution SST information through a multivariate optimal interpolation. We demonstrate the potential of CIMR within the CMEMS SSS operational production after the SMOS era. For this purpose, we implemented an Observing System Simulation Experiment (OSSE) based on the CMEMS MERCATOR global operational model. The MERCATOR SSSs were used to generate synthetic in situ and CIMR SSS and, at the same time, they provided a reference gap-free SSS field. Using the optimal interpolation algorithm, we demonstrated that the combined use of in situ and CIMR observations improves the global SSS retrieval compared to a processing where only in situ observations are ingested. The improvements are observed in the 60% and 70% of the global ocean surface for the reconstruction of the SSS and of the SSS spatial gradients, respectively. Moreover, the study highlights the CIMR-based salinity patterns are more accurate both in the open ocean and in coastal areas. We conclude that CIMR can guarantee continuity for accurate monitoring of the ocean surface salinity from space. Full article
(This article belongs to the Special Issue Ten Years of Remote Sensing at Barcelona Expert Center)
Show Figures

Graphical abstract

16 pages, 1898 KiB  
Article
Deep Residual Squeeze and Excitation Network for Remote Sensing Image Super-Resolution
by Jun Gu, Xian Sun, Yue Zhang, Kun Fu and Lei Wang
Remote Sens. 2019, 11(15), 1817; https://doi.org/10.3390/rs11151817 - 03 Aug 2019
Cited by 64 | Viewed by 9003
Abstract
Recently, deep convolutional neural networks (DCNN) have obtained promising results in single image super-resolution (SISR) of remote sensing images. Due to the high complexity of remote sensing image distribution, most of the existing methods are not good enough for remote sensing image super-resolution. [...] Read more.
Recently, deep convolutional neural networks (DCNN) have obtained promising results in single image super-resolution (SISR) of remote sensing images. Due to the high complexity of remote sensing image distribution, most of the existing methods are not good enough for remote sensing image super-resolution. Enhancing the representation ability of the network is one of the critical factors to improve remote sensing image super-resolution performance. To address this problem, we propose a new SISR algorithm called a Deep Residual Squeeze and Excitation Network (DRSEN). Specifically, we propose a residual squeeze and excitation block (RSEB) as a building block in DRSEN. The RSEB fuses the input and its internal features of current block, and models the interdependencies and relationships between channels to enhance the representation power. At the same time, we improve the up-sampling module and the global residual pathway in the network to reduce the parameters of the network. Experiments on two public remote sensing datasets (UC Merced and NWPU-RESISC45) show that our DRSEN achieves better accuracy and visual improvements against most state-of-the-art methods. The DRSEN is beneficial for the progress in the remote sensing images super-resolution field. Full article
(This article belongs to the Special Issue Image Super-Resolution in Remote Sensing)
Show Figures

Figure 1

18 pages, 19991 KiB  
Article
Estimating and Examining the Sensitivity of Different Vegetation Indices to Fractions of Vegetation Cover at Different Scaling Grids for Early Stage Acacia Plantation Forests Using a Fixed-Wing UAS
by Kotaro Iizuka, Tsuyoshi Kato, Sisva Silsigia, Alifia Yuni Soufiningrum and Osamu Kozan
Remote Sens. 2019, 11(15), 1816; https://doi.org/10.3390/rs11151816 - 03 Aug 2019
Cited by 18 | Viewed by 4860
Abstract
Understanding the information on land conditions and especially green vegetation cover is important for monitoring ecosystem dynamics. The fraction of vegetation cover (FVC) is a key variable that can be used to observe vegetation cover trends. Conventionally, satellite data are utilized to compute [...] Read more.
Understanding the information on land conditions and especially green vegetation cover is important for monitoring ecosystem dynamics. The fraction of vegetation cover (FVC) is a key variable that can be used to observe vegetation cover trends. Conventionally, satellite data are utilized to compute these variables, although computations in regions such as the tropics can limit the amount of available observation information due to frequent cloud coverage. Unmanned aerial systems (UASs) have become increasingly prominent in recent research and can remotely sense using the same methods as satellites but at a lower altitude. UASs are not limited by clouds and have a much higher resolution. This study utilizes a UAS to determine the emerging trends for FVC estimates at an industrial plantation site in Indonesia, which utilizes fast-growing Acacia trees that can rapidly change the land conditions. First, the UAS was utilized to collect high-resolution RGB imagery and multispectral images for the study area. The data were used to develop general land use/land cover (LULC) information for the site. Multispectral data were converted to various vegetation indices, and within the determined resolution grid (5, 10, 30 and 60 m), the fraction of each LULC type was analyzed for its correlation between the different vegetation indices (Vis). Finally, a simple empirical model was developed to estimate the FVC from the UAS data. The results show the correlation between the FVC (acacias) and different Vis ranging from R2 = 0.66–0.74, 0.76–0.8, 0.84–0.89 and 0.93–0.94 for 5, 10, 30 and 60 m grid resolutions, respectively. This study indicates that UAS-based FVC estimations can be used for observing fast-growing acacia trees at a fine scale resolution, which may assist current restoration programs in Indonesia. Full article
(This article belongs to the Special Issue UAVs for Vegetation Monitoring)
Show Figures

Graphical abstract

17 pages, 6323 KiB  
Article
Super-Resolution Land Cover Mapping Based on the Convolutional Neural Network
by Yuanxin Jia, Yong Ge, Yuehong Chen, Sanping Li, Gerard B.M. Heuvelink and Feng Ling
Remote Sens. 2019, 11(15), 1815; https://doi.org/10.3390/rs11151815 - 02 Aug 2019
Cited by 35 | Viewed by 5117
Abstract
Super-resolution mapping (SRM) is used to obtain fine-scale land cover maps from coarse remote sensing images. Spatial attraction, geostatistics, and using prior geographic information are conventional approaches used to derive fine-scale land cover maps. As the convolutional neural network (CNN) has been shown [...] Read more.
Super-resolution mapping (SRM) is used to obtain fine-scale land cover maps from coarse remote sensing images. Spatial attraction, geostatistics, and using prior geographic information are conventional approaches used to derive fine-scale land cover maps. As the convolutional neural network (CNN) has been shown to be effective in capturing the spatial characteristics of geographic objects and extrapolating calibrated methods to other study areas, it may be a useful approach to overcome limitations of current SRM methods. In this paper, a new SRM method based on the CNN ( SRM CNN ) is proposed and tested. Specifically, an encoder-decoder CNN is used to model the nonlinear relationship between coarse remote sensing images and fine-scale land cover maps. Two real-image experiments were conducted to analyze the effectiveness of the proposed method. The results demonstrate that the overall accuracy of the proposed SRM CNN method was 3% to 5% higher than that of two existing SRM methods. Moreover, the proposed SRM CNN method was validated by visualizing output features and analyzing the performance of different geographic objects. Full article
(This article belongs to the Special Issue New Advances on Sub-pixel Processing: Unmixing and Mapping Methods)
Show Figures

Graphical abstract

19 pages, 10565 KiB  
Article
Coastal Dune Vegetation Mapping Using a Multispectral Sensor Mounted on an UAS
by Chen Suo, Eugene McGovern and Alan Gilmer
Remote Sens. 2019, 11(15), 1814; https://doi.org/10.3390/rs11151814 - 02 Aug 2019
Cited by 20 | Viewed by 4716
Abstract
Vegetation mapping, identifying the type and distribution of plant species, is important for analysing vegetation dynamics, quantifying spatial patterns of vegetation evolution, analysing the effects of environmental changes and predicting spatial patterns of species diversity. Such analysis can contribute to the development of [...] Read more.
Vegetation mapping, identifying the type and distribution of plant species, is important for analysing vegetation dynamics, quantifying spatial patterns of vegetation evolution, analysing the effects of environmental changes and predicting spatial patterns of species diversity. Such analysis can contribute to the development of targeted land management actions that maintain biodiversity and ecological functions. This paper presents a methodology for 3D vegetation mapping of a coastal dune complex using a multispectral camera mounted on an unmanned aerial system with particular reference to the Buckroney dune complex in Co. Wicklow, Ireland. Unmanned aerial systems (UAS), also known as unmanned aerial vehicles (UAV) or drones, have enabled high-resolution and high-accuracy ground-based data to be gathered quickly and easily on-site. The Sequoia multispectral sensor used in this study has green, red, red edge and near-infrared wavebands, and a regular camer with red, green and blue wavebands (RGB camera), to capture both visible and near-infrared (NIR) imagery of the land surface. The workflow of 3D vegetation mapping of the study site included establishing coordinated ground control points, planning the flight mission and camera parameters, acquiring the imagery, processing the image data and performing features classification. The data processing outcomes included an orthomosaic model, a 3D surface model and multispectral imagery of the study site, in the Irish Transverse Mercator (ITM) coordinate system. The planimetric resolution of the RGB sensor-based outcomes was 0.024 m while multispectral sensor-based outcomes had a planimetric resolution of 0.096 m. High-resolution vegetation mapping was successfully generated from these data processing outcomes. There were 235 sample areas (1 m × 1 m) used for the accuracy assessment of the classification of the vegetation mapping. Feature classification was conducted using nine different classification strategies to examine the efficiency of multispectral sensor data for vegetation and contiguous land cover mapping. The nine classification strategies included combinations of spectral bands and vegetation indices. Results show classification accuracies, based on the nine different classification strategies, ranging from 52% to 75%. Full article
Show Figures

Graphical abstract

20 pages, 6756 KiB  
Article
Integration of Ground-Based Remote-Sensing and In Situ Multidisciplinary Monitoring Data to Analyze the Eruptive Activity of Stromboli Volcano in 2017–2018
by Flora Giudicepietro, Sonia Calvari, Salvatore Alparone, Francesca Bianco, Alessandro Bonaccorso, Valentina Bruno, Teresa Caputo, Antonio Cristaldi, Luca D’Auria, Walter De Cesare, Bellina Di Lieto, Antonietta M. Esposito, Salvatore Gambino, Salvatore Inguaggiato, Giovanni Macedonio, Marcello Martini, Mario Mattia, Massimo Orazi, Antonio Paonita, Rosario Peluso, Eugenio Privitera, Pierdomenico Romano, Giovanni Scarpato, Anna Tramelli and Fabio Vitaadd Show full author list remove Hide full author list
Remote Sens. 2019, 11(15), 1813; https://doi.org/10.3390/rs11151813 - 02 Aug 2019
Cited by 23 | Viewed by 5931
Abstract
After a period of mild eruptive activity, Stromboli showed between 2017 and 2018 a reawakening phase, with an increase in the eruptive activity starting in May 2017. The alert level of the volcano was raised from “green” (base) to “yellow” (attention) on 7 [...] Read more.
After a period of mild eruptive activity, Stromboli showed between 2017 and 2018 a reawakening phase, with an increase in the eruptive activity starting in May 2017. The alert level of the volcano was raised from “green” (base) to “yellow” (attention) on 7 December 2017, and a small lava overflowed the crater rim on 15 December 2017. Between July 2017 and August 2018 the monitoring networks recorded nine major explosions, which are a serious hazard for Stromboli because they affect the summit area, crowded by tourists. We studied the 2017–2018 eruptive phase through the analysis of multidisciplinary data comprising thermal video-camera images, seismic, geodetic and geochemical data. We focused on the major explosion mechanism analyzing the well-recorded 1 December 2017 major explosion as a case study. We found that the 2017–2018 eruptive phase is consistent with a greater gas-rich magma supply in the shallow system. Furthermore, through the analysis of the case study major explosion, we identified precursory phases in the strainmeter and seismic data occurring 77 and 38 s before the explosive jet reached the eruptive vent, respectively. On the basis of these short-term precursors, we propose an automatic timely alarm system for major explosions at Stromboli volcano. Full article
Show Figures

Graphical abstract

21 pages, 6667 KiB  
Article
Early Detection of Invasive Exotic Trees Using UAV and Manned Aircraft Multispectral and LiDAR Data
by Jonathan P. Dash, Michael S. Watt, Thomas S. H. Paul, Justin Morgenroth and Grant D. Pearse
Remote Sens. 2019, 11(15), 1812; https://doi.org/10.3390/rs11151812 - 02 Aug 2019
Cited by 53 | Viewed by 5905
Abstract
Exotic conifers can provide significant ecosystem services, but in some environments, they have become invasive and threaten indigenous ecosystems. In New Zealand, this phenomenon is of considerable concern as the area occupied by invasive exotic trees is large and increasing rapidly. Remote sensing [...] Read more.
Exotic conifers can provide significant ecosystem services, but in some environments, they have become invasive and threaten indigenous ecosystems. In New Zealand, this phenomenon is of considerable concern as the area occupied by invasive exotic trees is large and increasing rapidly. Remote sensing methods offer a potential means of identifying and monitoring land infested by these trees, enabling managers to efficiently allocate resources for their control. In this study, we sought to develop methods for remote detection of exotic invasive trees, namely Pinus sylvestris and P. ponderosa. Critically, the study aimed to detect these species prior to the onset of maturity and coning as this is important for preventing further spread. In the study environment in New Zealand’s South Island, these species reach maturity and begin bearing cones at a young age. As such, detection of these smaller individuals requires specialist methods and very high-resolution remote sensing data. We examined the efficacy of classifiers developed using two machine learning algorithms with multispectral and laser scanning data collected from two platforms—manned aircraft and unmanned aerial vehicles (UAV). The study focused on a localized conifer invasion originating from a multi-species pine shelter belt in a grassland environment. This environment provided a useful means of defining the detection thresholds of the methods and technologies employed. An extensive field dataset including over 17,000 trees (height range = 1 cm to 476 cm) was used as an independent validation dataset for the detection methods developed. We found that data from both platforms and using both logistic regression and random forests for classification provided highly accurate (kappa < 0.996 ) detection of invasive conifers. Our analysis showed that the data from both UAV and manned aircraft was useful for detecting trees down to 1 m in height and therefore shorter than 99.3% of the coning individuals in the study dataset. We also explored the relative contribution of both multispectral and airborne laser scanning (ALS) data in the detection of invasive trees through fitting classification models with different combinations of predictors and found that the most useful models included data from both sensors. However, the combination of ALS and multispectral data did not significantly improve classification accuracy. We believe that this was due to the simplistic vegetation and terrain structure in the study site that resulted in uncomplicated separability of invasive conifers from other vegetation. This study provides valuable new knowledge of the efficacy of detecting invasive conifers prior to the onset of coning using high-resolution data from UAV and manned aircraft. This will be an important tool in managing the spread of these important invasive plants. Full article
(This article belongs to the Section Environmental Remote Sensing)
Show Figures

Figure 1

36 pages, 10574 KiB  
Article
New Strategies for Time Delay Estimation during System Calibration for UAV-Based GNSS/INS-Assisted Imaging Systems
by Lisa LaForest, Seyyed Meghdad Hasheminasab, Tian Zhou, John Evan Flatt and Ayman Habib
Remote Sens. 2019, 11(15), 1811; https://doi.org/10.3390/rs11151811 - 01 Aug 2019
Cited by 18 | Viewed by 4117
Abstract
The need for accurate 3D spatial information is growing rapidly in many of today’s key industries, such as precision agriculture, emergency management, infrastructure monitoring, and defense. Unmanned aerial vehicles (UAVs) equipped with global navigation satellite systems/inertial navigation systems (GNSS/INS) and consumer-grade digital imaging [...] Read more.
The need for accurate 3D spatial information is growing rapidly in many of today’s key industries, such as precision agriculture, emergency management, infrastructure monitoring, and defense. Unmanned aerial vehicles (UAVs) equipped with global navigation satellite systems/inertial navigation systems (GNSS/INS) and consumer-grade digital imaging sensors are capable of providing accurate 3D spatial information at a relatively low cost. However, with the use of consumer-grade sensors, system calibration is critical for accurate 3D reconstruction. In this study, ‘consumer-grade’ refers to cameras that require system calibration by the user instead of by the manufacturer or other high-end laboratory settings, as well as relatively low-cost GNSS/INS units. In addition to classical spatial system calibration, many consumer-grade sensors also need temporal calibration for accurate 3D reconstruction. This study examines the accuracy impact of time delay in the synchronization between the GNSS/INS unit and cameras on-board UAV-based mapping systems. After reviewing existing strategies, this study presents two approaches (direct and indirect) to correct for time delay between GNSS/INS recorded event markers and actual time of image exposure. Our results show that both approaches are capable of handling and correcting this time delay, with the direct approach being more rigorous. When a time delay exists and the direct or indirect approach is applied, horizontal accuracy of 1–3 times the ground sampling distance (GSD) can be achieved without either the use of any ground control points (GCPs) or adjusting the original GNSS/INS trajectory information. Full article
Show Figures

Graphical abstract

26 pages, 13271 KiB  
Article
A Study of Vertical Structures and Microphysical Characteristics of Different Convective Cloud–Precipitation Types Using Ka-Band Millimeter Wave Radar Measurements
by Jiafeng Zheng, Peiwen Zhang, Liping Liu, Yanxia Liu and Yuzhang Che
Remote Sens. 2019, 11(15), 1810; https://doi.org/10.3390/rs11151810 - 01 Aug 2019
Cited by 5 | Viewed by 4544
Abstract
Millimeter wave cloud radar (MMCR) is one of the primary instruments employed to observe cloud–precipitation. With appropriate data processing, measurements of the Doppler spectra, spectral moments, and retrievals can be used to study the physical processes of cloud–precipitation. This study mainly analyzed the [...] Read more.
Millimeter wave cloud radar (MMCR) is one of the primary instruments employed to observe cloud–precipitation. With appropriate data processing, measurements of the Doppler spectra, spectral moments, and retrievals can be used to study the physical processes of cloud–precipitation. This study mainly analyzed the vertical structures and microphysical characteristics of different kinds of convective cloud–precipitation in South China during the pre-flood season using a vertical pointing Ka-band MMCR. Four kinds of convection, namely, multi-cell, isolated-cell, convective–stratiform mixed, and warm-cell convection, are discussed herein. The results show that the multi-cell and convective–stratiform mixed convections had similar vertical structures, and experienced nearly the same microphysical processes in terms of particle phase change, particle size distribution, hydrometeor growth, and breaking. A forward pattern was proposed to specifically characterize the vertical structure and provide radar spectra models reflecting the different microphysical and dynamic features and variations in different parts of the cloud body. Vertical air motion played key roles in the microphysical processes of the isolated- and warm-cell convections, and deeply affected the ground rainfall properties. Stronger, thicker, and slanted updrafts caused heavier showers with stronger rain rates and groups of larger raindrops. The microphysical parameters for the warm-cell cloud–precipitation were retrieved from the radar data and further compared with the ground-measured results from a disdrometer. The comparisons indicated that the radar retrievals were basically reliable; however, the radar signal weakening caused biases to some extent, especially for the particle number concentration. Note that the differences in sensitivity and detectable height of the two instruments also contributed to the compared deviation. Full article
(This article belongs to the Special Issue Radar Meteorology)
Show Figures

Graphical abstract

24 pages, 23283 KiB  
Article
Estimating Leaf Area Index with a New Vegetation Index Considering the Influence of Rice Panicles
by Jiaoyang He, Ni Zhang, Xi Su, Jingshan Lu, Xia Yao, Tao Cheng, Yan Zhu, Weixing Cao and Yongchao Tian
Remote Sens. 2019, 11(15), 1809; https://doi.org/10.3390/rs11151809 - 01 Aug 2019
Cited by 31 | Viewed by 5136
Abstract
The emergence of rice panicle substantially changes the spectral reflectance of rice canopy and, as a result, decreases the accuracy of leaf area index (LAI) that was derived from vegetation indices (VIs). From a four-year field experiment with using rice varieties, nitrogen (N) [...] Read more.
The emergence of rice panicle substantially changes the spectral reflectance of rice canopy and, as a result, decreases the accuracy of leaf area index (LAI) that was derived from vegetation indices (VIs). From a four-year field experiment with using rice varieties, nitrogen (N) rates, and planting densities, the spectral reflectance characteristics of panicles and the changes in canopy reflectance after panicle removal were investigated. A rice “panicle line”—graphical relationship between red-edge and near-infrared bands was constructed by using the near-infrared and red-edge spectral reflectance of rice panicles. Subsequently, a panicle-adjusted renormalized difference vegetation index (PRDVI) that was based on the “panicle line” and the renormalized difference vegetation index (RDVI) was developed to reduce the effects of rice panicles and background. The results showed that the effects of rice panicles on canopy reflectance were concentrated in the visible region and the near-infrared region. The red band (670 nm) was the most affected by panicles, while the red-edge bands (720–740 nm) were less affected. In addition, a combination of near-infrared and red-edge bands was for the one that best predicted LAI, and the difference vegetation index (DI) (976, 733) performed the best, although it had relatively low estimation accuracy (R2 = 0.60, RMSE = 1.41 m2/m2). From these findings, correcting the near-infrared band in the RDVI by the panicle adjustment factor (θ) developed the PRDVI, which was obtained while using the “panicle line”, and the less-affected red-edge band replaced the red band. Verification data from an unmanned aerial vehicle (UAV) showed that the PRDVI could minimize the panicle and background influence and was more sensitive to LAI (R2 = 0.77; RMSE = 1.01 m2/m2) than other VIs during the post-heading stage. Moreover, of all the assessed VIs, the PRDVI yielded the highest R2 (0.71) over the entire growth period, with an RMSE of 1.31 (m2/m2). These results suggest that the PRDVI is an efficient and suitable LAI estimation index. Full article
(This article belongs to the Section Remote Sensing in Agriculture and Vegetation)
Show Figures

Figure 1

14 pages, 3074 KiB  
Letter
Are There Sufficient Landsat Observations for Retrospective and Continuous Monitoring of Land Cover Changes in China?
by Yan Zhou, Jinwei Dong, Jiyuan Liu, Graciela Metternicht, Wei Shen, Nanshan You, Guosong Zhao and Xiangming Xiao
Remote Sens. 2019, 11(15), 1808; https://doi.org/10.3390/rs11151808 - 01 Aug 2019
Cited by 21 | Viewed by 4814
Abstract
Unprecedented human-induced land cover changes happened in China after the Reform and Opening-up in 1978, matching with the era of Landsat satellite series. However, it is still unknown whether Landsat data can effectively support retrospective analysis of land cover changes in China over [...] Read more.
Unprecedented human-induced land cover changes happened in China after the Reform and Opening-up in 1978, matching with the era of Landsat satellite series. However, it is still unknown whether Landsat data can effectively support retrospective analysis of land cover changes in China over the past four decades. Here, for the first time, we conduct a systematic investigation on the availability of Landsat data in China, targeting its application for retrospective and continuous monitoring of land cover changes. The latter is significant to assess impact of land cover changes, and consequences of past land policy and management interventions. The total and valid observations (excluding clouds, cloud shadows, and terrain shadows) from Landsat 5/7/8 from 1984 to 2017 were quantified at pixel scale, based on the cloud computing platform Google Earth Engine (GEE). The results show higher intensity of Landsat observation in the northern part of China as compared to the southern part. The study provides an overall picture of Landsat observations suitable for satellite-based annual land cover monitoring over the entire country. We uncover that two sub-regions of China (i.e., Northeast China-Inner Mongolia-Northwest China, and North China Plain) have sufficient valid observations for retrospective analysis of land cover over 30 years (1987–2017) at an annual interval; whereas the Middle-Lower Yangtze Plain (MLYP) and Xinjiang (XJ) have sufficient observations for annual analyses for the periods 1989–2017 and 2004–2017, respectively. Retrospective analysis of land cover is possible only at a two-year time interval in South China (SC) for the years 1988–2017, Xinjiang (XJ) for the period 1992–2003, and the Tibetan Plateau (TP) during 2004–2017. For the latter geographic regions, land cover dynamics can be analyzed only at a three-year interval prior to 2004. Our retrospective analysis suggest that Landsat-based analysis of land cover dynamics at an annual interval for the whole country is not feasible; instead, national monitoring at two- or three-year intervals could be achievable. This study provides a preliminary assessment of data availability, targeting future continuous land cover monitoring in China; and the code is released to the public to facilitate similar data inventory in other regions of the world. Full article
Show Figures

Graphical abstract

Previous Issue
Next Issue
Back to TopTop