
A Review of Photovoltaic Module Failure and Degradation Mechanisms: Causes and Detection Techniques


Abstract
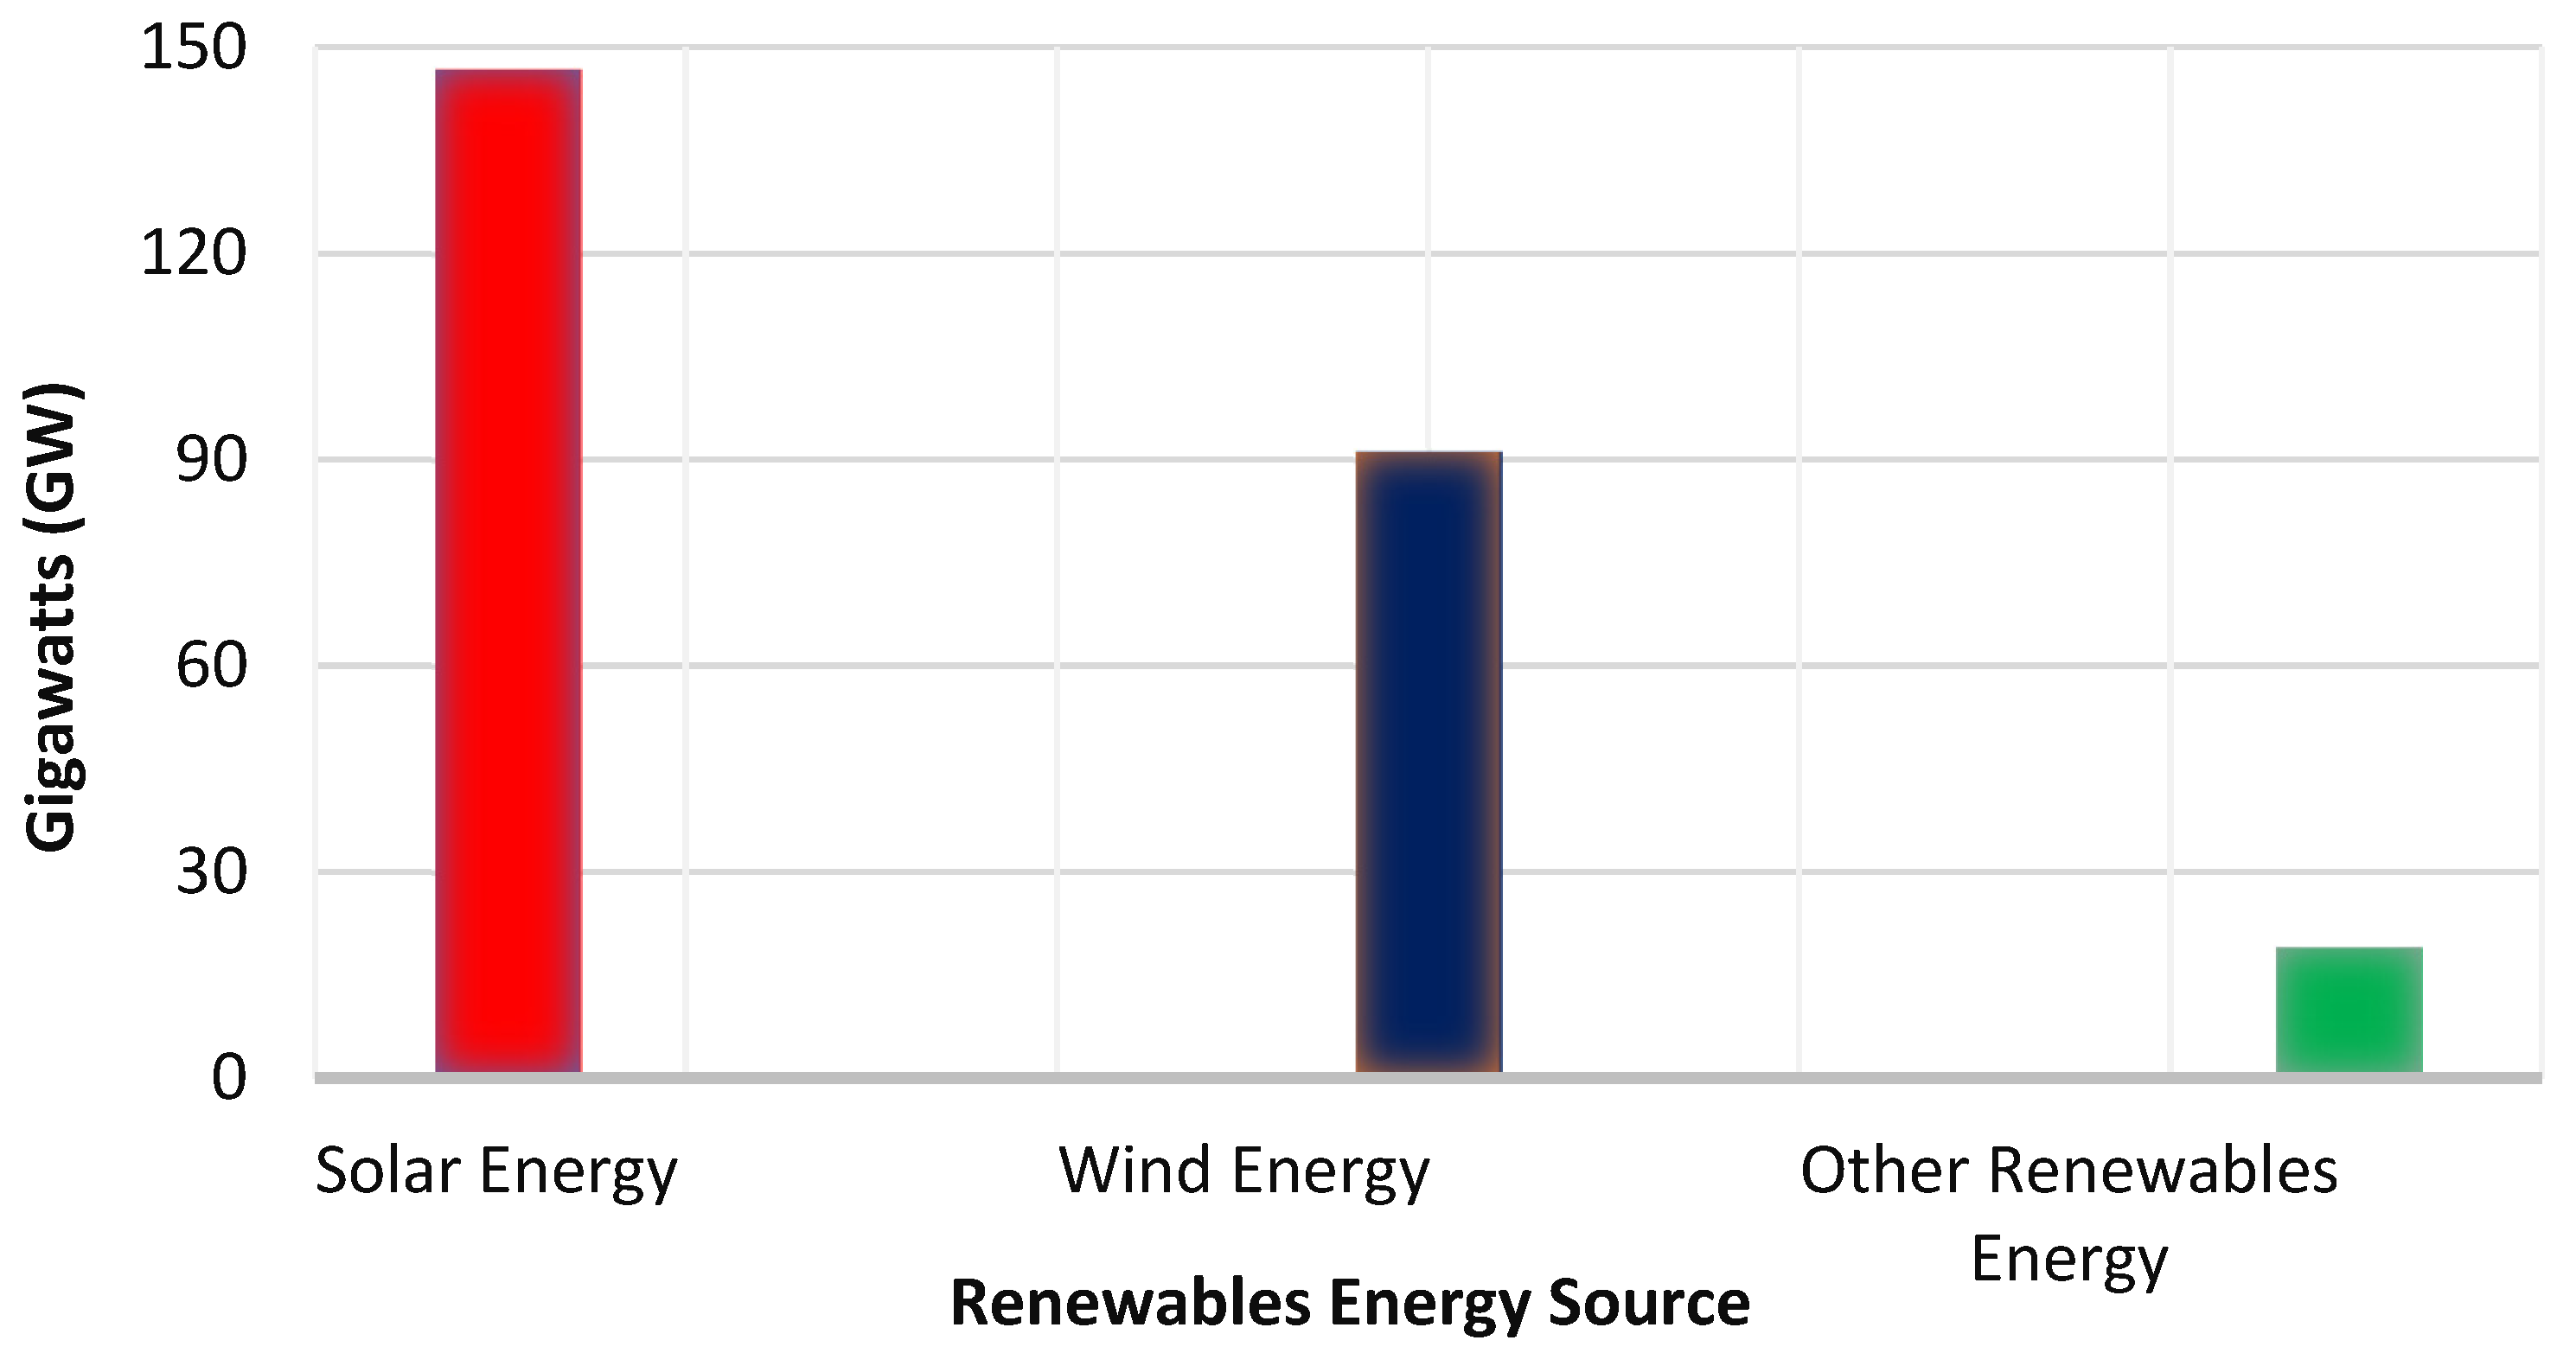
:1. Introduction
1.1. Degradation Rate
1.2. Definition of PV Failure
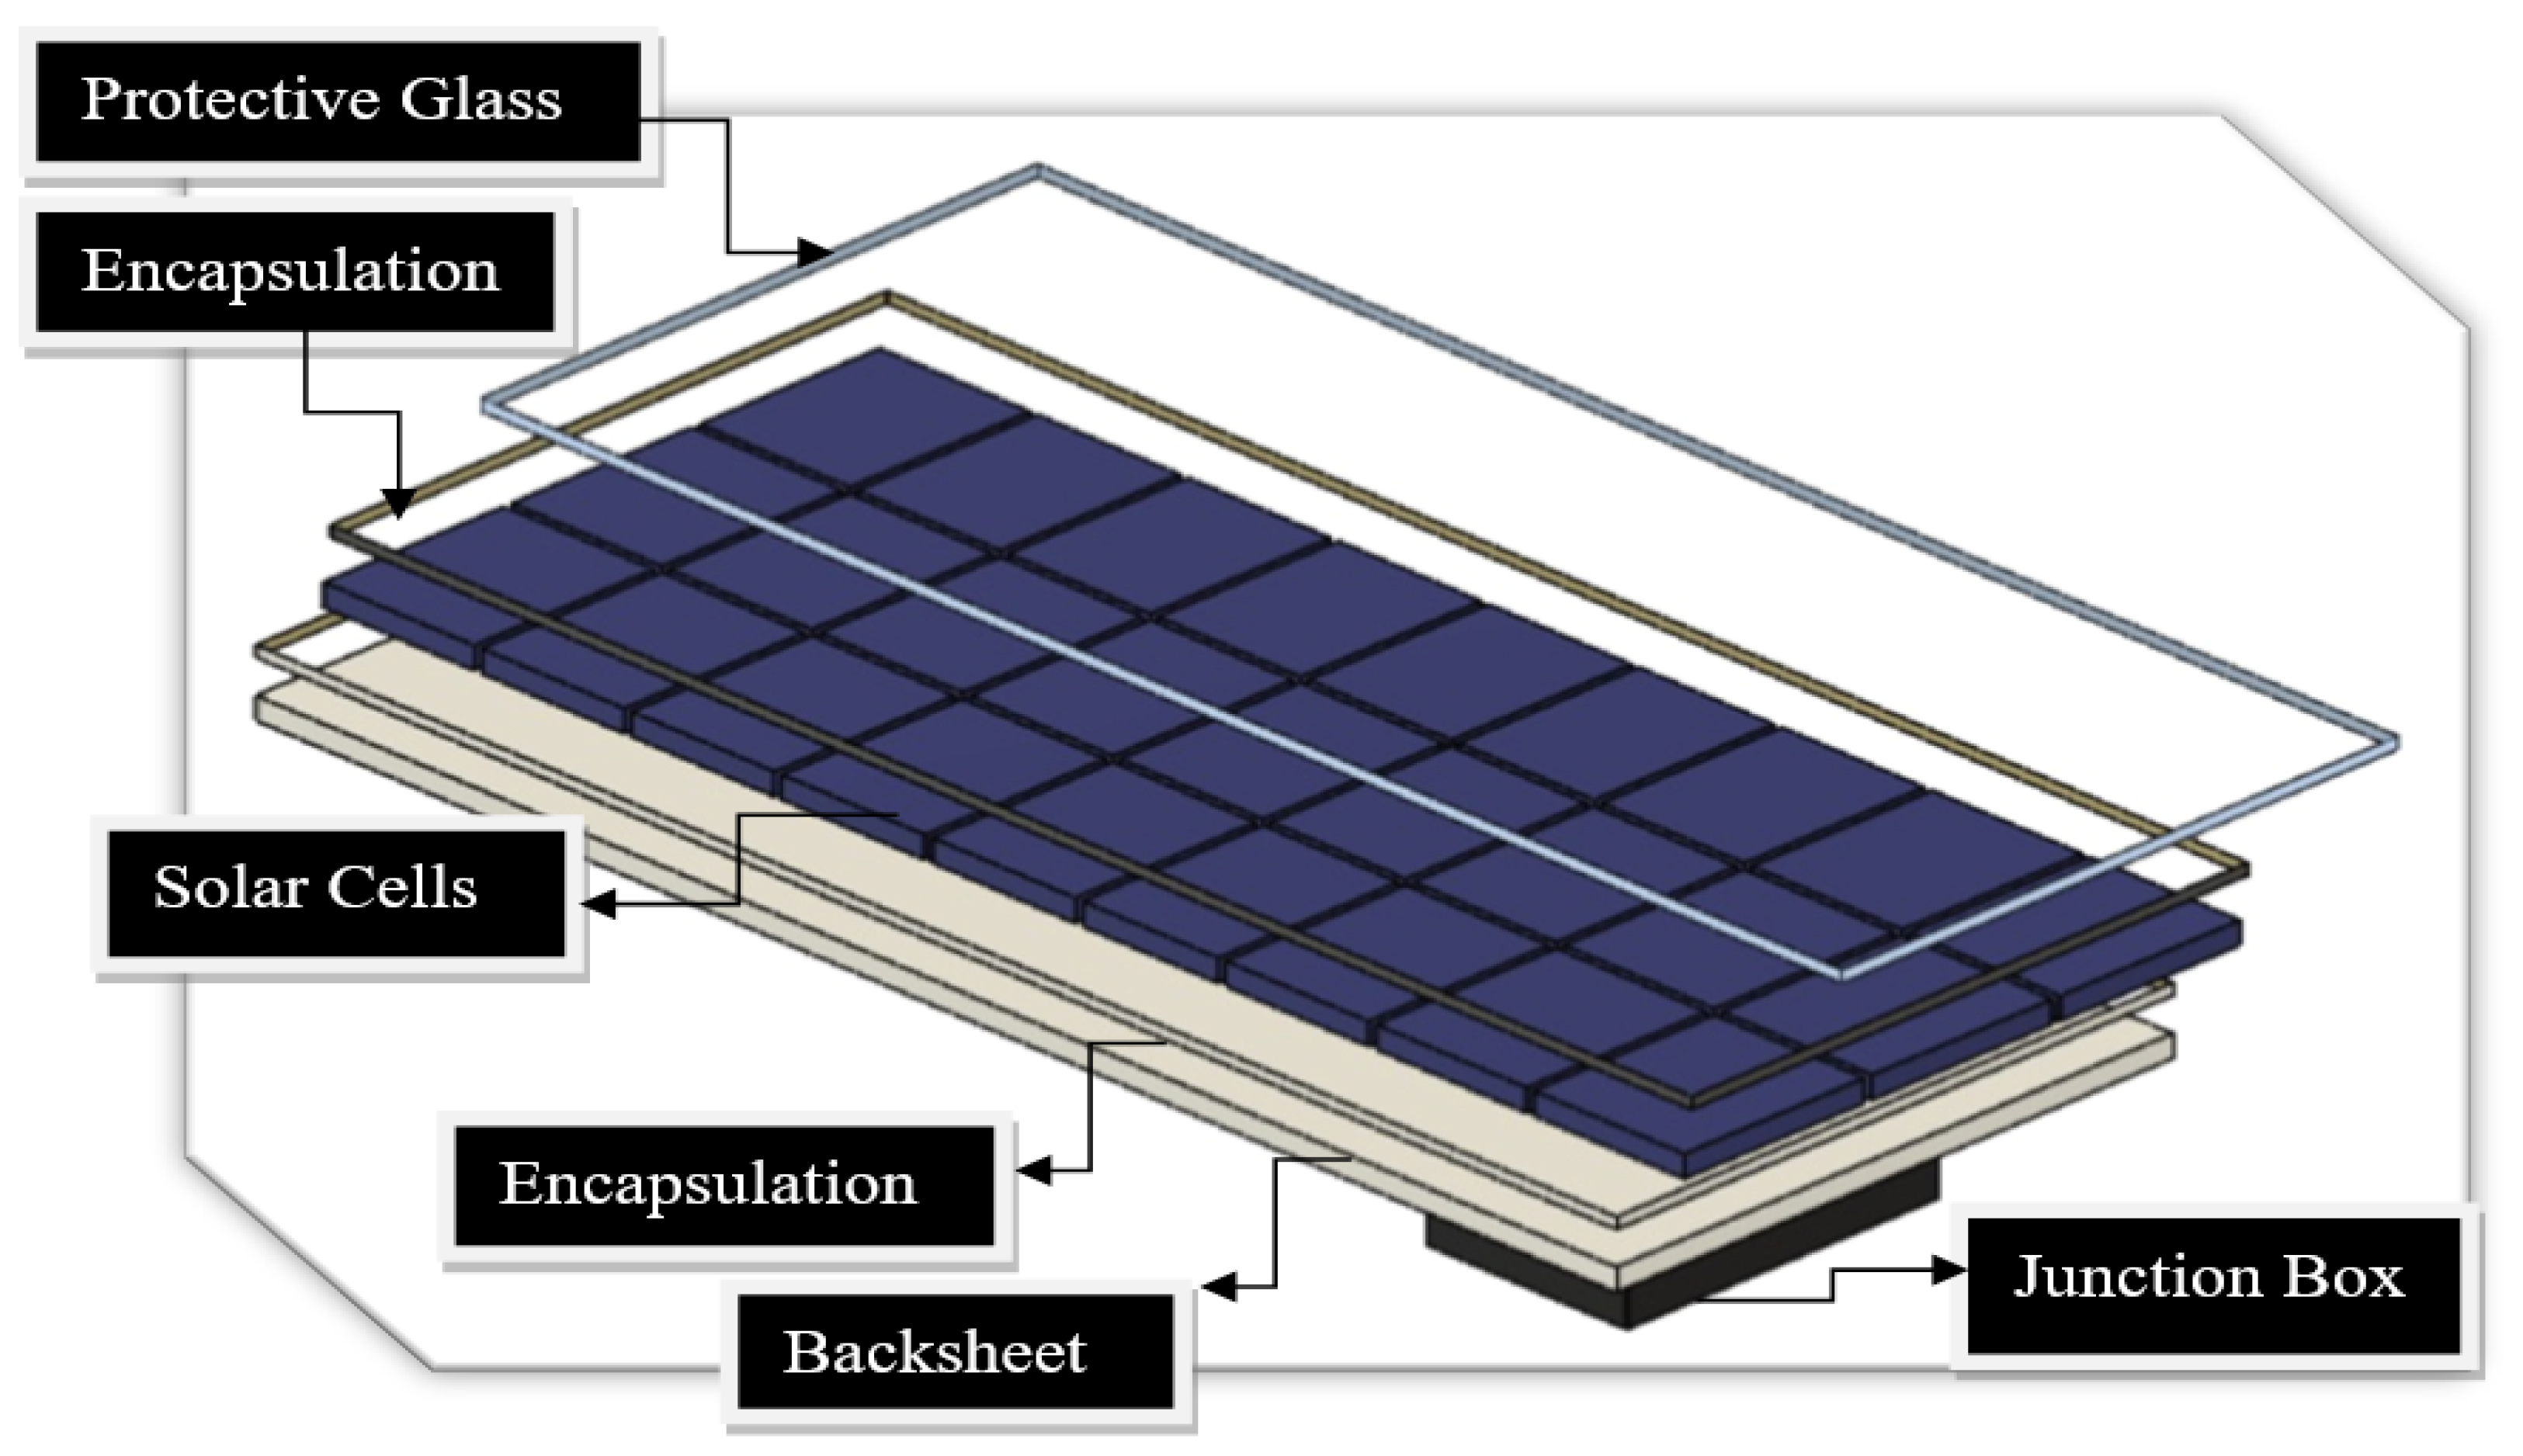
2. Failures of the PV Module Components: Discussion and Observations
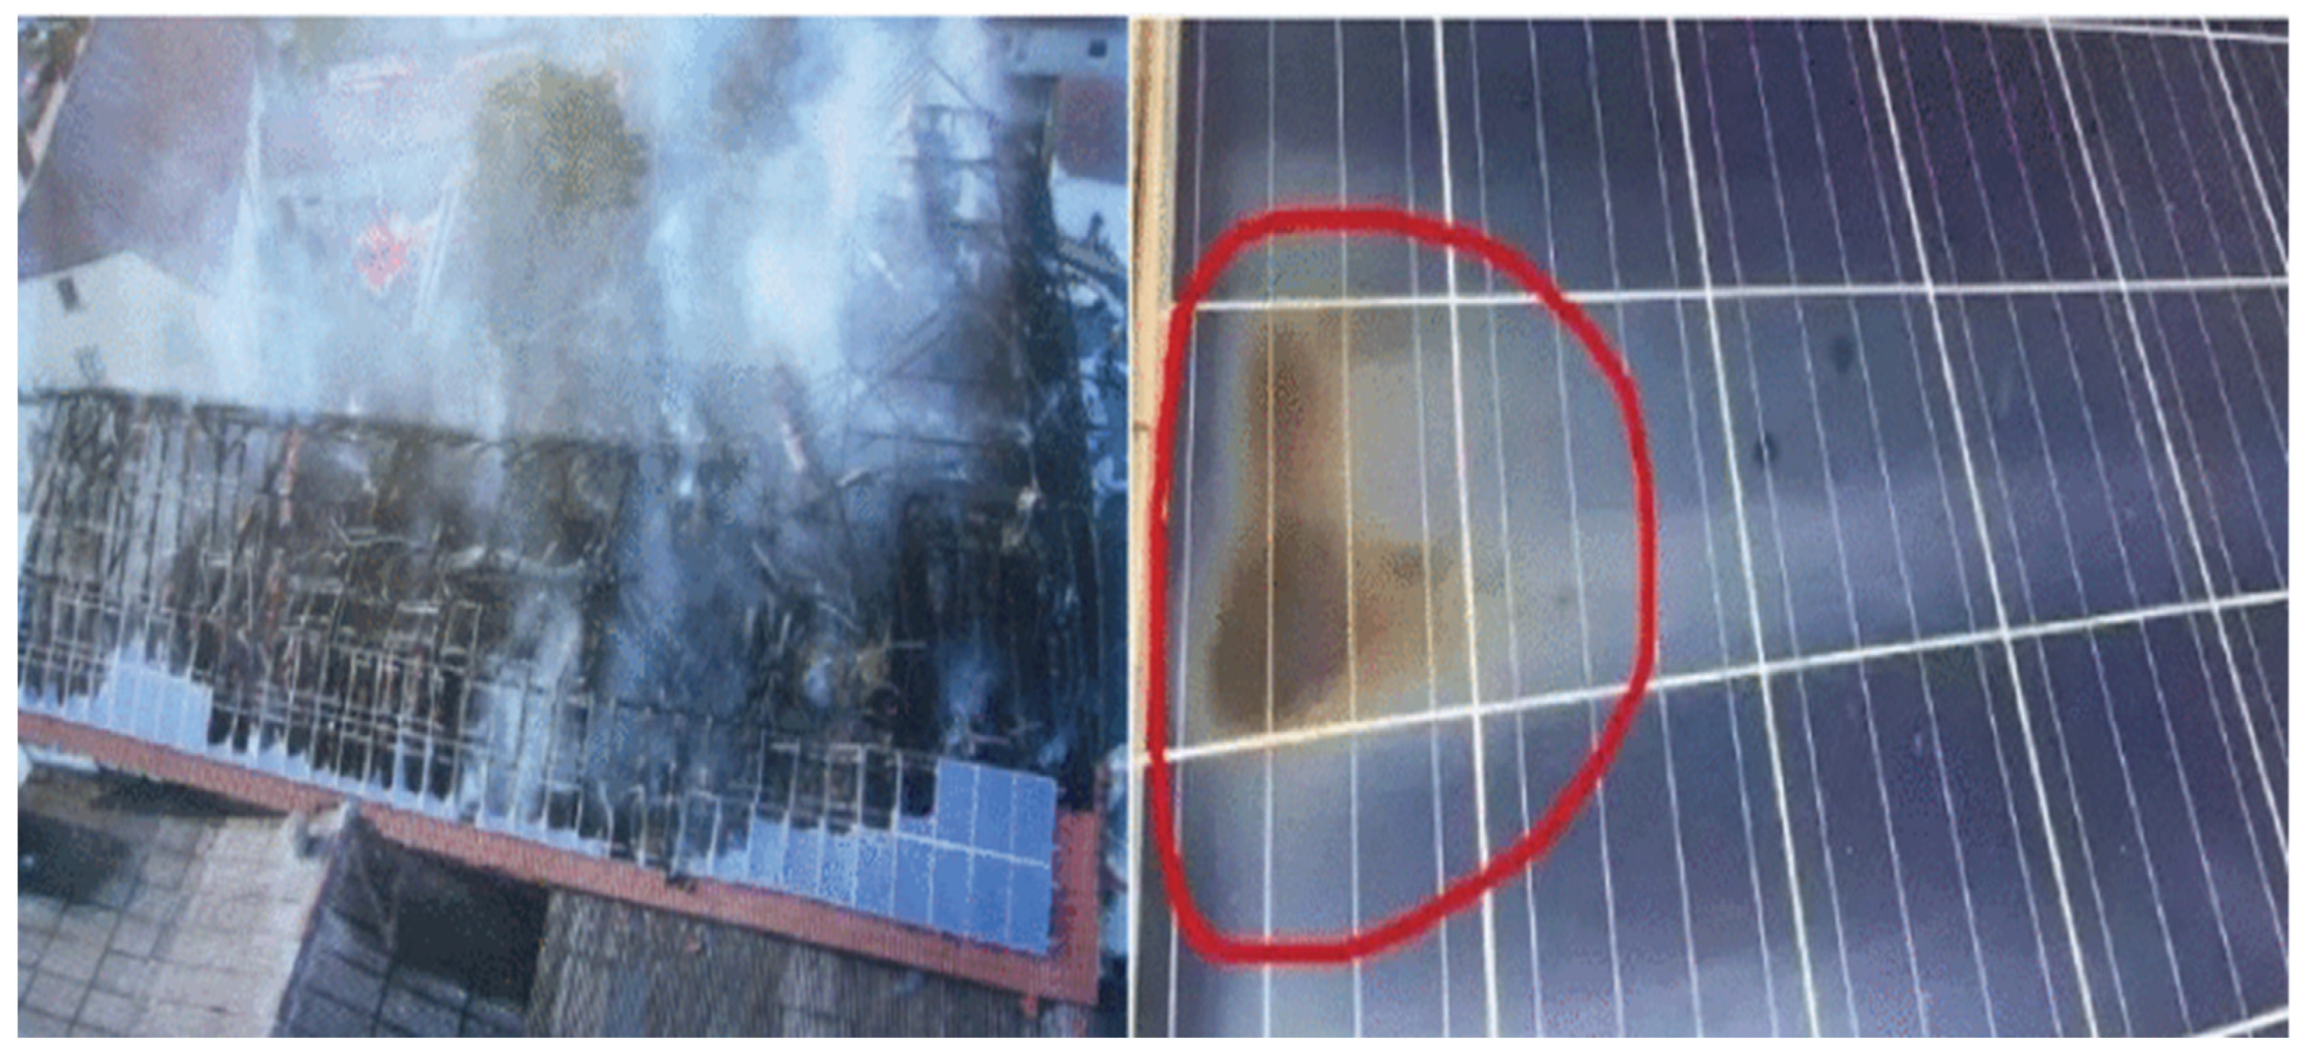
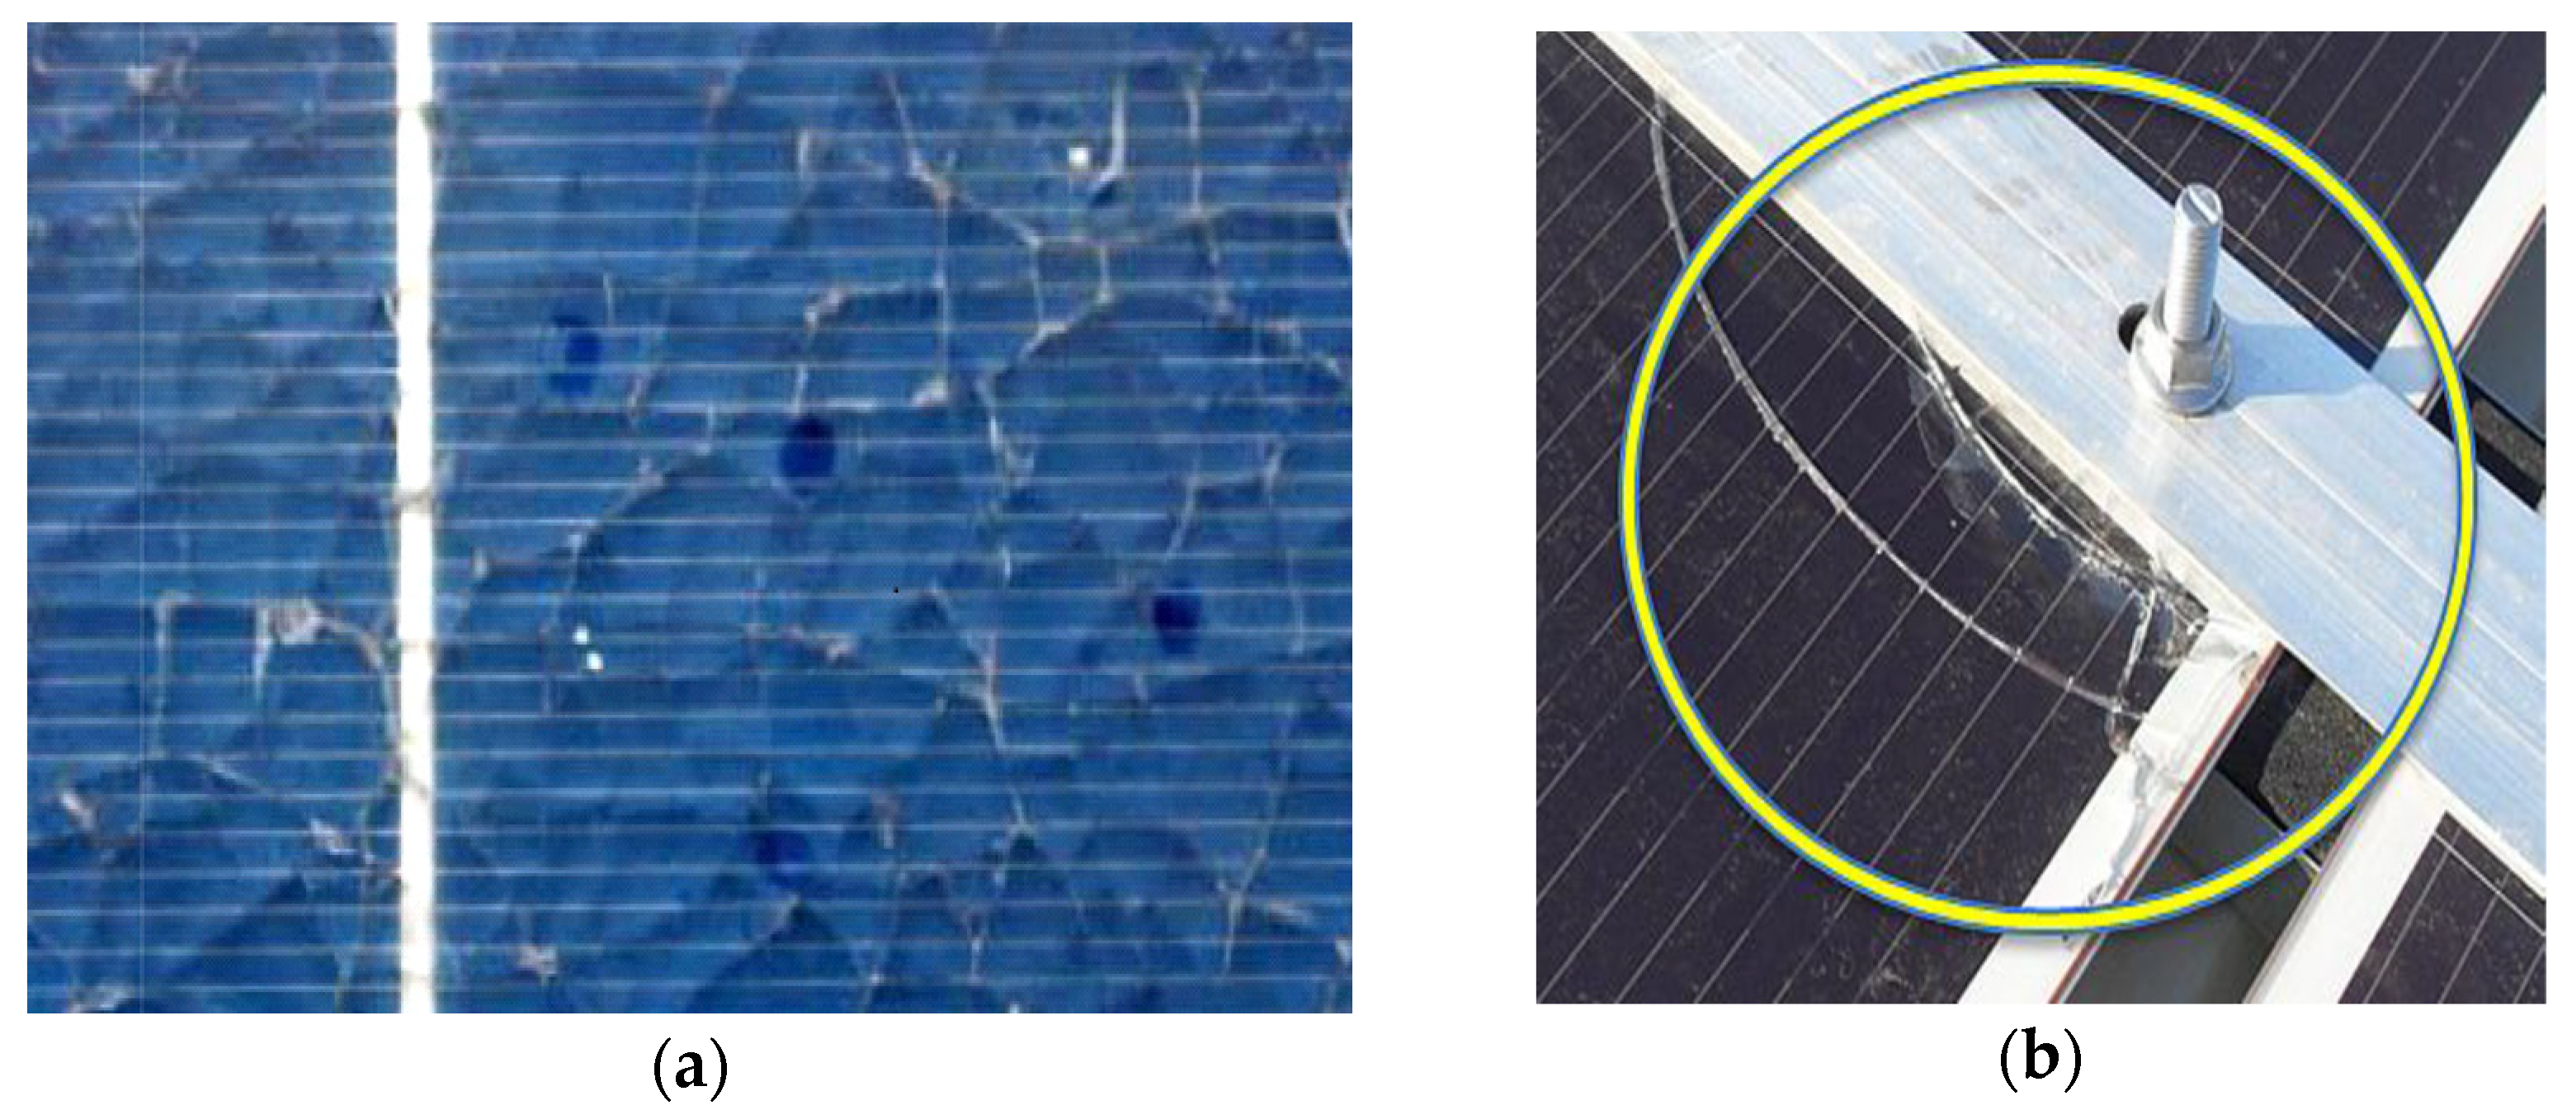
2.1. Protective Glass
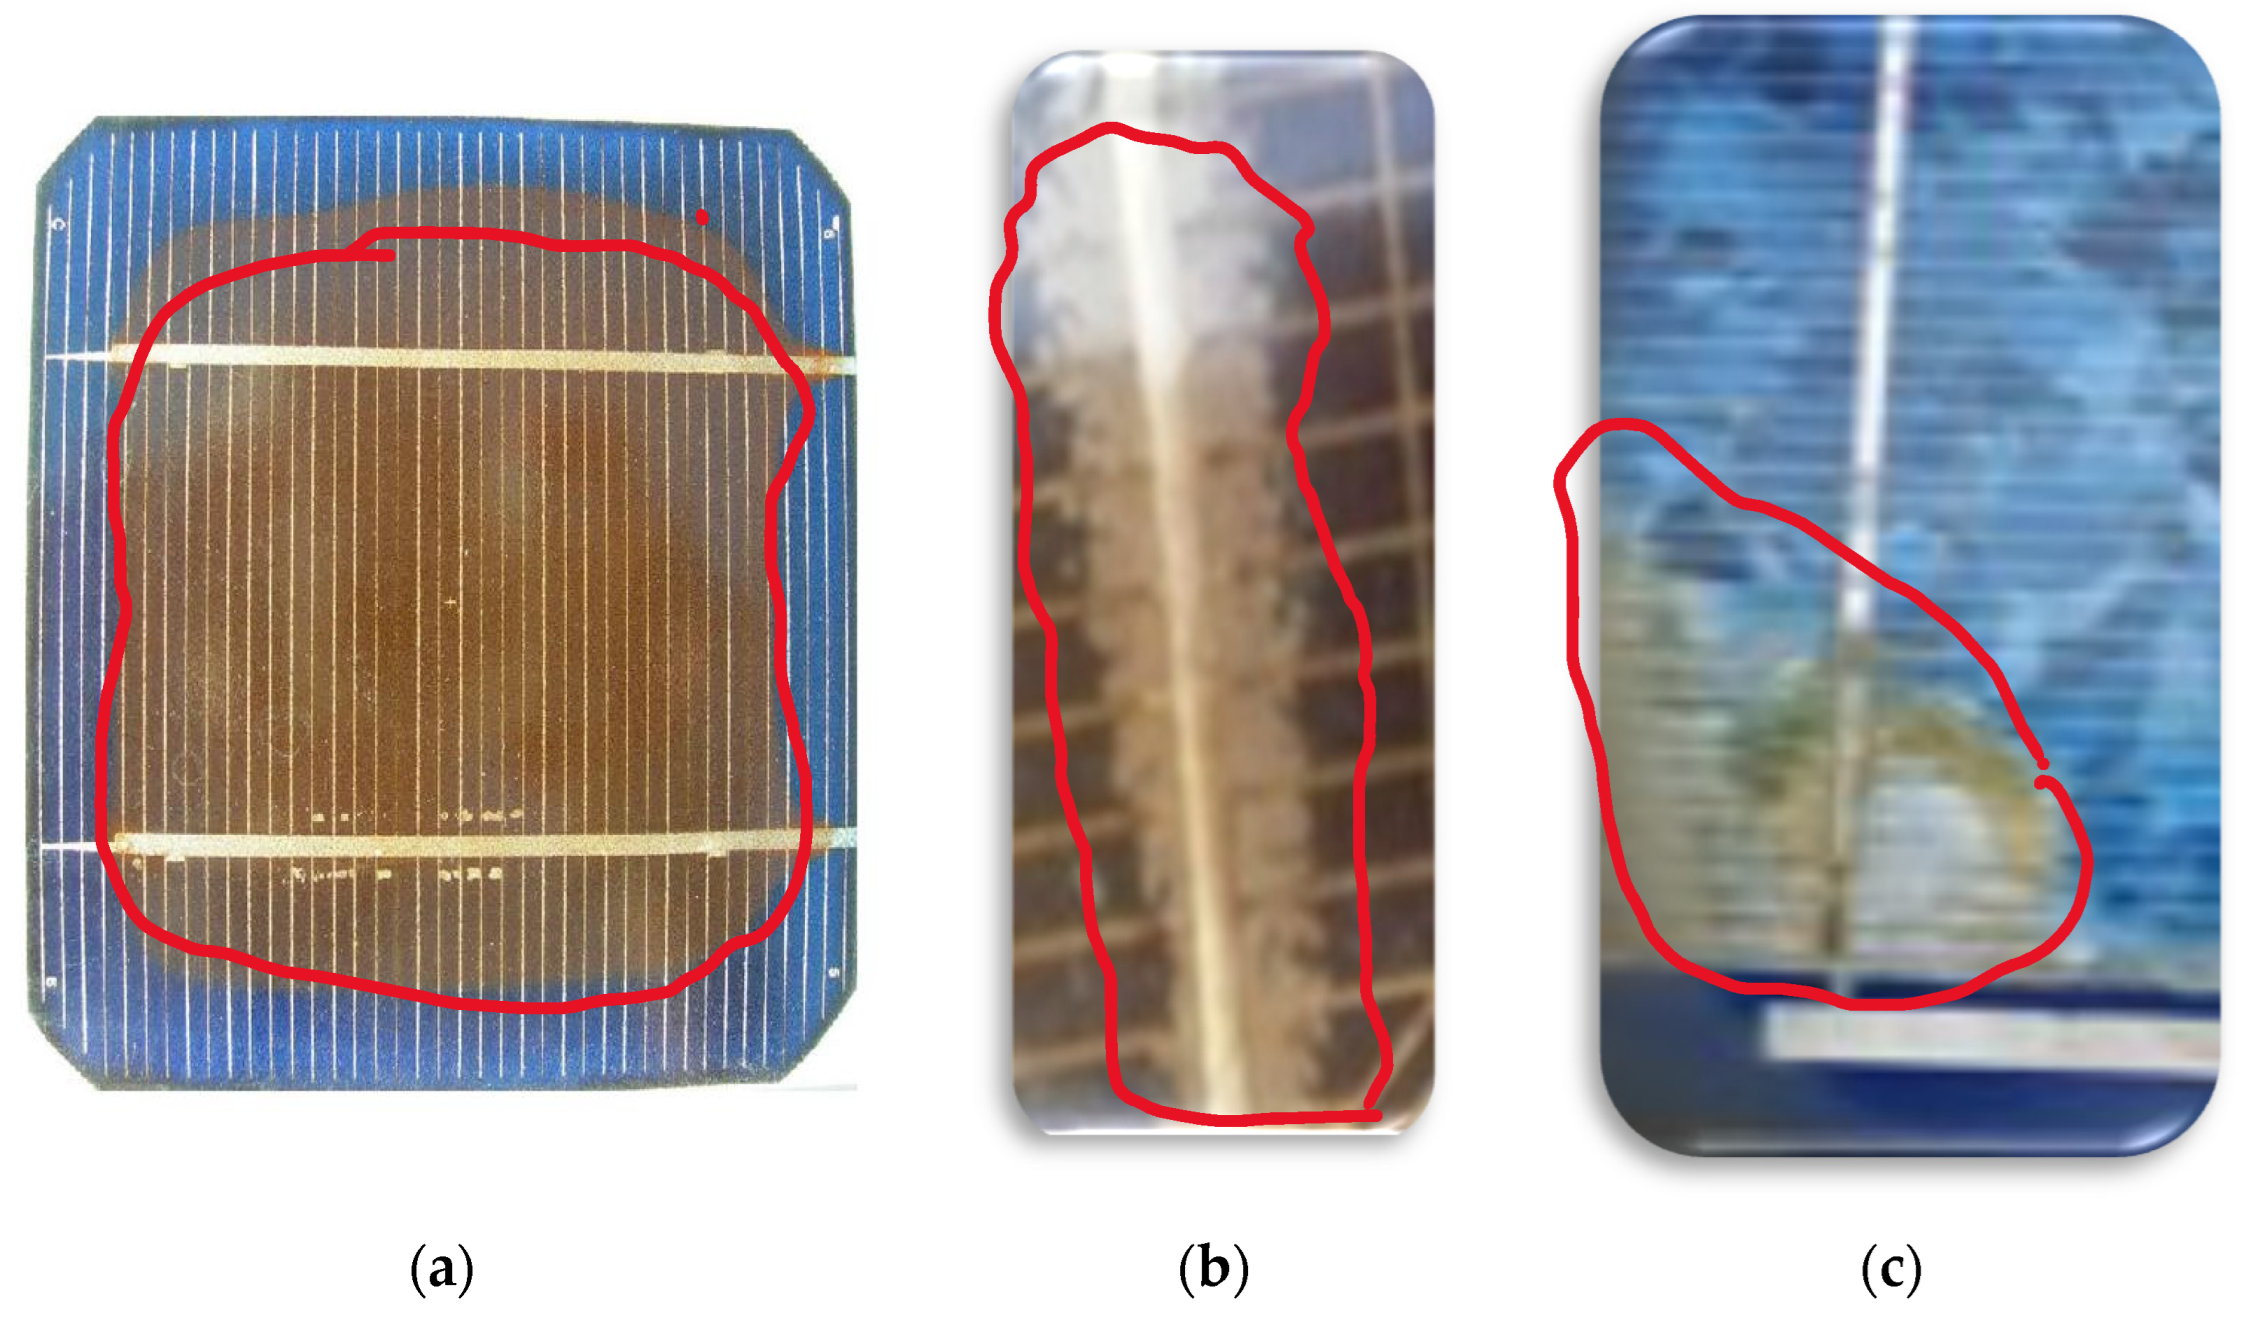
2.2. Encapsulant
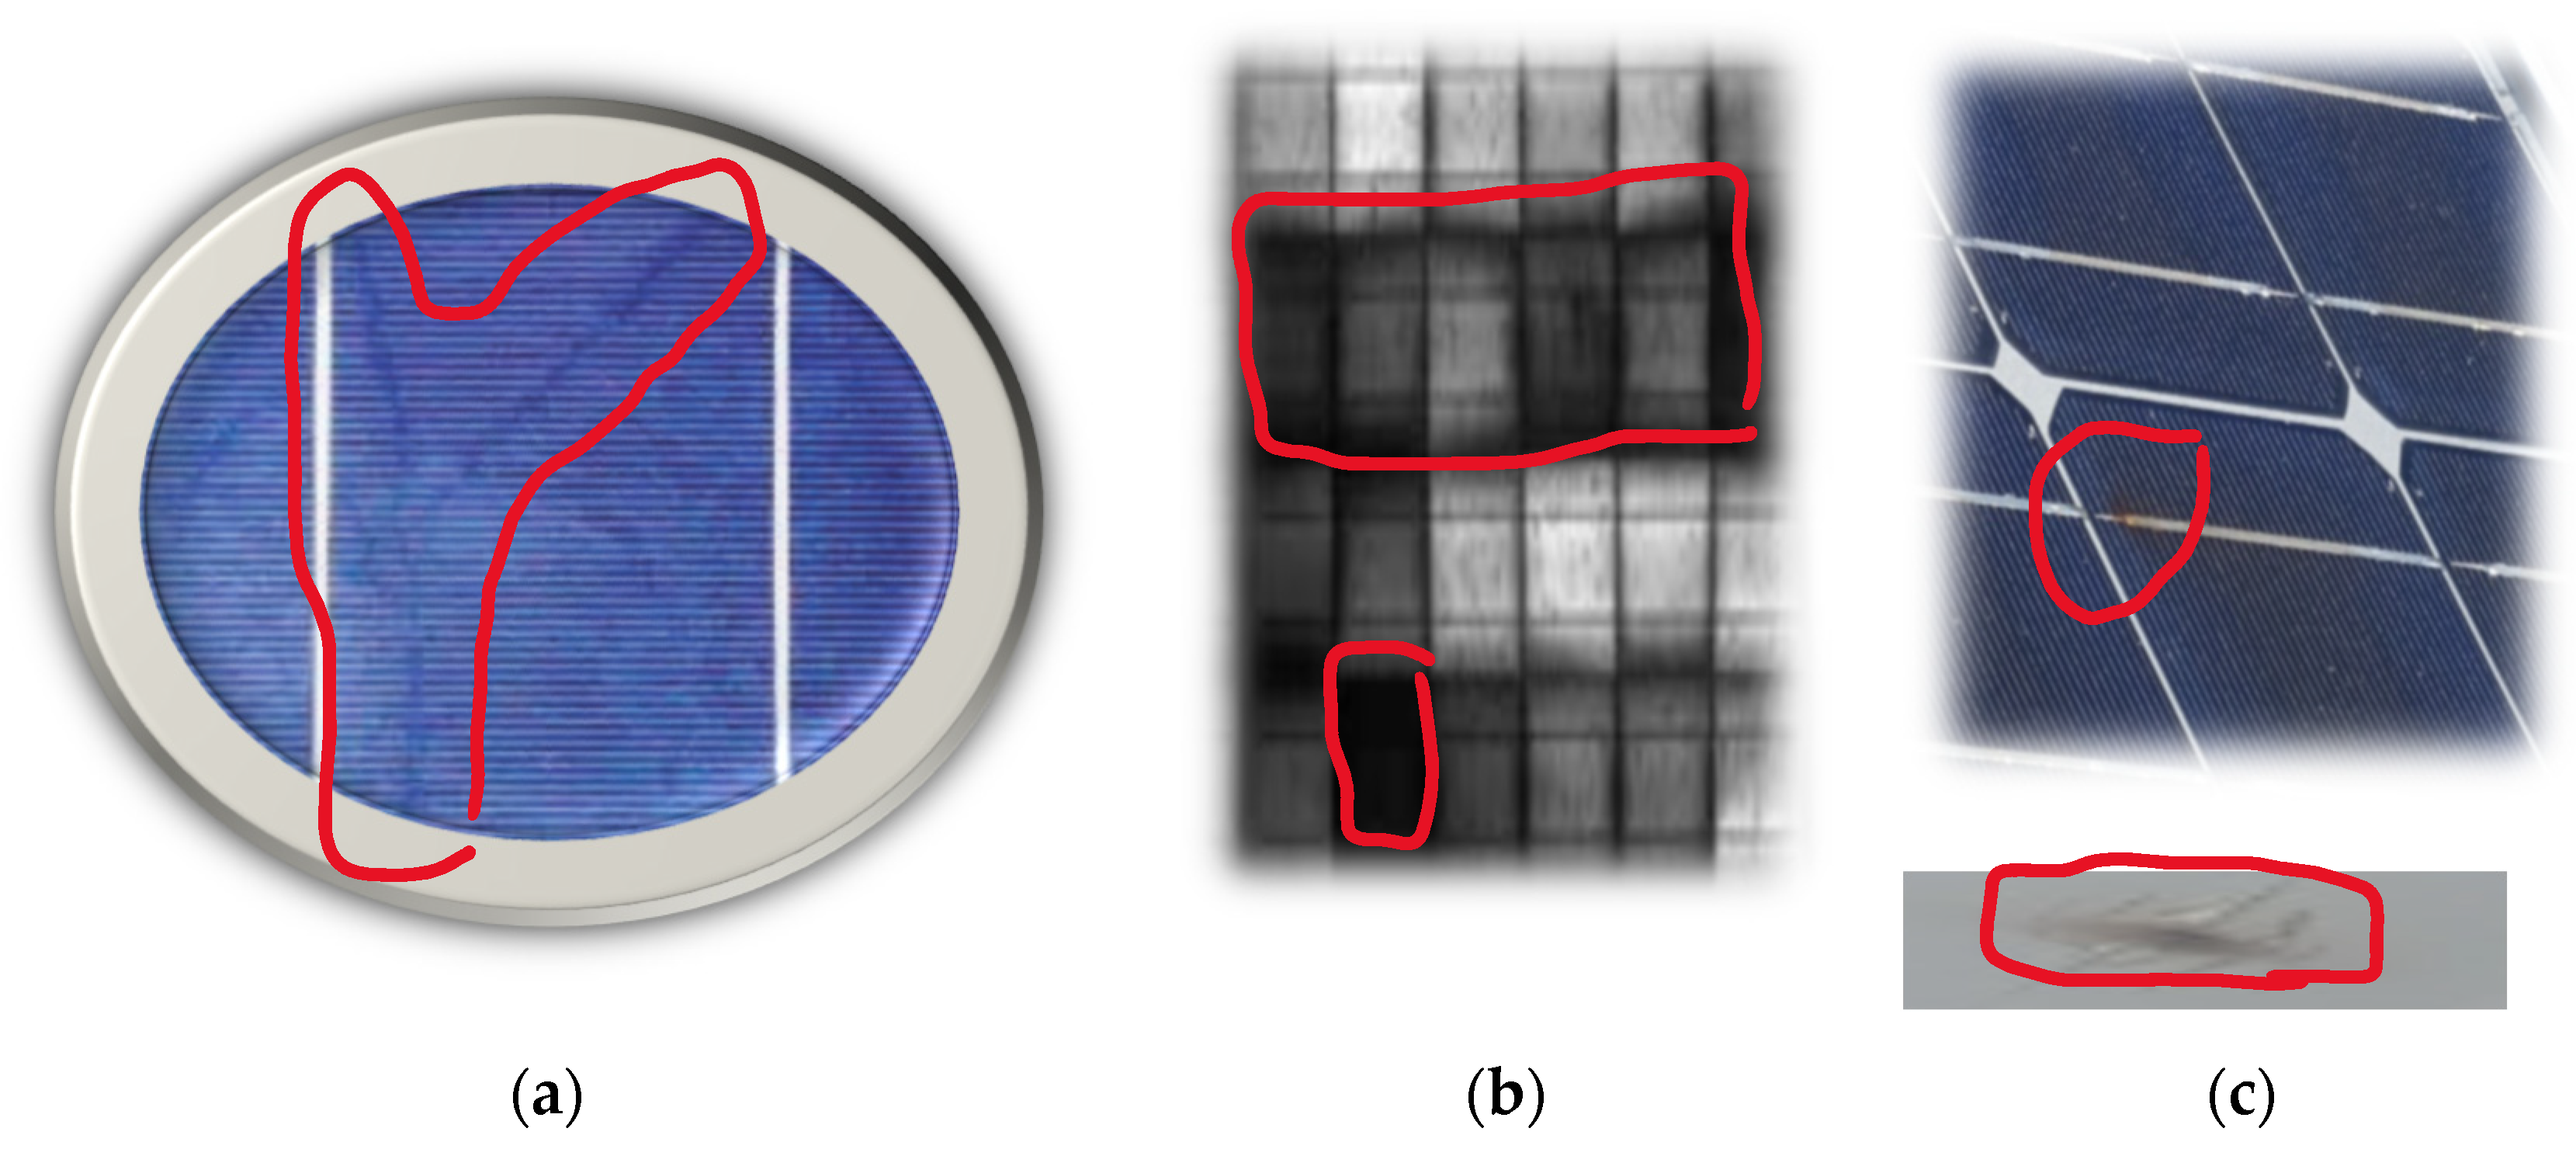
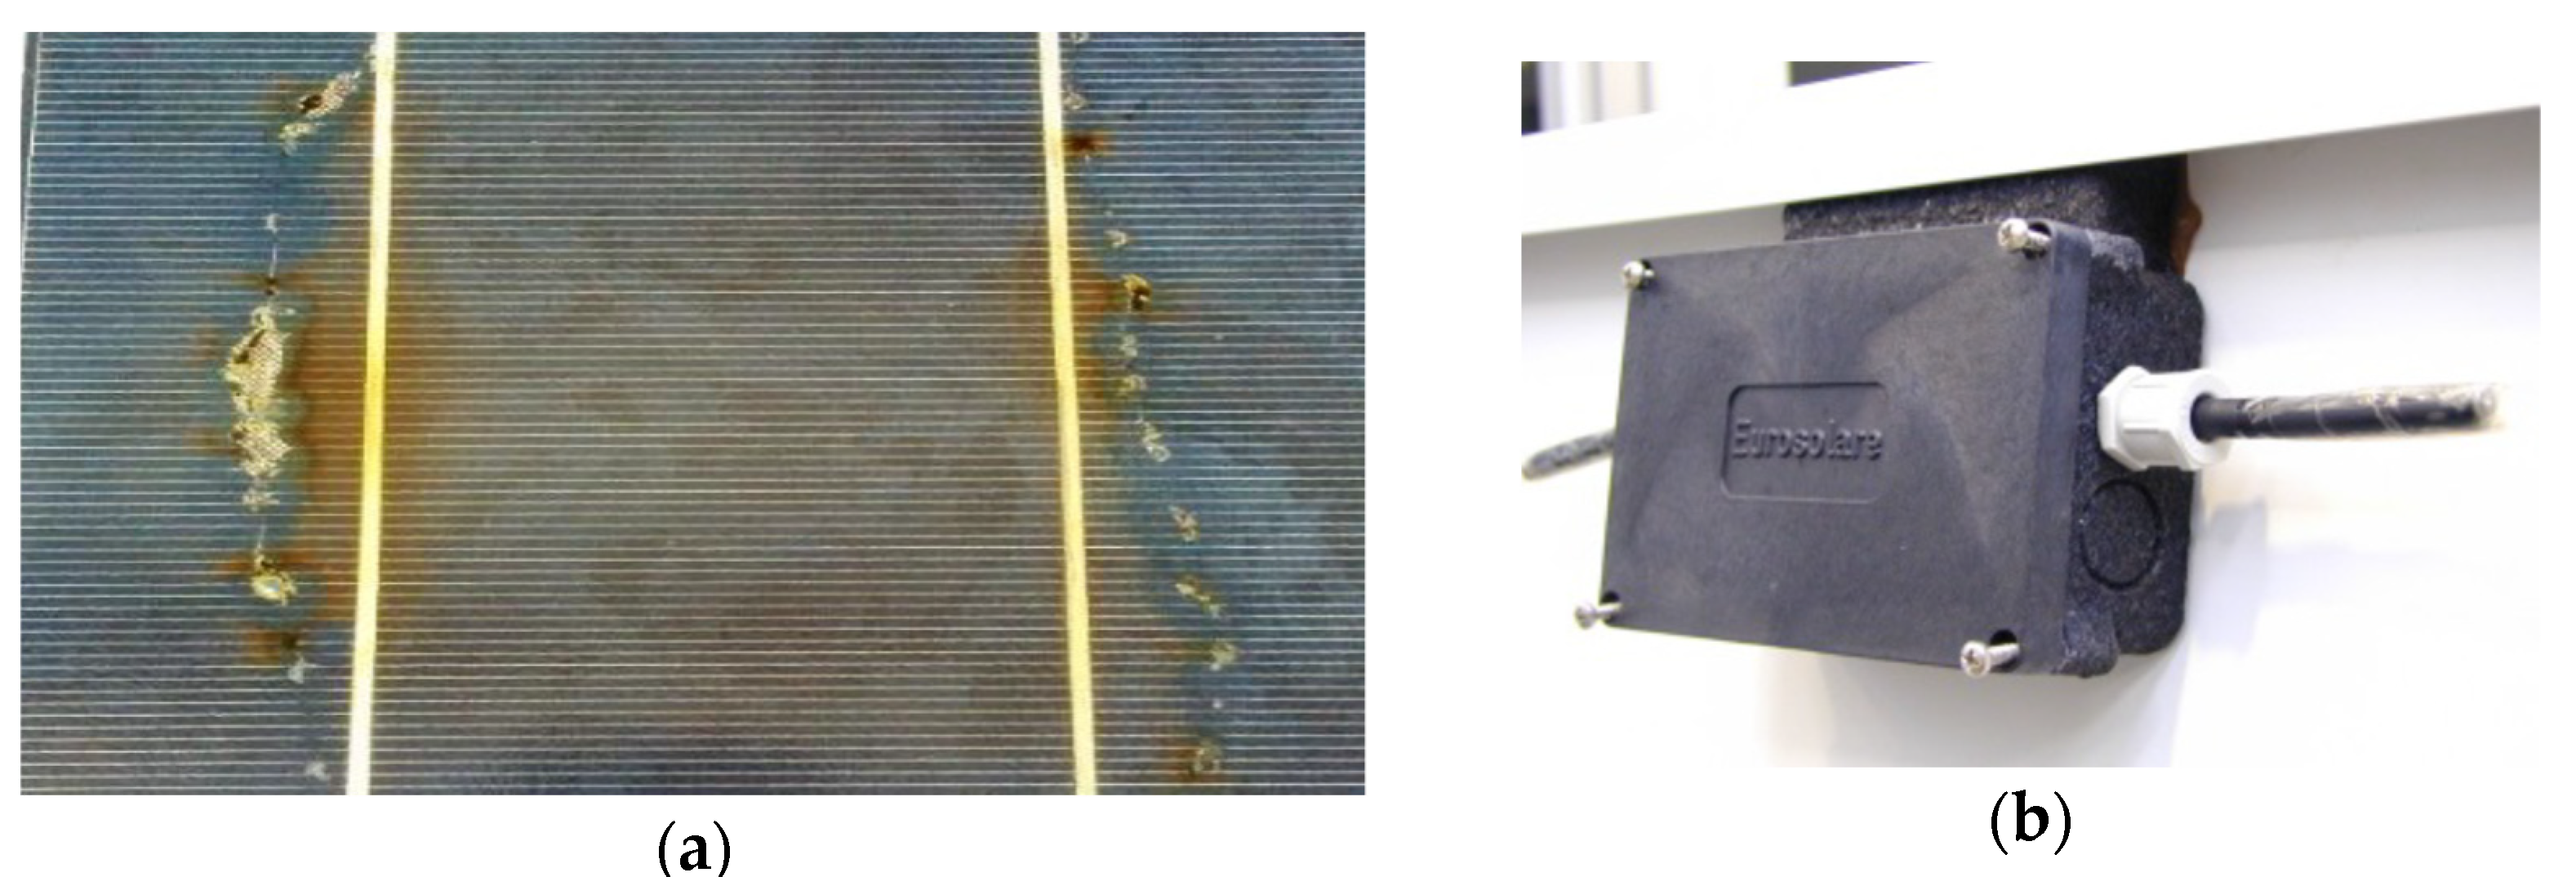
2.3. Solar Cells
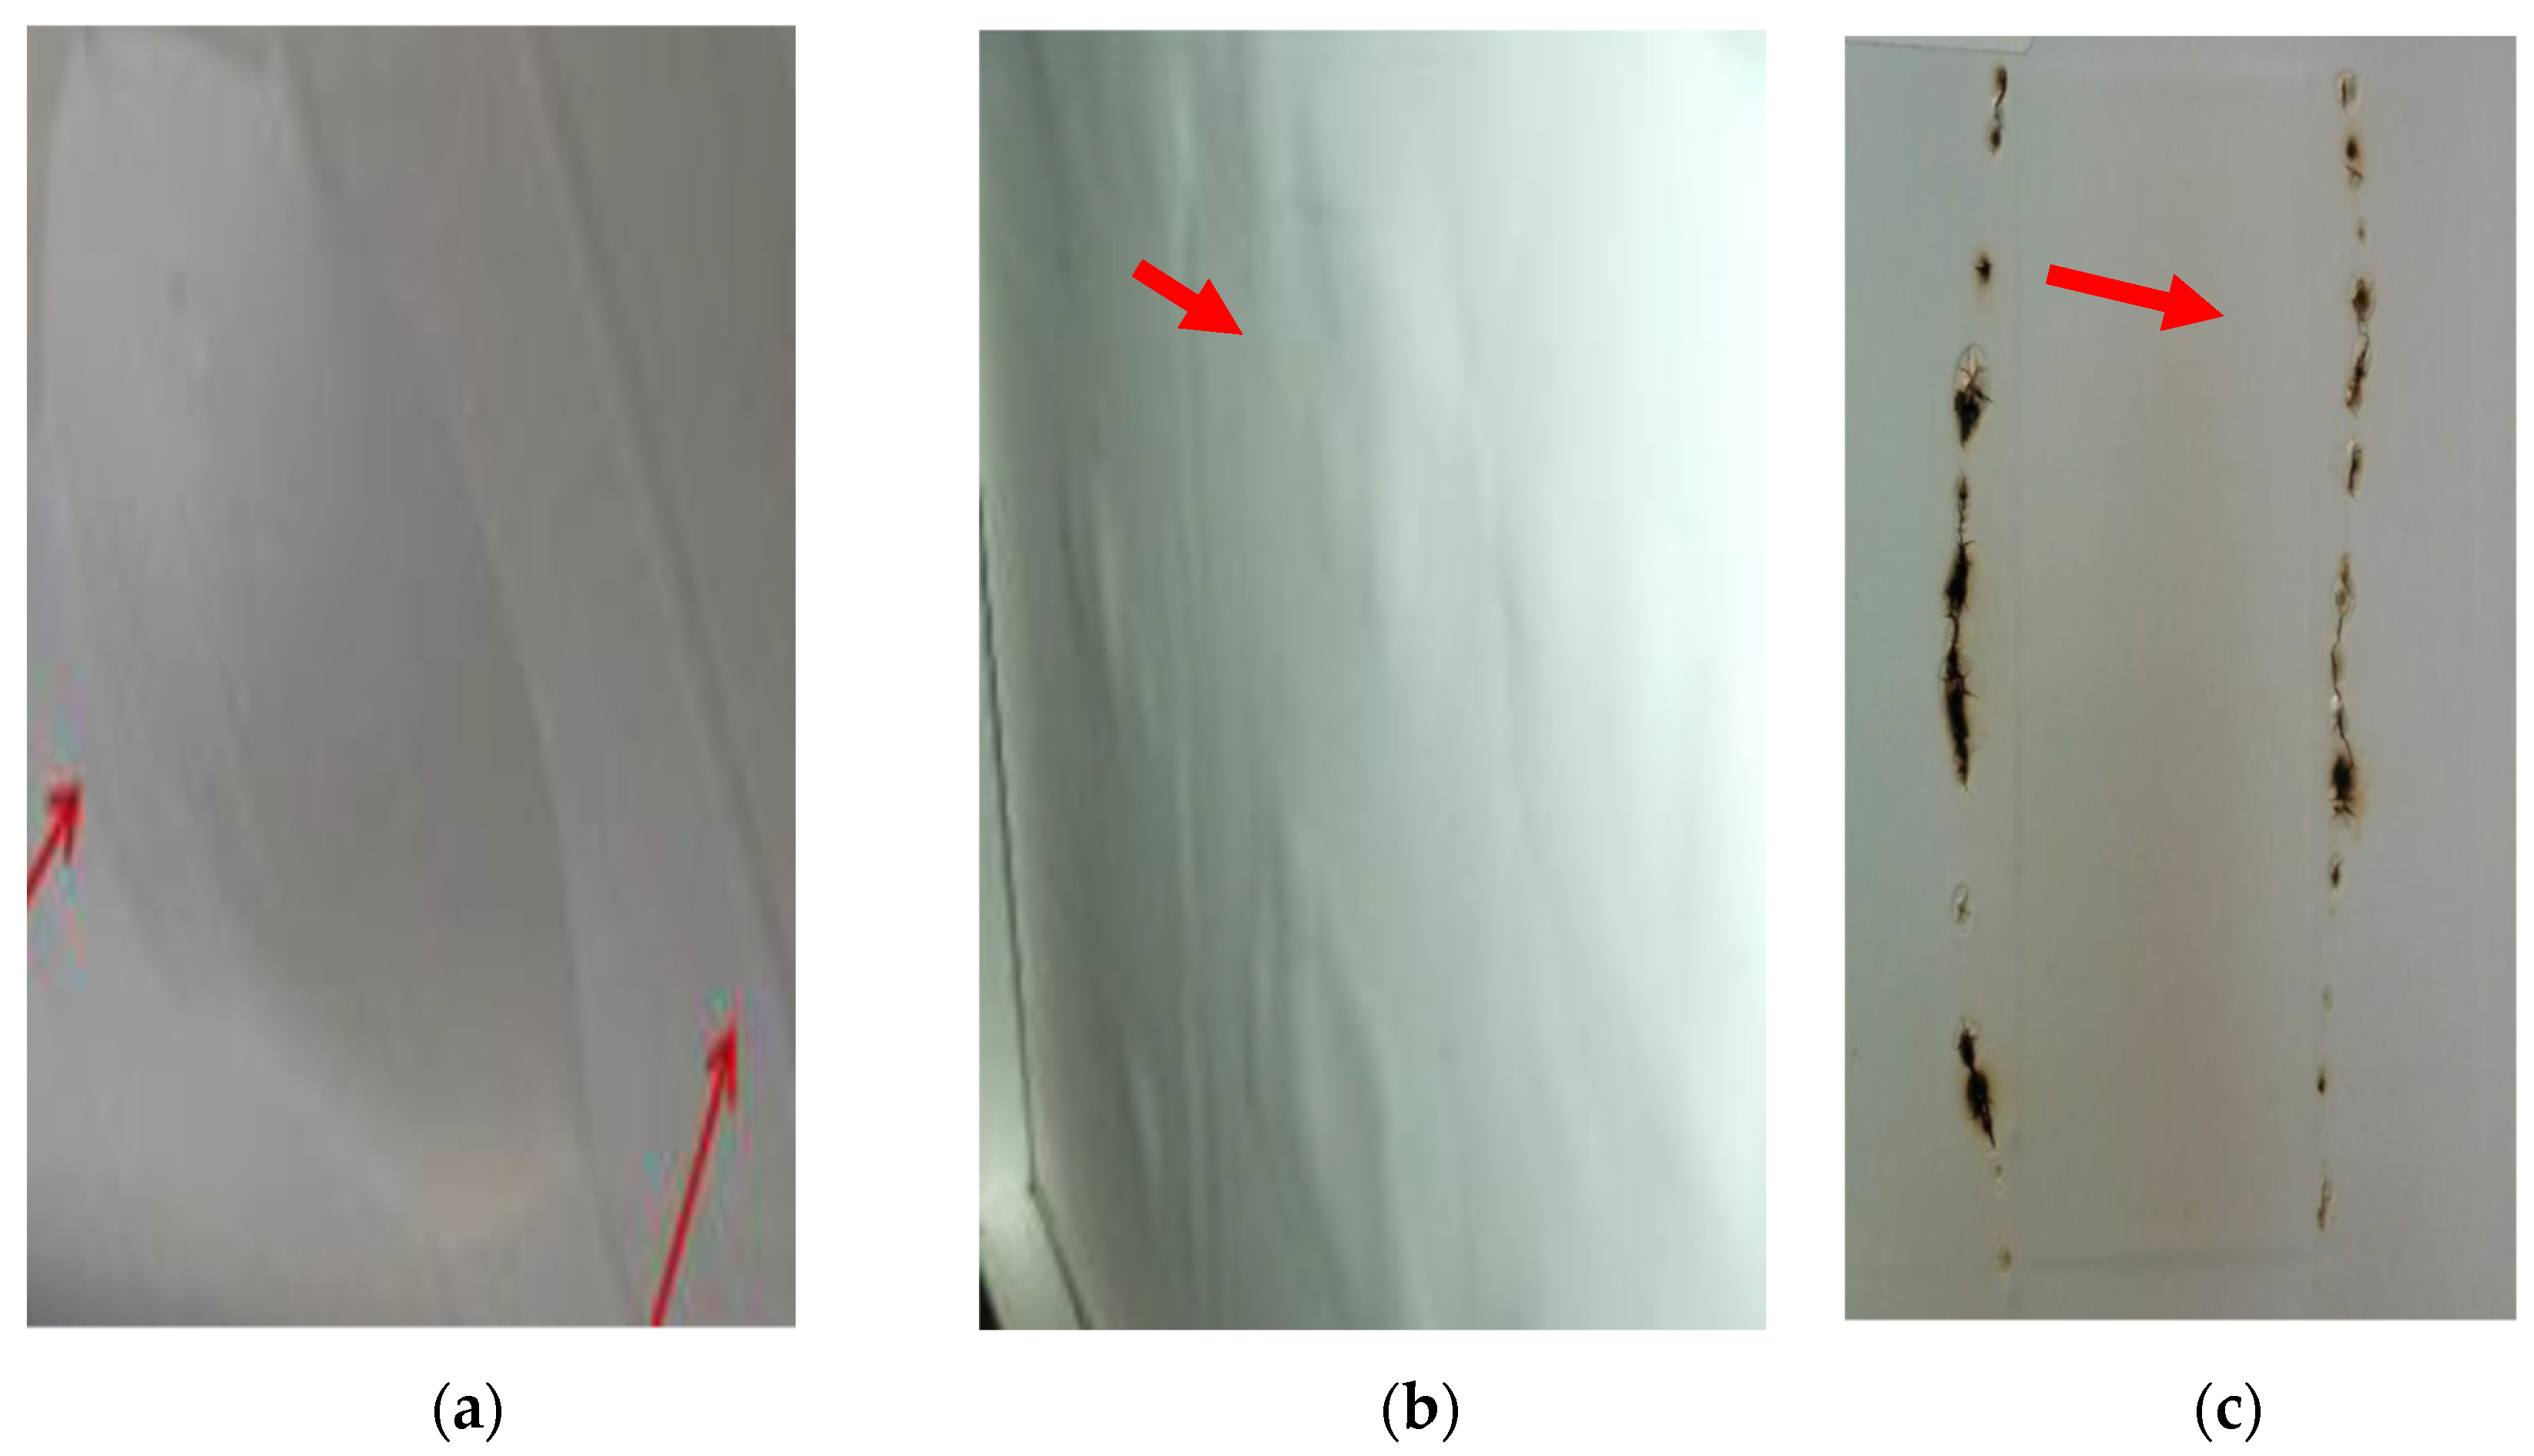
2.4. Backsheet
2.5. Junction Box and Bypass Diodes
3. Classification of Crystalline Photovoltaic Module Failures
4. Effect of Environmental Stress Factors on PV Degradation
5. Detection Methods for Failures in PV Modules
5.1. Visual Inspection
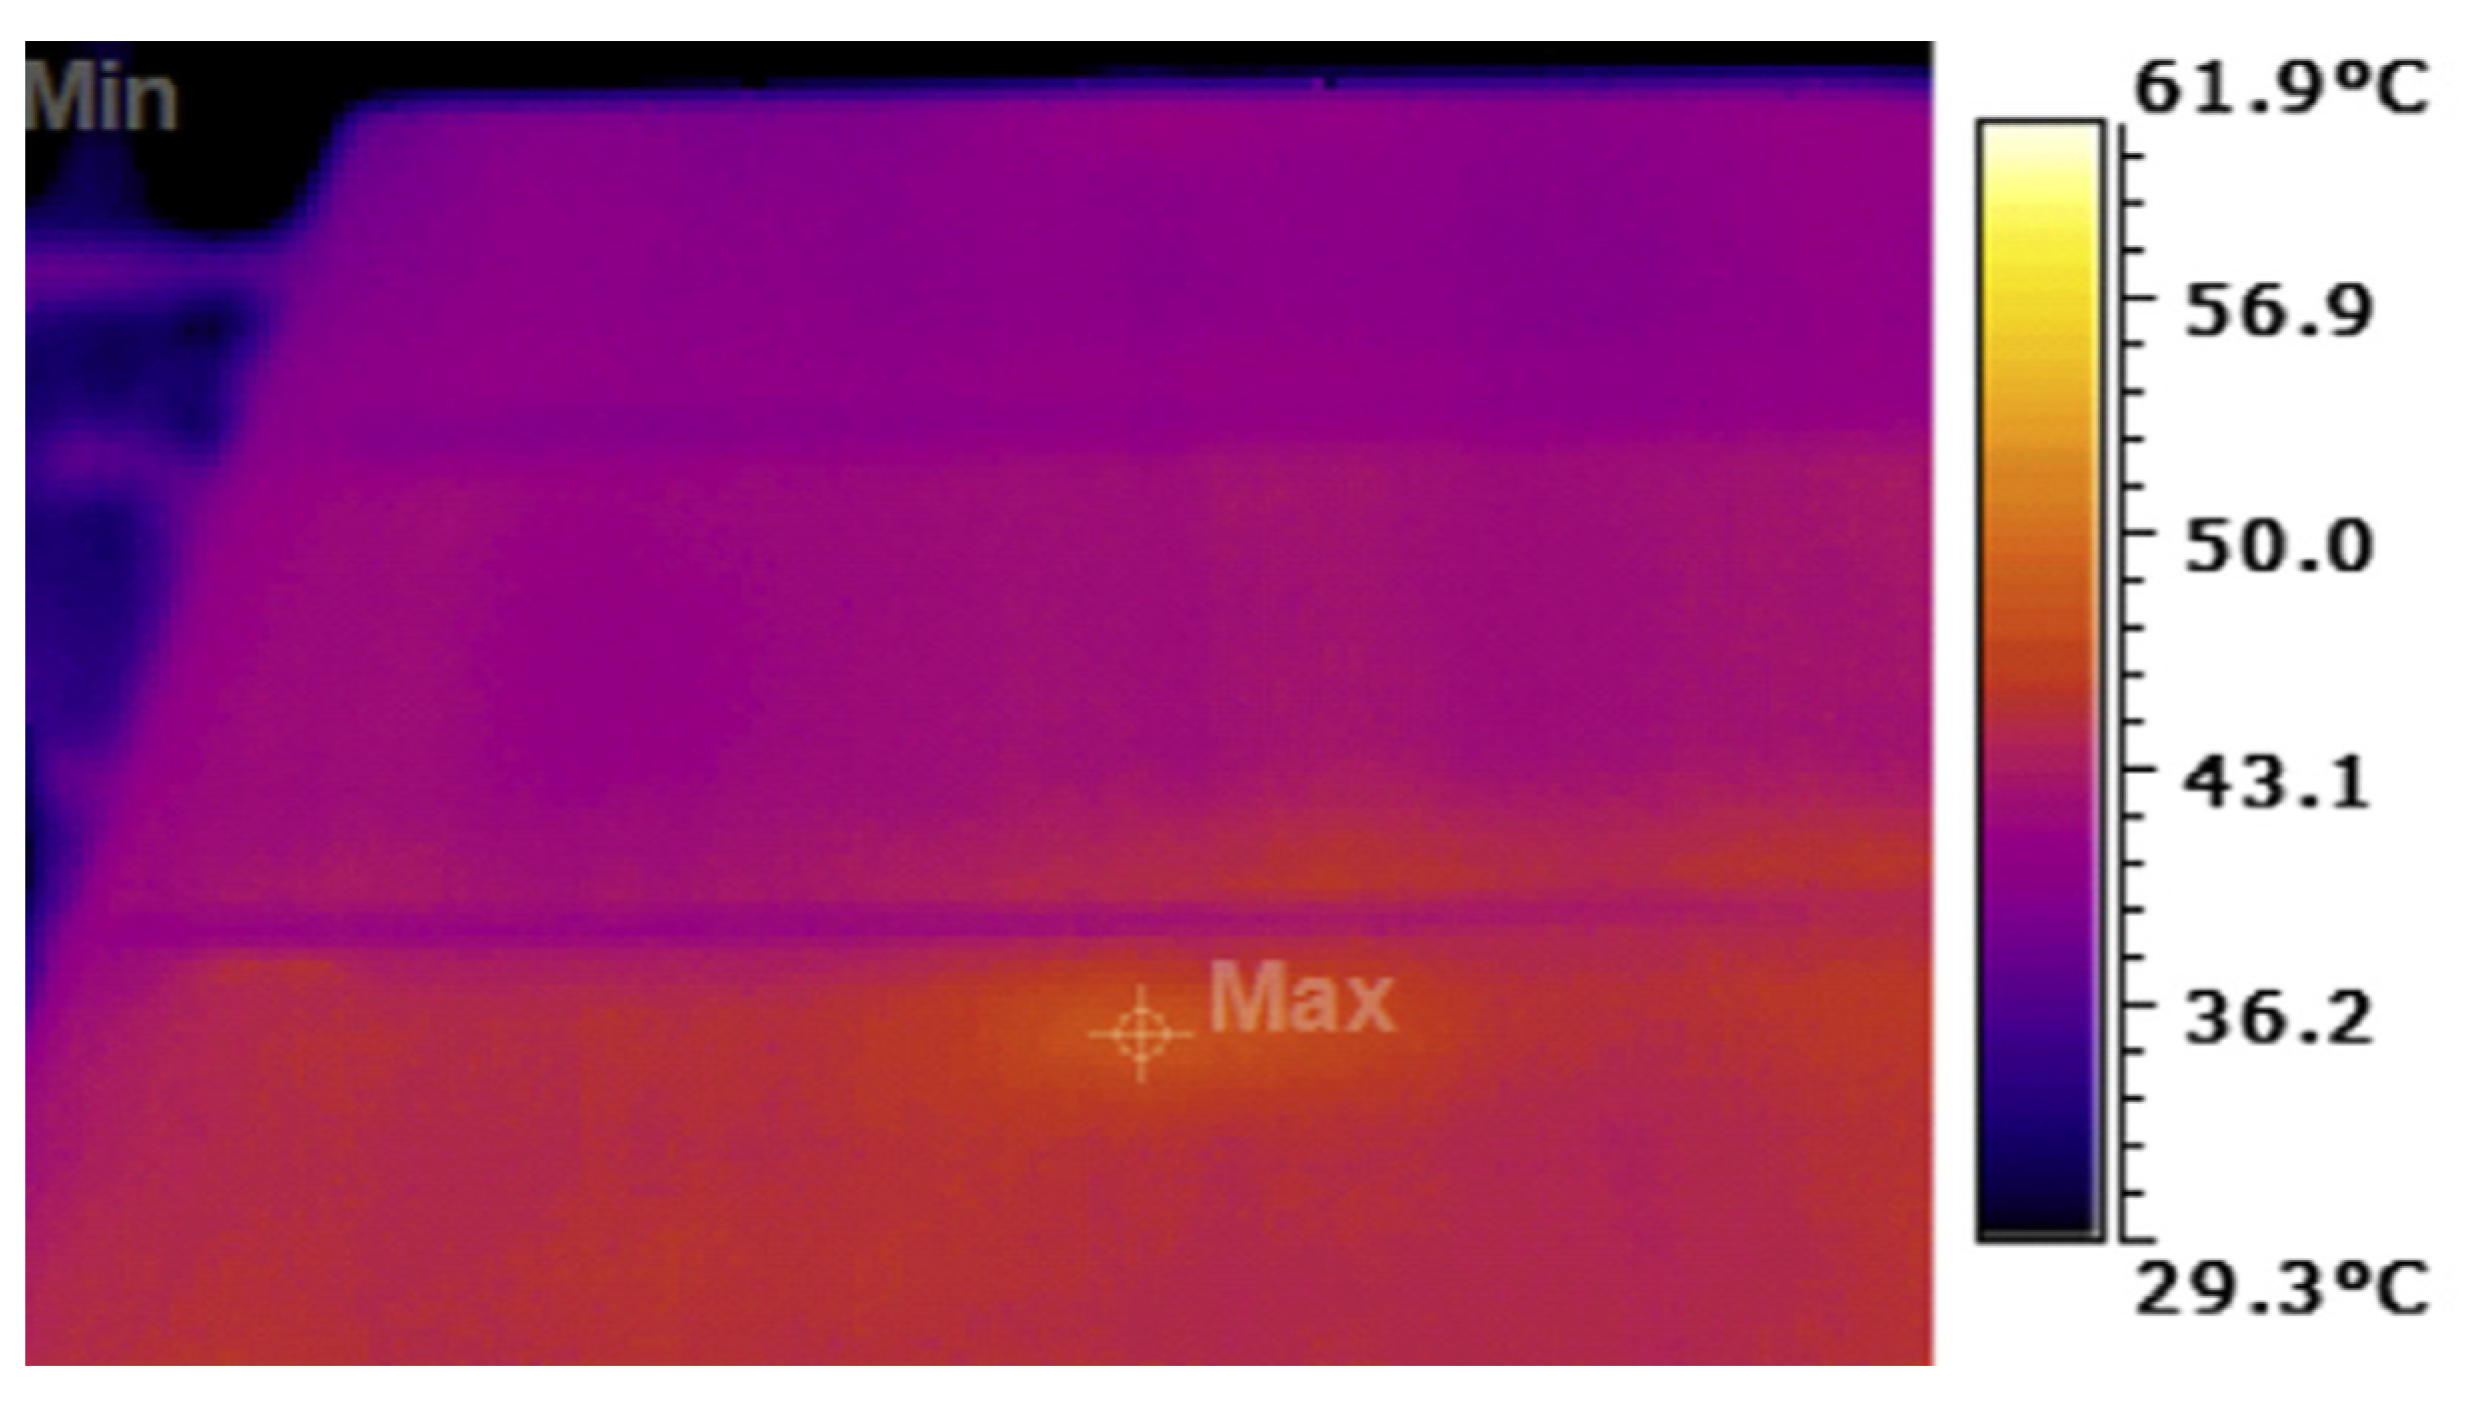
5.2. Infrared Imaging
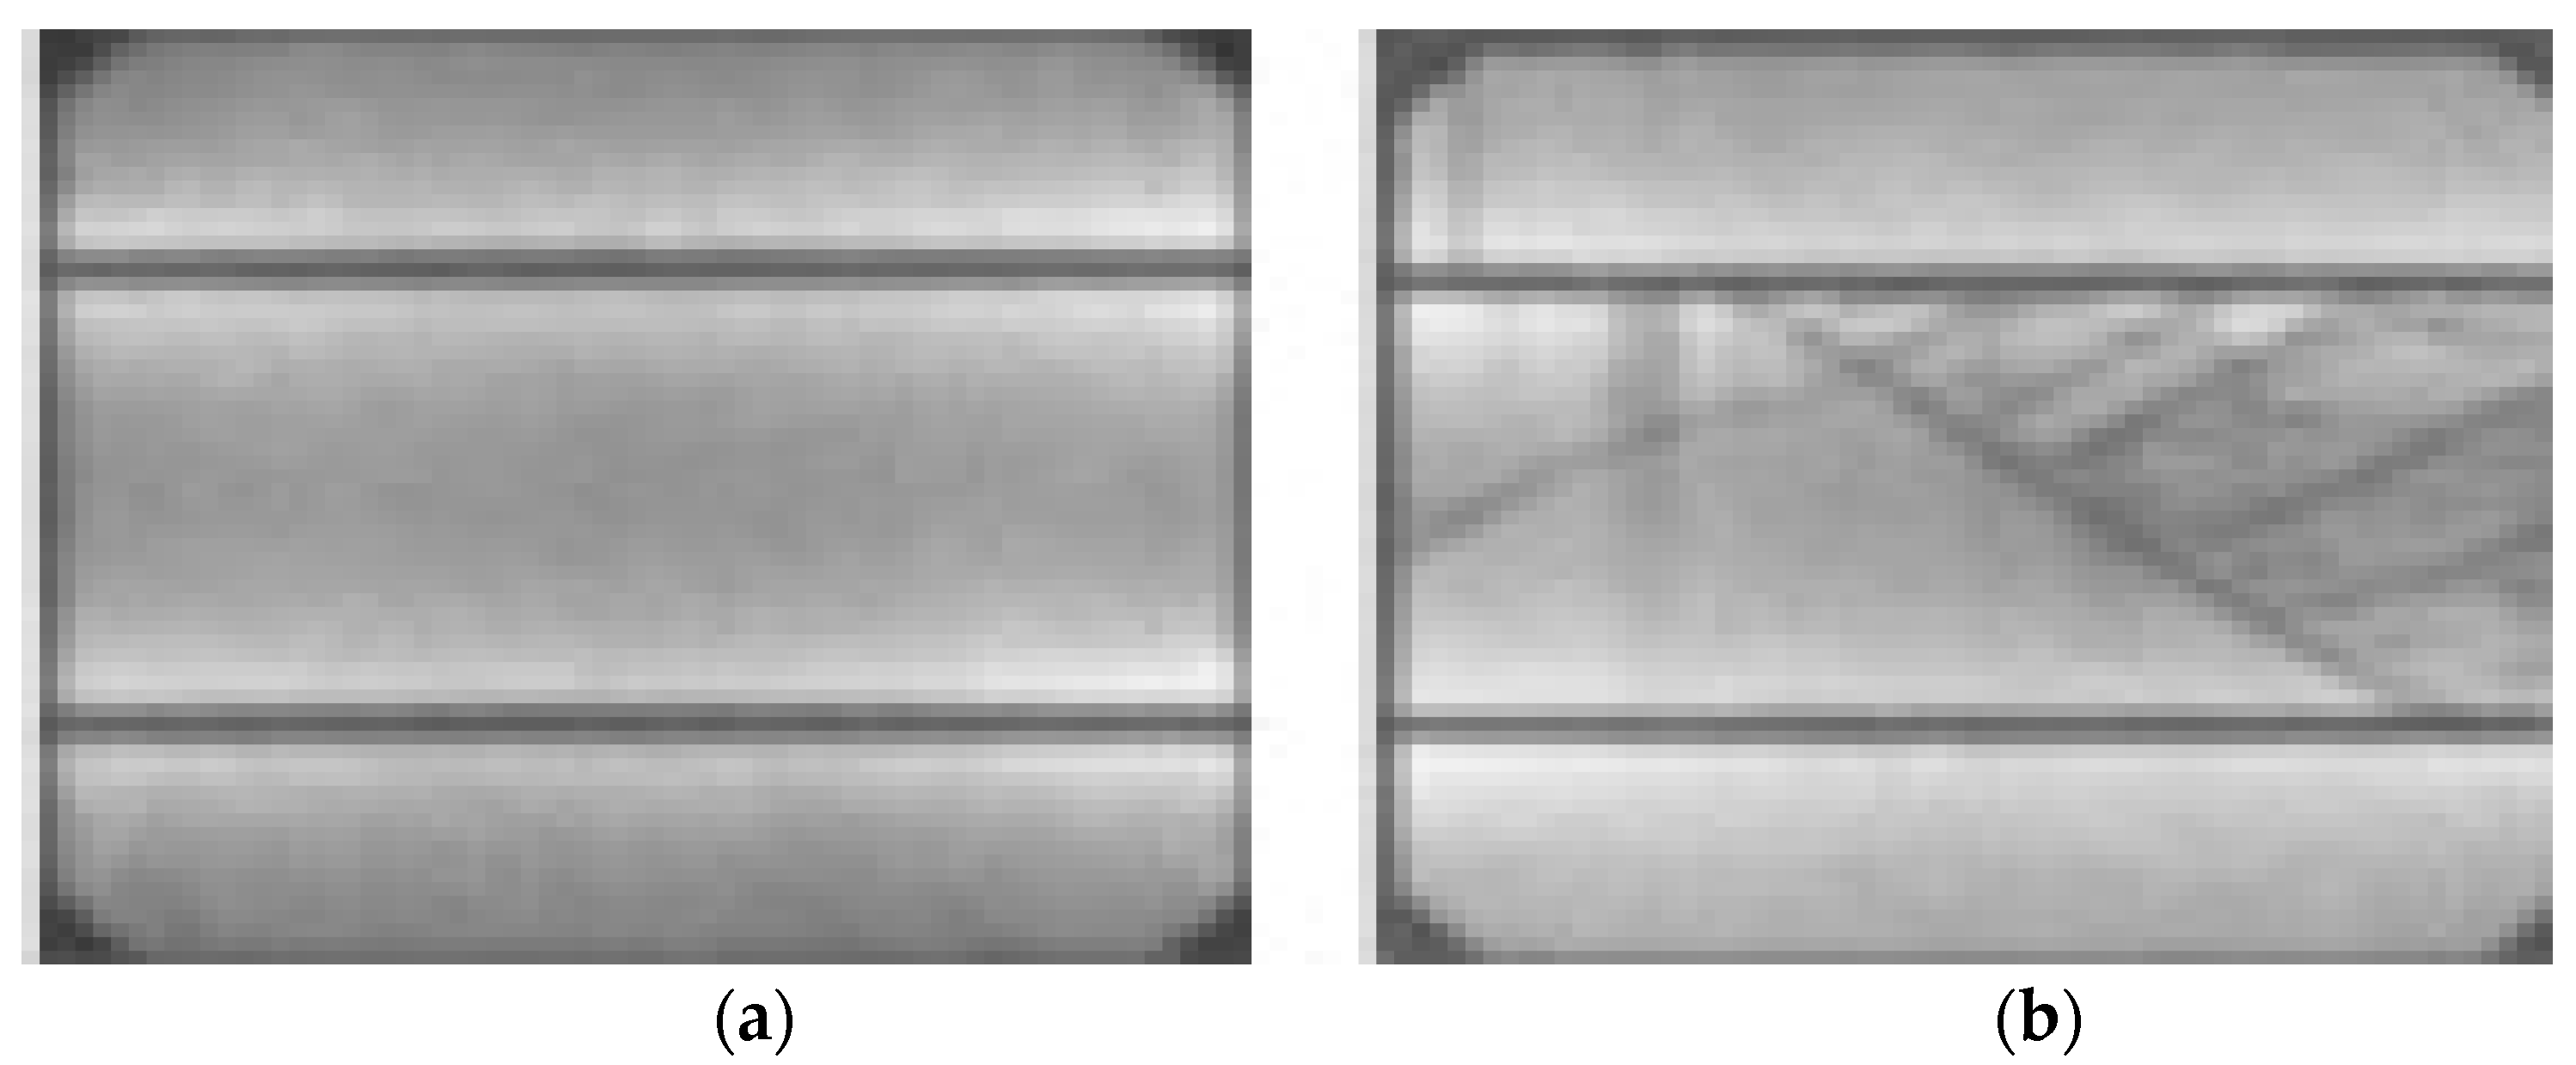
5.3. Electroluminescence Imaging
5.4. Ultrasonic Inspection
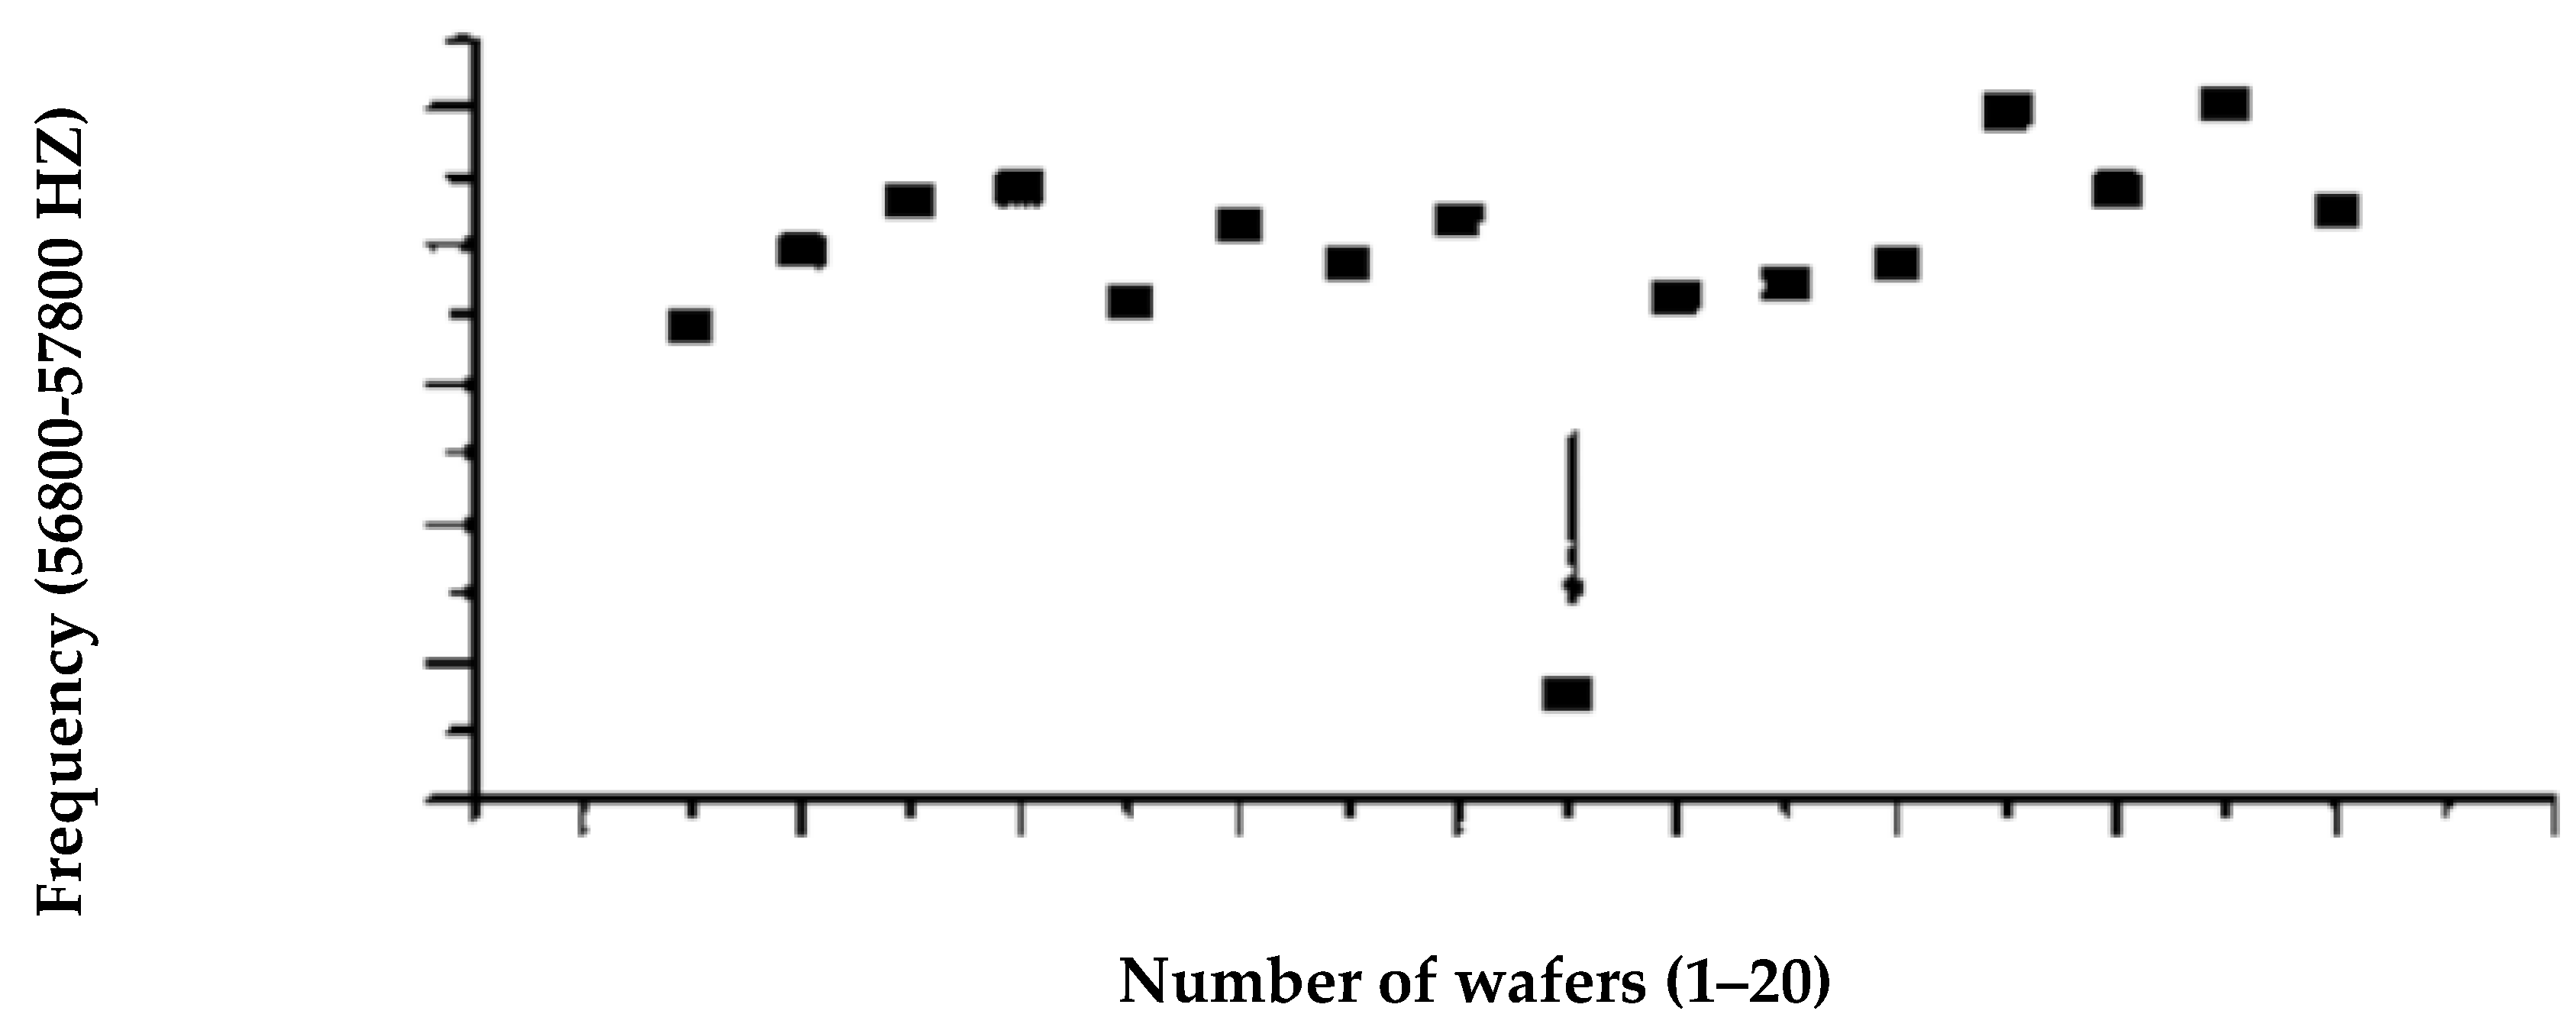
5.5. Electrical Characterisation
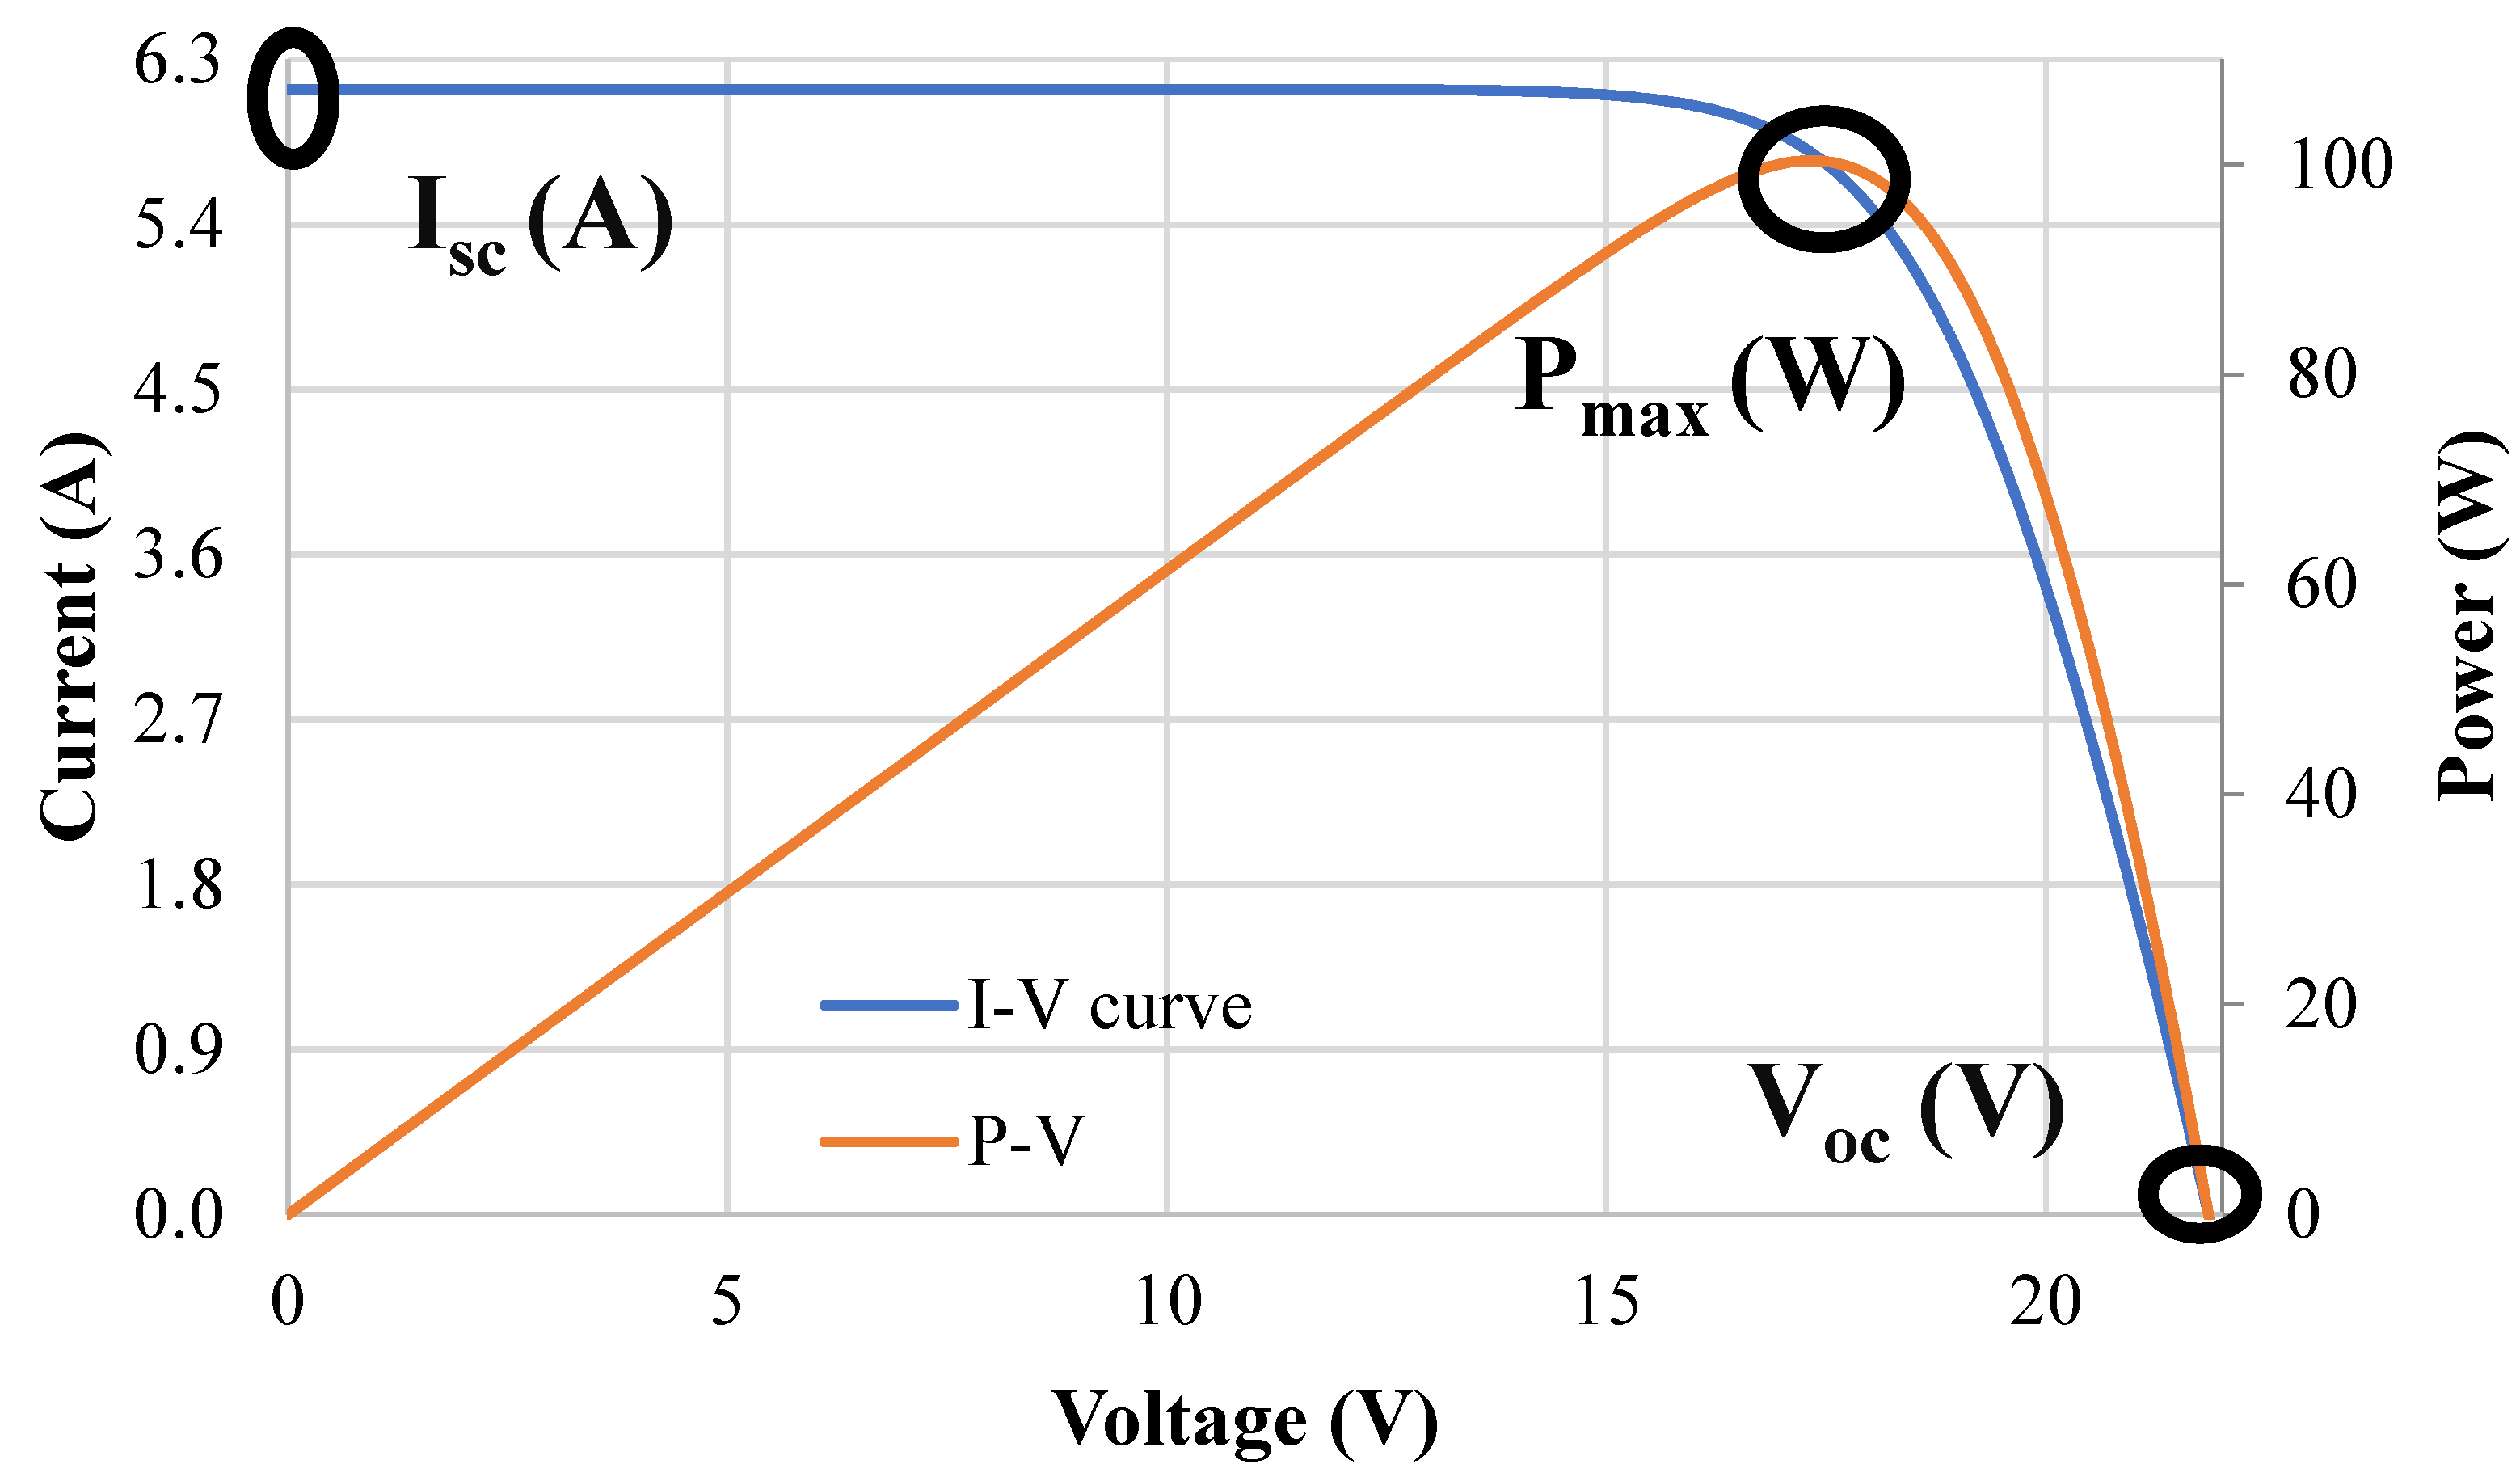
5.5.1. Detection Techniques Using I–V Curve Parameters
5.5.2. Detection of Degradations and Failures Using Shunt and Series Resistance
6. Conclusions
Funding
Conflicts of Interest
Abbreviations
| AM1.5G | Standard solar spectrum |
| EVA | Ethylene vinyl acetate |
| FF | Fill factor of the solar cell |
| G | Solar irradiance |
| First saturation current of the solar cell | |
| Second saturation current of the solar cell | |
| Maximum current output at the solar cell’s current–voltage curve | |
| Short-circuit current of the solar cell | |
| IR | Infrared imaging |
| I–V | Current–voltage curve of the solar cell |
| J-box | Junction box, a component of photovoltaic modules |
| PDMS | Polydimethylsiloxane, a type of polymer used as an encapsulant in photovoltaic modules |
| PET | Polyethylene terephthalate, a plastic material used as the backsheet in photovoltaic modules |
| PID | Potential-induced degradation |
| Maximum power output, the maximal power produced by the solar cell | |
| PV | Photovoltaic |
| RPN | Risk priority number used for rating guidelines |
| Shunt or parallel resistance of the photovoltaic solar cell | |
| Series resistance of the solar cell | |
| SPICE | Simulation program with integrated circuit emphasis |
| STC | Standard test condition |
| TPU | Thermoplastic polyurethane |
| UV | Ultraviolet |
| Open-circuit voltage of the solar cell | |
| Maximum voltage output at the solar cell’s current–voltage curve |
References
- Li, L.; Lin, J.; Wu, N.; Xie, S.; Meng, C.; Zheng, Y.; Wang, X.; Zhao, Y. Review and outlook on the international renewable energy development. Energy Built Environ. 2022, 3, 139–157. [Google Scholar] [CrossRef]
- Green, M.A. How did solar cells get so cheap? Joule 2019, 3, 631–633. [Google Scholar] [CrossRef]
- PSE Projects, Photovoltaics Report; Fraunhofer Institute for Solar Energy Systems ISE: Freiburg im Breisgau, Germany, 2022.
- IEA. Net Renewable Capacity Additions by Technology, 2020–2022; IEA: Paris, France, 2021. [Google Scholar]
- Goetzberger, A.; Hebling, C.; Schock, H.-W. Photovoltaic materials, history, status and outlook. Mater. Sci. Eng. R Rep. 2003, 40, 1–46. [Google Scholar] [CrossRef]
- Green, M.A.; Dunlop, E.D.; Hohl-Ebinger, J.; Yoshita, M.; Kopidakis, N.; Ho-Baillie, A.W. Solar cell efficiency tables (version 55). Prog. Photovolt. Res. Appl. 2019, 28, 3–15. [Google Scholar] [CrossRef]
- Peike, C.; Hädrich, I.; Weiß, K.-A.; Dürr, I. Overview of PV module encapsulation materials. Photovolt. Int. 2013, 19, 85–92. [Google Scholar]
- Ma, S.; Yuan, G.; Zhang, Y.; Yang, N.; Li, Y.; Chen, Q. Development of encapsulation strategies towards the commercialization of perovskite solar cells. Energy Environ. Sci. 2022, 15, 13–55. [Google Scholar] [CrossRef]
- Wang, H.; Cheng, X.; Yang, H.; He, W.; Chen, Z.; Xu, L.; Song, D. Potential-induced degradation: Recombination behavior, temperature coefficients and mismatch losses in crystalline silicon photovoltaic power plant. Sol. Energy 2019, 188, 258–264. [Google Scholar] [CrossRef]
- Vázquez, M.; Rey-Stolle, I. Photovoltaic module reliability model based on field degradation studies. Prog. Photovolt. Res. Appl. 2008, 16, 419–433. [Google Scholar] [CrossRef]
- Daher, D.H.; Gaillard, L.; Ménézo, C. Experimental assessment of long-term performance degradation for a PV power plant operating in a desert maritime climate. Renew. Energy 2022, 187, 44–55. [Google Scholar] [CrossRef]
- Wohlgemuth, J. IEC 61215: What It Is and Isn’t (Presentation); National Renewable Energy Lab (NREL): Golden, CO, USA, 2012. [Google Scholar]
- Barretta, C.; Macher, A.E.; Ascencio-Vásquez, J.; Köntges, M.; Topič, M.; Oreski, G. Degradation of Crystalline Silicon Photovoltaic Modules Installed in Different Climates. In Proceedings of the IEEE 49th Photovoltaics Specialists Conference (PVSC) 2022, Philadelphia, PA, USA, 5–10 June 2022; pp. 680–682. [Google Scholar]
- Dhimish, M.; Tyrrell, A.M. Power loss and hotspot analysis for photovoltaic modules affected by potential induced degradation. NPJ Mater. Degrad. 2022, 6, 11. [Google Scholar] [CrossRef]
- Köntges, M.; Kurtz, S.; Packard, C.; Jahn, U.; Berger, K.A.; Kato, K.; Friesen, T.; Liu, H.; Van Iseghem, M. Review of Failures of Photovoltaic Modules IEA PVPS Task 13 External Final Report March 2014. IEA-PVPS T13-01. 2014. Available online: https://iea-pvps.org/wp-content/uploads/2020/01/IEA-PVPS_T13-01_2014_Review_of_Failures_of_Photovoltaic_Modules_Final.pdf (accessed on 3 August 2023).
- Jordan, D.C.; Silverman, T.J.; Wohlgemuth, J.H.; Kurtz, S.R.; VanSant, K.T. Photovoltaic failure and degradation modes. Prog. Photovolt. Res. Appl. 2017, 25, 318–326. [Google Scholar] [CrossRef]
- Madeti, S.R.; Singh, S. A comprehensive study on different types of faults and detection techniques for solar photovoltaic system. Sol. Energy 2017, 158, 161–185. [Google Scholar] [CrossRef]
- Pillai, D.S.; Rajasekar, N. A comprehensive review on protection challenges and fault diagnosis in PV systems. Renew. Sustain. Energy Rev. 2018, 91, 18–40. [Google Scholar] [CrossRef]
- Osmani, K.; Haddad, A.; Lemenand, T.; Castanier, B.; Alkhedher, M.; Ramadan, M. A critical review of PV systems’ faults with the relevant detection methods. Energy Nexus 2023, 12, 100257. [Google Scholar] [CrossRef]
- Jordan, D.C.; Sekulic, B.; Marion, B.; Kurtz, S.R. Performance and aging of a 20-year-old silicon PV system. IEEE J. Photovolt. 2015, 5, 744–751. [Google Scholar] [CrossRef]
- Han, H.; Dong, X.; Li, B.; Yan, H.; Verlinden, P.J.; Liu, J.; Huang, J.; Liang, Z.; Shen, H. Degradation analysis of crystalline silicon photovoltaic modules exposed over 30 years in hot-humid climate in China. Sol. Energy 2018, 170, 510–519. [Google Scholar] [CrossRef]
- Ndiaye, A.; Charki, A.; Kobi, A.; Kébé, C.M.F.; Ndiaye, P.A.; Sambou, V. Degradations of silicon photovoltaic modules: A literature review. Sol. Energy 2013, 96, 140–151. [Google Scholar] [CrossRef]
- Triki-Lahiani, A.; Abdelghani, A.B.-B.; Slama-Belkhodja, I. Fault detection and monitoring systems for photovoltaic installations: A review. Renew. Sustain. Energy Rev. 2018, 82, 2680–2692. [Google Scholar] [CrossRef]
- Bai, A.; Popp, J.; Balogh, P.; Gabnai, Z.; Pályi, B.; Farkas, I.; Pintér, G.; Zsiborács, H. Technical and economic effects of cooling of monocrystalline photovoltaic modules under Hungarian conditions. Renew. Sustain. Energy Rev. 2016, 60, 1086–1099. [Google Scholar] [CrossRef]
- Aboagye, B.; Gyamfi, S.; Ofosu, E.A.; Djordjevic, S. Investigation into the impacts of design, installation, operation and maintenance issues on performance and degradation of installed solar photovoltaic (PV) systems. Energy Sustain. Dev. 2022, 66, 165–176. [Google Scholar] [CrossRef]
- Jordan, D.C.; Kurtz, S.R.; VanSant, K.; Newmiller, J. Compendium of photovoltaic degradation rates. Prog. Photovolt. Res. Appl. 2016, 24, 978–989. [Google Scholar] [CrossRef]
- Colvin, D.J.; Iqbal, N.; Yerger, J.H.; Li, F.; Sinha, A.; Vicnansky, G.; Brummer, G.; Zheng, N.; Schneller, E.J.; Barkaszi, J. Degradation of monocrystalline silicon photovoltaic modules from a 10-year-old rooftop system in Florida. IEEE J. Photovolt. 2023, 13, 275–282. [Google Scholar] [CrossRef]
- Golive, Y.R.; Zachariah, S.; Dubey, R.; Chattopadhyay, S.; Bhaduri, S.; Singh, H.K.; Bora, B.; Kumar, S.; Tripathi, A.K.; Kottantharayil, A. Analysis of field degradation rates observed in all-India survey of photovoltaic module reliability 2018. IEEE J. Photovolt. 2019, 10, 560–567. [Google Scholar] [CrossRef]
- Quansah, D.A.; Adaramola, M.S. Ageing and degradation in solar photovoltaic modules installed in northern Ghana. Sol. Energy 2018, 173, 834–847. [Google Scholar] [CrossRef]
- Bansal, N.; Jaiswal, S.P.; Singh, G. Long term operational performance and experimental on-field degradation measurement of 10 MW PV plant in remote location in India. Energy Sustain. Dev. 2022, 67, 135–150. [Google Scholar] [CrossRef]
- Bansal, N.; Jaiswal, S.P.; Singh, G. Prolonged degradation and reliability assessment of installed modules operational for 10 years in 5 MW PV plant in hot semi-arid climate. Energy Sustain. Dev. 2022, 68, 373–389. [Google Scholar] [CrossRef]
- Aboagye, B.; Gyamfi, S.; Ofosu, E.A.; Djordjevic, S. Characterisation of visual defects on installed solar photovoltaic (pv) modules in different climatic zones in Ghana. Sci. Afr. 2023, 20, e01682. [Google Scholar] [CrossRef]
- Chekal Affari, B.; Kahoul, N.; Haouam, A.; Cheghib, H.; Necaibia, A.; Younes, M.; Kherici, Z. Power losses in PV arrays of field-aged modules. Microelectron. Reliab. 2023, 147, 115052. [Google Scholar] [CrossRef]
- Belhaouas, N.; Mehareb, F.; Kouadri-Boudjelthia, E.; Assem, H.; Bensalem, S.; Hadjrioua, F.; Aissaoui, A.; Hafdaoui, H.; Chahtou, A.; Bakria, K. The performance of solar PV modules with two glass types after 11 years of outdoor exposure under the mediterranean climatic conditions. Sustain. Energy Technol. Assess. 2022, 49, 101771. [Google Scholar] [CrossRef]
- Faye, I.; Ndiaye, A.; Camara, M.; Geke, R.; Blieske, U.; Thiame, M.; Kobor, D. Investigation of Crystalline Silicon Photovoltaic Modules Degradation after 14 years Outdoor Exposure in Cologne Climate (Germany) by Electroluminescence (EL) and Infrared (IR). In Proceedings of the 52nd American Solar Energy Society National Solar Conference 2023, Cham, Germany, 8–11 August 2023; pp. 105–113. [Google Scholar]
- Segbefia, O.K.; Akhtar, N.; Sætre, T.O. Defects and fault modes of field-aged photovoltaic modules in the Nordics. Energy Rep. 2023, 9, 3104–3119. [Google Scholar] [CrossRef]
- Segbefia, O.K.; Akhtar, N.; Sætre, T.O. Moisture induced degradation in field-aged multicrystalline silicon photovoltaic modules. Sol. Energy Mater. Sol. Cells 2023, 258, 112407. [Google Scholar] [CrossRef]
- Olivencia Polo, F.A.; Ferrero Bermejo, J.; Gómez Fernández, J.F.; Crespo Márquez, A. Failure mode prediction and energy forecasting of PV plants to assist dynamic maintenance tasks by ANN based models. Renew. Energy 2015, 81, 227–238. [Google Scholar] [CrossRef]
- Sepanski, A.; Reil, F.; Vaaßen, W.; Janknecht, E.; Hupach, U.; Bogdanski, N.; van Heeckeren, B. Assessing Fire Risks in Photovoltaic Systems and Developing Safety Concepts for Risk Minimization. 2018. Available online: https://www.energy.gov/eere/solar/articles/assessing-fire-risks-photovoltaic-systems-and-developing-safety-concepts-risk (accessed on 3 August 2023).
- Cancelliere, P. PV electrical plants fire risk assessment and mitigation according to the Italian national fire services guidelines. Fire Mater. 2016, 40, 355–367. [Google Scholar] [CrossRef]
- Mohd Nizam Ong, N.A.F.; Mohd Tohir, M.Z.; Mutlak, M.M.; Sadiq, M.A.; Omar, R.; Md Said, M.S. BowTie analysis of rooftop grid-connected photovoltaic systems. Process Saf. Prog. 2022, 41, S106–S117. [Google Scholar] [CrossRef]
- Wohlgemuth, J.H.; Kurtz, S.R. How can we make PV modules safer? In Proceedings of the 2012 38th IEEE Photovoltaic Specialists Conference, Austin, TX, USA, 3–8 June 2012; pp. 3162–3165. [Google Scholar]
- Aram, M.; Zhang, X.; Qi, D.; Ko, Y. A State-of-the-Art Review of Fire Safety of Photovoltaic Systems in Buildings. J. Clean. Prod. 2021, 308, 127239. [Google Scholar] [CrossRef]
- Blazey, S. Fire and Solar PV Systems–Investigations and Evidence; Report Number: P100874-1004; July; 2017; Available online: https://helios-om.com/wp-content/uploads/2020/07/Fires_and_solar_PV_systems-Investigations_Evidence_Issue_2.9.pdf (accessed on 5 August 2023).
- Wu, Z.; Hu, Y.; Wen, J.X.; Zhou, F.; Ye, X. A review for solar panel fire accident prevention in large-scale PV applications. IEEE Access 2020, 8, 132466–132480. [Google Scholar] [CrossRef]
- Schulze, K.; Groh, M.; Nieß, M.; Vodermayer, C.; Wotruba, G.; Becker, G. Untersuchung von Alterungseffekten bei monokristallinen PV-Modulen mit mehr als 15 Betriebsjahren durch Elektrolumineszenz-und Leistungsmessung. In Proceedings of the 28th Symposium Photovoltaische Solarenergie, Frankfurt, Germany, 24–28 September 2012. [Google Scholar]
- Jordan, D.C.; Kurtz, S.R. Photovoltaic degradation rates—An analytical review. Prog. Photovolt. Res. Appl. 2013, 21, 12–29. [Google Scholar] [CrossRef]
- Durand, S.; Bowling, D. Field Experience with Photovoltaic Systems: Ten-Year Assessment; Final Report; Electric Power Research Inst.: Palo Alto, CA, USA; Southwest: Dallas, TX, USA, 1993. [Google Scholar]
- IEC 60050-191; International Electrotechnical Vocabulary: Chapter 191: Dependability and Quality of Service. International Electrotechnical Commission: Geneva, Switzerland, 1990.
- Jordan, D.; Haegel, N.; Barnes, T. Photovoltaics module reliability for the terawatt age. Prog. Energy 2022, 4, 022002. [Google Scholar] [CrossRef]
- Romero-Fiances, I.; Livera, A.; Theristis, M.; Makrides, G.; Stein, J.S.; Nofuentes, G.; de la Casa, J.; Georghiou, G.E. Impact of duration and missing data on the long-term photovoltaic degradation rate estimation. Renew. Energy 2022, 181, 738–748. [Google Scholar] [CrossRef]
- Heywang, W.; Zaininger, K.H. Silicon: The semiconductor material. In Silicon; Springer: Berlin/Heidelberg, Germany, 2004; pp. 25–42. [Google Scholar]
- Kılıç, A.; Öztürk, A. Güneş Enerjisi; Kipaş Dağıtımcılık: Istanbul, Turkey, 1983. [Google Scholar]
- Gürtürk, M.; Benli, H.; Ertürk, N.K. Determination of the effects of temperature changes on solar glass used in photovoltaic modules. Renew. Energy 2020, 145, 711–724. [Google Scholar] [CrossRef]
- Afridi, M.; Kumar, A.; ibne Mahmood, F.; Tamizhmani, G. Hotspot testing of glass/backsheet and glass/glass PV modules pre-stressed in extended thermal cycling. Sol. Energy 2023, 249, 467–475. [Google Scholar] [CrossRef]
- Tsanakas, J.A.; Ha, L.; Buerhop, C. Faults and infrared thermographic diagnosis in operating c-Si photovoltaic modules: A review of research and future challenges. Renew. Sustain. Energy Rev. 2016, 62, 695–709. [Google Scholar] [CrossRef]
- Enaganti, P.K.; Bhattacharjee, A.; Ghosh, A.; Chanchangi, Y.N.; Chakraborty, C.; Mallick, T.K.; Goel, S. Experimental investigations for dust build-up on low-iron glass exterior and its effects on the performance of solar PV systems. Energy 2022, 239, 122213. [Google Scholar] [CrossRef]
- Tagawa, K.; Kutani, A.; Qinglin, P. Effect of sand erosion of glass surface on performances of photovoltaic module. In Proceedings of the Sustainable Research and Innovation Conference, Nairobi, Kenya, 5–7 October 2022; pp. 75–77. [Google Scholar]
- King, D.; Quintana, M.; Kratochvil, J.; Ellibee, D.; Hansen, B. Photovoltaic module performance and durability following long-term field exposure. Prog. Photovolt. Res. Appl. 2000, 8, 241–256. [Google Scholar] [CrossRef]
- King, D.; Pern, F.; Pitts, J.; Bingham, C.; Czanderna, A. Optical changes in cerium-containing glass as a result of accelerated exposure testing [of PV modules]. In Proceedings of the Conference Record of the Twenty Sixth IEEE Photovoltaic Specialists Conference-1997, Anaheim, CA, USA, 29 September–3 October 1997; pp. 1117–1120. [Google Scholar]
- Kempe, M.D.; Moricone, T.; Kilkenny, M. Effects of cerium removal from glass on photovoltaic module performance and stability. In Proceedings of the Reliability of Photovoltaic Cells, Modules, Components, and Systems II; SPIE: Bellingham, DC, USA, 2009; p. 74120Q. [Google Scholar]
- Quansah, D.A.; Adaramola, M.S. Comparative study of performance degradation in poly- and mono-crystalline-Si solar PV modules deployed in different applications. Int. J. Hydrogen Energy 2018, 43, 3092–3109. [Google Scholar] [CrossRef]
- Dietrich, S.; Pander, M.; Ebert, M.; Bagdahn, J. Mechanical assessment of large photovoltaic modules by test and finite element analysis. In Proceedings of the 23rd European Photovoltaic Solar Energy Conference, Valencia, Spain, 1–5 September 2008. [Google Scholar]
- Cavieres, R.; Barraza, R.; Estay, D.; Bilbao, J.; Valdivia-Lefort, P. Automatic soiling and partial shading assessment on PV modules through RGB images analysis. Appl. Energy 2022, 306, 117964. [Google Scholar] [CrossRef]
- Bora, B.; Sastry, O.S.; Kumar, R.; Dubey, R.; Chattopadhyay, S.; Vasi, J.; Mondal, S.; Prasad, B. Failure mode analysis of PV modules in different climatic conditions. IEEE J. Photovolt. 2020, 11, 453–460. [Google Scholar] [CrossRef]
- Chandel, S.S.; Nagaraju Naik, M.; Sharma, V.; Chandel, R. Degradation analysis of 28 year field exposed mono-c-Si photovoltaic modules of a direct coupled solar water pumping system in western Himalayan region of India. Renew. Energy 2015, 78, 193–202. [Google Scholar] [CrossRef]
- Titu-Marius, B. Some reliability aspects of photovoltaic modules. In Reliability and Ecological Aspects of Photovoltaic Modules; IntechOpen: Rijeka, Croatia, 2020. [Google Scholar]
- Castaner, L.; Silvestre, S. Modelling Photovoltaic Systems Using PSpice; John Wiley and Sons: Hoboken, NJ, USA, 2002. [Google Scholar]
- Deng, S.; Zhang, Z.; Ju, C.; Dong, J.; Xia, Z.; Yan, X.; Xu, T.; Xing, G. Research on hot spot risk for high-efficiency solar module. Energy Procedia 2017, 130, 77–86. [Google Scholar] [CrossRef]
- Meyer, E.L.; Van Dyk, E.E. The effect of reduced shunt resistance and shading on photovoltaic module performance. In Proceedings of the Conference Record of the Thirty-First IEEE Photovoltaic Specialists Conference, Lake Buena Vista, FL, USA, 3–7 January 2005; pp. 1331–1334. [Google Scholar]
- Vankadara, S.K.; Chatterjee, S.; Balachandran, P.K. An accurate analytical modeling of solar photovoltaic system considering Rs and Rsh under partial shaded condition. Int. J. Syst. Assur. Eng. Manag. 2022, 13, 2472–2481. [Google Scholar] [CrossRef]
- Ghanbari, T. Permanent partial shading detection for protection of photovoltaic panels against hot spotting. IET Renew. Power Gener. 2016, 11, 123–131. [Google Scholar] [CrossRef]
- Jadin, M.S.B.; Safian, S.F.A.; Ghazali, K.H.; Ven, T.L.; Shah, A.S.M. Hotspot Detection in Photovoltaic Array Using Thermal Imaging Method. In Proceedings of the 6th International Conference on Electrical, Control and Computer Engineering, Kuantan, Malaysia, 23 August 2022; pp. 101–107. [Google Scholar]
- Hossion, M.A. Visual and electrical degradation data of five years aged rooftop photovoltaic modules. Data Brief 2020, 31, 105762. [Google Scholar] [CrossRef] [PubMed]
- Hasan, O.; Arif, A. Performance and life prediction model for photovoltaic modules: Effect of encapsulant constitutive behavior. Sol. Energy Mater. Sol. Cells 2014, 122, 75–87. [Google Scholar] [CrossRef]
- Miller, D.C.; Bokria, J.G.; Burns, D.M.; Fowler, S.; Gu, X.; Hacke, P.L.; Honeker, C.C.; Kempe, M.D.; Köhl, M.; Phillips, N.H. Degradation in photovoltaic encapsulant transmittance: Results of the first PVQAT TG5 artificial weathering study. Prog. Photovolt. Res. Appl. 2019, 27, 391–409. [Google Scholar] [CrossRef]
- López-Escalante, M.; Caballero, L.J.; Martín, F.; Gabás, M.; Cuevas, A.; Ramos-Barrado, J. Polyolefin as PID-resistant encapsulant material in PV modules. Sol. Energy Mater. Sol. Cells 2016, 144, 691–699. [Google Scholar] [CrossRef]
- Kempe, M. Overview of scientific issues involved in selection of polymers for PV applications. In Proceedings of the 2011 37th IEEE Photovoltaic Specialists Conference, Seattle, WA, USA, 19–24 June 2011; pp. 000085–000090. [Google Scholar]
- Habersberger, B.M.; Hacke, P.; Madenjian, L.S. Evaluation of the PID-s susceptibility of modules encapsulated in materials of varying resistivity. In Proceedings of the 2018 IEEE 7th World Conference on Photovoltaic Energy Conversion (WCPEC) (A Joint Conference of 45th IEEE PVSC, 28th PVSEC & 34th EU PVSEC), Amsterdam, The Netherlands, 10–15 June 2018; pp. 3807–3809. [Google Scholar]
- Kapur, J.; Stika, K.M.; Westphal, C.S.; Norwood, J.L.; Hamzavytehrany, B. Prevention of potential-induced degradation with thin ionomer film. IEEE J. Photovolt. 2014, 5, 219–223. [Google Scholar] [CrossRef]
- Azam, M.F.; Shahzad, N.; Rafique, A.; Ayub, M.; Khalid, H.A.; Waqas, A. Accelerated UV stress testing and characterization of PV-modules: Reliability analysis using different encapsulants and glass sheets. Sustain. Energy Technol. Assess. 2023, 56, 103119. [Google Scholar] [CrossRef]
- Peike, C.; Purschke, L.; Weiss, K.-A.; Köhl, M.; Kempe, M. Towards the origin of photochemical EVA discoloration. In Proceedings of the 2013 IEEE 39th Photovoltaic Specialists Conference (PVSC), Tampa, FL, USA, 16–21 June 2013; pp. 1579–1584. [Google Scholar]
- Kyranaki, N.; Smith, A.; Yendall, K.; Hutt, D.A.; Whalley, D.C.; Gottschalg, R.; Betts, T.R. Damp-heat induced degradation in photovoltaic modules manufactured with passivated emitter and rear contact solar cells. Prog. Photovolt. Res. Appl. 2022, 30, 1061–1071. [Google Scholar] [CrossRef]
- Badiee, A.; Ashcroft, I.; Wildman, R.D. The thermo-mechanical degradation of ethylene vinyl acetate used as a solar panel adhesive and encapsulant. Int. J. Adhes. Adhes. 2016, 68, 212–218. [Google Scholar] [CrossRef]
- Desai, U.; Sharma, B.K.; Singh, A.; Singh, A. A comparison of evolution of adhesion mechanisms and strength post damp-heat aging for a range of VA content in EVA encapsulant with photovoltaic backsheet. Sol. Energy 2022, 231, 908–920. [Google Scholar] [CrossRef]
- Lathrop, J.W.; Hartman, R.A.; Saylor, C.R. Investigation of Reliability Attributes and Accelerated Stress Factors on Terrestrial Solar Cells. 1981. Available online: https://ntrs.nasa.gov/citations/19810011041 (accessed on 3 August 2023).
- Bansal, N.; Jaiswal, S.P.; Singh, G. Comparative investigation of performance evaluation, degradation causes, impact and corrective measures for ground mount and rooftop solar PV plants—A review. Sustain. Energy Technol. Assess. 2021, 47, 101526. [Google Scholar] [CrossRef]
- Manganiello, P.; Balato, M.; Vitelli, M. A survey on mismatching and aging of PV modules: The closed loop. IEEE Trans. Ind. Electron. 2015, 62, 7276–7286. [Google Scholar] [CrossRef]
- Stark, W.; Jaunich, M. Investigation of Ethylene/Vinyl Acetate Copolymer (EVA) by thermal analysis DSC and DMA. Polym. Test. 2011, 30, 236–242. [Google Scholar] [CrossRef]
- Gok, A.; Gordon, D.A.; Wang, M.; French, R.H.; Bruckman, L.S. Degradation Science and Pathways in PV Systems. In Durability and Reliability of Polymers and Other Materials in Photovoltaic Modules; Elsevier: Amsterdam, The Netherlands, 2019; pp. 47–93. [Google Scholar]
- Perret-Aebi, L.E.; Li, H.Y.; Théron, R.; Roeder, G.; Luo, Y.; Turlings, T.; Lange, R.F.M.; Ballif, C. Insights on EVA lamination process: Where do the Bubbles Come from. In Proceedings of the 25th European Photovoltaic Solar Energy Conference and Exhibition, Valencia, Spain, 6–10 September 2010. [Google Scholar]
- Karthikeyan, S.; Ajay, G.B.; Ahamed, N.R.; Sharun, A. Edge AI–Based Aerial Monitoring. In Applied Edge AI: Concepts, Platforms, and Industry Use Cases; Auerbach Publications: Boca Raton, FL, USA; CRC Press: Boca Raton, FL, USA, 2022. [Google Scholar]
- Shrestha, S.M.; Mallineni, J.K.; Yedidi, K.R.; Knisely, B.; Tatapudi, S.; Kuitche, J.; TamizhMani, G. Determination of dominant failure modes using FMECA on the field deployed c-Si modules under hot-dry desert climate. IEEE J. Photovolt. 2014, 5, 174–182. [Google Scholar] [CrossRef]
- Rajput, P.; Tiwari, G.N.; Sastry, O.S.; Bora, B.; Sharma, V. Degradation of mono-crystalline photovoltaic modules after 22 years of outdoor exposure in the composite climate of India. Sol. Energy 2016, 135, 786–795. [Google Scholar] [CrossRef]
- de Oliveira, M.C.C.; Cardoso, A.S.A.D.; Viana, M.M.; Lins, V.d.F.C. The causes and effects of degradation of encapsulant ethylene vinyl acetate copolymer (EVA) in crystalline silicon photovoltaic modules: A review. Renew. Sustain. Energy Rev. 2018, 81, 2299–2317. [Google Scholar] [CrossRef]
- Frederick, J.; Snell, H.; Haywood, E. Solar ultraviolet radiation at the earth’s surface. Photochem. Photobiol. 1989, 50, 443–450. [Google Scholar] [CrossRef]
- Klampaftis, E.; Congiu, M.; Robertson, N.; Richards, B.S. Luminescent ethylene vinyl acetate encapsulation layers for enhancing the short wavelength spectral response and efficiency of silicon photovoltaic modules. IEEE J. Photovolt. 2011, 1, 29–36. [Google Scholar] [CrossRef]
- Kamel, M.S.A.; Oelgemöller, M.; Jacob, M.V. Sustainable plasma polymer encapsulation materials for organic solar cells. J. Mater. Chem. A 2022, 10, 4683–4694. [Google Scholar] [CrossRef]
- Segbefia, O.K. Temperature profiles of field-aged photovoltaic modules affected by optical degradation. Heliyon 2023, 9, e19566. [Google Scholar] [CrossRef] [PubMed]
- Holley, W.H.; Agro, S.C.; Galica, J.P.; Thoma, L.A.; Yorgensen, R.S.; Ezrin, M.; Klemchuk, P.; Lavigne, G. Investigation into the causes of browning in EVA encapsulated flat plate PV modules. In Proceedings of the 1994 IEEE 1st World Conference on Photovoltaic Energy Conversion-WCPEC (A Joint Conference of PVSC, PVSEC and PSEC), Waikoloa, HI, USA, 5–9 December 1994; pp. 893–896. [Google Scholar]
- Jiang, S.; Wang, K.; Zhang, H.; Ding, Y.; Yu, Q. Encapsulation of PV modules using ethylene vinyl acetate copolymer as the encapsulant. Macromol. React. Eng. 2015, 9, 522–529. [Google Scholar] [CrossRef]
- Noman, M.; Tu, S.; Ahmad, S.; Zafar, F.U.; Khan, H.A.; Rehman, S.U.; Waqas, M.; Khan, A.D.; Rehman, O.U. Assessing the reliability and degradation of 10–35 years field-aged PV modules. PLoS ONE 2022, 17, e0261066. [Google Scholar] [CrossRef] [PubMed]
- Arularasu, P. Combined UV-Temperature-Humidity Accelerated Testing of PV Modules: Reliability of UV-Cut and UV-Pass EVA Encapsulants; Arizona State University: Tempe, AZ, USA, 2019. [Google Scholar]
- ISO 17223; Plastics—Determination of Yellowness Index and Change in Yellowness Index. ISO: Geneva, Switzerland, 2014.
- de Oliveira, M.C.C.; Cassini, D.A.; Diniz, A.S.A.C.; Soares, L.G.; Viana, M.M.; Kazmerski, L.L.; Lins, V.d.F.C. Comparison and analysis of performance and degradation differences of crystalline-Si photovoltaic modules after 15-years of field operation. Sol. Energy 2019, 191, 235–250. [Google Scholar] [CrossRef]
- Yong, H.; Minemoto, T.; Takahashi, T. Dependence of Photovoltage on Incident Photon Energies Investigated by Photo-assisted Kelvin Probe Force Microscopy on Cu (In, Ga) Se 2 Solar Cells. In Proceedings of the 2018 IEEE 7th World Conference on Photovoltaic Energy Conversion (WCPEC) (A Joint Conference of 45th IEEE PVSC, 28th PVSEC & 34th EU PVSEC), Hilto Waikoloa Village, United States, 10–15 June 2018; pp. 1966–1969. [Google Scholar]
- Adothu, B.; Chattopadhyay, S.; Bhatt, P.; Hui, P.; Costa, F.R.; Mallick, S. Early-stage identification of encapsulants photobleaching and discoloration in crystalline silicon photovoltaic module laminates. Prog. Photovolt. Res. Appl. 2020, 28, 767–778. [Google Scholar] [CrossRef]
- Kaplani, E. Detection of degradation effects in field-aged c-Si solar cells through IR thermography and digital image processing. Int. J. Photoenergy 2012, 2012, 396792. [Google Scholar] [CrossRef]
- Kurtz, S. Photovoltaic Module Reliability Workshop; National Renewable Energy Lab (NREL): Golden, CO, USA, 2014. [Google Scholar] [CrossRef]
- Ferrara, C.; Philipp, D. Why Do PV Modules Fail? Energy Procedia 2012, 15, 379–387. [Google Scholar] [CrossRef]
- Rosillo, F.; Alonso-Garcia, M. Evaluation of color changes in PV modules using reflectance measurements. Sol. Energy 2019, 177, 531–537. [Google Scholar] [CrossRef]
- Pern, F.; Czanderna, A.; Emery, K.; Dhere, R. Weathering degradation of EVA encapsulant and the effect of its yellowing on solar cell efficiency. In Proceedings of the the Conference Record of the Twenty-Second IEEE Photovoltaic Specialists Conference-1991, Las Vegas, NV, USA, 7–11 October 1991; pp. 557–561. [Google Scholar]
- Dechthummarong, C.; Wiengmoon, B.; Chenvidhya, D.; Jivacate, C.; Kirtikara, K. Physical deterioration of encapsulation and electrical insulation properties of PV modules after long-term operation in Thailand. Sol. Energy Mater. Sol. Cells 2010, 94, 1437–1440. [Google Scholar] [CrossRef]
- Photovoltaic, C.S.T. Modules—Design Qualification and Type Approval. IEC 2005, 1215, 2005. [Google Scholar]
- Diniz, A.S.A.; Cassini, D.A.; de Oliveira, M.C.; de Lins, V.F.; Viana, M.M.; Braga, D.S.; Kazmerski, L.L. Evaluation of Performance Losses and Degradation of Aged Crystalline Si Photovoltaic Modules Installed in Minas Gerais (Brazil). In Renewable Energy and Sustainable Buildings; Springer: Berlin/Heidelberg, Germany, 2020; pp. 29–46. [Google Scholar]
- Dhimish, M. Micro cracks distribution and power degradation of polycrystalline solar cells wafer: Observations constructed from the analysis of 4000 samples. Renew. Energy 2020, 145, 466–477. [Google Scholar] [CrossRef]
- Eslami Majd, A.; Ekere, N.N. Crack initiation and growth in PV module interconnection. Sol. Energy 2020, 206, 499–507. [Google Scholar] [CrossRef]
- Grunow, P.; Clemens, P.; Hoffmann, V.; Litzenburger, B.; Podlowski, L. Influence of micro cracks in multi-crystalline silicon solar cells on the reliability of PV modules. In Proceedings of the 20th EUPVSEC, Barcelona, Spain, 6–10 June 2005; pp. 2042–2047. [Google Scholar]
- BrightSpot Automation, L.L.C.; Westford, M.A. Solar panel design factors to reduce the impact of cracked cells and the tendency for crack propagation. In Proceedings of the NREL PV Module Reliability Workshop, Denver, CO, USA, 4 February 2015. [Google Scholar]
- Sander, M.; Dietrich, S.; Pander, M.; Schweizer, S.; Ebert, M.; Bagdahn, J. Investigations on crack development and crack growth in embedded solar cells. Reliab. Photovolt. Cells Modul. Compon. Syst. IV 2011, 8112, 811209. [Google Scholar]
- Buerhop, C.; Schlegel, D.; Vodermayer, C.; Nieß, M. Quality control of PV-modules in the field using infrared-thermography. In Proceedings of the 26th European Photovoltaic Solar Energy Conference, Hamburg, Germany, 5–9 September 2011; pp. 3894–3897. [Google Scholar]
- Siruvuri, S.V.; Budarapu, P.R.; Paggi, M. Influence of cracks on fracture strength and electric power losses in Silicon solar cells at high temperatures: Deep machine learning and molecular dynamics approach. Appl. Phys. A 2023, 129, 408. [Google Scholar] [CrossRef]
- Dhimish, M.; Holmes, V.; Mehrdadi, B.; Dales, M. The impact of cracks on photovoltaic power performance. J. Sci. Adv. Mater. Devices 2017, 2, 199–209. [Google Scholar] [CrossRef]
- Sohail, A.; Ul Islam, N.; Ul Haq, A.; Ul Islam, S.; Shafi, I.; Park, J. Fault detection and computation of power in PV cells under faulty conditions using deep-learning. Energy Rep. 2023, 9, 4325–4336. [Google Scholar] [CrossRef]
- Dolara, A.; Leva, S.; Manzolini, G.; Ogliari, E. Investigation on performance decay on photovoltaic modules: Snail trails and cell microcracks. IEEE J. Photovolt. 2014, 4, 1204–1211. [Google Scholar] [CrossRef]
- Sinaga, R. Turnitin: A Preliminary Study of Common Defects of Photovoltaic Modules in West Timor, Indonesia. In Proceedings of the IOP Conference Series: Earth and Environmental Science 2020, Bogor, Indonesia, 1 July 2020; Volume 542, p. 012041. [Google Scholar]
- Duerr, I.; Bierbaum, J.; Metzger, J.; Richter, J.; Philipp, D. Silver Grid Finger Corrosion on Snail Track affected PV Modules—Investigation on Degradation Products and Mechanisms. Energy Procedia 2016, 98, 74–85. [Google Scholar] [CrossRef]
- Swanson, R.; Cudzinovic, M.; DeCeuster, D.; Desai, V.; Jürgens, J.; Kaminar, N.; Mulligan, W.; Rodrigues-Barbarosa, L.; Rose, D.; Smith, D. The surface polarization effect in high-efficiency silicon solar cells. In Proceedings of the 15th PVSEC, Shanghai, China, 10–15 October 2005. [Google Scholar]
- Yamaguchi, S.; Masuda, A.; Marumoto, K.; Ohdaira, K. Mechanistic Understanding of Polarization-Type Potential-Induced Degradation in Crystalline-Silicon Photovoltaic Cell Modules. Adv. Energy Sustain. Res. 2023, 4, 2200167. [Google Scholar] [CrossRef]
- Köntges, M.; Oreski, G.; Jahn, U.; Herz, M.; Hacke, P.; Weiß, K.-A. Assessment of Photovoltaic Module Failures in the Field: International Energy Agency Photovoltaic Power Systems Programme: IEA PVPS Task 13, Subtask 3: Report IEA-PVPS T13-09: 2017; International Energy Agency: Paris, France, 2017. [Google Scholar]
- Pingel, S.; Janke, S.; Frank, O. Recovery methods for modules affected by potential induced degradation (PID). In Proceedings of the 27th European Photovoltaic Solar Energy Conference and Exhibition (Frankfurt), Frankfurt, Germany, 24–28 September 2012; pp. 3379–3383. [Google Scholar]
- Molto, C.; Oh, J.; Mahmood, F.I.; Li, M.; Hacke, P.; Li, F.; Smith, R.; Colvin, D.; Matam, M.; DiRubio, C. Review of Potential-Induced Degradation in Bifacial Photovoltaic Modules. Energy Technol. 2023, 11, 2200943. [Google Scholar] [CrossRef]
- Gallardo-Saavedra, S.; Hernández-Callejo, L.; del Carmen Alonso-García, M.; Santos, J.D.; Morales-Aragonés, J.I.; Alonso-Gómez, V.; Moretón-Fernández, Á.; González-Rebollo, M.Á.; Martínez-Sacristán, O. Nondestructive characterization of solar PV cells defects by means of electroluminescence, infrared thermography, I–V curves and visual tests: Experimental study and comparison. Energy 2020, 205, 117930. [Google Scholar] [CrossRef]
- Köntges, M.; Kajari-Schröder, S.; Kunze, I. Cell cracks measured by UV fluorescence in the field. In Proceedings of the 27th EU PVSEC, Frankfurt, Germany, 24–28 September 2012; pp. 3033–3040. [Google Scholar]
- Colvin, D.J.; Schneller, E.J.; Davis, K.O. Impact of interconnection failure on photovoltaic module performance. Prog. Photovolt. Res. Appl. 2021, 29, 524–532. [Google Scholar] [CrossRef]
- Majd, A.E.; Ekere, N.N.; Darvazi, A.R.; Sedehi, A.A. Creep-fatigue lifetime estimation of efficient photovoltaic module ribbon interconnections. Microelectron. Reliab. 2022, 139, 114831. [Google Scholar] [CrossRef]
- Köntges, M.; Altmann, S.; Heimberg, T.; Jahn, U.; Berger, K.A. Mean degradation rates in PV systems for various kinds of PV module failures. In Proceedings of the 32nd European Photovoltaic Solar Energy Conference and Exhibition, Munich, Germany, 20–24 June 2016; pp. 21–24. [Google Scholar]
- Kurtz, S. 2017 NREL Photovoltaic Reliability Workshop; National Renewable Energy Laboratory (NREL): Golden, CO, USA, 2017. [Google Scholar]
- Illya, G.; Handara, V.; Siahandan, M.; Nathania, A.; Budiman, A.S. Mechanical Studies of Solar Photovoltaics (PV) Backsheets Under Salt Damp Heat Environments. Procedia Eng. 2017, 215, 238–245. [Google Scholar] [CrossRef]
- Oreski, G.; Barretta, C.; Macher, A.; Eder, G.; Neumaier, L.; Feichtner, M.; Aarnio Winterhof, M. Investigation of the Crack Propensity of Co-Extruded Polypropylene Backsheet Films for Photovoltaic Modules. Sol. Energy Mater. Sol. Cells 2023, 259, 112438. [Google Scholar] [CrossRef]
- Elfaqih, A.K.; Tawil, I.H. Mechanical Behavior Study of PPCF Material as Solar Photovoltaic Backsheet. In Proceedings of the 2022 IEEE 2nd International Maghreb Meeting of the Conference on Sciences and Techniques of Automatic Control and Computer Engineering, Sabrata, Libya, 23–25 May 2022; pp. 650–654. [Google Scholar]
- Pascual, J.; García, M.; Marcos, J.; Marroyo, L. Analysis of polyamide and fluoropolymer backsheets: Degradation and insulation failure in field-aged photovoltaic modules. Prog. Photovolt. Res. Appl. 2023, 31, 494–505. [Google Scholar] [CrossRef]
- Gebhardt, P.; Bauermann, L.P.; Philipp, D. Backsheet Chalking—Theoretical Background and Relation to Backsheet Cracking and Insulation Failures. In Proceedings of the 35th European Photovoltaic Solar Energy Conference and Exhibition, Brussels, Belgium, 24–28 September 2018; pp. 24–28. [Google Scholar]
- Uličná, S.; Owen-Bellini, M.; Moffitt, S.L.; Sinha, A.; Tracy, J.; Roy-Choudhury, K.; Miller, D.C.; Hacke, P.; Schelhas, L.T. A study of degradation mechanisms in PVDF-based photovoltaic backsheets. Sci. Rep. 2022, 12, 14399. [Google Scholar] [CrossRef]
- Xia, J.; Liu, Y.; Hu, H.; Zhu, X.; Lv, H.; Phillips, N.H.; Choudhury, K.R.; Gambogi, W.J.; Rodriguez, M.; Simon, E.S. Impact of specimen preparation method on photovoltaic backsheet degradation during accelerated aging test. Energy Sci. Eng. 2022, 10, 1961–1971. [Google Scholar] [CrossRef]
- Mühleisen, W. Minimizing Crack Propagation in Cracked PV Backsheets with Repair Coatings. In Proceedings of the 8th World Conference on Photovoltaic Energy Conversion, Milan, Italy, 26–30 September 2022. [Google Scholar]
- Beaucarne, G.; Eder, G.; Jadot, E.; Voronko, Y.; Mühleisen, W. Repair and preventive maintenance of photovoltaic modules with degrading backsheets using flowable silicone sealant. Prog. Photovolt. Res. Appl. 2022, 30, 1045–1053. [Google Scholar] [CrossRef]
- Wu, Z.; Lyu, S.; Peng, Q.; Han, H.; Zhu, D. Thermomechanical Stress Distribution Analysis of Junction Box on Silicon Photovoltaic Modules Based on Finite Element Analysis. IEEE J. Photovolt. 2019, 9, 1716–1720. [Google Scholar] [CrossRef]
- Diaz-Dorado, E.; Suárez-García, A.; Carrillo, C.; Cidras, J. Influence of the shadows in photovoltaic systems with different configurations of bypass diodes. In Proceedings of the SPEEDAM 2010, Pisa, Italy, 14–16 June 2010; pp. 134–139. [Google Scholar]
- Bakır, H. A comparative evaluation and real-time measurement of failures in solar power plants by thermal imaging in Turkey. Therm. Sci. Eng. Prog. 2023, 42, 101945. [Google Scholar] [CrossRef]
- Kim, M.-S.; Kim, D.-H.; Kim, H.-J.; Prabakar, K. A Novel Strategy for Monitoring a PV Junction Box Based on LoRa in a 3 kW Residential PV System. Electronics 2022, 11, 709. [Google Scholar] [CrossRef]
- Brecl, K.; Pirc, M.; Bokalič, M.; Morelj, D.; Topič, M. PV module behaviour on the substring level under real conditions monitored by junction box electronic device Jubomer. IET Renew. Power Gener. 2019, 13, 2802–2806. [Google Scholar] [CrossRef]
- Ong, N.A.F.M.N.; Sadiq, M.A.; Said, M.S.M.; Jomaas, G.; Tohir, M.Z.M.; Kristensen, J.S. Fault tree analysis of fires on rooftops with photovoltaic systems. J. Build. Eng. 2022, 46, 103752. [Google Scholar]
- Daher, D.H.; Aghaei, M.; Quansah, D.A.; Adaramola, M.S.; Parvin, P.; Ménézo, C. Multi-pronged degradation analysis of a photovoltaic power plant after 9.5 years of operation under hot desert climatic conditions. Prog. Photovolt. Res. Appl. 2023, 31, 888–907. [Google Scholar] [CrossRef]
- Vo, T.T.E.; Ko, H.; Huh, J.; Park, N. Overview of possibilities of solar floating photovoltaic systems in the offshore industry. Energies 2021, 14, 6988. [Google Scholar] [CrossRef]
- Ghosh, A. A comprehensive review of water based PV: Flotavoltaics, under water, offshore & canal top. Ocean Eng. 2023, 281, 115044. [Google Scholar] [CrossRef]
- Tabet, S.; Ihaddadene, R.; Guerira, B.; Ihaddadene, N. Impact of Dust and Degradation on the Electrical Properties of PV Panels. J. Renew. Energy Environ. 2023, 10, 78–88. [Google Scholar]
- Xue-Yan, L.; Ji-Gao, Z. Dust corrosion. In Proceedings of the 50th IEEE Holm Conference on Electrical Contacts and the 22nd International Conference on Electrical Contacts Electrical Contacts, Seattle, WA, USA, 23 September 2004; pp. 255–262. [Google Scholar]
- Karimi, M.; Samet, H.; Ghanbari, T.; Moshksar, E. A current based approach for hotspot detection in photovoltaic strings. Int. Trans. Electr. Energy Syst. 2020, 30, e12517. [Google Scholar] [CrossRef]
- Kim, K.A.; Krein, P.T. Hot spotting and second breakdown effects on reverse IV characteristics for mono-crystalline Si photovoltaics. In Proceedings of the 2013 IEEE Energy Conversion Congress and Exposition, Denver, CO, USA, 15–19 September 2013; pp. 1007–1014. [Google Scholar]
- AE-Solar. Smart Modules with Hot-Spot Free Technology; AE-Solar Alternative Energy: Bavaria, Germany, 2018. [Google Scholar]
- Ross, R.G. PV reliability development lessons from JPL’s flat plate solar array project. IEEE J. Photovolt. 2013, 4, 291–298. [Google Scholar] [CrossRef]
- Oufettoul, H.; Motahhir, S.; Aniba, G.; Masud, M.; AlZain, M.A. Improved TCT topology for shaded photovoltaic arrays. Energy Rep. 2022, 8, 5943–5956. [Google Scholar] [CrossRef]
- Spanoche, S.A.; Stewart, J.D.; Hawley, S.L.; Opris, I.E. Model-based method for partially shaded PV modules hot spot suppression. In Proceedings of the 2012 IEEE 38th Photovoltaic Specialists Conference (PVSC) PART 2, Austin, TX, USA, 3–8 June 2012; pp. 1–7. [Google Scholar]
- Herrmann, W.; Wiesner, W.; Vaassen, W. Hot spot investigations on PV modules-new concepts for a test standard and consequences for module design with respect to bypass diodes. In Proceedings of the Conference Record of the Twenty Sixth IEEE Photovoltaic Specialists Conference, Anaheim, CA, USA, 29 September–3 October 1997; pp. 1129–1132. [Google Scholar]
- Bakır, H. Detection of Faults in Photovoltaic Modules of SPPS in Turkey; Infrared Thermographic Diagnosis and Recommendations. J. Electr. Eng. Technol. 2023, 18, 1945–1957. [Google Scholar] [CrossRef]
- Ghosh, S.; Singh, S.K.; Yadav, V.K. Experimental investigation of hotspot phenomenon in PV arrays under mismatch conditions. Sol. Energy 2023, 253, 219–230. [Google Scholar] [CrossRef]
- Al Mahdi, H.A.; Leahy, P.G.; Morrison, A.P. Predicting Early EVA Degradation in Photovoltaic Modules From Short Circuit Current Measurements. IEEE J. Photovolt. 2021, 11, 1188–1196. [Google Scholar] [CrossRef]
- Kuitche, J.M.; Pan, R.; TamizhMani, G. Investigation of Dominant Failure Mode(s) for Field-Aged Crystalline Silicon PV Modules under Desert Climatic Conditions. IEEE J. Photovolt. 2014, 4, 814–826. [Google Scholar] [CrossRef]
- Hong, Y.-Y.; Pula, R.A. Methods of photovoltaic fault detection and classification: A review. Energy Rep. 2022, 8, 5898–5929. [Google Scholar] [CrossRef]
- Tanaka, K.; Matsumoto, K.I.; Keeley, A.R.; Managi, S. The impact of weather changes on the supply and demand of electric power and wholesale prices of electricity in Germany. Sustain. Sci. 2022, 17, 1813–1825. [Google Scholar] [CrossRef]
- Tripathi, A.K.; Aruna, M.; Murthy, C.S.N. Output power loss of photovoltaic panel due to dust and temperature. Int. J. Renew. Energy Res. 2017, 7, 439–442. [Google Scholar]
- Hasan, K.; Yousuf, S.B.; Tushar, M.S.H.K.; Das, B.K.; Das, P.; Islam, M.S. Effects of different environmental and operational factors on the PV performance: A comprehensive review. Energy Sci. Eng. 2022, 10, 656–675. [Google Scholar] [CrossRef]
- Santhakumari, M.; Sagar, N. A review of the environmental factors degrading the performance of silicon wafer-based photovoltaic modules: Failure detection methods and essential mitigation techniques. Renew. Sustain. Energy Rev. 2019, 110, 83–100. [Google Scholar] [CrossRef]
- Abdallah, A.A.; Ali, K.; Kivambe, M.M.; Darussalam, B. Common failure modes observed in PV system installed in desert climate. Sol. Energy 2023, 249, 268–277. [Google Scholar] [CrossRef]
- Zaihidee, F.M.; Mekhilef, S.; Seyedmahmoudian, M.; Horan, B. Dust as an unalterable deteriorative factor affecting PV panel’s efficiency: Why and how. Renew. Sustain. Energy Rev. 2016, 65, 1267–1278. [Google Scholar] [CrossRef]
- Saidan, M.; Albaali, A.G.; Alasis, E.; Kaldellis, J.K. Experimental study on the effect of dust deposition on solar photovoltaic panels in desert environment. Renew. Energy 2016, 92, 499–505. [Google Scholar] [CrossRef]
- Mehmood, U.; Al-Sulaiman, F.A.; Yilbas, B. Characterization of dust collected from PV modules in the area of Dhahran, Kingdom of Saudi Arabia, and its impact on protective transparent covers for photovoltaic applications. Sol. Energy 2017, 141, 203–209. [Google Scholar] [CrossRef]
- Fan, S.; Wang, Y.; Cao, S.; Sun, T.; Liu, P. A novel method for analyzing the effect of dust accumulation on energy efficiency loss in photovoltaic (PV) system. Energy 2021, 234, 121112. [Google Scholar] [CrossRef]
- Said, S.A.M.; Walwil, H.M. Fundamental studies on dust fouling effects on PV module performance. Sol. Energy 2014, 107, 328–337. [Google Scholar] [CrossRef]
- Sayigh, A.; Al-Jandal, S.; Ahmed, H. Dust effect on solar flat surfaces devices in Kuwait. In Proceedings of the Workshop on the Physics of Non-Conventional Energy Sources and Materials Science for Energy, Miramare-Trieste, Italy, 2–20 September 1985; pp. 353–367. [Google Scholar]
- Elminir, H.K.; Ghitas, A.E.; Hamid, R.; El-Hussainy, F.; Beheary, M.; Abdel-Moneim, K.M. Effect of dust on the transparent cover of solar collectors. Energy Convers. Manag. 2006, 47, 3192–3203. [Google Scholar] [CrossRef]
- Kazem, H.A.; Chaichan, M.T.; Al-Waeli, A.H.A.; Al-Badi, R.; Fayad, M.A.; Gholami, A. Dust impact on photovoltaic/thermal system in harsh weather conditions. Sol. Energy 2022, 245, 308–321. [Google Scholar] [CrossRef]
- Yazdani, H.; Yaghoubi, M. Dust deposition effect on photovoltaic modules performance and optimization of cleaning period: A combined experimental–numerical study. Sustain. Energy Technol. Assess. 2022, 51, 101946. [Google Scholar] [CrossRef]
- Sharif, M.A.; Rashid, M.; Korkmaz, F. Effects of Weather and Environmental Conditions on the Power Productivity of Photovoltaic Module in Kirkuk City. NTU J. Renew. Energy 2023, 4, 1–6. [Google Scholar]
- Fu, X.; Wang, X.; Gong, Y.; Wang, Y.; Zhang, Y. Impact of Snow Weather on PV Power Generation and Improvement of Power Forecasting. In Proceedings of the 2023 International Conference on Power Energy Systems and Applications (ICoPESA), Chengdu, China, 24–26 February 2023; pp. 448–453. [Google Scholar]
- Bahanni, C.; Adar, M.; Boulmrharj, S.; Khaidar, M.; Mabrouki, M. Performance comparison and impact of weather conditions on different photovoltaic modules in two different cities. Indones. J. Electr. Eng. Comput. Sci. 2022, 25, 1275–1286. [Google Scholar] [CrossRef]
- Mellit, A.; Tina, G.M.; Kalogirou, S.A. Fault detection and diagnosis methods for photovoltaic systems: A review. Renew. Sustain. Energy Rev. 2018, 91, 1–17. [Google Scholar] [CrossRef]
- Standard, I.E.C. 61215 Crystalline Silicon Terrestrial Photovoltaic (PV) Modules Design Qualification and Type Approval. Int. Electrotech. Comm. 1995. Available online: https://webstore.iec.ch/publication/68594&preview (accessed on 9 February 2022).
- Kumar, N.M.; Sudhakar, K.; Samykano, M.; Jayaseelan, V. On the technologies empowering drones for intelligent monitoring of solar photovoltaic power plants. Procedia Comput. Sci. 2018, 133, 585–593. [Google Scholar] [CrossRef]
- Buerhop, C.; Bommes, L.; Schlipf, J.; Pickel, T.; Fladung, A.; Peters, M. Infrared imaging of photovoltaic modules A review of the state of the art and future challenges facing gigawatt photovoltaic power stations. Prog. Energy 2022, 4, 042010. [Google Scholar] [CrossRef]
- Goodarzi, D.M.; Lauri, J.; Putaala, J.; Nousiainen, O.; Fabritius, T. Eddy current soldering of solar cell ribbons under a layer of glass. Sol. Energy Mater. Sol. Cells 2023, 259, 112427. [Google Scholar] [CrossRef]
- Drabczyk, K.; Kulesza-Matlak, G.; Drygała, A.; Szindler, M.; Lipiński, M. Electroluminescence imaging for determining the influence of metallization parameters for solar cell metal contacts. Sol. Energy 2016, 126, 14–21. [Google Scholar] [CrossRef]
- Hobbs, W.; Lavrova, O.; Lockridge, B. Comparison of Electroluminescence Image Capture Methods; Sandia National Lab. (SNL-NM): Albuquerque, NM, USA, 2016. [Google Scholar]
- Høiaas, I.; Grujic, K.; Imenes, A.G.; Burud, I.; Olsen, E.; Belbachir, N. Inspection and condition monitoring of large-scale photovoltaic power plants: A review of imaging technologies. Renew. Sustain. Energy Rev. 2022, 161, 112353. [Google Scholar] [CrossRef]
- Kajari-Schröder, S.; Kunze, I.; Eitner, U.; Köntges, M. Spatial and orientational distribution of cracks in crystalline photovoltaic modules generated by mechanical load tests. Sol. Energy Mater. Sol. Cells 2011, 95, 3054–3059. [Google Scholar] [CrossRef]
- Dallas, W.; Polupan, O.; Ostapenko, S. Resonance ultrasonic vibrations for crack detection in photovoltaic silicon wafers. Meas. Sci. Technol. 2007, 18, 852. [Google Scholar] [CrossRef]
- Belyaev, A.; Polupan, O.; Dallas, W.; Ostapenko, S.; Hess, D.; Wohlgemuth, J. Crack detection and analyses using resonance ultrasonic vibrations in full-size crystalline silicon wafers. Appl. Phys. Lett. 2006, 88, 111907. [Google Scholar] [CrossRef]
- Hamid, S.A.; Zulkifli, M.N. Microstructure Evaluation of Photovoltaic Solar Panel’s Interconnection: A Review. Mater. Sci. Forum 2022, 1055, 27–35. [Google Scholar] [CrossRef]
- Rifat, A.; Pandao, P.P.; Babu, B.S. Solar Powered Fault Detection System for Railway Tracks. Eur. J. Electr. Eng. Comput. Sci. 2022, 6, 39–43. [Google Scholar] [CrossRef]
- Pillai, D.S.; Rajasekar, N. Metaheuristic algorithms for PV parameter identification: A comprehensive review with an application to threshold setting for fault detection in PV systems. Renew. Sustain. Energy Rev. 2018, 82, 3503–3525. [Google Scholar] [CrossRef]
- Chockalingam, A.; Naveen, S.; Sanjay, S.; Nanthakumar, J.; Praveenkumar, V. Sensor Based Hotspot Detection and Isolation in Solar Array System Using IOT; Renewable Energy Lab, Prince Sultan University: Riyadh, Saudi Arabia, 2023; pp. 371–376. [Google Scholar]
- Lee, H.-M.; Chae, W.-K.; Kim, W.-H.; Kim, J.-E. Cooperative Use of IMD and GPT in a 3-Phase Ungrounded Distribution System Linked to a Transformerless Photovoltaic Power Generation Facility. Appl. Sci. 2023, 13, 1558. [Google Scholar] [CrossRef]
- Meribout, M.; Tiwari, V.K.; Herrera, J.P.P.; Baobaid, A.N.M.A. Solar panel inspection techniques and prospects. Measurement 2023, 209, 112466. [Google Scholar] [CrossRef]
- Garoudja, E.; Harrou, F.; Sun, Y.; Kara, K.; Chouder, A.; Silvestre, S. Statistical fault detection in photovoltaic systems. Sol. Energy 2017, 150, 485–499. [Google Scholar] [CrossRef]
- Harrou, F.; Sun, Y.; Taghezouit, B.; Saidi, A.; Hamlati, M.-E. Reliable fault detection and diagnosis of photovoltaic systems based on statistical monitoring approaches. Renew. Energy 2018, 116, 22–37. [Google Scholar] [CrossRef]
- Ali, M.H.; Rabhi, A.; El Hajjaji, A.; Tina, G.M. Real time fault detection in photovoltaic systems. Energy Procedia 2017, 111, 914–923. [Google Scholar] [CrossRef]
- Mustafa, Z.; Awad, A.S.A.; Azzouz, M.; Azab, A. Fault identification for photovoltaic systems using a multi-output deep learning approach. Expert Syst. Appl. 2023, 211, 118551. [Google Scholar] [CrossRef]
- Lodhi, E.; Wang, F.-Y.; Xiong, G.; Zhu, L.; Tamir, T.S.; Rehman, W.U.; Khan, M.A. A Novel Deep Stack-Based Ensemble Learning Approach for Fault Detection and Classification in Photovoltaic Arrays. Remote Sens. 2023, 15, 1277. [Google Scholar] [CrossRef]
- Garoudja, E.; Chouder, A.; Kara, K.; Silvestre, S. An enhanced machine learning based approach for failures detection and diagnosis of PV systems. Energy Convers. Manag. 2017, 151, 496–513. [Google Scholar] [CrossRef]
- Chen, L.; Li, S.; Wang, X. Quickest fault detection in photovoltaic systems. IEEE Trans. Smart Grid 2016, 9, 1835–1847. [Google Scholar] [CrossRef]
- Chine, W.; Mellit, A.; Lughi, V.; Malek, A.; Sulligoi, G.; Pavan, A.M. A novel fault diagnosis technique for photovoltaic systems based on artificial neural networks. Renew. Energy 2016, 90, 501–512. [Google Scholar] [CrossRef]
- Et-taleby, A.; Chaibi, Y.; Benslimane, M.; Boussetta, M. Applications of Machine Learning Algorithms for Photovoltaic Fault Detection: A Review. Stat. Optim. Inf. Comput. 2023, 11, 168–177. [Google Scholar] [CrossRef]
- Li, B.; Delpha, C.; Diallo, D.; Migan-Dubois, A. Application of Artificial Neural Networks to photovoltaic fault detection and diagnosis: A review. Renew. Sustain. Energy Rev. 2021, 138, 110512. [Google Scholar] [CrossRef]
- Abubakar, A.; Almeida, C.F.M.; Gemignani, M. Review of artificial intelligence-based failure detection and diagnosis methods for solar photovoltaic systems. Machines 2021, 9, 328. [Google Scholar] [CrossRef]
- Kurukuru, V.S.B.; Haque, A.; Khan, M.A.; Sahoo, S.; Malik, A.; Blaabjerg, F. A review on artificial intelligence applications for grid-connected solar photovoltaic systems. Energies 2021, 14, 4690. [Google Scholar] [CrossRef]
- Tina, G.M.; Ventura, C.; Ferlito, S.; De Vito, S. A state-of-art-review on machine-learning based methods for PV. Appl. Sci. 2021, 11, 7550. [Google Scholar] [CrossRef]
- Cotfas, D.T.; Cotfas, P.A.; Kaplanis, S. Methods to determine the dc parameters of solar cells: A critical review. Renew. Sustain. Energy Rev. 2013, 28, 588–596. [Google Scholar] [CrossRef]
- Pan, J.-S.; Tian, A.-Q.; Pan, T.-S.; Chu, S.-C. Parameters Extraction of Solar Cell Using an Improved QUasi-Affine TRansformation Evolution (QUATRE) Algorithm. In Advances in Intelligent Systems and Computing; Springer: Berlin/Heidelberg, Germany, 2022; pp. 253–263. [Google Scholar]
- Qin, J.; Wang, L.; Yang, S.; Huang, R. The effect of solar cell shunt resistance change on the bus voltage ripple in spacecraft power system. Microelectron. Reliab. 2018, 88, 1047–1050. [Google Scholar] [CrossRef]
- d’Alessandro, V.; Guerriero, P.; Daliento, S.; Gargiulo, M. A straightforward method to extract the shunt resistance of photovoltaic cells from current–voltage characteristics of mounted arrays. Solid-State Electron. 2011, 63, 130–136. [Google Scholar] [CrossRef]
- Kim, Y.S.; Kang, S.-M.; Johnston, B.; Winston, R. A novel method to extract the series resistances of individual cells in a photovoltaic module. Sol. Energy Mater. Sol. Cells 2013, 115, 21–28. [Google Scholar] [CrossRef]
- Lucheng, Z.; Hui, S. Novel approach for characterizing the specific shunt resistance caused by the penetration of the front contact through the p–n junction in solar cell. J. Semicond. 2009, 30, 074007. [Google Scholar] [CrossRef]
- Mohapatra, A.; Nayak, B.; Mohanty, K. Parameter Extraction of PV Module using NLS Algorithm with Experimental Validation. Int. J. Electr. Comput. Eng. 2017, 7, 2392. [Google Scholar] [CrossRef]
- Elyaqouti, M.; Saadaoui, D.; Lidaighbi, S.; Chaoufi, J.; Ibrahim, A.; Aqel, R.; Obukhov, S. A novel hybrid numerical with analytical approach for parameter extraction of photovoltaic modules. Energy Convers. Manag. X 2022, 14, 100219. [Google Scholar]
- Meena, R.; Niyaz, H.M.; Gupta, R. Investigation and Differentiation of Degradation Modes Affecting Series Resistance in Photovoltaic Cells and Modules. IEEE J. Photovolt. 2023, 13, 283–290. [Google Scholar] [CrossRef]
- Ramalingam, K.; Indulkar, C.; Gharehpetian, G.B.; Mousavi Agah, S.M. Chapter 3—Solar Energy and Photovoltaic Technology. In Distributed Generation Systems; Butterworth-Heinemann: Oxford, UK, 2017; pp. 69–147. [Google Scholar]
- Roy, S.; Gupta, R. Quantitative Estimation of Shunt Resistance in Crystalline Silicon Photovoltaic Modules by Electroluminescence Imaging. IEEE J. Photovolt. 2019, 9, 1741–1747. [Google Scholar] [CrossRef]
- Kaplanis, S.; Kaplani, E. Energy performance and degradation over 20 years performance of BP c-Si PV modules. Simul. Model. Pract. Theory 2011, 19, 1201–1211. [Google Scholar] [CrossRef]
- Dhass, A.D.; Beemkumar, N.; Harikrishnan, S.; Ali, H.M. A Review on Factors Influencing the Mismatch Losses in Solar Photovoltaic System. Int. J. Photoenergy 2022, 2022, 2986004. [Google Scholar] [CrossRef]
- Sinha, A.; Sastry, O.; Gupta, R. Nondestructive characterization of encapsulant discoloration effects in crystalline-silicon PV modules. Sol. Energy Mater. Sol. Cells 2016, 155, 234–242. [Google Scholar] [CrossRef]
- Lin, L.; Bora, B.; Prasad, B. Influence of outdoor conditions on PV module performance—An overview. Mater. Sci. Eng. 2023, 7, 88–101. [Google Scholar]
- Pavlík, M.; Beňa, L.U.; Medved’, D.; Čonka, Z.; Kolcun, M. Analysis and evaluation of photovoltaic cell defects and their impact on electricity generation. Energies 2023, 16, 2576. [Google Scholar] [CrossRef]
- Gxasheka, A.R.; Van Dyk, E.E.; Meyer, E.L. Evaluation of performance parameters of PV modules deployed outdoors. Renew. Energy 2005, 30, 611–620. [Google Scholar] [CrossRef]
- Rajput, P.; Malvoni, M.; Kumar, N.M.; Sastry, O.S.; Tiwari, G.N. Risk priority number for understanding the severity of photovoltaic failure modes and their impacts on performance degradation. Case Stud. Therm. Eng. 2019, 16, 100563. [Google Scholar] [CrossRef]
- Ruschel, C.S.; Gasparin, F.P.; Costa, E.R.; Krenzinger, A. Assessment of PV modules shunt resistance dependence on solar irradiance. Sol. Energy 2016, 133, 35–43. [Google Scholar] [CrossRef]
- Zhang, J.; Liu, Y.; Ding, K.; Feng, L.; Hamelmann, F.U.; Chen, X. Model Parameter Analysis of Cracked Photovoltaic Module under Outdoor Conditions. In Proceedings of the 2020 47th IEEE Photovoltaic Specialists Conference (PVSC), Calgary, ON, Canada, 15 June 2020; pp. 2509–2512. [Google Scholar]
- Oh, J.; Bowden, S.; TamizhMani, G. Potential-induced degradation (PID): Incomplete recovery of shunt resistance and quantum efficiency losses. IEEE J. Photovolt. 2015, 5, 1540–1548. [Google Scholar] [CrossRef]
- Luo, W.; Khoo, Y.S.; Hacke, P.; Naumann, V.; Lausch, D.; Harvey, S.P.; Singh, J.P.; Chai, J.; Wang, Y.; Aberle, A.G. Potential-induced degradation in photovoltaic modules: A critical review. Energy Environ. Sci. 2017, 10, 43–68. [Google Scholar] [CrossRef]
- Hacke, P.; Spataru, S.; Johnston, S.; Terwilliger, K.; VanSant, K.; Kempe, M.; Wohlgemuth, J.; Kurtz, S.; Olsson, A.; Propst, M. Elucidating PID Degradation Mechanisms and In Situ Dark I–V Monitoring for Modeling Degradation Rate in CdTe Thin-Film Modules. IEEE J. Photovolt. 2016, 6, 1635–1640. [Google Scholar] [CrossRef]
- Dhass, A.D.; Natarajan, E.; Ponnusamy, L. Influence of shunt resistance on the performance of solar photovoltaic cell. In Proceedings of the 2012 International Conference on Emerging Trends in Electrical Engineering and Energy Management (ICETEEEM), Tiruchirapalli, India, 13–15 December 2012; pp. 382–386. [Google Scholar]
- van Dyk, E.E.; Meyer, E.L. Analysis of the effect of parasitic resistances on the performance of photovoltaic modules. Renew. Energy 2004, 29, 333–344. [Google Scholar] [CrossRef]
- Sarkar, M.N.I. Effect of various model parameters on solar photovoltaic cell simulation: A SPICE analysis. Renew. Wind Water Sol. 2016, 3, 1–9. [Google Scholar] [CrossRef]
- Kennerud, K.L. Analysis of performance degradation in CdS solar cells. IEEE Trans. Aerosp. Electron. Syst. 1969, 912–917. [Google Scholar] [CrossRef]
- Rummel, S.R.; McMahon, T.J. Effect of cell shunt resistance on PV module performance at reduced light levels. AIP Conf. Proc. 1996, 353, 581–586. [Google Scholar]
- Al Mahdi, H. Predicting Photovoltaic Module Degradation Using Current-Voltage. Ph.D. Dissertation, University College Cork, Cork, Ireland, 2022. Available online: https://hdl.handle.net/10468/13282 (accessed on 10 September 2023).
- Al Mahdi, H.; Leahy, P.G.; Morrison, A.P. Experimentally derived models to detect onset of shunt resistance degradation in photovoltaic modules. Energy Rep. 2023, 10, 604–612. [Google Scholar] [CrossRef]
- Hussain, T.; Hussain, M.; Al-Aqrabi, H.; Alsboui, T.; Hill, R. A Review on Defect Detection of Electroluminescence-Based Photovoltaic Cell Surface Images Using Computer Vision. Energies 2023, 16, 4012. [Google Scholar] [CrossRef]
- Zamzeer, A.S.; Farhan, M.S.; Rikabi, H.T.S.A. An Investigation into Faults of PV system using Machine Learning: A Systematic Review. In Proceedings of the 2023 Third International Conference on Advances in Electrical, Computing, Communication and Sustainable Technologies (ICAECT), Bhilai, Chhattisgarh, India, 5–6 January 2023; pp. 1–6. [Google Scholar]
- Mansouri, M.; Trabelsi, M.; Nounou, H.; Nsounou, M. Deep Learning-Based Fault Diagnosis of Photovoltaic Systems: A Comprehensive Review and Enhancement Prospects. IEEE Access 2021, 9, 126286–126306. [Google Scholar] [CrossRef]
- Zeb, K.; Islam, S.U.; Khan, I.; Uddin, W.; Ishfaq, M.; Curi Busarello, T.D.; Muyeen, S.M.; Ahmad, I.; Kim, H.J. Faults and Fault Ride through strategies for grid-connected photovoltaic system: A comprehensive review. Renew. Sustain. Energy Rev. 2022, 158, 112125. [Google Scholar] [CrossRef]


| Degradation Rate | Type of PV (Poly-Si, Mono-Si) | Connection (Grid or Standalone) | Lifetime (Years) | Weather Condition | Country | Ref. |
|---|---|---|---|---|---|---|
| Between 0.9% and 1.1%. The rate increased to up to 5.9% with visible failure modes. | Poly-Si | Grid | 6 | Subtropical climate with moderate humidity level and high temperature. | India | [29] |
| Modules with no visual defect have around 1% whereas modules with defects may reach 4.2%. | Poly-Si | Grid | 10 | Semi-desert climate, considerably hot and dry weather. | India | [30] |
| 0.6% to 1.2% for modules with no visual defect and 1.4% to 1.9% for modules with defects. | Mono-Si | Standalone | Between 0 and 5 | Dry equatorial climate. The average temperature is 28 °C and 30 °C and the average humidity is between 60% and 75%. | Ghana | [31] |
| 0.75% to 1.65% for modules with no visual defect and 1% to 2% for modules with defects. | Poly-Si | Standalone | Between 6 and 10. | Wet semi-equatorial climate. The average temperature ranges between 26 °C and 30 °C and the average humidity is between 70% and 80%. | ||
| The average fluctuates from 0.92% to 1.05%. Modules with defects can reach 3.22%. | Mono-Si | Standalone | 10 | Hot accompanied by high relative humidity; up to 85.6%. | U.S. | [32] |
| 1.54% in mono-si and 2.72% in poly-si. | Both Types | Standalone | 11 | Dry and hot climate, with frequent sandstorms located in the desert. | Algeria | [33] |
| The average rate of 20 deployed modules is 1.04%. | Mono-Si | Standalone | 11 | Warm with a high relative humidity range; the average is 67%. | Algeria | [34] |
| The average rate of 10 deployed modules is 2.04%. | Poly-Si | Standalone | 14 | Moderate climate with considerably high relative humidity, which can reach 83% in the winter months. | Germany | [35] |
| Between 0.57 and 1.33% based on extracted data and statistical analysis. | Poly-Si | Grid | 5 | Desert climate, considerably hot and dry. Frequent sandstorms result in dust accumulation on the PV system. | Djibouti | [11] |
| 0.98% | Poly-Si | Not stated | 10 | Cold and humid, average temperature range between −6.7 °C and 21 °C, average humidity range between 30% and 99%. | Norway | [36,37] |
| 1.33% | Poly-Si | Not stated | 20 | PV modules were operated for 10 years in humid and cold weather and then kept inside a research centre for 10 years for examination purposes. |
| Component Impacted | Defect (Failure) | Type of PV (Poly-Si, Mono-Si) | Operational Time (Year) | Failure Detail | Country | Ref. |
|---|---|---|---|---|---|---|
| Protective glass | Breakage | Mono-Si | 16 and 13 | Two occurrences owing to poor transportation and vandalism. | Indonesia | [126] |
| Poly-Si | 20 | None of the 43 PV modules affected by breakage of glass. | Norway | [36,37] | ||
| Not Stated | Not Stated | 52 modules affected in three PV plants ranging from 2 to 3 MW. | Turkey | [166] | ||
| Poly-Si | 6 | Rare occurrences of glass breakage accompanied by cracked cells and dark EVA discolouration. Potential causes: hotspot, harsh weather (high wind speed and dust), and incorrect installation. | India | [29] | ||
| Poly-Si | 10 | Less than 1% out of 2078 investigated modules. Possible causes: wind, hotspots, and handling. | India | [30] | ||
| EVA | Discolouration | Poly-Si | 5 (a), 9 (b), 5 (c), and 10 (d) | Dark (a), light yellow (b), dark (c), and brown (d). | Ghana | [31] |
| Mono-Si | 15 (a) and 5 (b) | Light yellow (a) and light brown (b). | ||||
| Both types | 16 and 13 | Not specified. | Indonesia | [126] | ||
| Poly-Si | 20 | Nearly all investigated (43 PV modules) affected. | Norway | [36,37] | ||
| Mono-Si | 10 | 2 out of 156 PV modules displayed brown discolouration. | U.S. | [32] | ||
| Both types | 11 | Prevalent among all PV modules, resulting in up to 18% reduction in short-circuit current and potentially brown discolouration [168]. | Algeria | [33] | ||
| Poly-Si | 6 | Rare occurrences of light discolouration in 10 MW PV plant. | India | [29] | ||
| Mono-Si | 11 | Brown discolouration was detected in 10% of the PV modules. | Algeria | [34] | ||
| Poly-Si | 10 | Roughly 14% of the 2078 investigated modules were affected by yellow and brown discolouration. | India | [30] | ||
| Delamination | Both types | 8y-poly and 15y-mono | Rare occurrence with fewer than 4 modules impacted out of 104 of all types. | Ghana | [31] | |
| 16 and 13 | Several occurrences, especially in the 12-year PV system. | Indonesia | [126] | |||
| Poly-Si | 10 | Dominant among the 43 PV modules, mainly at the cell edge. | Norway | [36,37] | ||
| Both types | 10 | Rare occurrences, only 11 out of 2078 investigated modules; potential cause was weather condition. | India | [30] | ||
| Mono-Si | 10 | All investigated (156) PV modules were influenced near the busbar; root cause expected to be heat resulting from busbar resistance. | U.S. | [32] | ||
| Both types | 11 | Potential cause: desert weather. | Algeria | [33] | ||
| Mono-Si | 11 | 25% of modules experienced delamination, some at the centres and others at the edges. | Algeria | [34] | ||
| Solar cells | Cracks | Mono-Si | 5 and 15 years | Extremely rare: only two of 104 modules were affected. Possible cause was unknown. | Ghana | [31] |
| Poly-Si | 20 | Prevalent among the 43 PV modules, predominantly at the cell edge. | Norway | [36,37] | ||
| Mono-Si | 10 | Few cracks were detected in PV modules inspected by EL imaging. | U.S. | [32] | ||
| Poly-Si | 14 | Results from EL imaging showed that 9 out of 10 modules have crack cells. | Germany | [35] | ||
| Corrosion | Both types | 20 | 12 out of 104 modules were affected. | Ghana | [31] | |
| Snail Track | Both types | 5 | Rare occurrence, with fewer than 4 modules impacted out of 104 of both types. Claimed to be caused by manufacturing process. | Ghana | [31] | |
| 16 and 13 | Several occurrences, especially in the 12-year PV system. | Indonesia | [126] | |||
| Mono-Si | 11 | 2 out of 20 modules suffered from snail tracks, one of which was inked with cracked cells. | Algeria | [34] | ||
| Mono-Si | 10 | 30 out of 156 PV modules displayed snail track. | U.S. | [32] | ||
| Poly-Si | 10 | Roughly 1.5% of 2078 investigated modules were affected, with snail track often linked with cracked cells. | India | [30] | ||
| PID | Poly-Si | 20 | One investigated by EL imaging; cell crack seems to be the cause of PID. | Norway | [36,37] | |
| Hotspot | Poly-Si | 20 | One investigated by IR imaging; suspected to derive from cracks. | |||
| Mono-Si | 10 | 10 modules suffered from hotspots and displayed burn marks on the backsheet. | U.S. | [32] | ||
| Not stated | Not stated | One module was detected in a 2.7 MW PV plant. | Turkey | [166] | ||
| Poly-Si | 6 | Suspicion in one module of one module. Potential cause: mismatch. | India | [29] | ||
| Poly-Si | 14 | 3 out of 10 modules showed hotspotting, detected by IR. | Germany | [35] | ||
| Poly-Si | 10 | Detected in 10 out of 2078 investigated modules. | India | [30] | ||
| Backsheet | Chalking | Mono-Si | 11 | 1 out of 20 modules. | Algeria | [34] |
| Discolouration | Both types | 8 | Nearly 14 modules were affected out of 104 of both types, specifically those lacking mounting support. | Ghana | [31,37] | |
| Poly-Si | 10 | 11 out of 2078 investigated modules failed with burning and cracks. Possible causes are hotspots and failed J-boxes. | India | [30] | ||
| Delamination | Mono-Si | 10 | 29 out of 156 PV modules suffered from backsheet delamination failures like bubbles. | U.S. | [32] | |
| J-Box | Corrosion | Mono-Si | 16 | Several occurrences. | Indonesia | [126] |
| Delamination | Both types | 13 | Poor installation was potentially the cause. | Indonesia | [126] | |
| Mono-Si | 11 | 1 module had a detached J-box. | Algeria | [34] | ||
| Burning | Poly-Si | 10 | Only detected in 2 out of the 2078 investigated modules. | India | [30] | |
| Bypass diodes | Not stated | Not stated | Detected in 8 modules in a 2.7 MW PV plant. | Turkey | [166] |
| Photovoltaic Failure | Classified by Jordan et al. [16]. Classification Categories: Severity 1 to 10 | Classified by Tsanakas et al. [56]. Classification Categories: (a) Optical; (b) Electrical; (c) Not Classified. | Classified by Köntges et al. [15]. Classification Categories: (a) Infant-Life; (b) Mid-Life; (c) Wear-Out. | Classified by Hong and Pula [170]. Classification Categories: (a) Mismatch; (b) Ground; (c) Line; (d) Arc; (e) Other. |
|---|---|---|---|---|
| Hotspot | 10 | Electrical | Not Classified | Other |
| Encapsulant Delamination | Minor Delamination: 1 Major Delamination: 5 | Optical | Mid-Life | Mismatch |
| Encapsulant Discolouration | 3 | Optical | Mid-Life | Mismatch |
| Solder Bonding | 8 | Electrical | Wear-Out | Ground and Arc |
| Glass Breakage | 5 | Optical | Infant-Life | Other |
| Cracked Cell | 5 | Electrical | Mid-Life | Other |
| Bypass-Diode | 5 | Not Classified | Mid-Life | Other |
| Junction Box | 5 | Electrical | Infant-Life | Arc |
| Weather Condition | Weather Highlight | Failure Modes Detected or Explored and Component Affected | Type of PV (Poly-Si, Mono-Si) | Lifetime (Years) | Country | Ref. |
|---|---|---|---|---|---|---|
| Subtropical climate with moderate humidity level and high temperature. | Hot | Glass breakage, EVA discolouration, soiling, cracked cell, hotspot. | Poly-Si | 6 | India | [29] |
| Semi-desert climate, considerably hot and dry weather. | Hot | Glass breakage, EVA discolouration, soiling, EVA delamination, cracked cell, snail track, metal corrosion, backsheet cracks and burns. | Poly-Si | 10 | India | [30] |
| Dry equatorial climate. The average temperature is between 28 °C and 30 °C and the average humidity is between 60% and 75%. | Dry and hot | EVA discolouration, metal corrosion, backsheet defects. | Mono-Si | Between 0 to 5 | Ghana | [31] |
| Wet semi-equatorial climate. The average temperature ranges between 26 °C and 30 °C and the average humidity is between 70% and 80%. | Hot and humid | EVA discolouration, EVA delamination, metal corrosion, backsheet defects. | Poly-Si | Between 6 and 10. | ||
| Desert climate hot and dry with moderate to high relative humidity throughout the year. | Dust | Experimental study to address dust effect. Soiling reduced power production by 9% within 30 days. | Mono-Si | Not stated | Oman | [183] |
| Dry, hot in the summer and moderate temperature with frequent rainfall in the winter. | Dust | PV modules were kept for 6 months for soiling evaluation, result showed 20% power loss despite rainy days in 2 months. | Mono-Si | Not stated | Iran | [184] |
| Dry, hot in the summer and moderate temperature in the winter. | Dust | PV modules were kept for 6 months for soiling evaluation, an average of 18% of power loss was recorded. | Mono-Si | Not stated | Iraq | [185] |
| Cold, frequently accompanied by snowstorms. | Cold and snowing | Analysis model to forecast PV production expected 80% power loss if the snow thickness is 60 mm. | Not stated | Not stated | China | [186] |
| One city has dry and hot weather, whereas the other has lower temperatures. | Hot | Comparison between two PV systems installed in two cities. The one installed in the Mediterranean climate is superior, despite the high humidity level. | Both | Not stated | Morocco | [187] |
| Hot accompanied by high relative humidity up to 85%. | Hot and humid | EVA discolouration and delamination, snail track, metal corrosion, backsheet cracks and burns, hotspot. | Mono-Si | 10 | U.S. | [32] |
| Dry and hot climate, with frequent sandstorms, located in the desert. | Dry and hot | EVA discolouration and delamination, metal corrosion. | Both | 11 | Algeria | [33] |
| Hot with a high relative humidity range; average is 67%. | Hot and humid | EVA discolouration and delamination, snail track, metal corrosion, soiling, backsheet chalking, J-box delamination. | Mono-Si | 11 | Algeria | [34] |
| Moderate climate with considerably high relative humidity which can reach 83% in the winter months. | Humid | EVA discolouration and delamination, cracked cell, metal and bypass corrosion, hotspot, PID. | Poly-Si | 14 | Germany | [35] |
| Cold and humid; average temperature range between −6.7 °C and 21 °C; average humidity range between 30% and 99%. | Cold | Glass breakage, EVA discolouration and delamination, cracked cell, metal corrosion, hotspot. | Poly-Si | 10 | Norway | [36,37] |
| Detection Technique | Highlight | Ref. |
|---|---|---|
| Infrared Imaging (IR) | How PV benefits from IR and what can be done to expand IR application in PV with the assistance of machine learning models. | [191] |
| Electroluminescence (EL) and Deep Learning | A brief review of EL imaging in detecting microcrack failure modes with useful comparison to IR technique and the feasibility of using them in artificial intelligence models. | [248] |
| Machine Learning | Review of ML studies underlining their accuracy in detecting PV failure modes and highlighting common models, namely super vector (SVM) and neural network (ANN). | [249] |
| Deep Learning | Comparing deep learning models, their pros and cons, as well as proposing a future path for enhancement. | [250] |
| Electrical Characterisation | Reviewing and comparing detection techniques in grid-connected PV plants. | [251] |
Disclaimer/Publisher’s Note: The statements, opinions and data contained in all publications are solely those of the individual author(s) and contributor(s) and not of MDPI and/or the editor(s). MDPI and/or the editor(s) disclaim responsibility for any injury to people or property resulting from any ideas, methods, instructions or products referred to in the content. |
© 2024 by the authors. Licensee MDPI, Basel, Switzerland. This article is an open access article distributed under the terms and conditions of the Creative Commons Attribution (CC BY) license (https://creativecommons.org/licenses/by/4.0/).
Share and Cite
Al Mahdi, H.; Leahy, P.G.; Alghoul, M.; Morrison, A.P. A Review of Photovoltaic Module Failure and Degradation Mechanisms: Causes and Detection Techniques. Solar 2024, 4, 43-82. https://doi.org/10.3390/solar4010003
Al Mahdi H, Leahy PG, Alghoul M, Morrison AP. A Review of Photovoltaic Module Failure and Degradation Mechanisms: Causes and Detection Techniques. Solar. 2024; 4(1):43-82. https://doi.org/10.3390/solar4010003
Chicago/Turabian StyleAl Mahdi, Hussain, Paul G. Leahy, Mohammad Alghoul, and Alan P. Morrison. 2024. "A Review of Photovoltaic Module Failure and Degradation Mechanisms: Causes and Detection Techniques" Solar 4, no. 1: 43-82. https://doi.org/10.3390/solar4010003