

Effectiveness of Protein and Polysaccharide Biopolymers as Dust Suppressants on Mine Soils: Large-Scale Field Trials


Abstract
:1. Introduction
2. Materials and Methods
2.1. Biopolymers
2.2. Field Trial Location and Mine Soil

2.3. Biopolymer Preparation and Application
2.4. Test Methodology
- measurements of dust emissions generated by exposing trial plots to a fan-generated airflow (Section 2.5);
- visual inspection of the trial plots tested in (1.); and
- penetrometer tests (Section 2.6).
2.5. Dust Emission Measurements
2.6. Penetrometer Tests
3. Results
3.1. Meteorological Data
3.2. Dust Emission Measurements
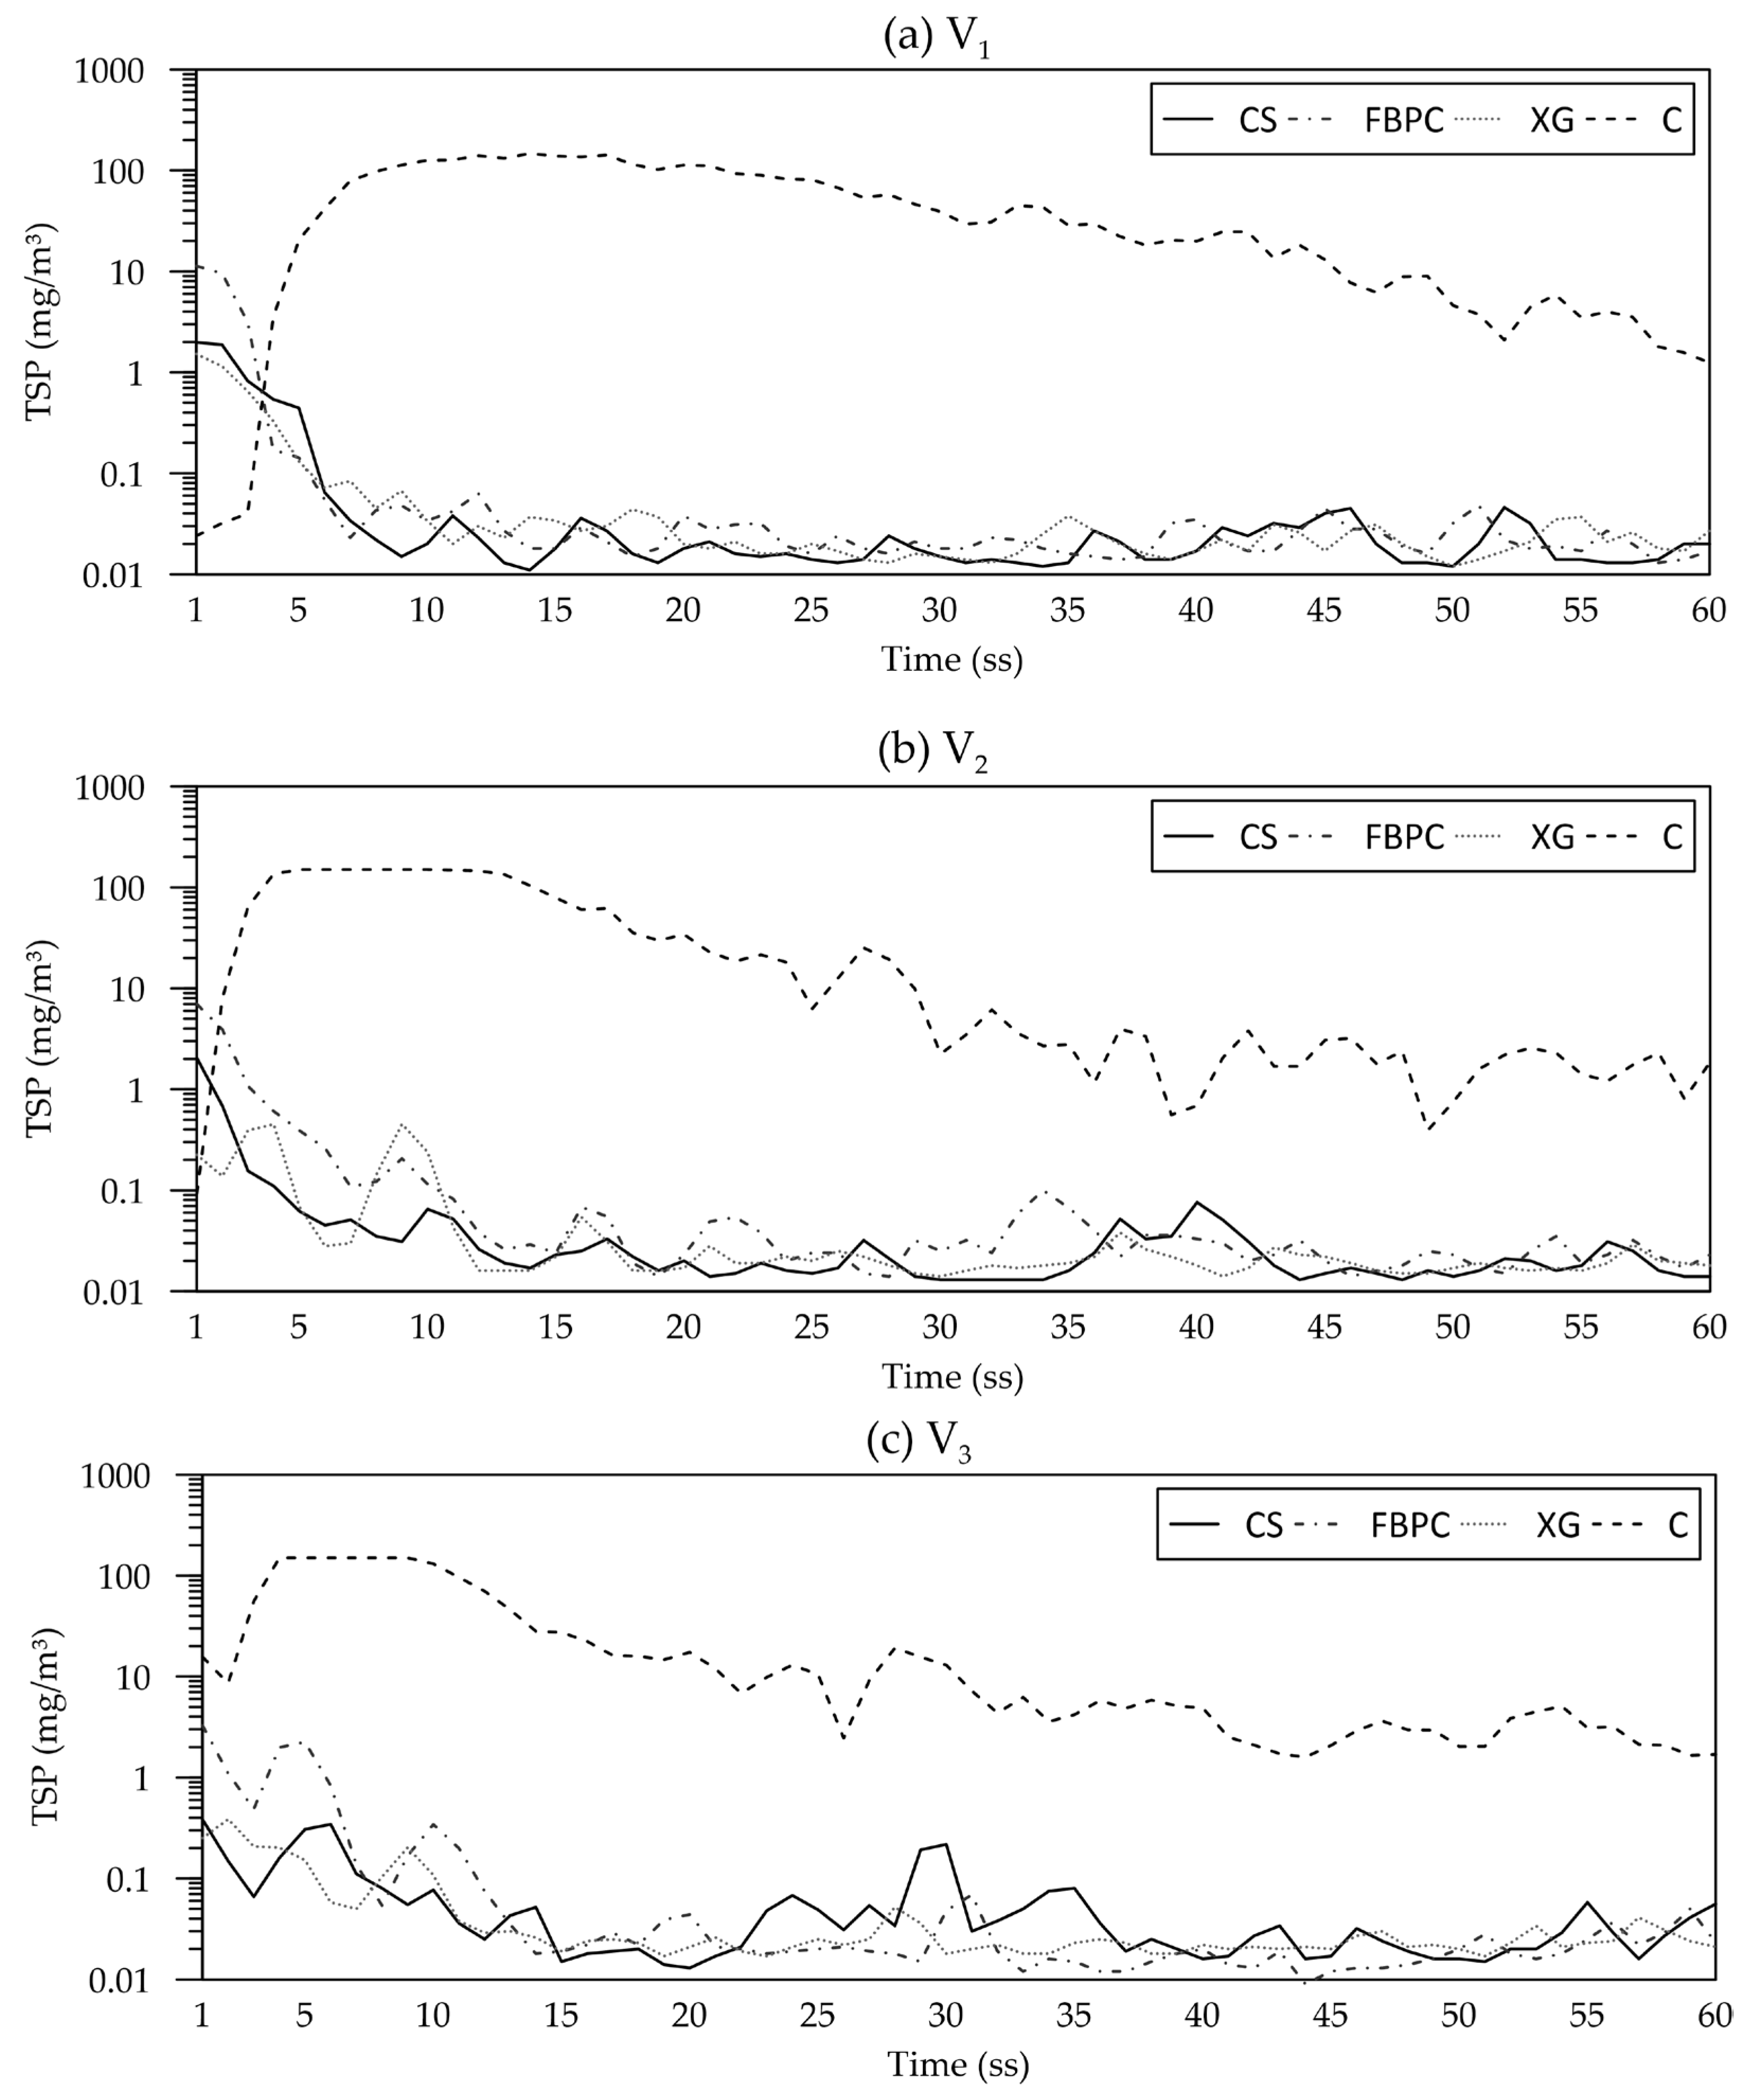
3.2.1. Time Series of Individual Measurements
3.2.2. Temporal Development throughout the Field Trials
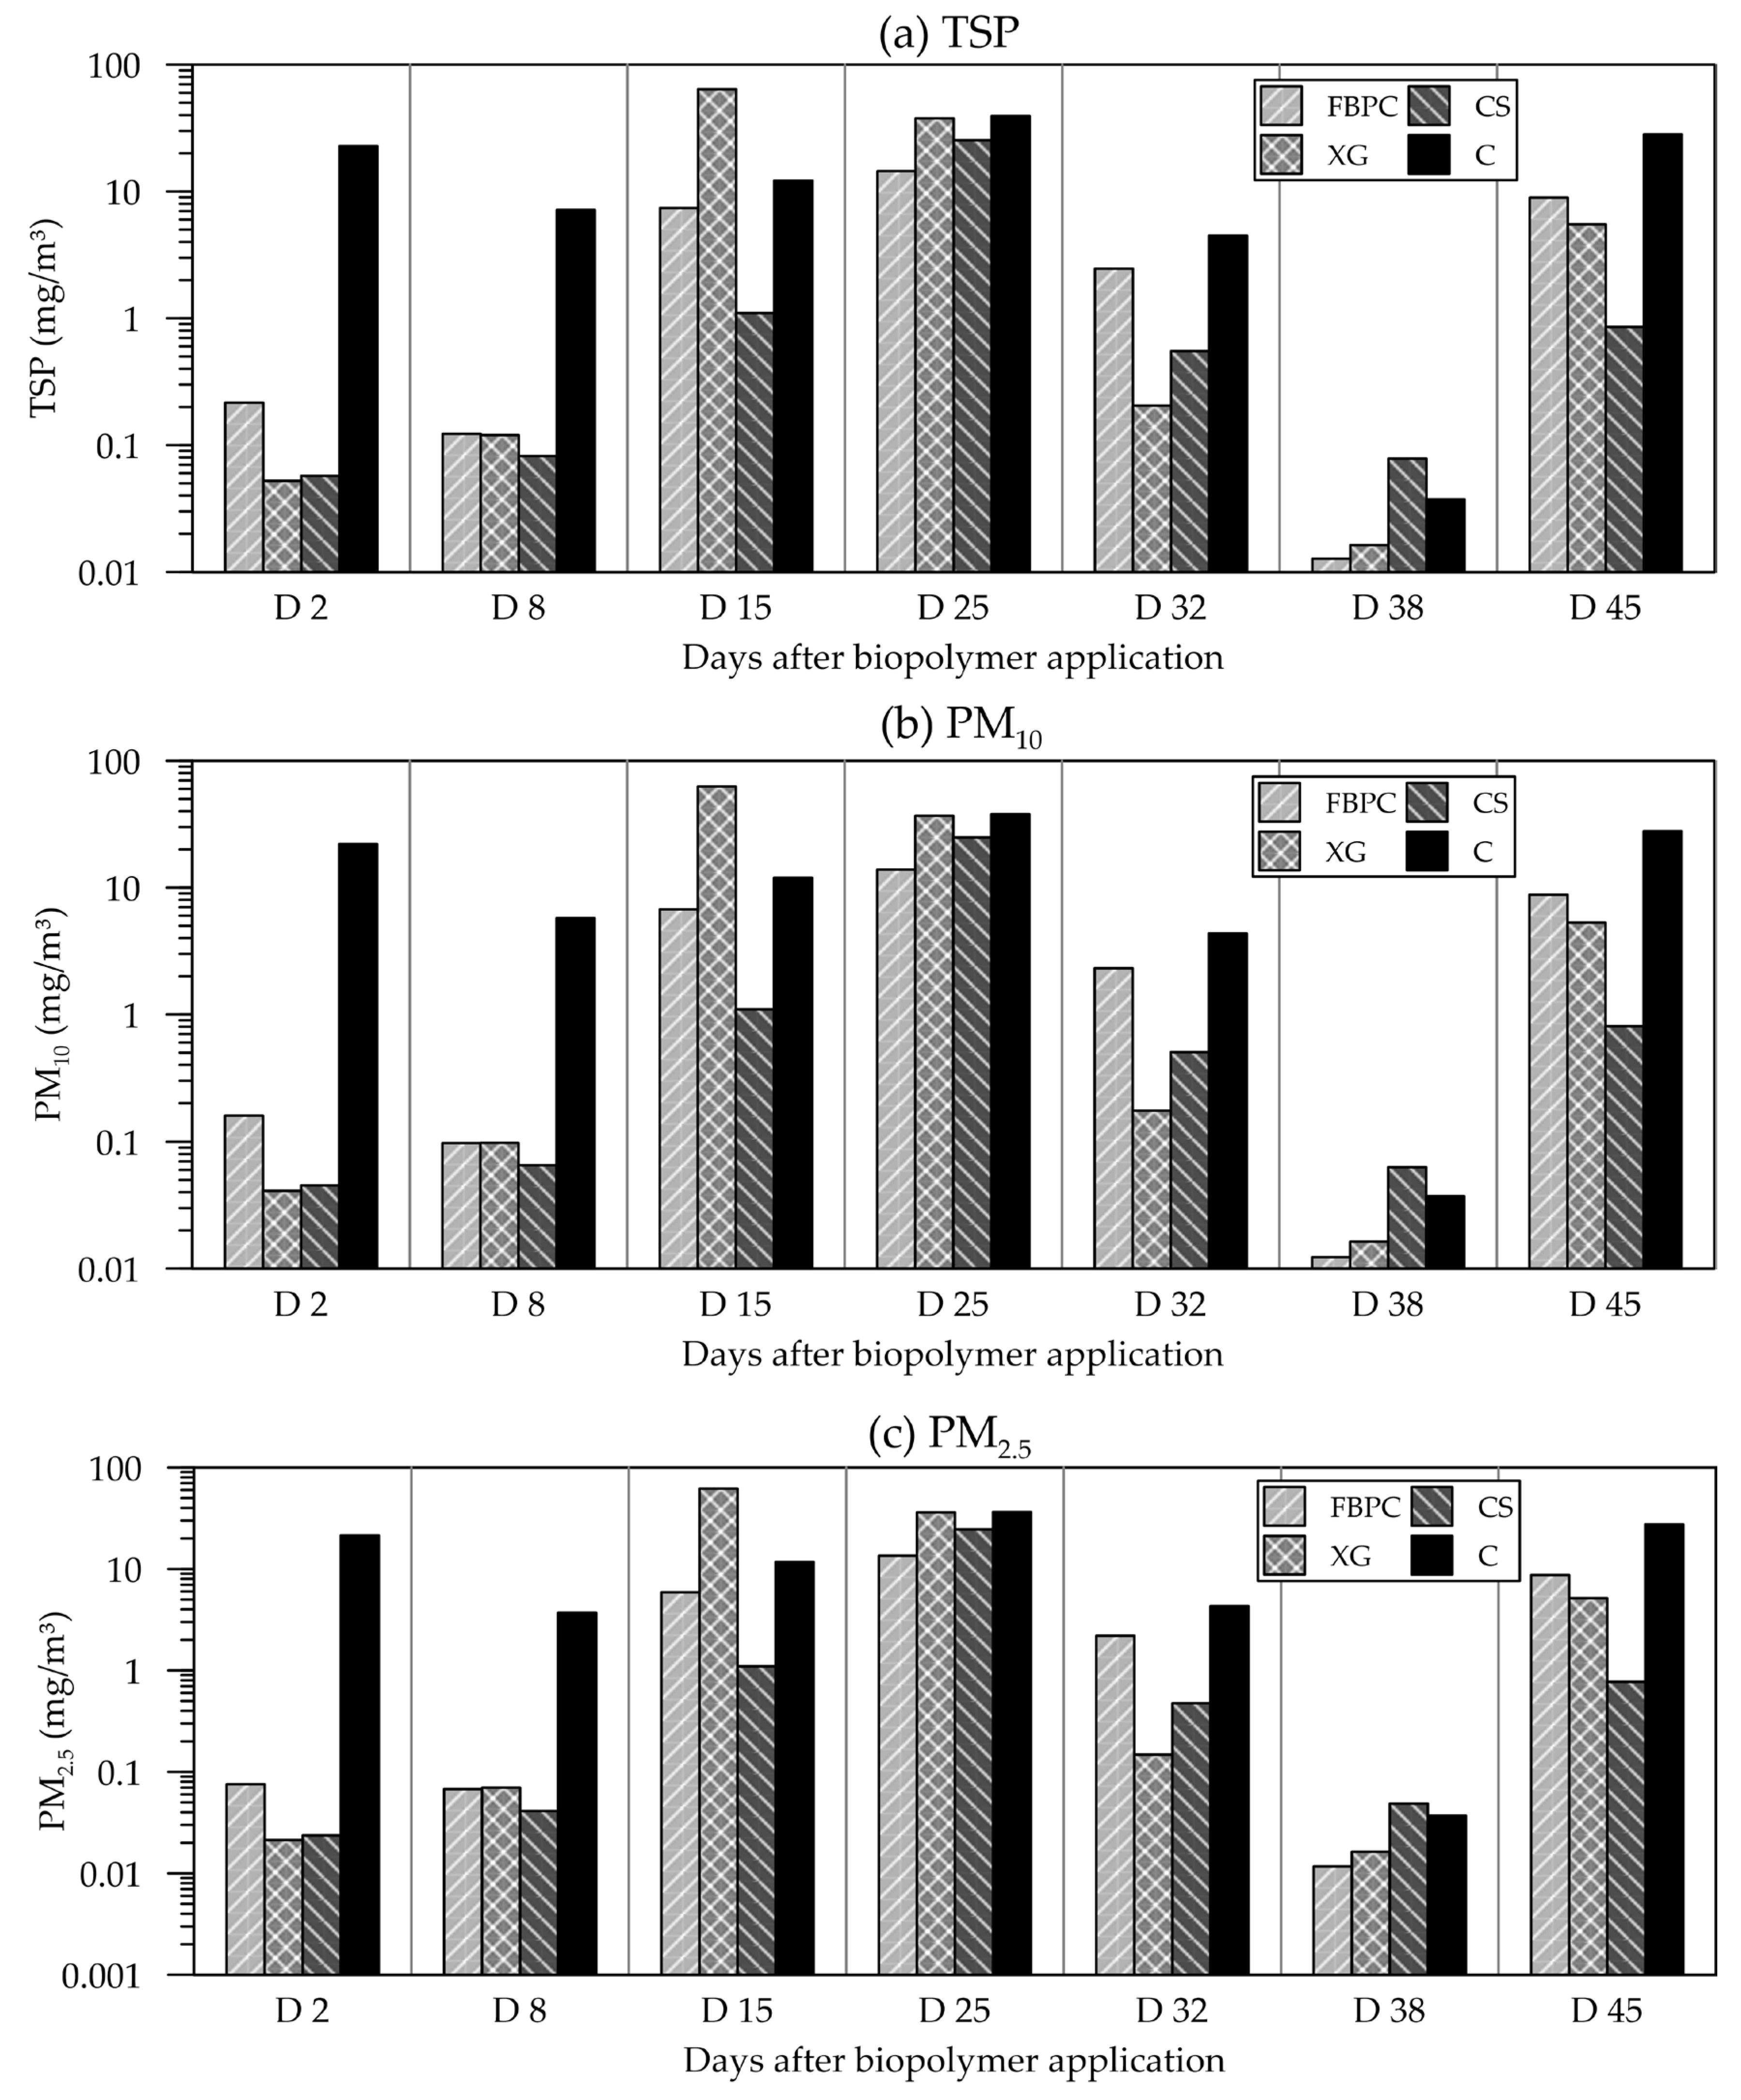
- D2 and D8. Here, the biopolymer-treated trial plots (CS, FBPC, and XG) exhibited low dust emissions, while significant emissions were measured on the untreated plots. Mean TSP emissions of the biopolymer-treated plots ranged from 0.05 to 0.21 mg/m3, while emissions from the control section (C) ranged from 4.5 to 31.2 mg/m3. Among the biopolymer treatments, the FBPC-amended test sections exhibited slightly higher emissions than the XG- and CS-amended ones.
- D15 and D25. Compared to the first two test days, the results of D15 and D25 showed different behaviour, as dust emissions gradually increased across all trial plots. On D15, the observed TSP emissions from the biopolymer-treated plots increased notably (CS: 4.9 mg/m3, FBPC: 15.1 mg/m3, and XG: 2.93 mg/m3), with the FBPC-amended plots displaying similar emissions to the control (C: 14.3 mg/m3). The peak emissions of the study were recorded on D25, whereby the FBPC-treated plots exhibited lower TSP emissions (18.8 mg/m3) than the other plots (CS: 52.4 mg/m3, XG: 52.5 mg/m3, C: 44.5 mg/m3).
- D32 and D38. On D32 and D38, the measured emissions decreased, reaching the field trial’s low point on D38. Compared to D25, all trial plots exhibited relatively low TSP emissions on D32 (CS: 0.3 mg/m3, XG: 0.2 mg/m3, FBPC: 2.2 mg/m3, and C: 0.1 mg/m3). On D38, emissions decreased even further, with only marginal TSP emissions measurable on all plots (CS: 0.05 mg/m3, FBPC: 0.02 mg/m3, XG: 0.02 mg/m3, and C: 0.03 mg/m3).
- D45. On the last test day, the measured emissions had increased considerably compared to D38 (CS: 0.75 mg/m3, FBPC: 9.18 mg/m3, XG: 0.79 mg/m3, and C: 31.0 mg/m3). Therefore, the control exhibited the highest emissions.
- Overall behaviour: Dust emissions of tests performed at v2 and v3 display a similar temporal development to that previously described for v1. Again, tests on D2 and D8 showed low emissions on the biopolymer-treated plots and high emissions on the untreated plots, followed by dust emissions increasing on D15 and peaking on D25. After that, emissions decreased on D32, bottomed out on D38, and increased again on D45.
- Comparison of v1 with v2 and v3: On D2 and D8, the average emissions induced by air speed of v2 mostly increased slightly compared to v1, while increasing the velocity to v3 mostly resulted in a decrease compared to v2. By contrast, on D15 and D25, the TSP emissions at v2 on the biopolymer-treated plots were mostly lower than at v1. Notably, on D15, the XG-treated plots subjected to v3 showed considerably higher emissions than the other tested fields. On D32, emissions decreased on all the plots tested and bottomed out on D38, irrespective of the velocity tested. Lastly, on D45, the CS- and XG-treated plots exposed to v2 displayed similar emissions as v1, whereas emissions measured for FBPC-treated plots were increased.
3.2.3. Share of PM10 and PM2.5 Fractions
3.2.4. Conclusions
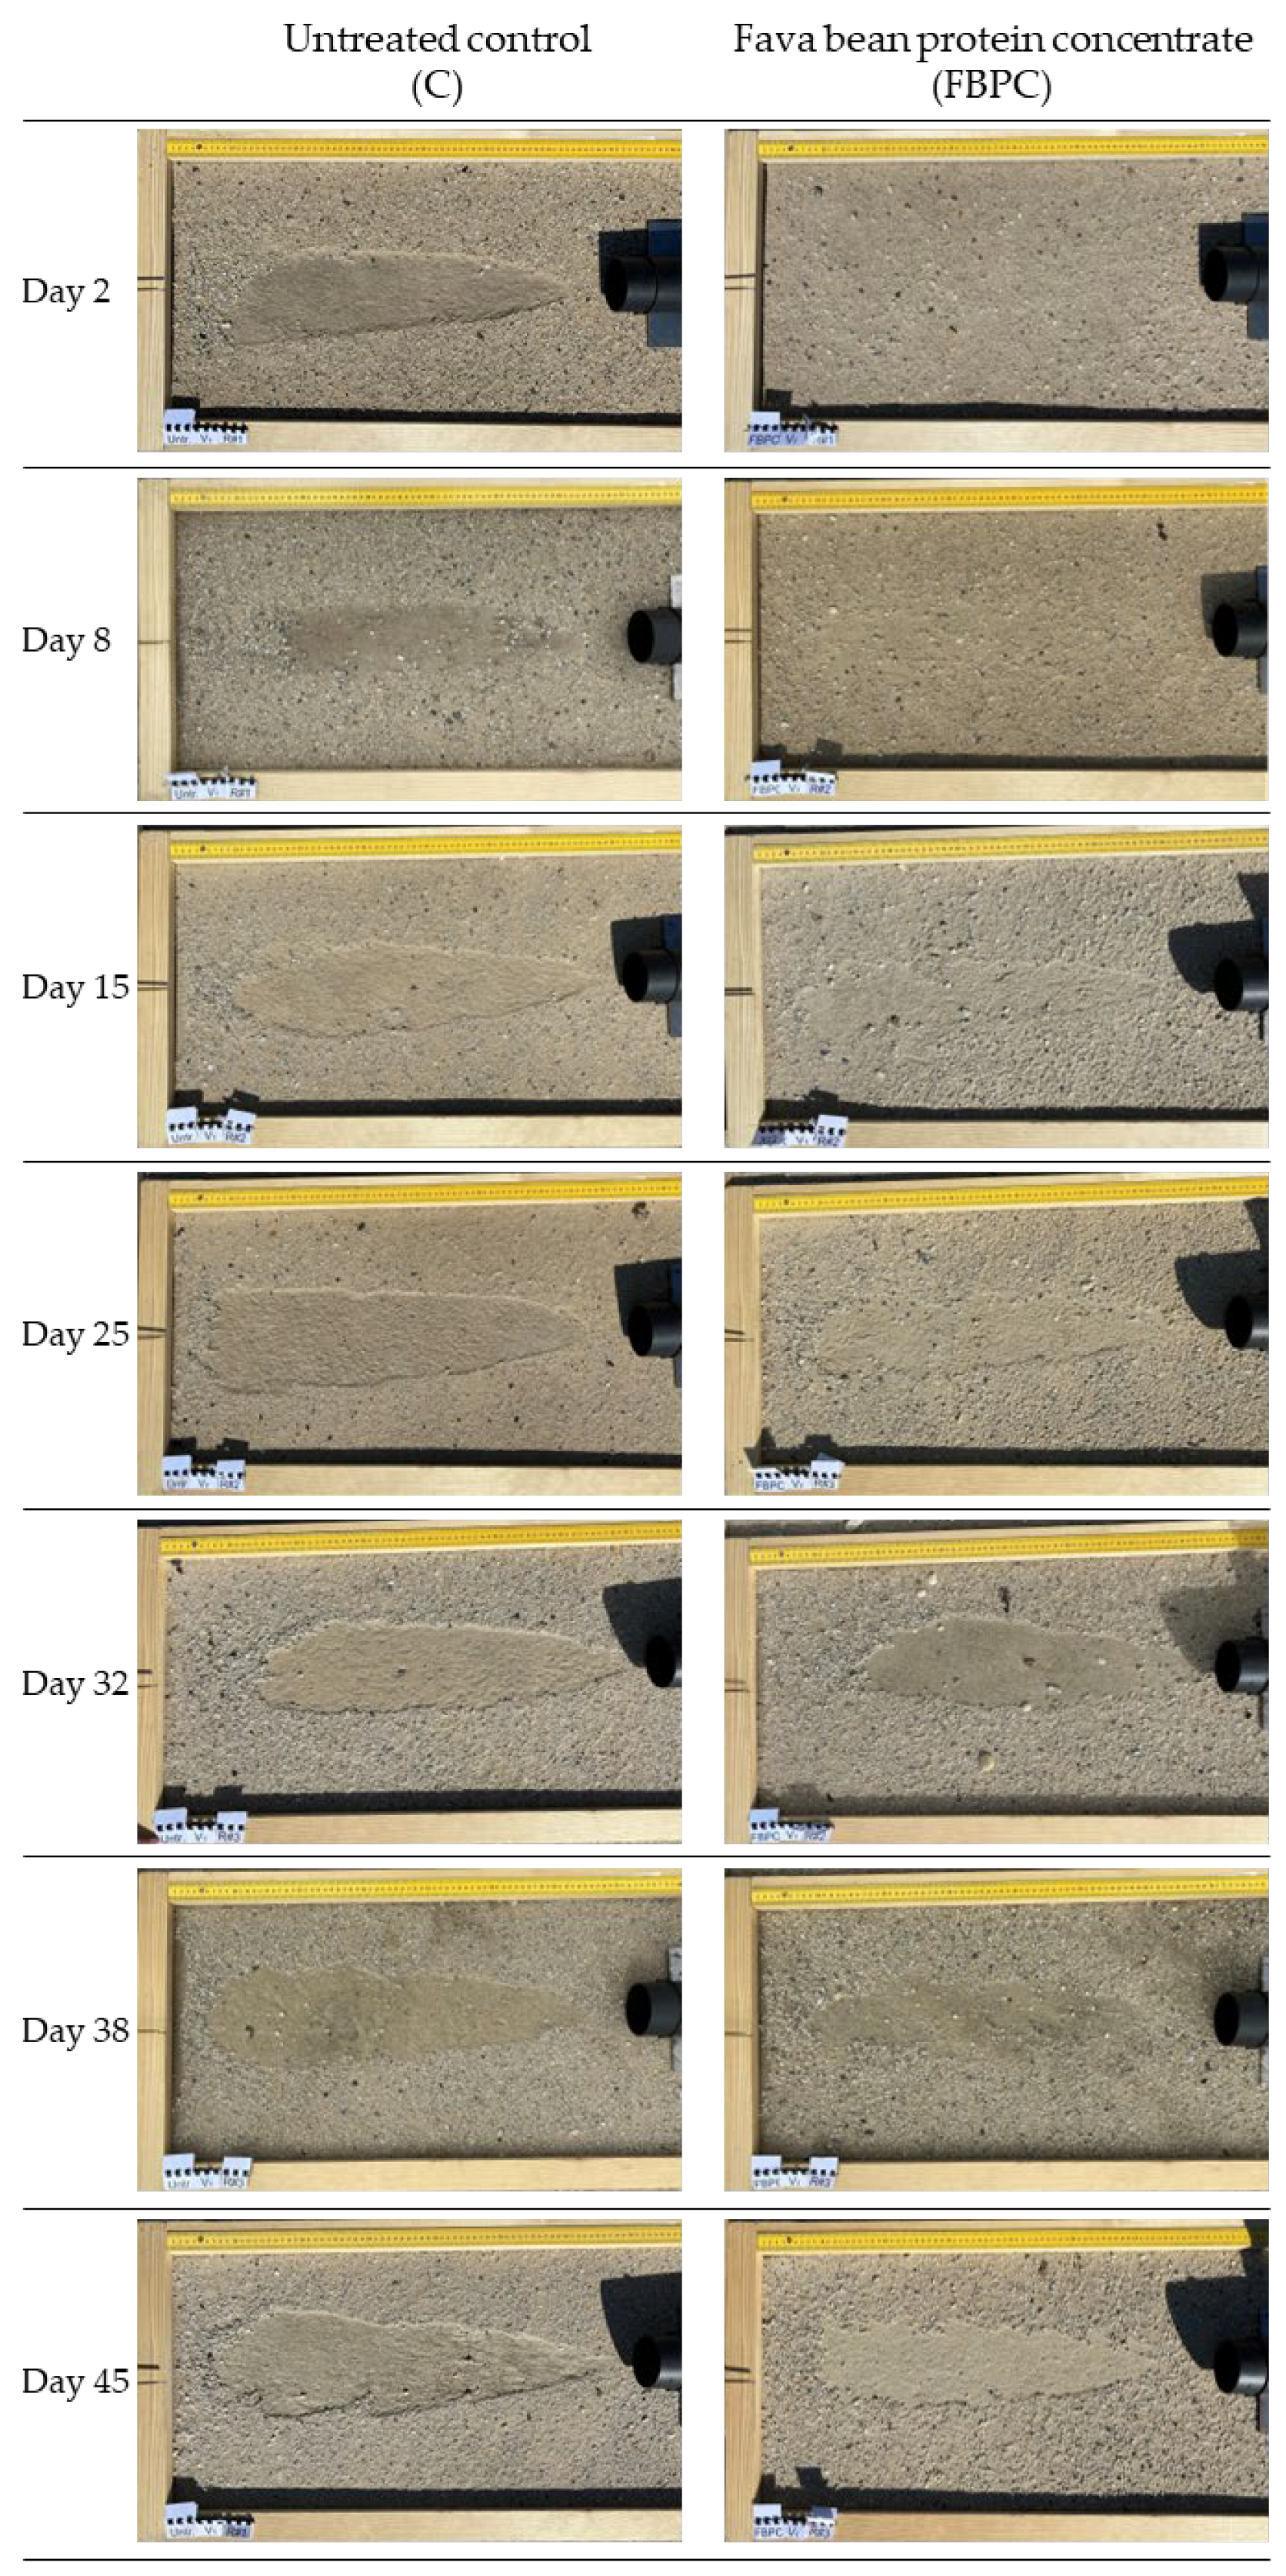
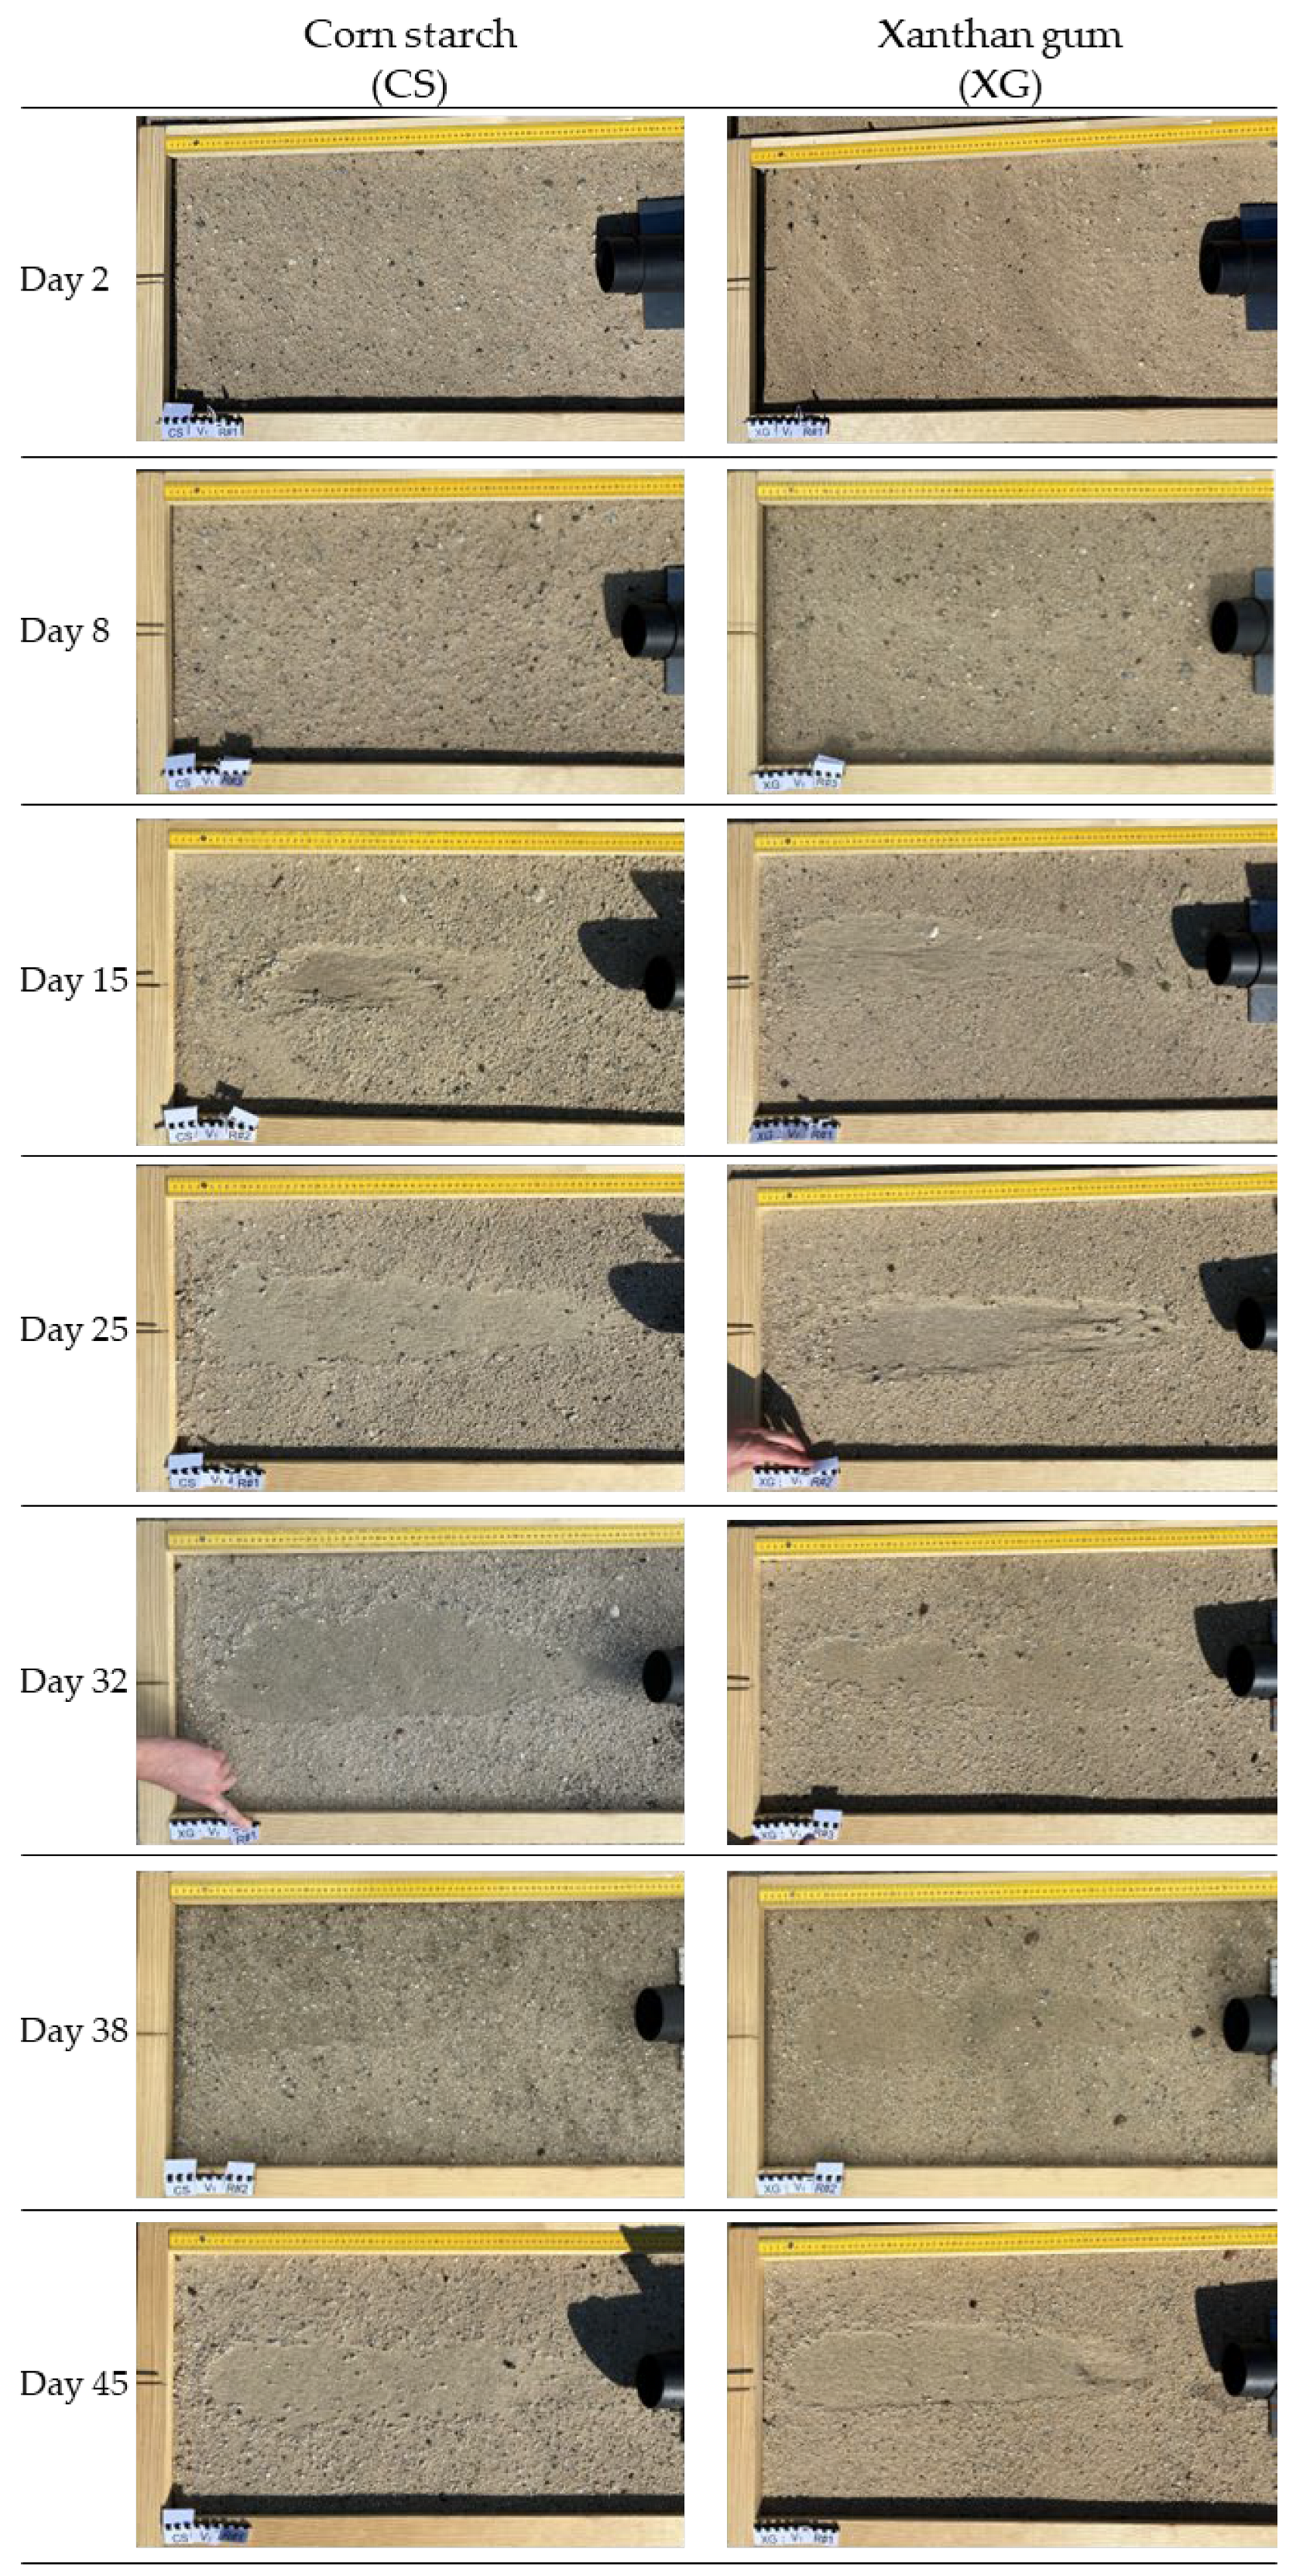
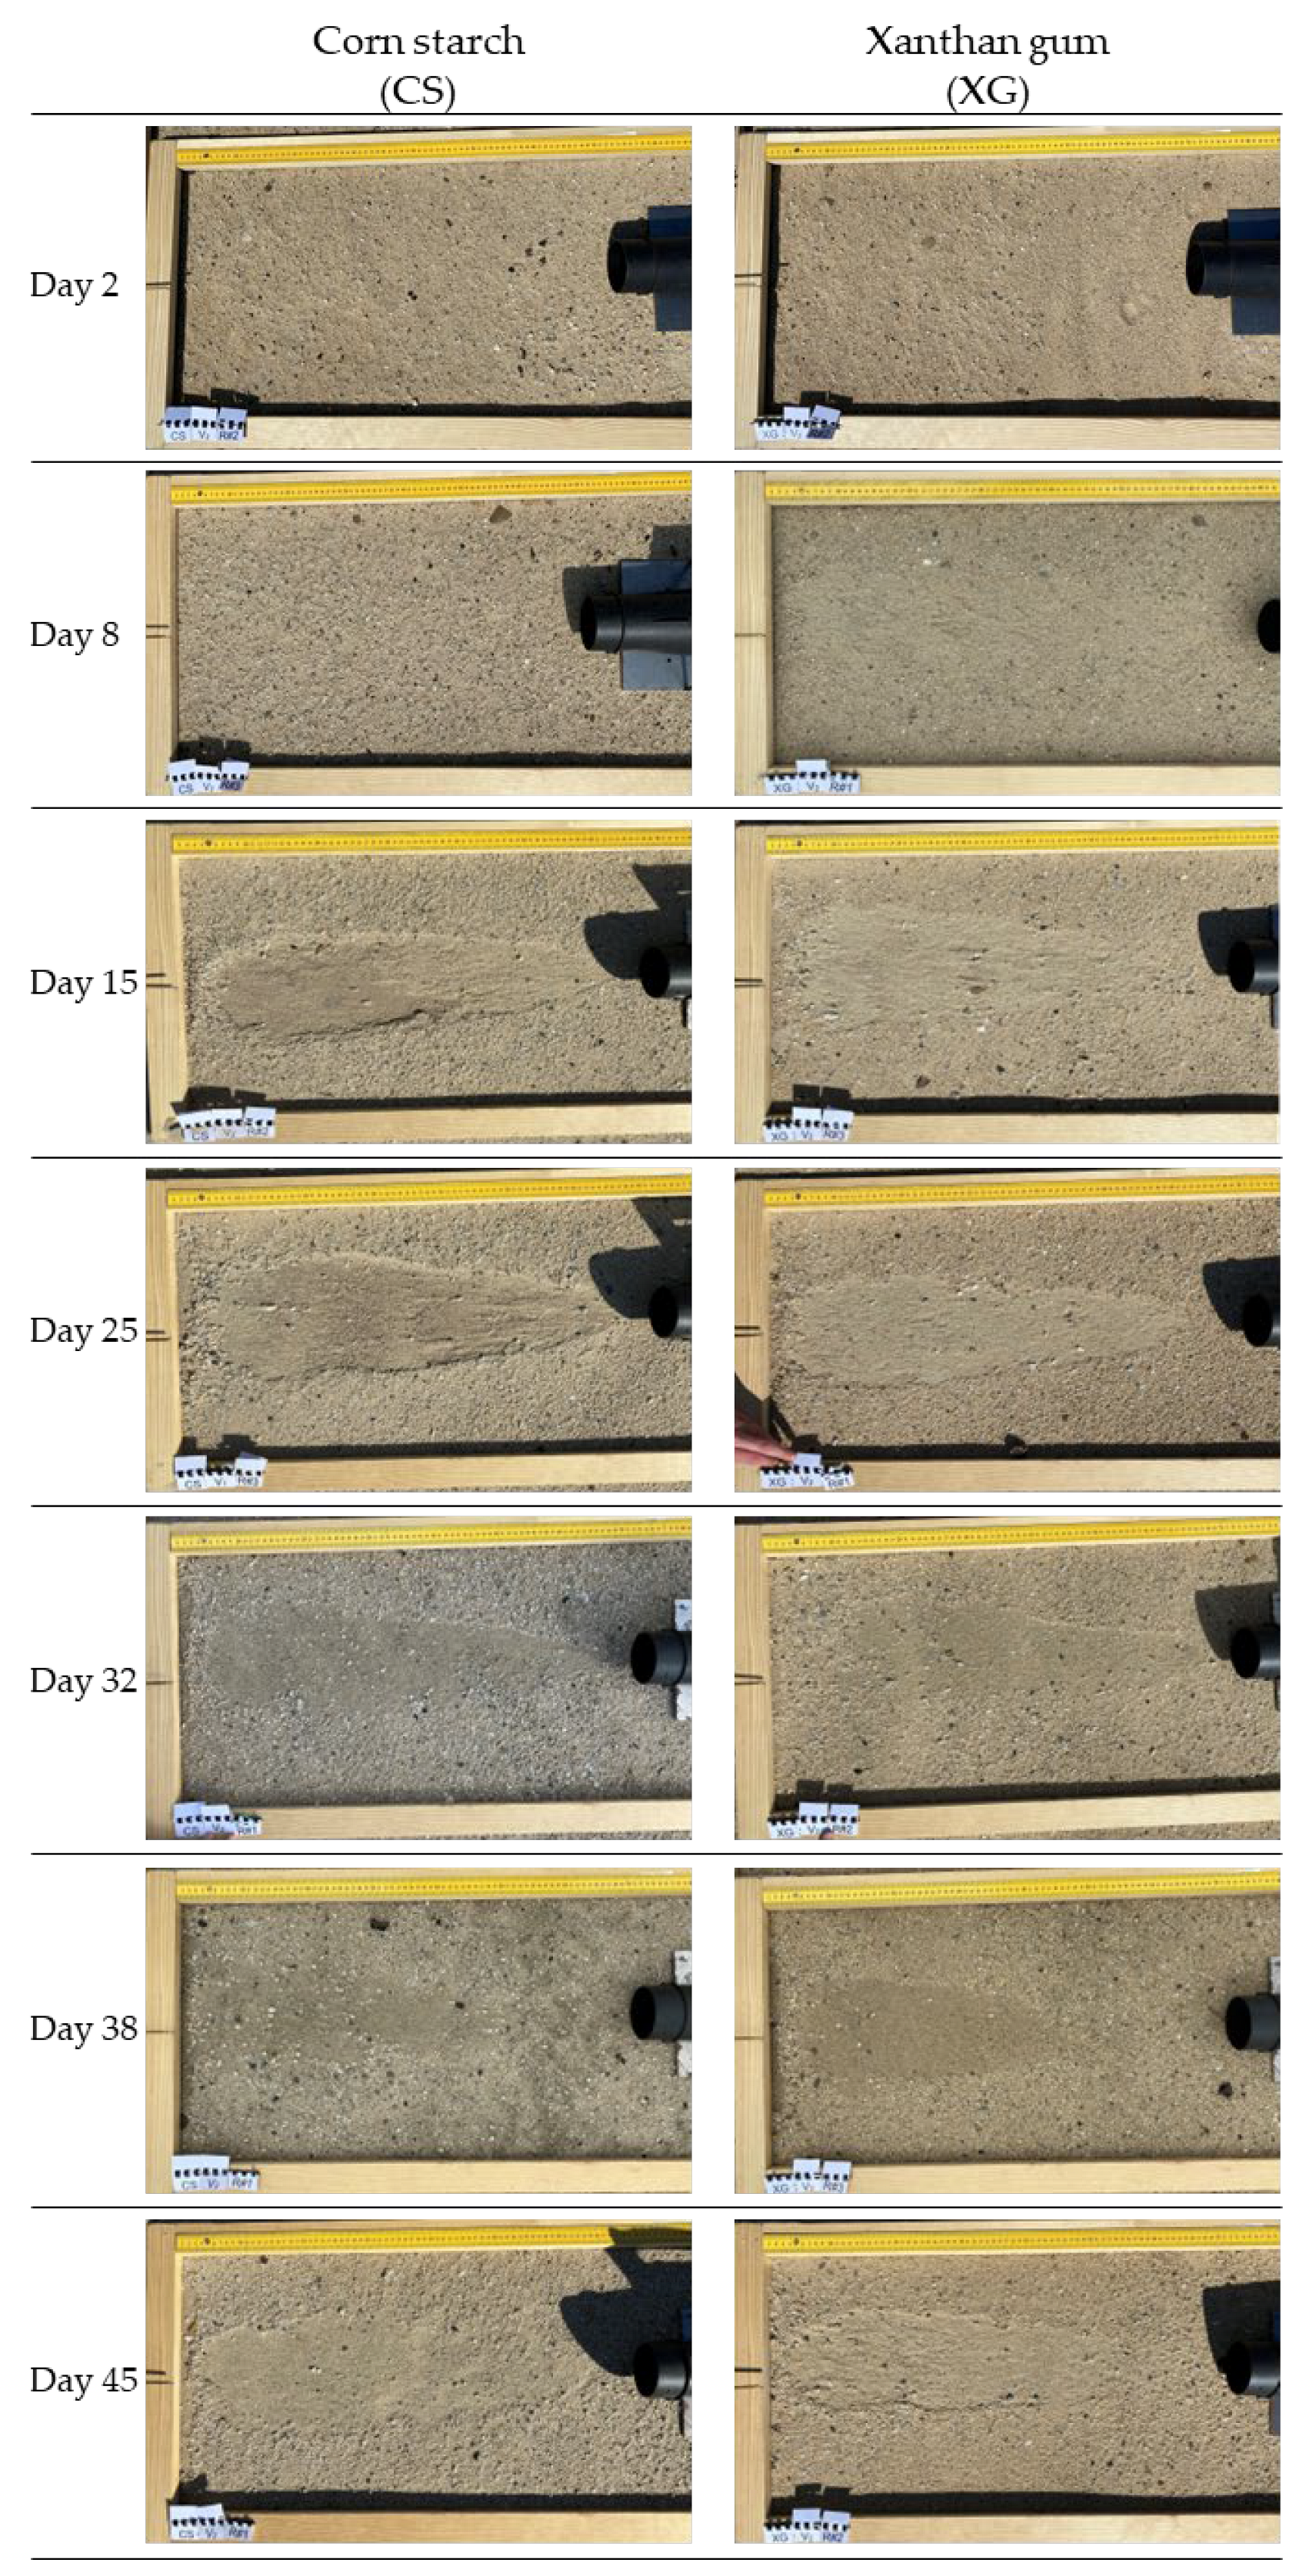
3.3. Visual Inspection of Trial Plots
- Untreated trial plots (C). The fan-generated air flow caused significant erosion on the untreated trial plots, resulting in distinct cone-shaped wind erosion traces on each testing day. The widths and lengths of the erosion traces slightly varied throughout the test days, with less erosion being perceived on D8 and D38 (for v1). On D32, the erosion traces resulting from tests at v2 and v3 were slightly bent due to cross-winds. The dimensions of the erosion traces increased significantly with the higher velocities tested (Figure A1 and Figure A3).
- FBPC-treated trial plots. On D2, only a few sand particles were eroded by the induced airflow, regardless of the velocity tested, whereas tests on D8 produced visually perceivable erosion marks. From D15 onwards, the typical cone-shaped erosion traces became visible, becoming larger and more distinct with each measurement day. However, throughout the field trials, the erosion traces on the FBPC-treated soil (v1) were smaller than the corresponding traces on the untreated plots. In contrast, the v2 and v3 trials resulted in more similar erosion traces.
- CS-treated trial plots. Similarly to the FBPC-treated plots, almost no erosion traces were observed after the tests on D2 and D8, regardless of the velocity tested. On D15, the induced airflow produced clearly visible erosion traces, but not as distinct or large as the corresponding untreated plots (for v1, v2, and v3). From D25 onwards, the CS-treated plots exhibited erosion traces of similar shape and size to the untreated plots at all velocities tested.
- XG-treated trial plots. Similarly to the CS- and FBPC-treated trial plots, the XG-treated plots showed almost no wind erosion throughout the tests on D2 and D8 at all velocities. However, on D8, the XG-treated plots displayed slightly larger erosion traces than the CS- and FBPC-treated plots. From D15 onwards, the conical erosion traces could be observed at all velocities tested, and their size increased with each test day. However, the traces were not as distinct or large as the corresponding untreated trial plots.
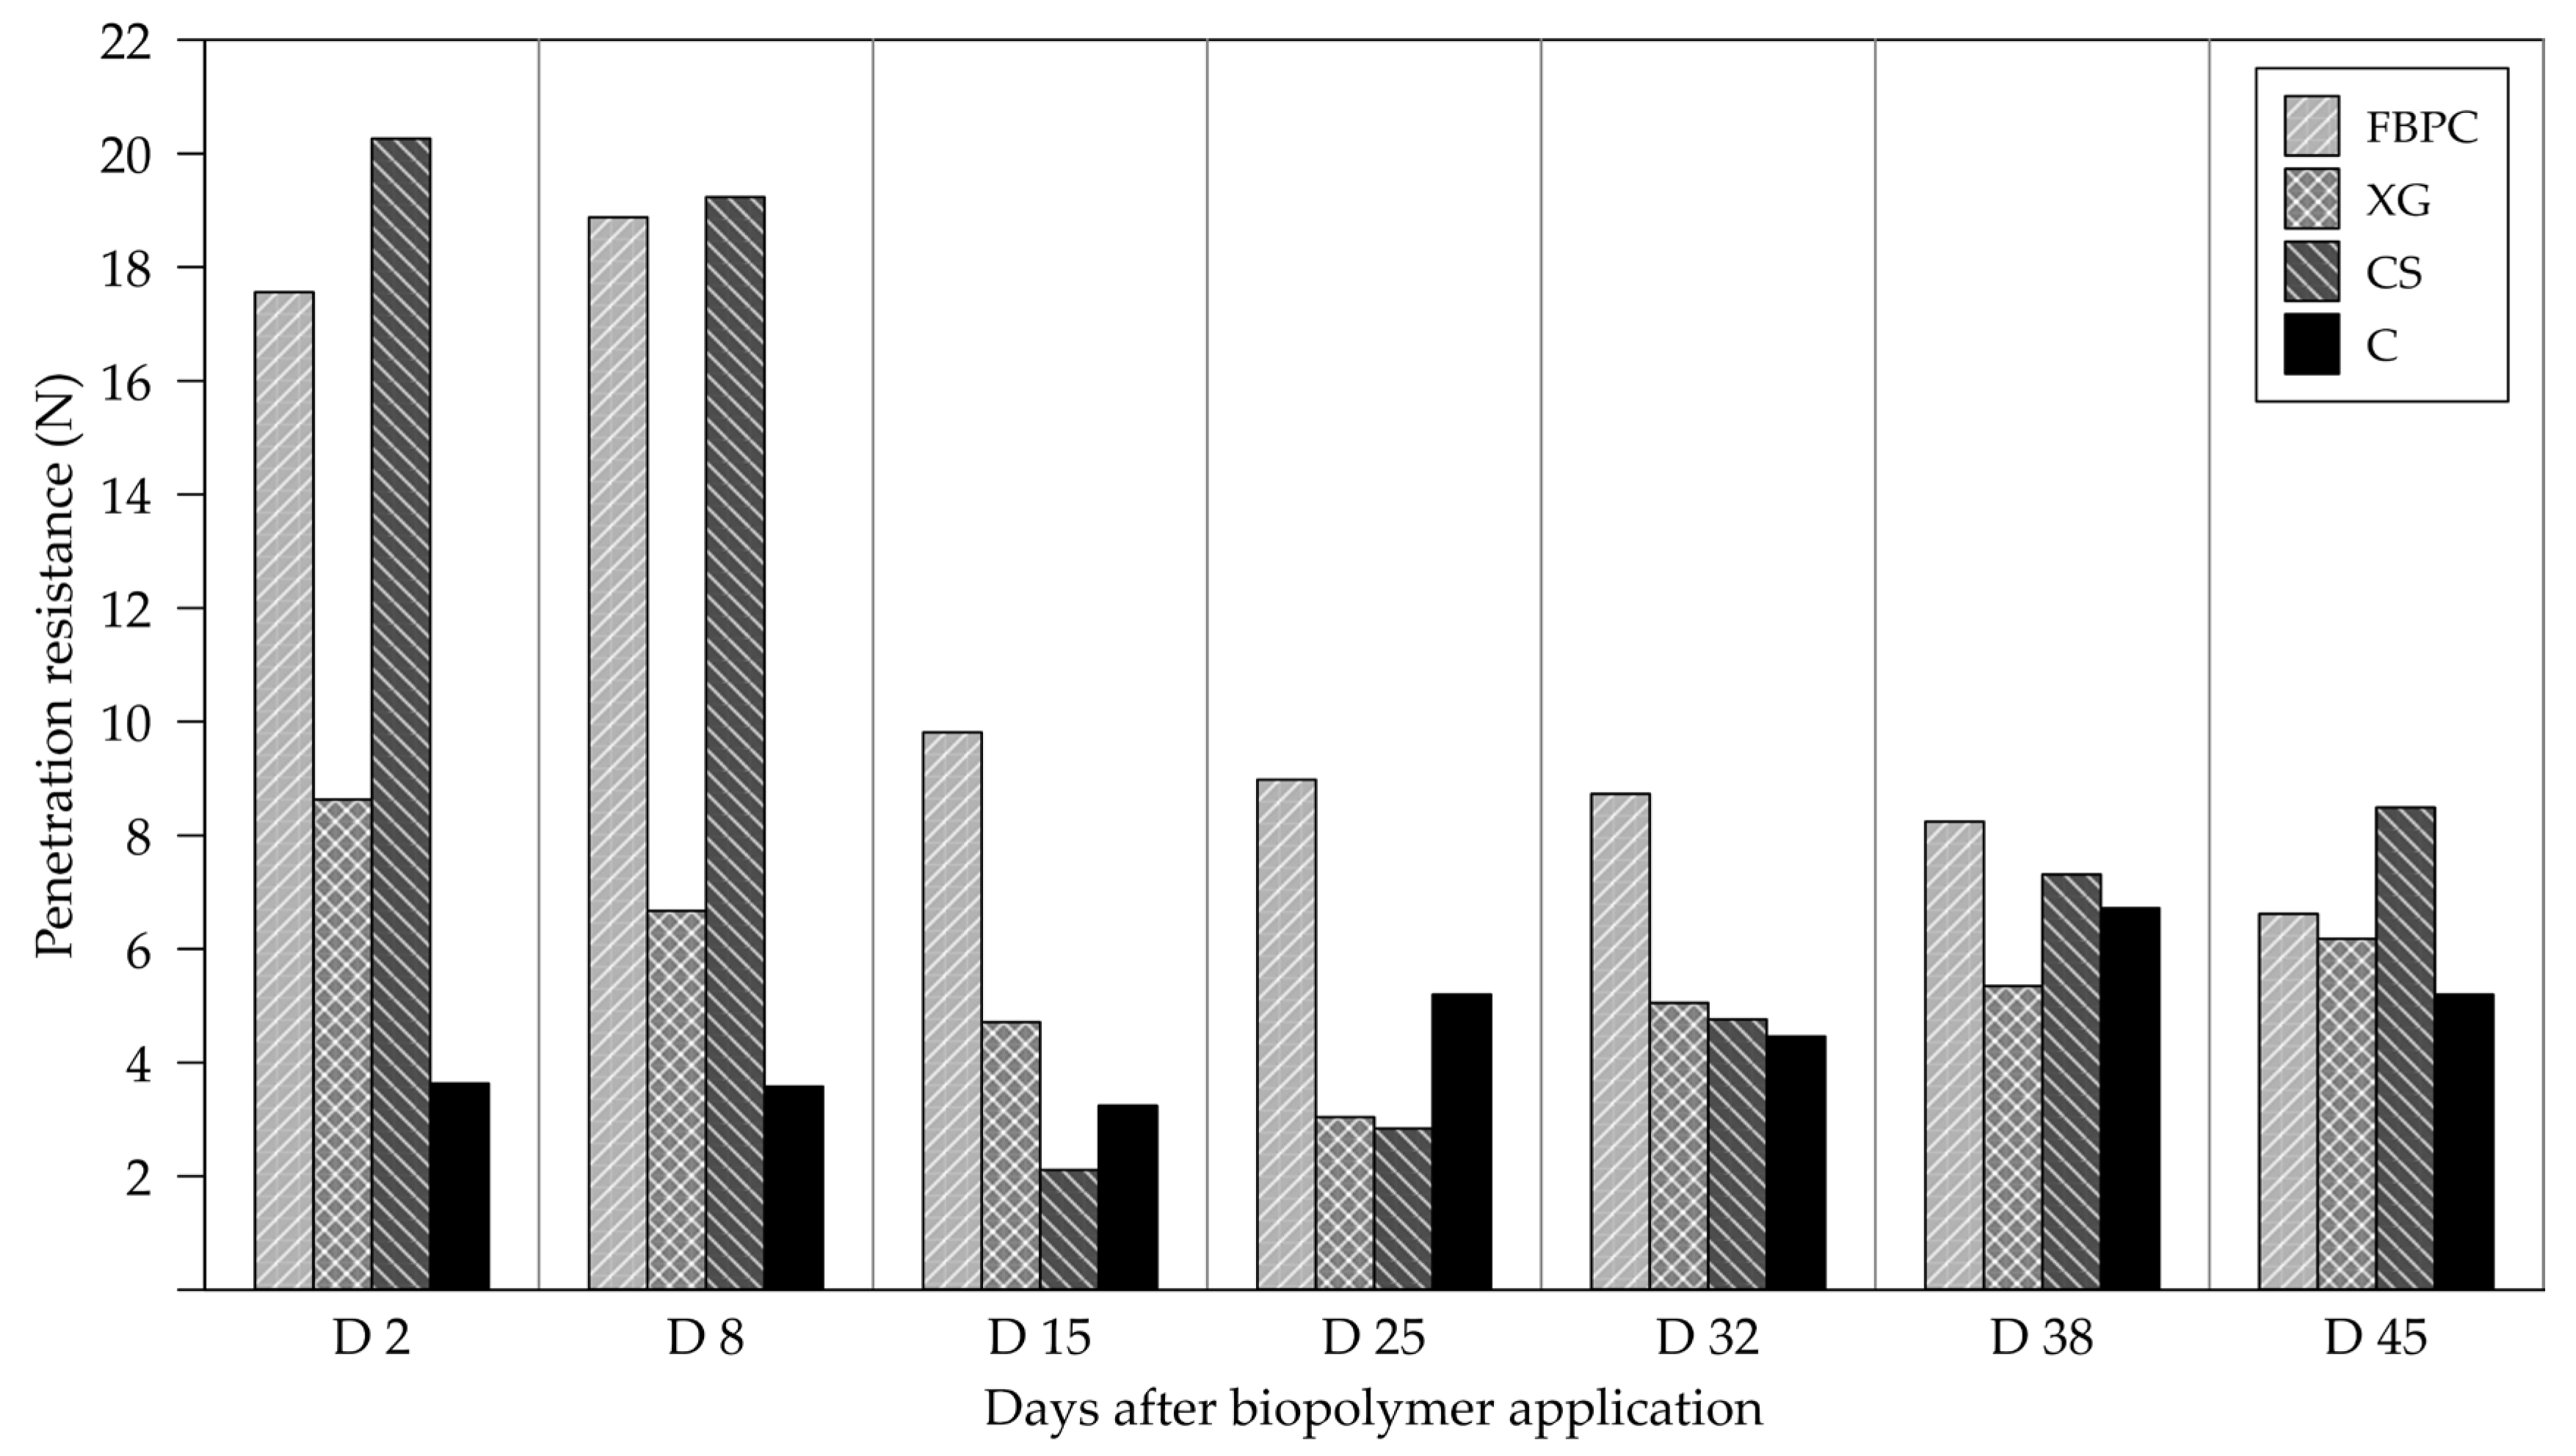
3.4. Penetration Resistance
4. Discussion
4.1. Findings from Previous Field Trials
4.2. Interpretation of Field Trial Results
4.2.1. Dust Emissions
4.2.2. Effect of Air Velocity on Dust Emissions and Soil Erosion
4.2.3. Variability in Dust Emission Data
4.3. Penetration Resistance
4.4. Suitability of Test Method
4.5. Comparison of Field Trials with Previous Laboratory Studies
4.6. Application Potential of Tested Biopolymers as Dust Suppressants on Mine Sites
- Durability. Rainfall-induced leaching appears to be the main factor impairing the durability of a treatment. Aside from rainfall, biopolymers’ environmental degradability also limits the durability of their applications. By contrast, traditional dust suppressants such as chloride salts [58] or synthetic polymer emulsions (e.g., [50,58]) have shown notably higher durability. This implies that biopolymers require more frequent rejuvenation intervals than conventional dust suppressants to maintain their effectiveness. However, it should be noted that the dosages tested in this study were relatively low compared to previous field trials (Table A6), and it is assumed that higher dosages would enhance the durability of a treatment.
- Cost-effectiveness. A cost-effectiveness analysis must account for costs for the biopolymer, water, equipment, fuel, personnel, and rejuvenation intervals required to maintain the effectiveness of the treatments. This study tested relatively low application dosages (see Section 2.3). Considering indicative bulk prices for the respective biopolymers (XG = 2.0–3.0 USD/kg [71], CS < 1.0 USD/kg [22], and FBPC = 1.4–2.5 USD/kg [72]), the estimated biopolymer costs for the doses tested in this study are XG = 14–21 USD/ha, CS < 13 USD/ha, and FBPC = 57–103 USD/ha. These indicative biopolymer costs per hectare suggest that equipment, fuel, and labour costs and their durability primarily affect the cost-effectiveness of a biopolymer treatment. The test results and product costs also suggest that the polysaccharides tested (CS and XG) are more cost-effective than the protein FBPC. Further field trials are required to determine the long-term application costs of biopolymers. It is important to note that the optimal dosage, durability, and thus application costs are highly dependent on site-specific characteristics, such as climate, precipitation, and the forces acting on the treated areas.
- Availability, ease of use, and scalability. The biopolymers tested in this study are readily available in most regions of the world, as they are derived from widely abundant crops such as corn (CS) and fava beans (FBPC) or are commonly used in the oil and gas and food and beverage industries (XG) [22,23,72]. Experience from these field trials has shown that biopolymer solutions can be easily prepared and applied on a large scale using readily available spraying equipment.
- Environmental friendliness. The safety data sheets (SDSs) of the corn starch (CS) and fava bean protein concentrate (FBPC) tested classify the substances as food ingredients that do not require classification under European Union Regulation (EC) 1907/2006 (REACH regulation). Similarly, the SDS for technical grade xanthan gum (XG) classifies it as readily biodegradable and not dangerous, so it does not require specific labelling under Regulation (EC) 1272/2008 (CLP Regulation). Based on this information, the biopolymers tested in this study are assumed to be environmentally benign. Conversely, traditional dust suppressants, such as salt brines or petroleum-based products, are not as degradable and may have adverse effects on the surrounding flora and fauna [16,58]. Steevens et al. [73] highlighted that overexposure to some synthetic polymers during the handling and application may be carcinogenic to workers. McTigue et al. [16] concluded that there is a lack of comprehensive, independent environmental and toxicity data for many commercial dust suppressants, whose ingredients often remain proprietary. Finally, synthetic polymer ingredients are still predominantly derived from fossil fuels and—unlike the biopolymers tested—are not bio-based.
5. Conclusions
- The results of this study demonstrate that the spray-on application of low biopolymer dosages with a tractor-mounted field sprayer allows the effective application of dust suppressants on a large scale.
- For dust emission measurements, trial plots were exposed to air velocities of up to 17.4 m/s, and the biopolymer treatments tested effectively suppressed the measured dust emissions in the short term up to 8 days (D8) after application. On D2 and D8, mean total suspended particle (TSP) emissions measured on treated plots ranged from 0.05 to 0.27 mg/m3, while emissions on untreated plots ranged from 4.5 to 39.2 mg/m3. The findings of the visual inspections and the penetrometer tests support the results of the dust emission measurements. After D8, the effectiveness of the treatments degraded rapidly due to rainfall-induced leaching of the water-soluble biopolymers from the soil surface.
- The custom-built test setup used to measure the dust emissions from biopolymer-treated soil plots by exposing them to airflow generated by an electric air blower proved to be a simple and flexible method for investigating the wind erosion resistance and dust emissions from soils exposed to variable air speeds.
Author Contributions
Funding
Data Availability Statement
Acknowledgments
Conflicts of Interest
Appendix A

| Day before/after Application | Date | Precipitation (L/m2) | Temperature (°C) | Humidity (%) | Wind (m/s) | ||
|---|---|---|---|---|---|---|---|
| Total | Mean | Min | Max | Mean | Max | ||
| −6 | 02 August 2022 | 0.0 | 22.6 | 18.5 | 25.6 | 60.4 | 8.7 |
| −5 | 03 August 2022 | 0.0 | 21.3 | 15.6 | 29.0 | 51.2 | 9.1 |
| −4 | 04 August 2022 | 0.4 | 29.4 | 19.1 | 33.3 | 41.9 | 7.1 |
| −3 | 05 August 2022 | 3.9 | 26.9 | 20.4 | 32.7 | 49.9 | 10.7 |
| −2 | 06 August 2022 | 0.0 | 18.4 | 14.6 | 21.9 | 61.8 | 10.9 |
| −1 | 07 August 2022 | 0.0 | 18.2 | 10.4 | 22.2 | 50.1 | 5.8 |
| 0—BP Application | 08 August 2022 | 0.0 | 21.4 | 10.6 | 25.4 | 41.3 | 6.0 |
| 1 | 09 August 2022 | 0.0 | 21.2 | 11.8 | 26.0 | 48.3 | 7.2 |
| 2—Test Day 1 | 10 August 2022 | 0.0 | 22.3 | 15.1 | 28.9 | 46.2 | 6.6 |
| 3 | 11 August 2022 | 0.0 | 25.5 | 16.9 | 31.2 | 38.4 | 6.5 |
| 4 | 12 August 2022 | 0.0 | 27.6 | 17.6 | 31.6 | 32.7 | 7.1 |
| 5 | 13 August 2022 | 0.0 | 25.3 | 17.4 | 31.4 | 32.6 | 9.5 |
| 6 | 14 August 2022 | 0.0 | 27.1 | 18.3 | 31.7 | 33.6 | 7.6 |
| 7 | 15 August 2022 | 0.4 | 27.7 | 17.8 | 32.6 | 36.8 | 7.4 |
| 8—Test Day 2 | 16 August 2022 | 0.0 | 22.1 | 20.0 | 25.7 | 60.7 | 8.1 |
| 9 | 17 August 2022 | 1.1 | 27.4 | 19.0 | 31.0 | 47.9 | 6.6 |
| 10 | 18 August 2022 | 0.0 | 21.7 | 18.2 | 24.7 | 68.0 | 6.3 |
| 11 | 19 August 2022 | 0.2 | 21.5 | 15.6 | 26.0 | 62.0 | 4.7 |
| 12 | 20 August 2022 | 3.0 | 22.0 | 16.7 | 25.3 | 62.6 | 7.8 |
| 13 | 21 August 2022 | 0.0 | 21.6 | 16.7 | 24.6 | 55.7 | 7.8 |
| 14 | 22 August 2022 | 0.0 | 20.6 | 13.7 | 24.6 | 52.5 | 7.2 |
| 15—Test Day 3 | 23 August 2022 | 0.0 | 23.6 | 15.5 | 28.1 | 49.8 | 4.3 |
| 16 | 24 August 2022 | 0.0 | 26.5 | 16.9 | 29.9 | 47.5 | 6.7 |
| 17 | 25 August 2022 | 0.0 | 28.6 | 18.0 | 32.9 | 41.1 | 4.4 |
| 18 | 26 August 2022 | 0.0 | 28.6 | 18.4 | 32.8 | 37.1 | 5.6 |
| 19 | 27 August 2022 | 0.4 | 19.6 | 18.4 | 23.6 | 75.0 | 6.9 |
| 20 | 28 August 2022 | 0.0 | 16.9 | 14.8 | 19.3 | 75.5 | 4.1 |
| 21 | 29 August 2022 | 0.0 | 19.6 | 15.0 | 23.6 | 51.7 | 7.0 |
| 22 | 30 August 2022 | 0.9 | 19.6 | 11.8 | 23.4 | 51.9 | 5.9 |
| 23 | 31 August 2022 | 6.8 | 22.4 | 16.0 | 27.8 | 47.5 | 7.7 |
| 24 | 01 September 2022 | 0.0 | 18.5 | 15.0 | 23.8 | 61.6 | 6.6 |
| 25—Test Day 4 | 02 September 2022 | 0.0 | 21.5 | 13.6 | 25.5 | 48.7 | 5.8 |
| 26 | 03 September 2022 | 1.0 | 20.3 | 16.2 | 25.7 | 42.1 | 8.4 |
| 27 | 04 September 2022 | 0.0 | 21.6 | 14.5 | 25.6 | 54.4 | 5.9 |
| 28 | 05 September 2022 | 0.0 | 23.6 | 16.1 | 28.1 | 48.9 | 5.1 |
| 29 | 06 September 2022 | 5.4 | 25.2 | 16.4 | 30.5 | 38.6 | 4.6 |
| 30 | 07 September 2022 | 17.0 | 24.8 | 16.0 | 30.0 | 44.7 | 14.5 |
| 31 | 08 September 2022 | 9.0 | 20.3 | 15.5 | 25.1 | 58.7 | 11.7 |
| 32—Test Day 5 | 09 September 2022 | 0.9 | 18.3 | 15.1 | 21.1 | 65.1 | 10.3 |
| 33 | 10 September 2022 | 1.7 | 17.2 | 14.8 | 19.8 | 68.5 | 11.8 |
| 34 | 11 September 2022 | 0.0 | 16.8 | 14.9 | 19.0 | 77.3 | 11.4 |
| 35 | 12 September 2022 | 0.0 | 19.9 | 14.7 | 22.2 | 65.1 | 5.1 |
| 36 | 13 September 2022 | 2.8 | 21.3 | 12.5 | 27.1 | 52.1 | 4.3 |
| 37 | 14 September 2022 | 6.0 | 21.9 | 17.3 | 25.7 | 57.4 | 5.1 |
| 38—Test Day 6 | 15 September 2022 | 2.7 | 15.1 | 13.2 | 18.1 | 79.9 | 4.9 |
| 39 | 16 September 2022 | 1.6 | 15.2 | 12.5 | 17.6 | 70.3 | 5.6 |
| 40 | 17 September 2022 | 4.8 | 12.4 | 9.3 | 14.6 | 74.7 | 10.8 |
| 41 | 18 September 2022 | 10.5 | 12.4 | 9.3 | 14.7 | 69.9 | 9.9 |
| 42 | 19 September 2022 | 0.2 | 10.0 | 8.4 | 12.5 | 79.3 | 12.8 |
| 43 | 20 September 2022 | 0.2 | 14.2 | 8.9 | 16.7 | 67.5 | 8.3 |
| 44 | 21 September 2022 | 0.0 | 13.5 | 9.7 | 15.5 | 68.4 | 6.4 |
| 45—Test Day 7 | 22 September 2022 | 0.0 | 14.2 | 6.8 | 17.7 | 59.6 | 4.6 |
| Day | Biopolymer | ControlC | Background Load | |||||||
|---|---|---|---|---|---|---|---|---|---|---|
| CS | FBPC | XG | ||||||||
| M | SD | M | SD | M | SD | M | SD | M | SD | |
| TSPs (mg/m3) | ||||||||||
| 2 | 0.08 | 0.03 | 0.21 | 0.17 | 0.09 | 0.03 | 31.23 | 12.71 | 0.03 | 0.00 |
| 8 | 0.05 | 0.00 | 0.08 | 0.02 | 0.07 | 0.01 | 4.50 | 1.35 | 0.03 | 0.01 |
| 15 | 4.91 | 6.36 | 15.12 | 4.82 | 2.93 | 3.18 | 14.34 | 7.32 | 0.02 | 0.01 |
| 25 | 52.43 | 30.07 | 18.80 | 2.11 | 52.47 | 22.46 | 44.47 | 10.73 | 0.04 | 0.03 |
| 32 | 0.28 | 0.20 | 2.22 | 0.20 | 0.20 | 0.13 | 3.12 | 0.80 | 0.02 | 0.00 |
| 38 | 0.05 | 0.02 | 0.02 | 0.01 | 0.02 | 0.01 | 0.04 | 0.03 | 0.03 | 0.01 |
| 45 | 0.75 | 0.22 | 9.18 | 2.94 | 0.79 | 0.53 | 31.03 | 4.11 | 0.05 | 0.00 |
| PM10 (mg/m3) | ||||||||||
| 2 | 0.06 | 0.01 | 0.14 | 0.09 | 0.07 | 0.03 | 30.33 | 12.29 | 0.02 | 0.00 |
| 8 | 0.04 | 0.00 | 0.07 | 0.02 | 0.05 | 0.00 | 3.49 | 1.15 | 0.03 | 0.01 |
| 15 | 4.61 | 5.93 | 14.50 | 4.78 | 2.79 | 3.04 | 14.04 | 7.12 | 0.02 | 0.01 |
| 25 | 50.80 | 29.19 | 17.87 | 2.30 | 50.93 | 22.22 | 43.47 | 10.38 | 0.04 | 0.02 |
| 32 | 0.24 | 0.18 | 2.08 | 0.20 | 0.16 | 0.12 | 2.93 | 0.71 | 0.02 | 0.00 |
| 38 | 0.04 | 0.01 | 0.01 | 0.01 | 0.02 | 0.01 | 0.04 | 0.02 | 0.03 | 0.00 |
| 45 | 0.70 | 0.20 | 8.94 | 2.86 | 0.75 | 0.50 | 30.50 | 4.08 | 0.04 | 0.00 |
| PM2.5 (mg/m3) | ||||||||||
| 2 | 0.02 | 0.00 | 0.04 | 0.02 | 0.03 | 0.02 | 29.37 | 11.91 | 0.02 | 0.00 |
| 8 | 0.03 | 0.00 | 0.04 | 0.01 | 0.03 | 0.00 | 1.85 | 0.69 | 0.02 | 0.00 |
| 15 | 4.41 | 5.65 | 14.01 | 4.80 | 2.67 | 2.97 | 13.81 | 6.95 | 0.01 | 0.00 |
| 25 | 49.90 | 28.69 | 17.13 | 2.46 | 49.97 | 22.06 | 42.73 | 10.18 | 0.02 | 0.01 |
| 32 | 0.21 | 0.16 | 2.02 | 0.20 | 0.13 | 0.12 | 2.82 | 0.64 | 0.01 | 0.00 |
| 38 | 0.03 | 0.01 | 0.01 | 0.01 | 0.02 | 0.01 | 0.03 | 0.02 | 0.03 | 0.00 |
| 45 | 0.66 | 0.19 | 8.84 | 2.84 | 0.72 | 0.47 | 30.10 | 4.01 | 0.03 | 0.00 |
| Day | Biopolymer | ControlC | ||||||
|---|---|---|---|---|---|---|---|---|
| CS | FBPC | XG | ||||||
| M | SD | M | SD | M | SD | M | SD | |
| TSPs (mg/m3) | ||||||||
| 2 | 0.22 | 0.20 | 0.27 | 0.12 | 0.07 | 0.04 | 39.20 | 16.19 |
| 8 | 0.09 | 0.02 | 0.09 | 0.01 | 0.11 | 0.02 | 5.45 | 1.72 |
| 15 | 1.25 | 0.58 | 13.50 | 2.33 | 2.77 | 1.04 | 24.83 | 3.62 |
| 25 | 31.07 | 2.89 | 14.47 | 1.58 | 19.83 | 3.73 | 39.07 | 23.39 |
| 32 | 0.55 | 0.23 | 2.46 | 1.25 | 0.19 | 0.12 | 8.27 | 5.11 |
| 38 | 0.12 | 0.06 | 0.02 | 0.01 | 0.01 | 0.00 | 0.00 | 0.00 |
| 45 | 0.59 | 0.17 | 13.67 | 5.54 | 1.10 | 0.55 | 21.13 | 4.83 |
| PM10 (mg/m3) | ||||||||
| 2 | 0.15 | 0.14 | 0.18 | 0.08 | 0.05 | 0.03 | 38.40 | 16.01 |
| 8 | 0.08 | 0.02 | 0.07 | 0.01 | 0.09 | 0.02 | 4.09 | 1.29 |
| 15 | 1.25 | 0.58 | 13.00 | 2.33 | 2.61 | 0.92 | 24.37 | 3.58 |
| 25 | 30.20 | 2.73 | 13.73 | 1.65 | 19.10 | 3.68 | 38.23 | 23.15 |
| 32 | 0.49 | 0.22 | 2.35 | 1.20 | 0.18 | 0.11 | 7.99 | 5.11 |
| 38 | 0.10 | 0.05 | 0.02 | 0.01 | 0.01 | 0.00 | 0.00 | 0.00 |
| 45 | 0.54 | 0.15 | 13.38 | 5.46 | 1.04 | 0.53 | 20.80 | 4.81 |
| PM2.5 (mg/m3) | ||||||||
| 2 | 0.05 | 0.04 | 0.09 | 0.05 | 0.03 | 0.01 | 37.43 | 15.80 |
| 8 | 0.06 | 0.02 | 0.05 | 0.00 | 0.06 | 0.02 | 2.23 | 0.71 |
| 15 | 1.25 | 0.58 | 12.59 | 2.29 | 2.47 | 0.83 | 24.07 | 3.50 |
| 25 | 29.57 | 2.58 | 13.00 | 1.85 | 18.77 | 3.63 | 37.58 | 22.96 |
| 32 | 0.46 | 0.22 | 2.28 | 1.19 | 0.16 | 0.11 | 7.79 | 5.13 |
| 38 | 0.09 | 0.04 | 0.02 | 0.01 | 0.01 | 0.00 | 0.00 | 0.00 |
| 45 | 0.51 | 0.15 | 13.19 | 5.39 | 0.98 | 0.51 | 20.53 | 4.76 |
| Day | Biopolymer | ControlC | ||||||
|---|---|---|---|---|---|---|---|---|
| CS | FBPC | XG | ||||||
| M | SD | M | SD | M | SD | M | SD | |
| TSPs (mg/m3) | ||||||||
| 2 | 0.06 | 0.01 | 0.22 | 0.05 | 0.05 | 0.02 | 22.83 | 10.04 |
| 8 | 0.08 | 0.01 | 0.12 | 0.03 | 0.12 | 0.04 | 7.16 | 1.43 |
| 15 | 1.10 | 0.52 | 7.42 | 1.74 | 64.00 | 11.87 | 12.20 | 10.48 |
| 25 | 25.33 | 7.67 | 14.43 | 1.54 | 37.73 | 5.28 | 39.20 | 2.36 |
| 32 | 0.55 | 0.33 | 2.46 | 0.91 | 0.20 | 0.16 | 4.48 | 5.14 |
| 38 | 0.08 | 0.00 | 0.01 | 0.00 | 0.02 | 0.00 | 0.04 | 0.02 |
| 45 | 0.86 | 0.40 | 8.93 | 2.80 | 5.50 | 1.79 | 28.23 | 3.51 |
| PM10 (mg/m3) | ||||||||
| 2 | 0.05 | 0.01 | 0.16 | 0.04 | 0.04 | 0.01 | 22.13 | 9.97 |
| 8 | 0.07 | 0.00 | 0.10 | 0.02 | 0.10 | 0.03 | 5.74 | 1.20 |
| 15 | 1.10 | 0.52 | 6.75 | 2.11 | 62.83 | 11.65 | 11.97 | 10.22 |
| 25 | 24.90 | 7.43 | 13.87 | 1.44 | 36.80 | 5.27 | 37.83 | 2.27 |
| 32 | 0.50 | 0.31 | 2.31 | 0.84 | 0.17 | 0.13 | 4.34 | 4.95 |
| 38 | 0.06 | 0.00 | 0.01 | 0.00 | 0.02 | 0.00 | 0.04 | 0.02 |
| 45 | 0.81 | 0.38 | 8.81 | 2.79 | 5.30 | 1.74 | 27.83 | 3.59 |
| PM2.5 (mg/m3) | ||||||||
| 2 | 0.02 | 0.01 | 0.08 | 0.03 | 0.02 | 0.00 | 21.37 | 9.86 |
| 8 | 0.04 | 0.00 | 0.07 | 0.01 | 0.07 | 0.02 | 3.69 | 0.81 |
| 15 | 1.10 | 0.52 | 5.90 | 2.82 | 61.93 | 11.56 | 11.77 | 10.01 |
| 25 | 24.57 | 7.27 | 13.50 | 1.39 | 36.17 | 5.15 | 36.57 | 2.18 |
| 32 | 0.48 | 0.30 | 2.20 | 0.78 | 0.15 | 0.12 | 4.30 | 4.91 |
| 38 | 0.05 | 0.01 | 0.01 | 0.00 | 0.02 | 0.00 | 0.04 | 0.02 |
| 45 | 0.77 | 0.39 | 8.71 | 2.78 | 5.15 | 1.69 | 27.43 | 3.66 |


| Day | Biopolymer | Control | ||||||
| CS | FBPC | XG | C | |||||
| M | SD | M | SD | M | SD | M | SD | |
| Penetration Resistance (N) | ||||||||
| 2 | 20.26 | 13.59 | 17.56 | 11.93 | 8.63 | 5.05 | 3.63 | 8.87 |
| 8 | 19.23 | 5.62 | 18.88 | 5.82 | 6.67 | 6.37 | 3.58 | 4.31 |
| 15 | 2.11 | 1.36 | 9.81 | 5.90 | 4.71 | 2.97 | 3.24 | 3.84 |
| 25 | 2.84 | 0.98 | 8.98 | 4.35 | 3.04 | 1.45 | 5.20 | 1.78 |
| 32 | 4.76 | 1.40 | 8.73 | 2.48 | 5.05 | 1.25 | 4.46 | 1.33 |
| 38 | 7.31 | 2.60 | 8.24 | 3.60 | 5.35 | 2.43 | 6.72 | 2.91 |
| 45 | 8.49 | 3.71 | 6.62 | 3.02 | 6.18 | 4.00 | 5.20 | 6.04 |
| Substances | C (%) | AR (L/m2) | Test Field | Dur. | Conclusion | Note | Ref |
|---|---|---|---|---|---|---|---|
| Dust Fygther (pulp proc. by-product) | 25.0 | 0.8 | Soil: Tailings Site: TSF Size: 2.5 × 16 m2 | 4 m |
| a, b, c, e | [55] |
| Entac (pulp proc. by-product) | 20.0 | 1.4 | a, b, d | [55] | |||
| EcoAnchor (acrylic polymer) | 11.0 | 10.0 | a, b, c | [55] | |||
| Soil Sement (acrylic polymer) | 10.0 | 1.0 | a, b, c | [55] | |||
| Tall oil pitch | 20.0 | 2.0 | Soil: Sandy loam Size: 16 × 16 m2 | 14 m |
| c | [56] |
| 17.0 | 2.0 | c | [56] | ||||
| 14.0 | 2.0 | c | [56] | ||||
| Chicory vinasses | 10.0 | 1.5 | Soil: SP Size: 0.4 × 0.7 m2 | 1 m |
| c, e | [47] |
| Corn steep liquor | 5.0 | 0.8 | c, e | [47] | |||
| Decantation syrup | 6.0 | 1.0 | c, e | [47] | |||
| Palatinose molasses | 6.0 | 1.0 | c, e | [47] | |||
| Poloxamer | 5.6 | N/A | Soil: Tailings Site: TSF beach Size: N/A | 2 w |
| c, e | [54] |
| Poloxamer | 5.6 | 18.5 | Soil: Tailings Site: TSF slope Size: 36 × 6 m2 | c, e | [54] | ||
| Starch + polyacrylamide (10:1) | 0.7, 1.0, 1.3 | 5 × 0.67 kg/m2 | Soil: Loess Size: N/A | 1 m |
| c, d, e | [57] |
References
- Neitlich, P.N.; Berryman, S.; Geiser, L.H.; Mines, A.; Shiel, A.E. Impacts on tundra vegetation from heavy metal-enriched fugitive dust on National Park Service lands along the Red Dog Mine haul road, Alaska. PLoS ONE 2022, 17, e0269801. [Google Scholar] [CrossRef] [PubMed]
- Ekpa, I.D.; Laniyan, D.G.; Agbor, C.N.; Ben, U.C.; Okon, J.E. Effect of air pollution from quarry activities on agriculture and plant biodiversity in South-Eastern Nigeria. Res. Sq. 2022. [Google Scholar] [CrossRef]
- Noble, T.L.; Parbhakar-Fox, A.; Berry, R.F.; Lottermoser, B. Mineral dust emissions at metalliferous mine sites. In Environmental Indicators in Metal Mining; Lottermoser, B., Ed.; Springer International Publishing: Cham, Switzerland, 2016; pp. 281–306. ISBN 978-3-319-42729-4. [Google Scholar]
- Entwistle, J.A.; Hursthouse, A.S.; Marinho Reis, P.A.; Stewart, A.G. Metalliferous mine dust: Human health impacts and the potential determinants of disease in mining communities. Curr. Pollut. Rep. 2019, 5, 67–83. [Google Scholar] [CrossRef] [Green Version]
- Cecala, A.B.; O’Brien, A.D.; Schall, J.; Colinet, J.F.; Franta, R.J.; Schultz, M.J.; Haas, E.J.; Robinson, J.E.; Patts, J.; Holen, B.M.; et al. Dust Control Handbook for Industrial Minerals Mining and Processing, 2nd ed.; U.S. Department of Health and Human Services, Public Health Service, Centers for Disease Control and Prevention, National Institute for Occupational Safety and Health: Pittsburgh, PA, USA, 2019.
- Iyaloo, S.; Kootbodien, T.; Naicker, N.; Mathee, A.; Kgalamono, S.; Wilson, K.; Rees, D. O3A.5 Environmental dust exposure from gold mine waste dumps and respiratory health effects in Johannesburg, South Africa. Occup. Environ. Med. 2019, 76, 22–23. [Google Scholar] [CrossRef]
- Zota, A.R.; Riederer, A.M.; Ettinger, A.S.; Schaider, L.A.; Shine, J.P.; Amarasiriwardena, C.J.; Wright, R.O.; Spengler, J.D. Associations between metals in residential environmental media and exposure biomarkers over time in infants living near a mining-impacted site. J. Expo. Sci. Environ. Epidemiol. 2016, 26, 510–519. [Google Scholar] [CrossRef] [PubMed] [Green Version]
- Boreland, F.; Lyle, D.M. Lead dust in Broken Hill homes: Effect of remediation on indoor lead levels. Environ. Res. 2006, 100, 276–283. [Google Scholar] [CrossRef]
- Barbieri, E.; Fontúrbel, F.E.; Herbas, C.; Barbieri, F.L.; Gardon, J. Indoor metallic pollution and children exposure in a mining city. Sci. Total Environ. 2014, 487, 13–19. [Google Scholar] [CrossRef]
- Thompson, R.J.; Visser, A.T. Selection, performance and economic evaluation of dust palliatives on surface mine haul roads. J. S. Afr. Inst. Min. Metall. 2007, 107, 435–450. [Google Scholar]
- du Plessis, J.J.; Jansen van Rensburg, L. Effectiveness of applying dust suppression palliatives on haul roads. J. Mine Vent. Soc. S. Afr. 2015, 69, 15–19. [Google Scholar]
- Clarke, B.; Otto, F.; Stuart-Smith, R.; Harrington, L. Extreme weather impacts of climate change: An attribution perspective. Environ. Res. Clim. 2022, 1, 12001. [Google Scholar] [CrossRef]
- IPCC. Climate Change 2022: Impacts, Adaption and Vulnerability: Contribution of Working Group II to the Sixth Assessment Report of the Intergovernmental Panel on Climate Change 2022; Cambridge University Press: Singapore, 2022. [Google Scholar] [CrossRef]
- OECD. Global Material Resources Outlook to 2060: Economic Drivers and Environmental Consequences; OECD Publishing: Paris, France, 2019; ISBN 9789264307445. [Google Scholar]
- Piechota, T.; van Ee, J.; Stave, K.; James, D. Potential Environmental Impacts of Dust Suppressants: “Avoiding Another Times Beach”; U.S. Environmental Protection Agency: Las Vegas, NV, USA, 2002.
- McTigue, E.; Zimmermann, J.H.; Duncan, B.; Bertelsen, L.; Gavrelis, N.; Deng, M. Research Findings: Data Collection on Toxicity of Dust Palliatives Used in Alaska; U.S. Environmental Protection Agency: Washington, DC, USA, 2016. Available online: https://cfpub.epa.gov/si/si_public_record_report.cfm?dirEntryId=328330&Lab=NERL (accessed on 11 June 2023).
- IEA—International Energy Agency. The Future of Petrochemicals; International Energy Agency: Paris, France, 2018; Available online: https://iea.blob.core.windows.net/assets/bee4ef3a-8876-4566-98cf-7a130c013805/The_Future_of_Petrochemicals.pdf (accessed on 11 June 2023).
- Dagliya, M.; Satyam, N.; Garg, A. Biopolymer based stabilization of Indian desert soil against wind-induced erosion. Acta Geophys. 2023, 71, 503–516. [Google Scholar] [CrossRef]
- Lemboye, K.; Almajed, A.; Alnuaim, A.; Arab, M.; Alshibli, K. Improving sand wind erosion resistance using renewable agriculturally derived biopolymers. Aeolian Res. 2021, 49, 100663. [Google Scholar] [CrossRef]
- Owji, R.; Habibagahi, G.; Nikooee, E.; Afzali, S.F. Wind erosion control using carboxymethyl cellulose: From sand bombardment performance to microfabric analysis. Aeolian Res. 2021, 50, 100696. [Google Scholar] [CrossRef]
- Toufigh, V.; Ghassemi, P. Control and stabilization of fugitive dust: Using eco-friendly and sustainable materials. Int. J. Geomech. 2020, 20, 4020140. [Google Scholar] [CrossRef]
- Phillips, G.O.; Edwards, C.A.; Garcia, A.L.; Williams, P.A.; Dickinson, E.; Armisén, R.; Taggart, P.; Mitchell, J.R.; Haug, I.J.; Draget, K.I.; et al. Handbook of Hydrocolloids, 2nd ed.; CRC/Woodhead: Boca Raton, FL, USA; Oxford, UK, 2009; ISBN 978-1-84569-414-2. [Google Scholar]
- Chaturvedi, S.; Kulshrestha, S.; Bhardwaj, K.; Jangir, R. A review on properties and applications of xanthan gum. In Microbial Polymers; Vaishnav, A., Choudhary, D.K., Eds.; Springer: Singapore, 2021; pp. 87–107. ISBN 978-981-16-0044-9. [Google Scholar]
- Ding, X.; Xu, G.; Zhang, Y.; Luo, Z.; Deng, J. Reduction of airborne bauxite residue dust pollution by enhancing the structural stability via the application of non-traditional stabilizers. Water Air Soil Pollut. 2021, 232, 1–20. [Google Scholar] [CrossRef]
- Ding, X.; Luo, Z.; Xu, G.; Chang, P. Characterization of red sand dust pollution control performance via static and dynamic laboratorial experiments when applying polymer stabilizers. Environ. Sci. Pollut. Res. Int. 2021, 28, 34937–34952. [Google Scholar] [CrossRef]
- Almajed, A.; Lemboye, K.; Arab, M.G.; Alnuaim, A. Mitigating wind erosion of sand using biopolymer-assisted EICP technique. Soils Found. 2020, 60, 356–371. [Google Scholar] [CrossRef]
- Ding, X.; Xu, G.; Zhou, W.; Kuruppu, M. Effect of synthetic and natural polymers on reducing bauxite residue dust pollution. Environ. Technol. 2018, 41, 1–10. [Google Scholar] [CrossRef]
- Ding, X.; Xu, G.; Kizil, M.; Zhou, W.; Guo, X. Lignosulfonate treating bauxite residue dust pollution: Enhancement of mechanical properties and wind erosion behavior. Water Air Soil Pollut. 2018, 229, 1084. [Google Scholar] [CrossRef]
- Hu, Y.; Shi, L.; Shan, Z.; Dai, R.; Chen, H. Efficient removal of atmospheric dust by a suppressant made of potato starch, polyacrylic acid and gelatin. Environ. Chem. Lett. 2020, 18, 1701–1711. [Google Scholar] [CrossRef]
- Chen, R.; Lee, I.; Zhang, L. Biopolymer stabilization of mine tailings for dust control. J. Geotech. Geoenviron. Eng. 2014, 141, 4014100. [Google Scholar] [CrossRef]
- Tran, T.P.A.; Cho, G.-C.; Ilhan, C. Water retention characteristics of biopolymer hydrogel-treated sand-clay mixture. HueUni-JESE 2020, 129, 5–17. [Google Scholar] [CrossRef]
- Katra, I. Comparison of diverse dust control products in wind-induced dust emission from unpaved roads. Appl. Sci. 2019, 9, 5204. [Google Scholar] [CrossRef] [Green Version]
- Kavazanjian, E.; Iglesias, E.; Karatas, I. Biopolymer soil stabilization for wind erosion control. In Proceedings of the 17th International Conference on Soil Mechanics and Geotechnical Engineering, Alexandria, Egypt, 5–9 October 2009; Hamza, M., Shahien, M., El-Mossallamy, Y., Eds.; IOS Press: Amsterdam, The Netherlands, 2009. ISBN 978-1-60750-031-5. [Google Scholar]
- Ayeldeen, M.; Negm, A.; El Sawwaf, M.; Gädda, T. Laboratory study of using biopolymer to reduce wind erosion. Int. J. Geo-Eng. 2017, 12, 228–240. [Google Scholar] [CrossRef]
- Chang, I.; Lee, M.; Tran, A.T.P.; Lee, S.; Kwon, Y.-M.; Im, J.; Cho, G.-C. Review on biopolymer-based soil treatment (BPST) technology in geotechnical engineering practices. Transportation Geotechnics. Transp. Geotech. 2020, 24, 100385. [Google Scholar] [CrossRef]
- Wade, E.; Zowada, R.; Foudazi, R. Alginate and guar gum spray application for improving soil aggregation and soil crust integrity. Carbohydr. Polym. 2021, 2, 100114. [Google Scholar] [CrossRef]
- Sieger, J.L.; Lottermoser, B.G.; Freer, J. Evaluation of protein and polysaccharide biopolymers as dust suppressants on mine soils: Laboratory experiments. Appl. Sci. 2023, 13, 1010. [Google Scholar] [CrossRef]
- Sieger, J.L.; Lottermoser, B.G.; Freer, J. Effectiveness of protein and polysaccharide biopolymers as dust suppressants on mine soils: Results from wind tunnel and penetrometer testing. Appl. Sci. 2023, 13, 4158. [Google Scholar] [CrossRef]
- DIN EN ISO 17892-4; Geotechnical Investigation and Testing—Laboratory Testing of Soil—Part 4: Determination of Particle Size Distribution. German Institute for Standardization: Berlin, Germany, 2017.
- Google Maps. Tagebau Inden Open Pit Mine; Google Maps: Mountain View, CA, USA, 2022. [Google Scholar]
- AST D2487-17; Standard Practice for Classification of Soils for Engineering Purposes (Unified Soil Classification System). ASTM International: West Conshohocken, PA, USA, 2018.
- DIN EN ISO 11508:2017; Soil Quality—Determination of Particle Density. German Institute for Standardization: Berlin, Germany, 2018.
- DIN EN 15933:2012-11; Sludge, Treated Biowaste and Soil—Determination of pH. German Institute for Standardization: Berlin, Germany, 2012.
- ISO 10625; Equipment for Crop Protection—Sprayer Nozzles—Colour Coding for Identification. ISO: Geneva, Switzerland, 2018.
- WHO. WHO Global Air Quality Guidelines: Particulate Matter (PM2.5 and PM10), Ozone, Nitrogen Dioxide, Sulfur Dioxide and Carbon Monoxide; WHO European Centre for Environment and Health: Bonn, Germany, 2021; ISBN 9789240034228. [Google Scholar]
- ISO 12103-1; Road Vehicles—Test Contaminants for Filter Evaluation: Part 1: Arizona Test Dust. ISO: Geneva, Switzerland, 2023.
- Freer, J.; Lübeck, M.; Sieger, J.L.; Lottermoser, B.G.; Braun, M. Effectiveness of food processing by-products as dust suppressants for exposed mine soils: Results from laboratory experiments and field trials. Appl. Sci. 2022, 12, 11551. [Google Scholar] [CrossRef]
- van Pelt, R.S.; Zobeck, T.M. Portable wind tunnels for field testing of soils and natural surfaces. In Wind Tunnel Designs and Their Diverse Engineering Applications; Ahmed, N., Ed.; InTech: London, UK, 2013; ISBN 978-953-51-1047-7. [Google Scholar]
- Gotosa, J.; Nyamadzawo, G.; Mtetwa, T.; Kanda, A.; Dudu, V. Comparative road dust suppression capacity of molasses stillage and water on gravel road in Zimbabwe. AIR 2015, 3, 198–208. [Google Scholar] [CrossRef] [Green Version]
- Gillies, J.A.; Watson, J.G.; Rogers, C.F.; DuBois, D.; Chow, J.C.; Langston, R.; Sweet, J. Long-term efficiencies of dust suppressants to reduce PM10 emissions from unpaved roads. J. Air Waste Manag. Assoc. 1999, 49, 3–16. [Google Scholar] [CrossRef] [PubMed]
- Parsakhoo, A.; Hosseini, S.A.; Lotfalian, M.; Mohammadi, J.; Salarijazi, M. Effects of molasses, polyacrylamide and bentonite on dust control in forest roads. J. For. Sci. 2020, 66, 218–225. [Google Scholar] [CrossRef]
- Omane, D.; Liu, W.V.; Pourrahimian, Y. Comparison of chemical suppressants under different atmospheric temperatures for the control of fugitive dust emission on mine hauls roads. Atmos. Pollut. Res. 2018, 9, 561–568. [Google Scholar] [CrossRef]
- Edvardsson, K.; Gustafsson, A.; Magnusson, R. Dust suppressants efficiency study: In situ measurements of dust generation on gravel roads. Int. J. Pavement Eng. 2012, 13, 11–31. [Google Scholar] [CrossRef]
- Park, J.; Kim, K.; Lee, T.; Kim, M. Tailings storage facilities (TSFs) dust control using biocompatible polymers. Min. Metall. Explor. 2019, 36, 785–795. [Google Scholar] [CrossRef]
- Preston, C.A.; McKenna Neuman, C.; Boulton, J.W. A wind tunnel and field evaluation of various dust suppressants. J. Air Waste Manag. Assoc. 2020, 70, 915–931. [Google Scholar] [CrossRef] [PubMed]
- Kavouras, I.G.; Etyemezian, V.; Nikolich, G.; Gillies, J.; Sweeney, M.; Young, M.; Shafer, D. A new technique for characterizing the efficacy of fugitive dust suppressants. J. Air Waste Manag. Assoc. 2009, 59, 603–612. [Google Scholar] [CrossRef]
- Shen, Z.; Ao, Z.; Wang, Z.; Yang, Y. Study on crust-shaped dust suppressant in non-disturbance area of open-pit coal mine—A case study. Int. J. Environ. Res. Public Health 2023, 20, 934. [Google Scholar] [CrossRef]
- Jones, D. Guidelines for the Selection, Specification and Application of Chemical Dust Control and Stabilization Treatments on Unpaved Roads; University of California Pavement Research Center: Davis, CA, USA, 2017; Available online: http://www.ucprc.ucdavis.edu/PDF/UCPRC-GL-2017-03.pdf (accessed on 11 June 2023).
- Fatehi, H.; Ong, D.E.L.; Yu, J.; Chang, I. Biopolymers as green binders for soil improvement in geotechnical applications: A review. Geosci. J. 2021, 11, 291. [Google Scholar] [CrossRef]
- Mendonça, A.; Morais, P.V.; Pires, A.C.; Chung, A.P.; Oliveira, P.V. A Review on the importance of microbial biopolymers such as xanthan gum to improve soil properties. Appl. Sci. 2021, 11, 170. [Google Scholar] [CrossRef]
- Bacon, S.N.; McDonald, E.V.; Amit, R.; Enzel, Y.; Crouvi, O. Total suspended particulate matter emissions at high friction velocities from desert landforms. J. Geophys. Res. 2011, 116, 1–17. [Google Scholar] [CrossRef]
- King, J.; Etyemezian, V.; Sweeney, M.; Buck, B.J.; Nikolich, G. Dust emission variability at the Salton Sea, California, USA. Aeolian Res. 2011, 3, 67–79. [Google Scholar] [CrossRef]
- Chen, R.; Ding, X.; Ramey, D.; Lee, I.; Zhang, L. Experimental and numerical investigation into surface strength of mine tailings after biopolymer stabilization. Acta Geotech. 2016, 11, 1075–1085. [Google Scholar] [CrossRef]
- Thomas, A.D.; Dougill, A.J. Spatial and temporal distribution of cyanobacterial soil crusts in the Kalahari: Implications for soil surface properties. Geomorphology 2007, 85, 17–29. [Google Scholar] [CrossRef]
- Pérez, F.L. Microbiotic crusts in the high equatorial Andes, and their influence on paramo soils. CATENA 1997, 31, 173–198. [Google Scholar] [CrossRef]
- Zaady, E.; Ben-David, E.A.; Sher, Y.; Tzirkin, R.; Nejidat, A. Inferring biological soil crust successional stage using combined PLFA, DGGE, physical and biophysiological analyses. Soil Biol. Biochem. 2010, 42, 842–849. [Google Scholar] [CrossRef]
- Li, J.; Okin, G.S.; Herrick, J.E.; Belnap, J.; Munson, S.M.; Miller, M.E. A simple method to estimate threshold friction velocity of wind erosion in the field. Geophys. Res. Lett. 2010, 37, 1–5. [Google Scholar] [CrossRef]
- Houser, C.A.; Nickling, W.G. The factors influencing the abrasion efficiency of saltating grains on a clay-crusted playa. Earth Surf. Process. Landf. 2001, 26, 491–505. [Google Scholar] [CrossRef]
- Swet, N.; Katra, I. Reduction in soil aggregation in response to dust emission processes. Geomorphology 2016, 268, 177–183. [Google Scholar] [CrossRef]
- Sweeney, M.; Etyemezian, V.; Macpherson, T.; Nickling, W.; Gillies, J.; Nikolich, G.; McDonald, E. Comparison of PI-SWERL with dust emission measurements from a straight-line field wind tunnel. J. Geophys. Res. 2008, 113, 1–12. [Google Scholar] [CrossRef]
- Jang, J. A review of the application of biopolymers on geotechnical engineering and the strengthening mechanisms between typical biopolymers and soils. Adv. Mater. Sci. Eng. 2020, 2020, 1–20. [Google Scholar] [CrossRef] [Green Version]
- Heusala, H.; Sinkko, T.; Sözer, N.; Hytönen, E.; Mogensen, L.; Knudsen, M.T. Carbon footprint and land use of oat and faba bean protein concentrates using a life cycle assessment approach. J. Clean. Prod. 2020, 242, 118376. [Google Scholar] [CrossRef]
- Steevens, J.; Suedel, B.; Gibson, A.; Kennedy, A.; Backburn, W.; Splichal, D.; Pierce, T. Environmental Evaluation of Dust Stabilizer Products. Available online: https://apps.dtic.mil/sti/pdfs/ADA471771.pdf (accessed on 11 June 2023).


| Parameter | Unit | Test Fields | Method | |||||
|---|---|---|---|---|---|---|---|---|
| C | FBPC | CS | XG | M | SD | |||
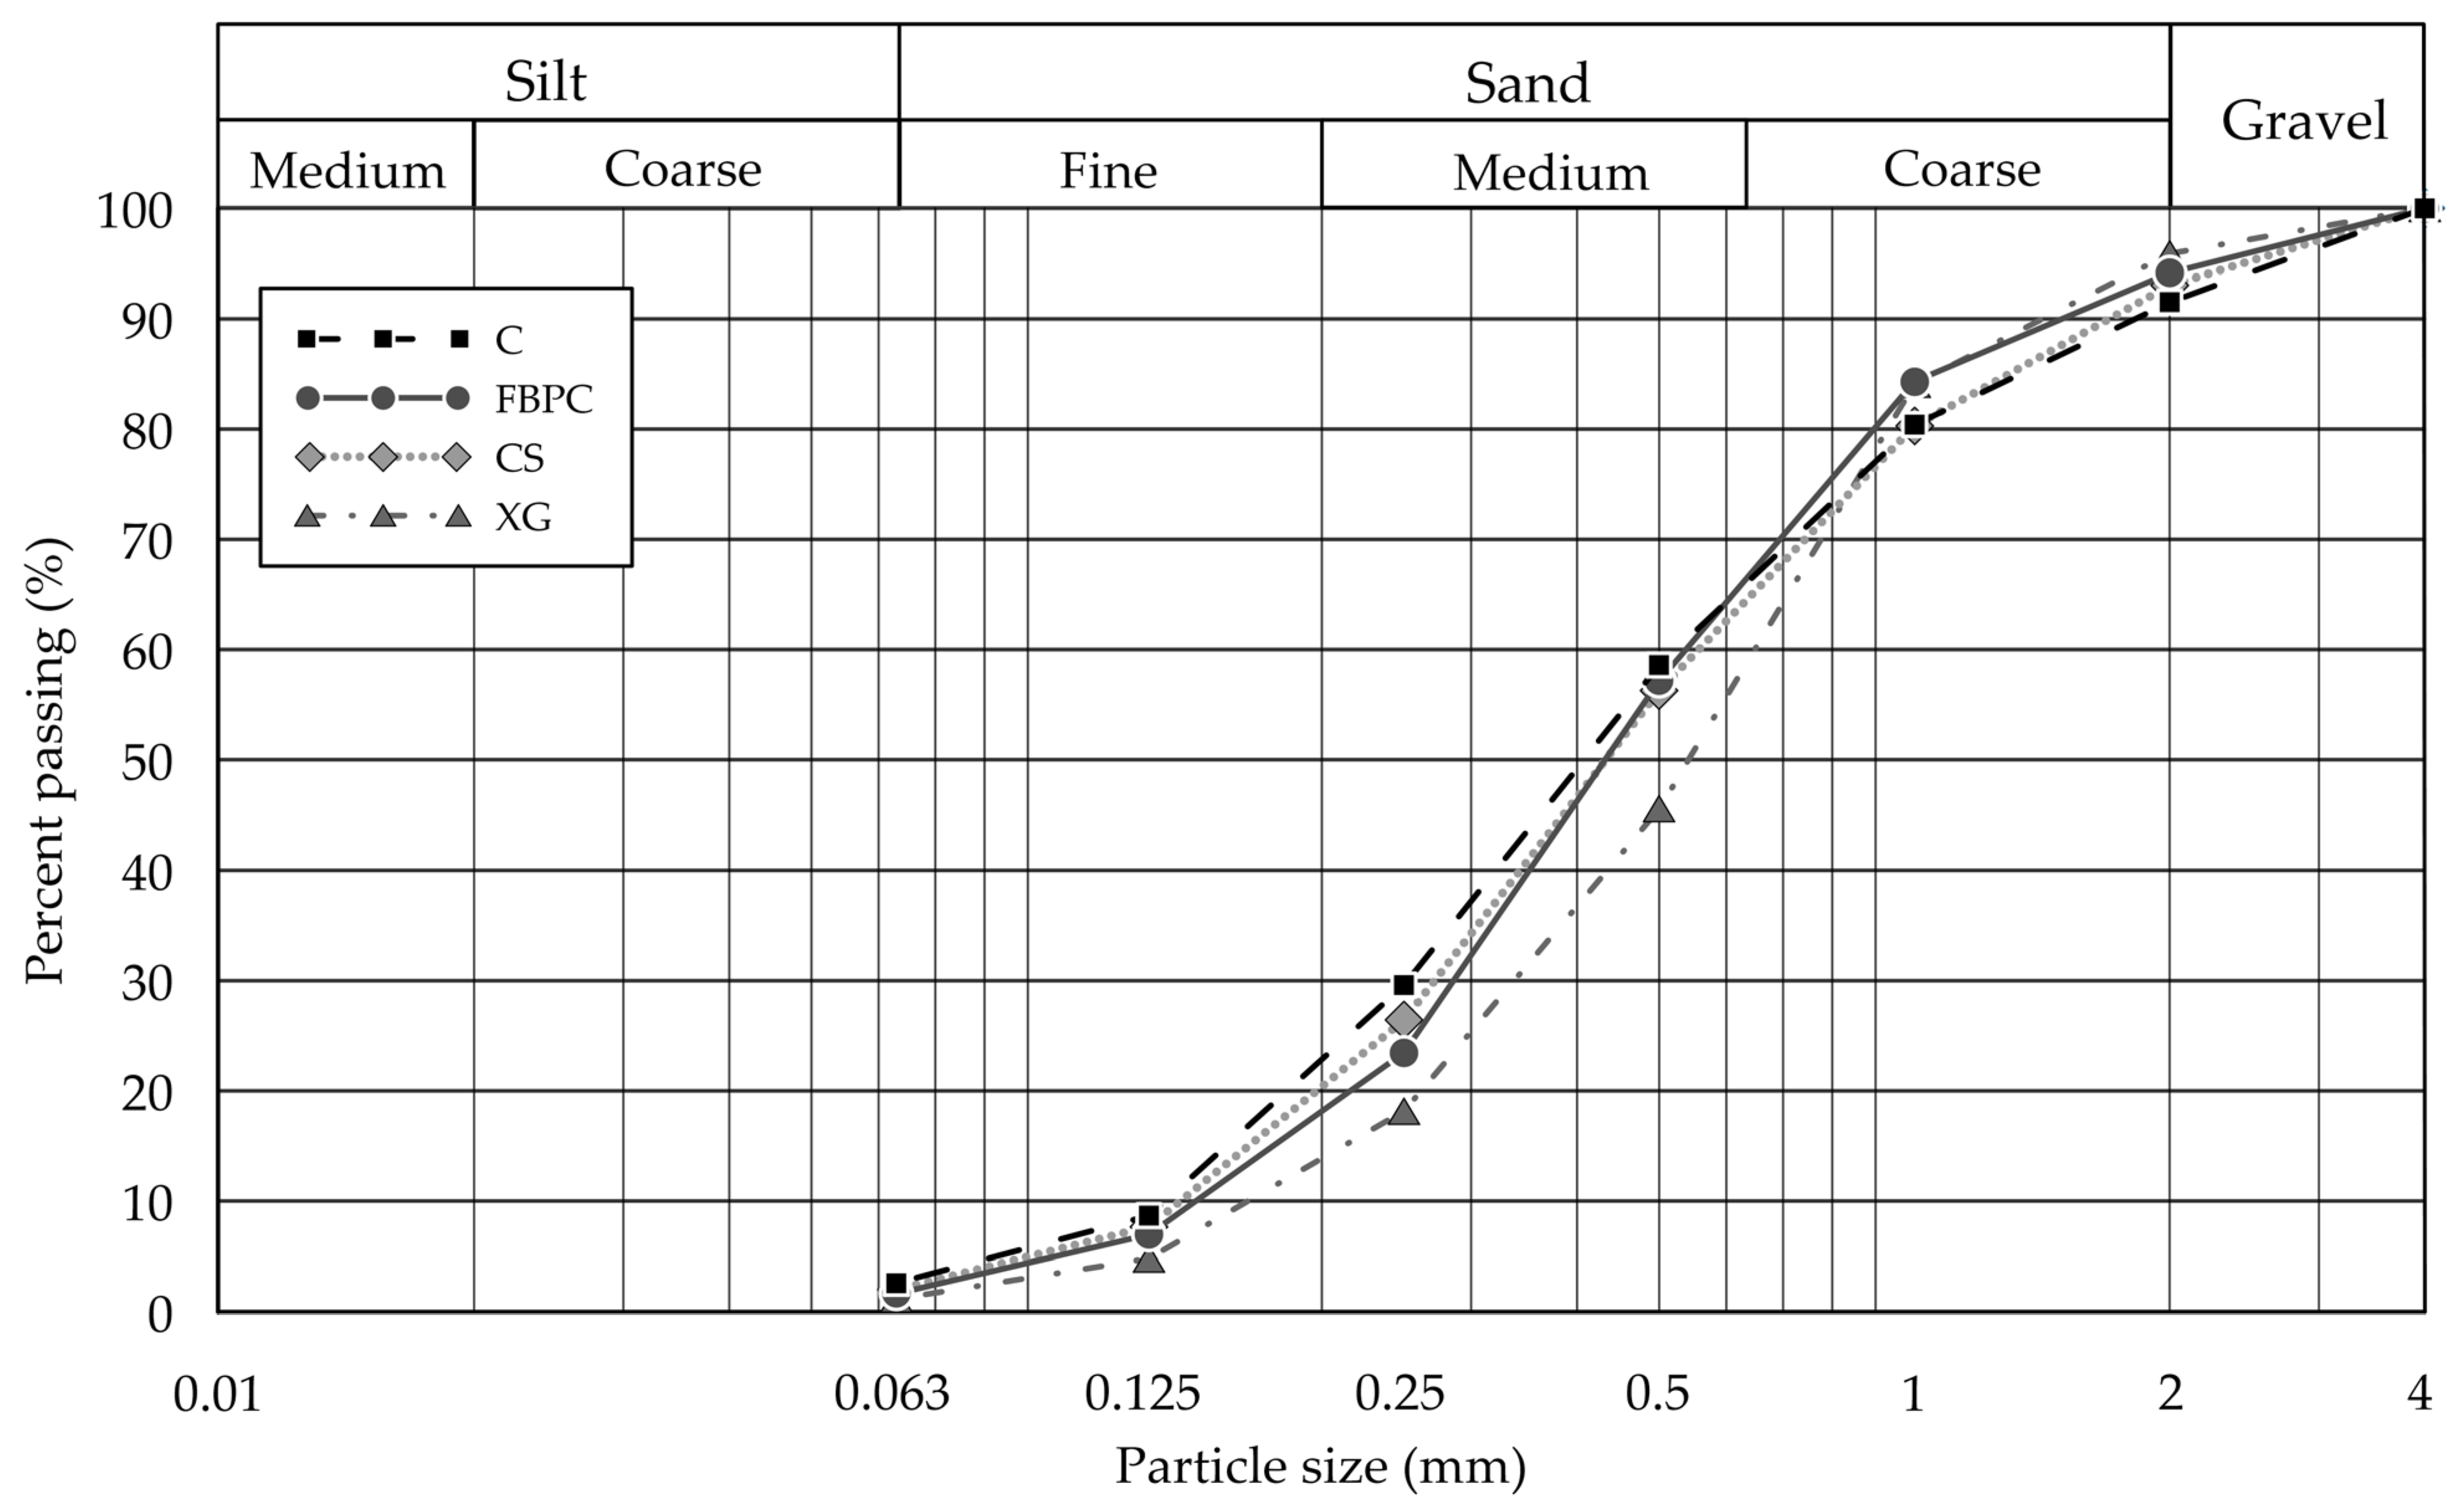
| D60 | mm | 0.52 | 0.54 | 0.56 | 0.64 | 0.57 | 0.05 | DIN EN ISO 17892-4 [39] |
| D50 | mm | 0.41 | 0.44 | 0.44 | 0.55 | 0.46 | 0.05 | DIN EN ISO 17892-4 [39] |
| D30 | mm | 0.25 | 0.29 | 0.28 | 0.33 | 0.29 | 0.03 | DIN EN ISO 17892-4 [39] |
| D10 | mm | 0.13 | 0.14 | 0.13 | 0.18 | 0.14 | 0.02 | DIN EN ISO 17892-4 [39] |
| Cu | - | 4.16 | 3.86 | 4.31 | 3.56 | 3.97 | 0.29 | DIN EN ISO 17892-4 [39] |
| Cc | - | 0.96 | 1.11 | 1.08 | 0.95 | 1.02 | 0.07 | DIN EN ISO 17892-4 [39] |
| USCS | - | SP | ASTM D-2487 [41] | |||||
| Specific gravity | g/cm3 | 2.66 | DIN EN ISO 11508:2018-04 [42] | |||||
| pH value | 4.60 | DIN EN 15933:2012-11 [43] | ||||||
| Soil colour | Munsell | 1.3Y 6.5/1.7 | ||||||
| Oxides | Content (wt%) |
|---|---|
| SiO2 | 95.44 |
| Al2O3 | 2.17 |
| K2O | 1.16 |
| Fe2O3 | 0.18 |
| TiO2 | 0.10 |
| Na2O | 0.07 |
| SO3 | 0.05 |
| CaO | 0.04 |
| BaO | 0.03 |
| MgO | 0.03 |
| P2O5 | 0.02 |
| Parameter | Value | Unit |
|---|---|---|
| Field sprayer model | Holder IS 1000 | - |
| Tank volume | 1000 | L |
| Spraying width | 15 | m |
| Driving speed | 1.1 | km/h |
| Pump rate | 69 | L/min |
| Pump pressure | 3.5 | bar |
| Application rate per pass | 0.25 | L/m2 |
| Nozzle size (ISO 10625) [44] | 05 | - |
| Nozzle count | 18 | - |
Disclaimer/Publisher’s Note: The statements, opinions and data contained in all publications are solely those of the individual author(s) and contributor(s) and not of MDPI and/or the editor(s). MDPI and/or the editor(s) disclaim responsibility for any injury to people or property resulting from any ideas, methods, instructions or products referred to in the content. |
© 2023 by the authors. Licensee MDPI, Basel, Switzerland. This article is an open access article distributed under the terms and conditions of the Creative Commons Attribution (CC BY) license (https://creativecommons.org/licenses/by/4.0/).
Share and Cite
Sieger, J.L.; Lottermoser, B.G.; Freer, J. Effectiveness of Protein and Polysaccharide Biopolymers as Dust Suppressants on Mine Soils: Large-Scale Field Trials. Mining 2023, 3, 428-462. https://doi.org/10.3390/mining3030026
Sieger JL, Lottermoser BG, Freer J. Effectiveness of Protein and Polysaccharide Biopolymers as Dust Suppressants on Mine Soils: Large-Scale Field Trials. Mining. 2023; 3(3):428-462. https://doi.org/10.3390/mining3030026
Chicago/Turabian StyleSieger, Johannes Lukas, Bernd Georg Lottermoser, and Justus Freer. 2023. "Effectiveness of Protein and Polysaccharide Biopolymers as Dust Suppressants on Mine Soils: Large-Scale Field Trials" Mining 3, no. 3: 428-462. https://doi.org/10.3390/mining3030026